Intermediate regime during finger formation: from instabilities to fingers
1 EXS/5-3
Interactions between MHD instabilities in the wall-stabilized high-β plasmas
G. Matsunaga, N. Aiba, K. Shinohara, Y. Sakamoto, M. Takechi, T. Suzuki, N. Asakura,A. Isayama, N. Oyama, M. Yoshida, K. Kamiya, H. Urano, T. Nakano, Y. Kamada andthe JT-60 TeamJapan Atomic Energy Agency, Naka 311-0193, JapanE-mail: [email protected]
Abstract. In the JT-60U wall-stabilized high-βN plasmas, interactions between MHD instabilities havebeen observed. It is observed that an energetic particle driven wall mode (EWM) triggers an edge local-ized mode (ELM). When the EWM appears, type-I ELM crashes are synchronized with EWM bursts.The EWM-triggered ELMs have a higher frequency and less energy release than those of usual type-IELMs. This interaction mainly occurs when the EWM with a large amplitude appears. In the SOL re-gion, several measurements indicate ion losses induced by the EWM. Abrupt ion losses through the edgecan increase as local pressure gradient at the pedestal that determines the edge stability. Moreover, an-other interaction that an EWM-triggered ELM excites marginal resistive wall mode (RWM) is observed.Just after the EWM-triggered ELM, ann = 1 distortion appears and decays soon. It is considered thatan impact of the induced ELM can excite the marginally stable RWM.
1. Introduction
Toward sustainment of burning high-βN plasmas, the understanding of MHD evens in thehigh-βN plasmas is important. Paticularly, the high-β plasmas above the no-wall limit, wherethe resistive wall mode (RWM) limits the achievableβN, have been exploited based on re-searches of stabilization mechanisms of the RWM. Note that since in the high-β plasma abovethe no-wall limit the ideal mode is stabilized by the conducting wall, the plasma is the so-called “wall-stabilized high-βN plasmas.” The MHD events in this region determine stability,eventually performance of a reactor. Finally, it is preferable to control any MHD event for thesteady state high-βN plasmas. In the JT-60U wall-stabilized high-βN plasmas, the interactionsbetween MHD instabilities have been observed. Namely, an energetic particle driven modenamed “Energetic particle driven wall mode (EWM)” triggers an edge localized mode (ELM);EWM-triggered ELM. The EWM-triggered ELMs have a higher repetition frequency and lessenergy release compared with usual type-I ELMs. This phenomenon may contribute ELM mit-igation control. The details of the EWM have been reported [1, 2]. The EWM seems to be“fishbone-like” burst with frequency chirping down in a few milliseconds, whose time scalecan not be explained by thermal plasma dispersion. Its initial frequency is close to the preces-sion frequency of the trapped energetic ions from the perpendicularly injected neutral beams(PERP-NBs). From the results, the EWM is found to be driven by the trapped energetic ions.Similar instability is also observed in the high-βN plasma on DIII-D [3]. Since the EWM cansometimes induce the RWM despite enough plasma rotation. In this paper, we focus on theEWM-triggered ELM and report the details of this phenomenon.
2. Observation of EWM-triggered ELM
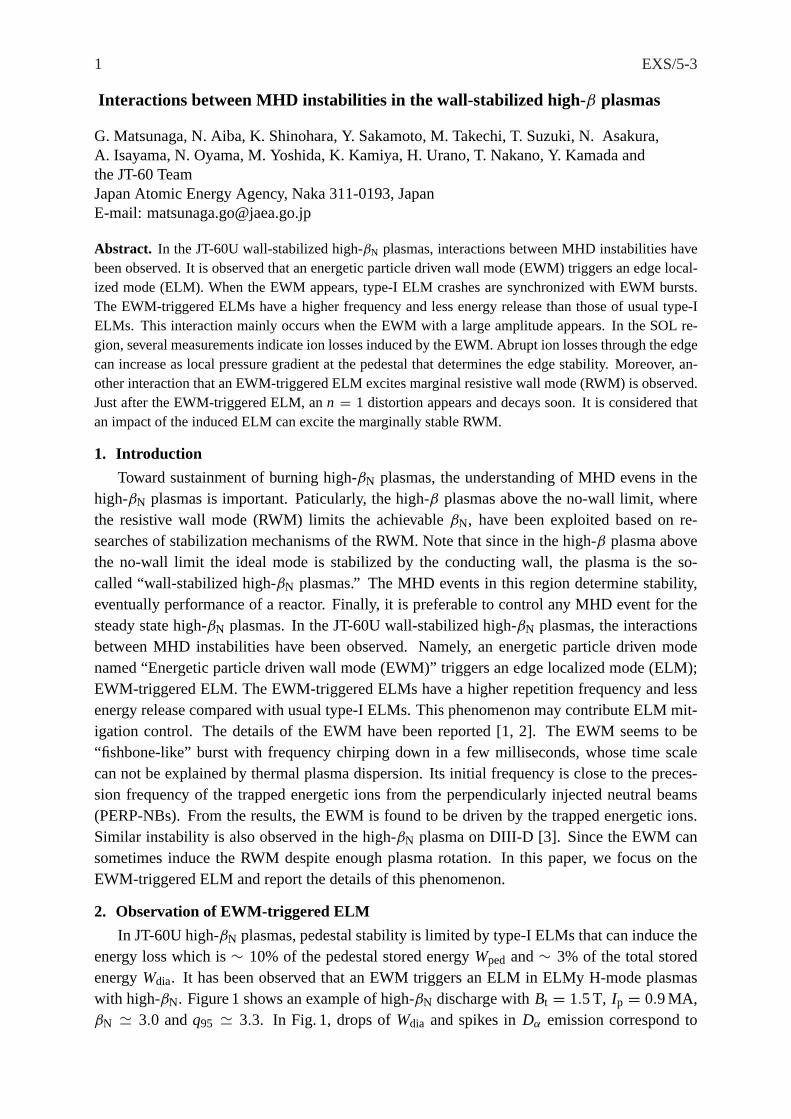
In JT-60U high-βN plasmas, pedestal stability is limited by type-I ELMs that can induce theenergy loss which is∼ 10% of the pedestal stored energyWped and∼ 3% of the total storedenergyWdia. It has been observed that an EWM triggers an ELM in ELMy H-mode plasmaswith high-βN. Figure 1 shows an example of high-βN discharge withBt = 1.5 T, Ip = 0.9 MA,βN ' 3.0 andq95 ' 3.3. In Fig. 1, drops ofWdia and spikes inDα emission correspond to
2 EXS/5-3
1.7
1.8
1.9
0
10
Wdia
[kJ]
PN
B[M
W]
-0.5
0
0.5
δBrn
=1[G
]
0
1
2
0
100
200
5.8 5.9 6.0 6.1
Dαd
iv[a
.u.] fE
LM
[Hz]
time[s]
x1020
PNB
NNB
E049825
EWMs
(a)
(b)
(c)
Fig. 1: Observation of EWM-triggered ELM in thewall-stabilized high-βN plasma. (a) stored energy, NBpower, (b) magnetic fluctuation, (c)Dα emission at di-vertor region and ELM repetition frequency.
Type-I ELM
EWM-triggered ELM
0
5
10
15
0 50 100 150 200
∆Wd
ia/ W
ped[%
]
ELM frequency[Hz]
Fig. 2: ELM repetition frequency versus energy lossnormalized byWpedof each ELM crash. Red circles andblue squares correspond to Type-I and ELM-triggeredELM, respectively.
ELM crashes. Bursts in the magnetic fluctuation in Fig. 1(b) correspond to EWMs. Duringthe appearance of the EWMs att = 5.94 s (highlighted), the ELM behavior is changed. Inthis phase, each ELM is synchronized with the EWM, suggesting the EWM burst can triggerthe ELM. The repetition frequency of the ELM, which is defined as the inverse of the ELMinterval, becomes twice or more higher compared with the no-EWM phase. At the same time,the stored energy drop1Wdia due to an ELM crash became smaller.
Figure 2 shows the ELM frequency versus the normalized ELM energy loss for the type-IELM (red circles) and the EWM-triggered ELM (blue squares). The energy losses are normal-ized by the stored energy in the pedestal region;Wped= 3
2(npede Tped
e + npedi Tped
i )kBVp, wherekB andVp are the Boltzmann constant and the plasma volume; the subscript ’ped’ denotes thevalues at the pedestal top. During no EWM phase, the normalized energy loss1Wdia/Wped is≤ 15%. Meanwhile, during the EWM phase, it becomes smaller, thus,1Wdia/Wped ≤ 8%.These behaviors are similar to ELM mitigation. This phenomenon is almost certainly observedwhen the EWM with a large amplitude appears, as is discussed in the following section.
3. Comparison of Type-I and EWM-triggered ELMs
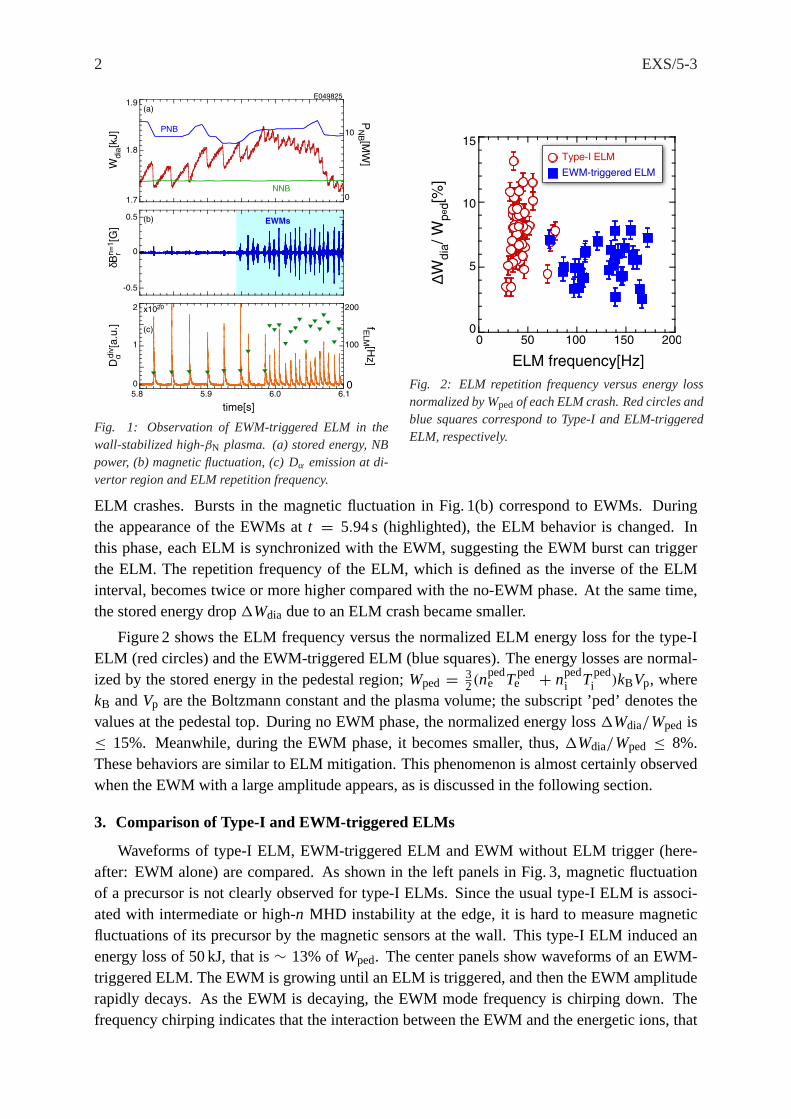
Waveforms of type-I ELM, EWM-triggered ELM and EWM without ELM trigger (here-after: EWM alone) are compared. As shown in the left panels in Fig. 3, magnetic fluctuationof a precursor is not clearly observed for type-I ELMs. Since the usual type-I ELM is associ-ated with intermediate or high-n MHD instability at the edge, it is hard to measure magneticfluctuations of its precursor by the magnetic sensors at the wall. This type-I ELM induced anenergy loss of 50 kJ, that is∼ 13% of Wped. The center panels show waveforms of an EWM-triggered ELM. The EWM is growing until an ELM is triggered, and then the EWM amplituderapidly decays. As the EWM is decaying, the EWM mode frequency is chirping down. Thefrequency chirping indicates that the interaction between the EWM and the energetic ions, that
3 EXS/5-3
-0.2
0.0
0.2
δB[G
]
0
10
20
I sx [au]
0.0
1.0
2.0
Dαd
iv[a
u]
0 2 4 6 8 10
(t-t0) [ms]
1.75
1.80
1.85
Wdia [M
J]
E049825/ t0=5.815s E049825/ t0=5.955s E049825/ t0=5.962s
1.70
Type I ELM EWM triggered ELM EWM alone
∆Wdia~50kJ
∆Wdia~30kJ
r/a>0.55
r/a>0.62
r/a>0.70
r/a>0.78r/a>0.87
4
6 fmode [k
Hz]
0 2 4 6 8 10
(t-t0) [ms]0 2 4 6 8 10
(t-t0) [ms]
Fig. 3: Comparison among waveforms of (Left) Type-I ELM, (Center) EWM-triggered ELM and (Right) EWMalone. From the top, magnetic fluctuations with mode frequencies, soft X-ray emissions,Dα emissions at divertorregion and the total stored energies.
is, redistribution and/or loss of the energetic ions in both velocity space and real space. SoftX-ray emissions indicates crashes at the pedestal region due to the EWM-triggered ELM. ThisEWM-triggered ELM induces an energy loss of 30 kJ, that is∼ 5% of Wped less than that ofthe type-I ELM. After the crash, the EWM mode amplitude decays quickly compared with theEWM alone, suggesting that the driving source of the EWM, that is, energetic ions, is lost by thiscrash. The right panels show waveforms of EWM alone. The EWM grows and decays, which isthought to be determined by the competition between driving and damping mechanisms relatedto energetic ion confinement. AlthoughDα emission at the divertor did not clearly change, anincrease ofDα emission in the sight line to the plasma top is observed as mentioned in thefollowing section.
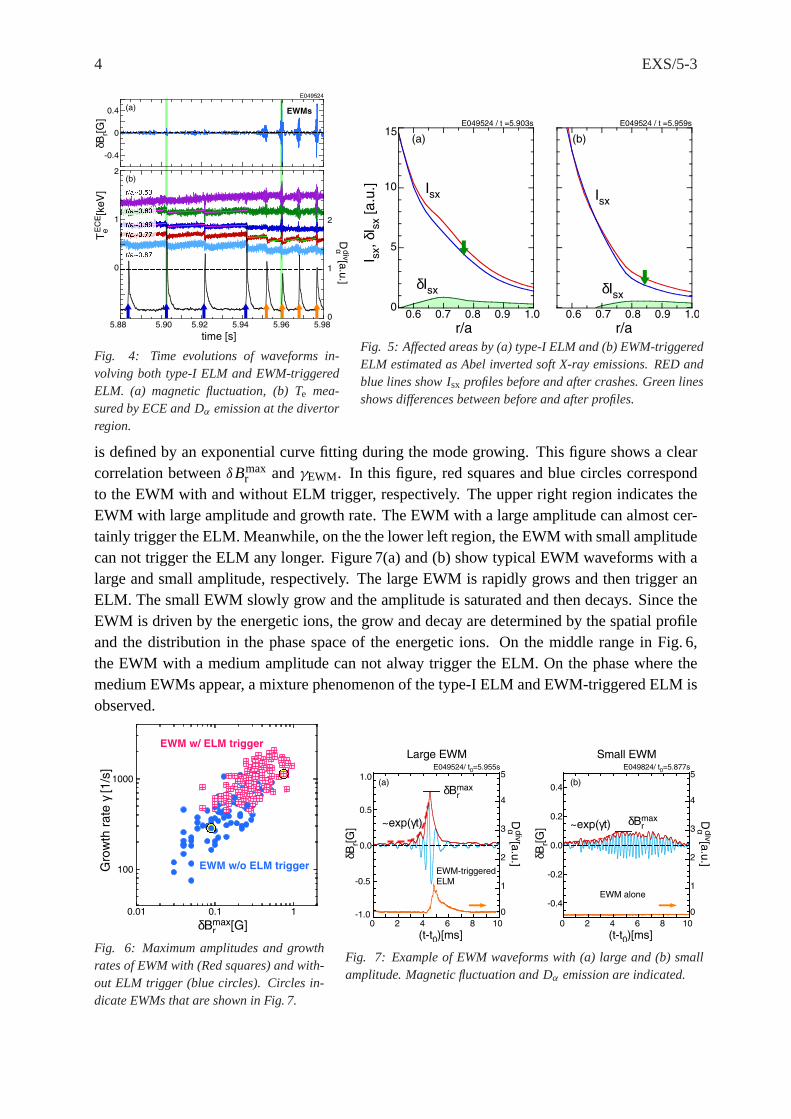
Figure 4 shows time evolutions of waveforms involving both type-I ELM and EWM-triggeredELM. In this time window, EWMs appeared att = 5.95 s after the type-I ELM phase. Radial af-fected region of the type-I and the EWM-triggered ELM are measured by the electron cyclotronemission (ECE) and estimated by the Abel inverted soft X-ray emissions shown in Figure 5.These are estimated as differences between before and afterIsx profiles with a time lag of 2 ms.As for a type-I ELM att ' 5.90 s,Te profile is changed in the region wherer/a ≥ 0.6. Onthe other hand, the affected region of an EWM-triggered ELM att ' 5.96 s is the region wherer/a ≥ 0.7. These results also show that the EWM-triggered ELM is smaller than that of thetype-I ELM, consistent with the difference of1Wdia.
4. Relation between EWM amplitude and ELM trigger
It is observed that the EWM can trigger the ELM, however, it is not always. Thus, whetherthe EWM can trigger or not depends on the EWM amplitude. Figure 6 shows the relation be-tween the amplitudesδBmax
r and the growth ratesγEWM of the EWMs. Here, the amplitudeis defined as the maximum value of the envelope of the EWM perturbation; the growth rate
4 EXS/5-3
E049524 T
eEC
E[k
eV
]
Dα d
iv[a.u
.]
0
1
2
0
1
2
5.88 5.90 5.92 5.94 5.96 5.98
time [s]
-0.4
0
0.4
δBr[G
]EWMs
(a)
(b)
Fig. 4: Time evolutions of waveforms in-volving both type-I ELM and EWM-triggeredELM. (a) magnetic fluctuation, (b)Te mea-sured by ECE andDα emission at the divertorregion.
0
5
10
15
0.6 0.7 0.8 0.9 1.0
r/a
I sx,
δIsx [a.u
.]
0.6 0.7 0.8 0.9 1.0
r/a
Isx
δIsxδIsx
Isx
E049524 / t =5.903s E049524 / t =5.959s
(a) (b)
Fig. 5: Affected areas by (a) type-I ELM and (b) EWM-triggeredELM estimated as Abel inverted soft X-ray emissions. RED andblue lines showIsx profiles before and after crashes. Green linesshows differences between before and after profiles.
is defined by an exponential curve fitting during the mode growing. This figure shows a clearcorrelation betweenδBmax
r andγEWM. In this figure, red squares and blue circles correspondto the EWM with and without ELM trigger, respectively. The upper right region indicates theEWM with large amplitude and growth rate. The EWM with a large amplitude can almost cer-tainly trigger the ELM. Meanwhile, on the the lower left region, the EWM with small amplitudecan not trigger the ELM any longer. Figure 7(a) and (b) show typical EWM waveforms with alarge and small amplitude, respectively. The large EWM is rapidly grows and then trigger anELM. The small EWM slowly grow and the amplitude is saturated and then decays. Since theEWM is driven by the energetic ions, the grow and decay are determined by the spatial profileand the distribution in the phase space of the energetic ions. On the middle range in Fig. 6,the EWM with a medium amplitude can not alway trigger the ELM. On the phase where themedium EWMs appear, a mixture phenomenon of the type-I ELM and EWM-triggered ELM isobserved.
100
1000
0.01 0.1 1
Gro
wth
rate
γ [1
/s]
δBrmax[G]
EWM w/o ELM trigger
EWM w/ ELM trigger
Fig. 6: Maximum amplitudes and growthrates of EWM with (Red squares) and with-out ELM trigger (blue circles). Circles in-dicate EWMs that are shown in Fig. 7.
-1.0
-0.5
0.0
0.5
1.0
0
1
2
3
4
5
Dα d
iv[a.u
.]
E049524/ t0=5.955s
δBr[G
]
(t-t0)[ms]0 2 4 6 8 10
δBrmax
~exp(γt)
-0.4
-0.2
0.0
0.2
0.4
δBr[G
]
0
1
2
3
4
5
Dα d
iv[a.u
.]
E049824/ t0=5.877s
(t-t0)[ms]0 2 4 6 8 10
δBrmax
~exp(γt)
(a) (b)
Large EWM Small EWM
EWM alone
EWM-triggered ELM
Fig. 7: Example of EWM waveforms with (a) large and (b) smallamplitude. Magnetic fluctuation andDα emission are indicated.
5 EXS/5-3
5. SOL behaviors due to EWM
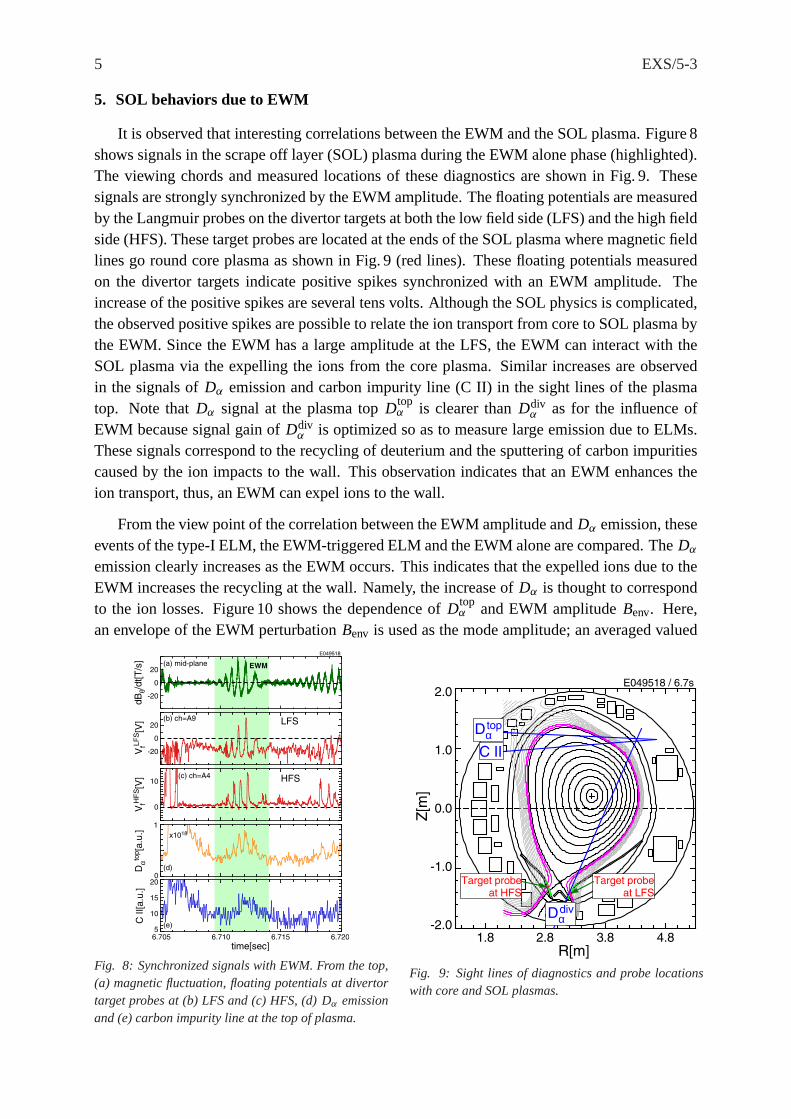
It is observed that interesting correlations between the EWM and the SOL plasma. Figure 8shows signals in the scrape off layer (SOL) plasma during the EWM alone phase (highlighted).The viewing chords and measured locations of these diagnostics are shown in Fig. 9. Thesesignals are strongly synchronized by the EWM amplitude. The floating potentials are measuredby the Langmuir probes on the divertor targets at both the low field side (LFS) and the high fieldside (HFS). These target probes are located at the ends of the SOL plasma where magnetic fieldlines go round core plasma as shown in Fig. 9 (red lines). These floating potentials measuredon the divertor targets indicate positive spikes synchronized with an EWM amplitude. Theincrease of the positive spikes are several tens volts. Although the SOL physics is complicated,the observed positive spikes are possible to relate the ion transport from core to SOL plasma bythe EWM. Since the EWM has a large amplitude at the LFS, the EWM can interact with theSOL plasma via the expelling the ions from the core plasma. Similar increases are observedin the signals ofDα emission and carbon impurity line (C II) in the sight lines of the plasmatop. Note thatDα signal at the plasma topDtop
α is clearer thanDdivα as for the influence of
EWM because signal gain ofDdivα is optimized so as to measure large emission due to ELMs.
These signals correspond to the recycling of deuterium and the sputtering of carbon impuritiescaused by the ion impacts to the wall. This observation indicates that an EWM enhances theion transport, thus, an EWM can expel ions to the wall.
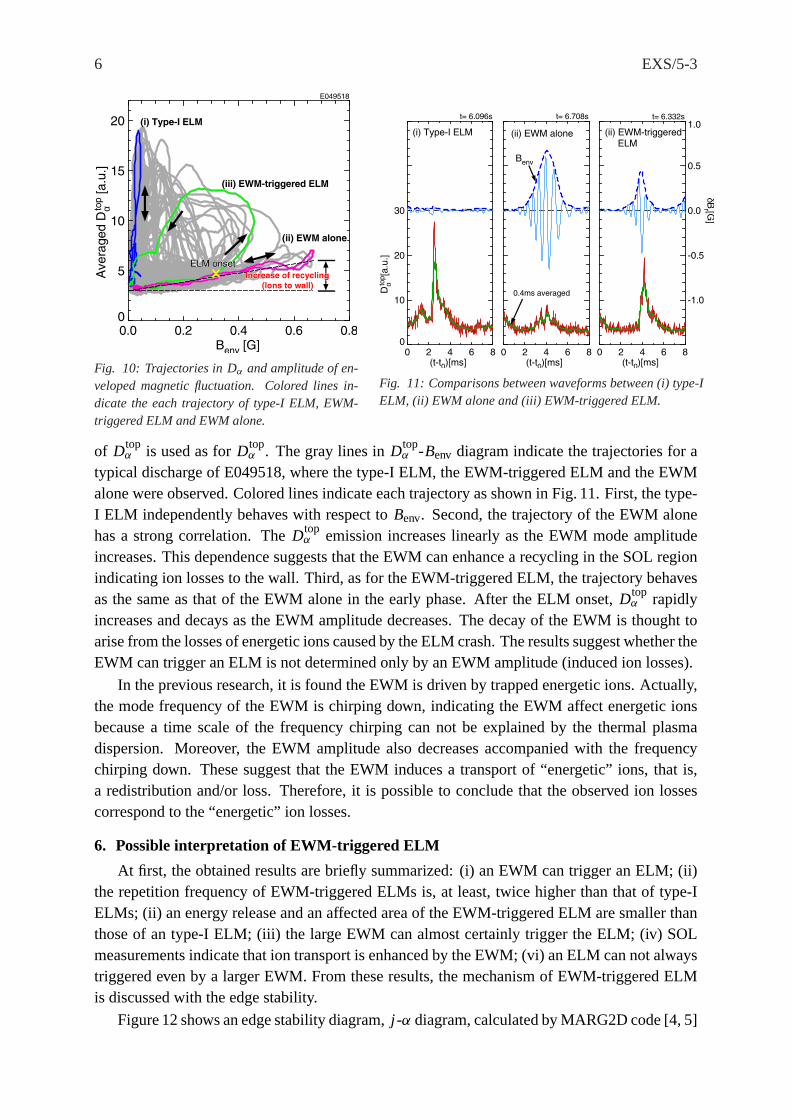
From the view point of the correlation between the EWM amplitude andDα emission, theseevents of the type-I ELM, the EWM-triggered ELM and the EWM alone are compared. TheDαemission clearly increases as the EWM occurs. This indicates that the expelled ions due to theEWM increases the recycling at the wall. Namely, the increase ofDα is thought to correspondto the ion losses. Figure 10 shows the dependence ofDtop
α and EWM amplitudeBenv. Here,an envelope of the EWM perturbationBenv is used as the mode amplitude; an averaged valued
-20
0
20
6.705 6.710 6.715 6.720
dB
θ/dt[T
/s]
time[sec]
-20
0
20
VfL
FS[V
]
0
10
VfH
FS[V
]
0
1
x1018
Dαto
p[a
.u.]
5
15
C II[a.u
.]
E049518
(c) ch=A4
(b) ch=A9
(a) mid-plane
20
10
EWM
(d)
(e)
LFS
HFS
Fig. 8: Synchronized signals with EWM. From the top,(a) magnetic fluctuation, floating potentials at divertortarget probes at (b) LFS and (c) HFS, (d)Dα emissionand (e) carbon impurity line at the top of plasma.
E049518 / 6.7s
Target probe at HFS
Target probe at LFS
1.8 2.8 3.8 4.8-2.0
-1.0
0.0
1.0
2.0
Z[m
]
R[m]
Dαtop
C II
Dαdiv
Fig. 9: Sight lines of diagnostics and probe locationswith core and SOL plasmas.
6 EXS/5-3
0.0 0.2 0.4 0.6 0.80
5
10
15
20
Benv [G]
Avera
ged D
αtop [a.u
.]
(i) Type-I ELM
(iii) EWM-triggered ELM
(ii) EWM alone
E049518
Fig. 10: Trajectories inDα and amplitude of en-veloped magnetic fluctuation. Colored lines in-dicate the each trajectory of type-I ELM, EWM-triggered ELM and EWM alone.
t= 6.096s
0 2 4 6 8(t-t0)[ms]
0
10
20
30
Dαto
p[a
.u.]
t= 6.708s
0 2 4 6 8(t-t0)[ms]
Benv
t= 6.332s
0 2 4 6 8(t-t0)[ms]
-1.0
-0.5
0.0
0.5
1.0
δB
r [G]
(i) Type-I ELM (ii) EWM-triggered ELM
(ii) EWM alone
0.4ms averaged
Fig. 11: Comparisons between waveforms between (i) type-IELM, (ii) EWM alone and (iii) EWM-triggered ELM.
of Dtopα is used as forDtop
α . The gray lines inDtopα -Benv diagram indicate the trajectories for a
typical discharge of E049518, where the type-I ELM, the EWM-triggered ELM and the EWMalone were observed. Colored lines indicate each trajectory as shown in Fig. 11. First, the type-I ELM independently behaves with respect toBenv. Second, the trajectory of the EWM alonehas a strong correlation. TheDtop
α emission increases linearly as the EWM mode amplitudeincreases. This dependence suggests that the EWM can enhance a recycling in the SOL regionindicating ion losses to the wall. Third, as for the EWM-triggered ELM, the trajectory behavesas the same as that of the EWM alone in the early phase. After the ELM onset,Dtop
α rapidlyincreases and decays as the EWM amplitude decreases. The decay of the EWM is thought toarise from the losses of energetic ions caused by the ELM crash. The results suggest whether theEWM can trigger an ELM is not determined only by an EWM amplitude (induced ion losses).
In the previous research, it is found the EWM is driven by trapped energetic ions. Actually,the mode frequency of the EWM is chirping down, indicating the EWM affect energetic ionsbecause a time scale of the frequency chirping can not be explained by the thermal plasmadispersion. Moreover, the EWM amplitude also decreases accompanied with the frequencychirping down. These suggest that the EWM induces a transport of “energetic” ions, that is,a redistribution and/or loss. Therefore, it is possible to conclude that the observed ion lossescorrespond to the “energetic” ion losses.
6. Possible interpretation of EWM-triggered ELM
At first, the obtained results are briefly summarized: (i) an EWM can trigger an ELM; (ii)the repetition frequency of EWM-triggered ELMs is, at least, twice higher than that of type-IELMs; (ii) an energy release and an affected area of the EWM-triggered ELM are smaller thanthose of an type-I ELM; (iii) the large EWM can almost certainly trigger the ELM; (iv) SOLmeasurements indicate that ion transport is enhanced by the EWM; (vi) an ELM can not alwaystriggered even by a larger EWM. From these results, the mechanism of EWM-triggered ELMis discussed with the edge stability.
Figure 12 shows an edge stability diagram,j -α diagram, calculated by MARG2D code [4, 5]
7 EXS/5-3
based on parameters just before the type-I ELM in the typical discharge (E049350) where type-I ELMs and EWM-triggered ELMs coexist. Here,j andα are an edge current density andthe normalized pressure gradient; the edge current density is described as an averaged currentdensity at the pedestal region
⟨jped
⟩normalized by the averaged current density〈 j 〉. In Fig. 12,
there are two stability boundaries of a finite-n and an infinite-n MHD limits. The cross withcircle indicates the edge status just before the type-I ELM. It is found that the edge status isclose to the finite-n limit. Namely, the type-I ELM occurs as the edge parameters( j, α) reachthe finite-n limit. After the type-I ELM crash, bothj , α in the edge are lost, resulting in movingthe edge status downward lower left in this diagram. In the case of usual type-I ELM, the edgestatus moves to upper right in the diagram again asWped is recovering, as is an ELM cycle.In the EWM-triggered ELM case, since the EWM can induce ion losses, the ions can affectas an additionalα. With taking into account this effect, the edge status can be shifted close tothese boundaries. If this shift is enough to reach to the boundaries, an ELM can be triggered.Since the EWM has ann = 1 mode structure, induced ion losses are considered to be localizedand rotating toroidally. Thus, EWM induced ion losses are thought to violate the edge stabilityat the region where losses are the maximum. At the moment, we have interpreted whether anEWM can trigger an ELM is determined by the competition between a distance from the MHDboundary and additional pressure of ion losses due to an EWM.
As discussed in the previous section, if ion loss induced by the EWM is the “energetic” ionloss, the energetic ion loss can effectively act as an additional pressure, because energies of theenergetic ions are at least several tens times higher thanTi andTe at the edge. This means thatthe energetic ions are effective as additional pressure even with a small amount of energetic ionloss.
7. Excitation of marginal RWM
In this section, the additional interaction between the EWM-triggered ELM and the RWMis introduced. It is observed that the EWM-triggered ELM seemed to excite the stable RWM.
0 2 4
0.2
0.4
0.6
α92
<j p
ed>
/<j>
Infinite-n MHD
limit
Finite-n MHD
limit
Type-I ELM
E049350
Fig. 12: j -α diagram for just before type-I ELM att ' 5.975 sof E049350.
(c)
E049508
-1
0
1
δBr [G
]
5.82 5.84 5.86time[s]
0.0
1.0
2.0
Dαd
iv [a
u]
0
180
360
Toro
idal angle
[deg]
(b)
-20
0
20
40
60
Vt [k
m/s
]
(d)
EWM-triggered ELM
(a) n=1 ELM-excited RWM
EWM
0.31
0.43
0.50
r/a=0.57
0.73
0.90
Fig. 13: Time evolutions of (a)n = 1 magnetic per-turbation, (b) Dα emission at the divertor region, (c)toroidal mode structure and (d) toroidal rotations.
8 EXS/5-3
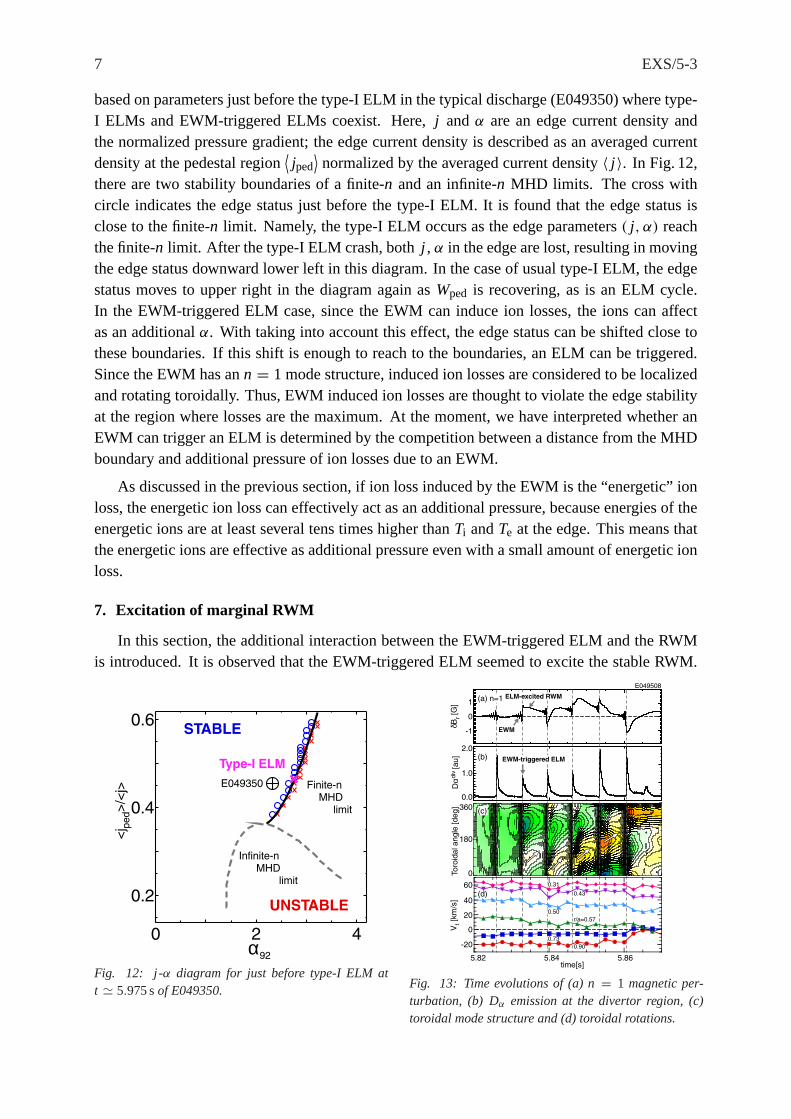
In Fig. 13(a) and (b), the time evolution ofn = 1 magnetic perturbation andDdivα are shown.
Just after each EWM-triggered ELM, then = 1 magnetic field repeatedly appears. Figure 13(c)shows a contour plot of toroidal structure of the magnetic perturbation. As seen, the excitedn =1 response is slowly rotating in the toroidal direction. From the mode structure and time scale,the response is considered to be the stable RWM close to the stability limit. Figure 13(d) showsthe time evolution of plasma rotations. Just after the ELM the plasma rotation was decreased.This phenomenon is thought to be the so-called resonant field amplification (RFA) [6]. It hasbeen reported that stable RWM can respond by an application of external fields [7]. From thedecay of the excited RWM, the damping rate and mode frequency can be estimated based onan impulse response. Actually, the mode frequency is about 40 Hz, which is consistent with theRWM time scale. The damping is about twice the mode frequency, that is over damping. Theobserved phenomenon is thought to be a plasma response indicating that the RWM is marginalby the ELM impact.
8. Summary
We have reported the interactions of MHD events in the JT-60U high-βN plasmas. In theELMy H-mode with high-βN plasmas, it is observed that the EWM triggers the ELM. TheEWM-triggered ELM has a higher frequency and less energy loss than those of the type-I ELM.Actually, it is observed that the affected region of the EWM-triggered ELM is smaller than thatof the type-I ELM. The trigger of the ELM by the EWM occurs as the EWM has a large am-plitude. In the SOL region, several measurements indicates ion losses synchronized with anEWM perturbation. Namely, the ion losses enhanced as the EWM amplitude increases. How-ever, whether an EWM can trigger an ELM is not determined by the EWM amplitude. Themechanism that the EWM can trigger the ELM is discussed based on the edge stability diagramcalculated by the MARG2D. From the calculation, the edge stability of the discharges are lo-cated close to the MHD limit. This indicates the ion losses are possible to increase pedestalpressure gradient as an additional effect, and then trigger an ELM. Whether an EWM can trig-ger an ELM seems to be determined by the competition between a distance from the MHDboundary and additional pressure of ion losses due to an EWM. Another interaction that theEWM-triggered ELM excited an marginal RWM is observed. Just after the EWM-triggeredELM, ann = 1 distortion appears and then decays soon. It is considered that an impact of theinduced ELM can excite the marginally stable RWM.
References
[1] G. Matsunaga et al.,Phys. Rev. Lett.103, 045001 (2009).
[2] G. Matsunaga et al.,Nuclear Fusion50, 084003 (2010).
[3] M. Okabayashi et al ,Nuclear Fusion49, 125003 (2009).
[4] S. Tokuda and T. Watanabe,Phys. Plasmas6, 3012 (1999).
[5] N. Aiba et al.,Comput. Phys. Commun.175, 269-289 (2006).
[6] A. H. Boozer,Phys. Rev. Lett.86, 5059 (2001).
[7] H. Reimerdes et al.,Phys. Rev. Lett.93, 135002 (2004).