W. Ubachs, L. Tashiro, and R. N. Zare, "Study of the N 2 b 1 Π u
13
Chemical Physics 130 (1989) 1-13 North-Holland, Amsterdam STUDY OF THE N2 b ‘Ii, STATE VIA 1 + 1 MULTIPHOTON IONIZATION Wim UBACHS ‘, Lynn TASHIRO and Richard N. ZARE Department of Chemistry, Stanford University,Stanford, CA 94305, USA Received 22 June 1988 Medium-resolution spectra of the N2 b ‘II,-X ‘Z: band system were recorded by 1 + I multiphoton ionization. In the spectra we found different linewidths for transitions to different vibrational levels in the b ‘I& state: Avo =0.50&0.05 cm-‘, Avi = 0.28~0.02cm-‘,Av~=0.65~0.06cm-‘,Av~=3.2~0.5cm-’,Av,=0.60~0.07cm~‘,andAv,=0.28~0.02~~‘.Fromthese linewidths, prediss~iation lifetimes rL, were obtained: TV = 16 f 3 ps, r, > 150 ps, 7? = 10 + 2 ps, 7, = 1.6 2 0.3 ps, T, = 9 zh 2 ps, and rs z 1.50 ps. Band origins and rotational constants for the b ‘III.v= 0 and 1 levels were determined for the i4NZ and 14NlSN molecules. 1. Introduction Much progress is being made on the production of tunable extreme ultraviolet radiation (XUV) in the windowless regime below 105 nm. Two major ad- vances have taken place, the use of sy~chrotron light sources and the upconversion of coherent light sources in the visible and ultraviolet. Although the former is more broadly tunable, the latter is generally brighter over its more limited tuning range and it can be con- structed for far less cost in the laboratory of an indi- vidual investigator. In spite of these advances, the spectroscopic application of coherent XUV sources is still in a primitive state because most of these sources have an extremely limited tunability [ 1 ] _ However, efficient and tunable XUV has been dem- onstrated in the range 92- 102 nm by several investi- gators [ 2-41 through third-harmonic generation of the output from a frequency-doubled dye laser. From their general purpose XUV spectrometer, Softley et al. [ 31 obtained a 1 XUV+ 1 UV multi- photon ionization (MPI) spectrum of the b ‘l& u’ = 1-X ‘Zz v” =O transition in molecular nitrogen. Their resolution, however, did not improve upon the best data for the Nz b ‘II, state taken with a grating spectrograph [ 51. Comparable accuracy in the rota- ’ Present address: Natuurkundig Laboratorium, Vrije Univer- siteit, De Boefeiaan 1081, 1081 HV Amsterdam, The Netherlands. tional constants was obtained by Rajan 161 from an analysis of the b ‘I&,-a ’ II, emission system. At more moderate resolution the synchrotron radiation ab- sorption spectrum of N2 in the range 66- 100 nm gives an overview of the complex vibronic structure in the Nz spectrum [ 71. Through the extensive high-reso- lution absorption studies by Carroll and Collins [ 5 ] and the deperturbation analysis by Dressler [ 81, the assignment of the dense vibronic structure in the en- ergy range between 100000 and 106000 cm-’ has been clarified. Relative photoabso~tion cross sec- tions to different vibrational levels in the b *II, va- lence state and interacting ‘II, Rydberg states have been investigated quantitatively [ 7,9- Ill. A theo- retical account of the mutual interferences between b, c and o ‘II, states was given by Stahel et al. [ 121. The X ‘I;: v=O ievel has been well characterized through Raman spectroscopy by Bendtsen [ 13 1. In the present paper we present higher-resolution spectra of the Nz b ‘II,-X ‘Ez band system, detected by I+ I MPI. Because it was known from earlier work [5,8] that severe perturbations occur in the rota- tional structure of the b ‘II, state vibrational levels with u> 1, we analyzed only the u=O and 1 levels in detail. The b ‘II, state has also been observed by 3 + 1 MPI [ 141. For spectroscopic purposes, 1 XUV+ 1 UV MPI seems preferable to 3 + 1 MPI because sat- uration broadening and possible AC-Stark shifting are avoided. The Nz b ‘II, state is known to predissociate around 0301-0104/89/$03.50 0 Elsevier Science Publishers B.V. ( North-Holland Physics Publishing Division )
Transcript of W. Ubachs, L. Tashiro, and R. N. Zare, "Study of the N 2 b 1 Π u
Chemical Physics 130 (1989) 1-13 North-Holland, Amsterdam
STUDY OF THE N2 b ‘Ii, STATE VIA 1 + 1 MULTIPHOTON IONIZATION
Wim UBACHS ‘, Lynn TASHIRO and Richard N. ZARE Department of Chemistry, Stanford University, Stanford, CA 94305, USA
Received 22 June 1988
Medium-resolution spectra of the N2 b ‘II,-X ‘Z: band system were recorded by 1 + I multiphoton ionization. In the spectra we found different linewidths for transitions to different vibrational levels in the b ‘I& state: Avo =0.50&0.05 cm-‘, Avi = 0.28~0.02cm-‘,Av~=0.65~0.06cm-‘,Av~=3.2~0.5cm-’,Av,=0.60~0.07cm~‘,andAv,=0.28~0.02~~‘.Fromthese linewidths, prediss~iation lifetimes rL, were obtained: TV = 16 f 3 ps, r, > 150 ps, 7? = 10 + 2 ps, 7, = 1.6 2 0.3 ps, T, = 9 zh 2 ps, and rs z 1.50 ps. Band origins and rotational constants for the b ‘III. v= 0 and 1 levels were determined for the i4NZ and 14NlSN molecules.
1. Introduction
Much progress is being made on the production of tunable extreme ultraviolet radiation (XUV) in the windowless regime below 105 nm. Two major ad- vances have taken place, the use of sy~chrotron light sources and the upconversion of coherent light sources in the visible and ultraviolet. Although the former is more broadly tunable, the latter is generally brighter over its more limited tuning range and it can be con- structed for far less cost in the laboratory of an indi- vidual investigator. In spite of these advances, the spectroscopic application of coherent XUV sources is still in a primitive state because most of these sources have an extremely limited tunability [ 1 ] _ However, efficient and tunable XUV has been dem- onstrated in the range 92- 102 nm by several investi- gators [ 2-41 through third-harmonic generation of the output from a frequency-doubled dye laser.
From their general purpose XUV spectrometer, Softley et al. [ 31 obtained a 1 XUV+ 1 UV multi- photon ionization (MPI) spectrum of the b ‘l& u’ = 1 -X ‘Zz v” =O transition in molecular nitrogen. Their resolution, however, did not improve upon the best data for the Nz b ‘II, state taken with a grating spectrograph [ 51. Comparable accuracy in the rota-
’ Present address: Natuurkundig Laboratorium, Vrije Univer- siteit, De Boefeiaan 1081, 1081 HV Amsterdam, The Netherlands.
tional constants was obtained by Rajan 161 from an analysis of the b ‘I&,-a ’ II, emission system. At more moderate resolution the synchrotron radiation ab- sorption spectrum of N2 in the range 66- 100 nm gives an overview of the complex vibronic structure in the Nz spectrum [ 71. Through the extensive high-reso- lution absorption studies by Carroll and Collins [ 5 ] and the deperturbation analysis by Dressler [ 81, the assignment of the dense vibronic structure in the en- ergy range between 100000 and 106000 cm-’ has been clarified. Relative photoabso~tion cross sec- tions to different vibrational levels in the b *II, va- lence state and interacting ‘II, Rydberg states have been investigated quantitatively [ 7,9- Ill. A theo- retical account of the mutual interferences between b, c and o ‘II, states was given by Stahel et al. [ 121. The X ‘I;: v=O ievel has been well characterized through Raman spectroscopy by Bendtsen [ 13 1.
In the present paper we present higher-resolution spectra of the Nz b ‘II,-X ‘Ez band system, detected by I+ I MPI. Because it was known from earlier work [5,8] that severe perturbations occur in the rota- tional structure of the b ‘II, state vibrational levels with u> 1, we analyzed only the u=O and 1 levels in detail. The b ‘II, state has also been observed by 3 + 1 MPI [ 141. For spectroscopic purposes, 1 XUV+ 1 UV MPI seems preferable to 3 + 1 MPI because sat- uration broadening and possible AC-Stark shifting are avoided.
The Nz b ‘II, state is known to predissociate around
0301-0104/89/$03.50 0 Elsevier Science Publishers B.V. ( North-Holland Physics Publishing Division )
2
the Y= 3 vibrational level [ 5,15,16]. From linewidth measurements we estimate predissociation lifetimes for the lower vibrational levels of the NZ b ‘II, state. The intensity of (Y, 0) bands of the Nz b l&-X ‘Z:,” system varies in the MPI spectrum with u in a man- ner consistent with the predissociation rates deter- mined from the MPI linewidths.
2. Experimental
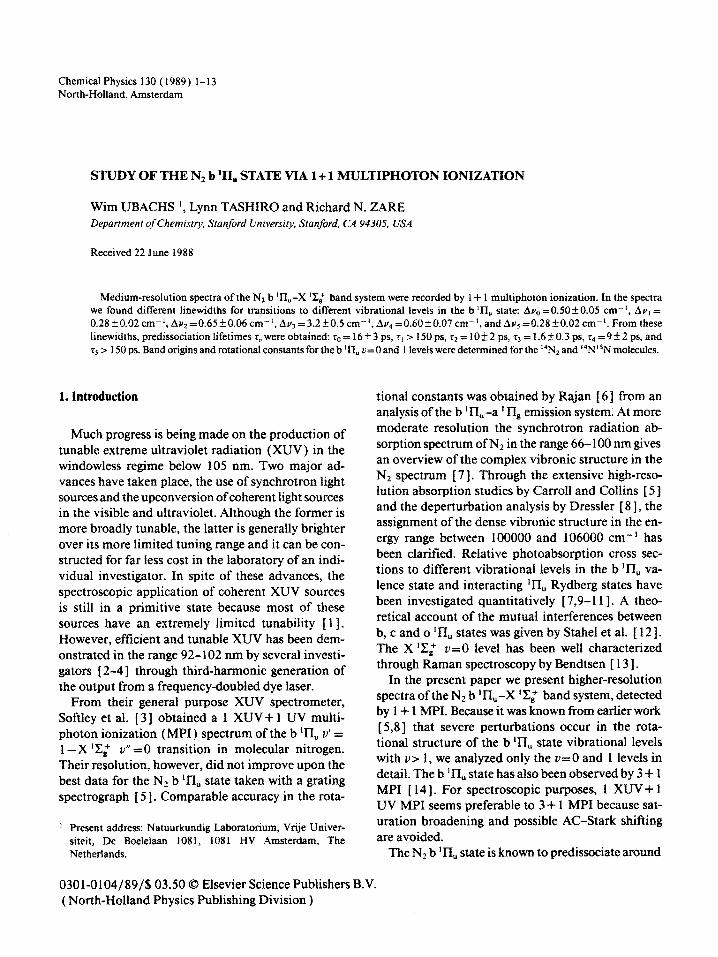
The XUV spectrometer is depicted schematically in fig. 1. The vacuum part consists of three differen- tially pumped chambers. In the tripling chamber the XUV is produced by third harmonic generation of a focused UV laser beam in a pulsed jet of xenon, kryp- ton [ 2,3 ] or acetylene [ 171. In the sample chamber the NZ molecules are excited by the diverging XUV/ UV beams (beam diameter is 5 mm), emerging from the frequency tripling region. The Nz was obtained from a pulsed valve (General Valve), with the orifice 25 mm for the interaction region. With a backing pressure of 30 psi we found a rotationally cooled spectrum with T,,= 150 K. The average pressure in the chamber is maintained below IO-’ Torr. The es- timated density in the interaction region at the time of the laser pulse is on the order of 1 0e3 Torr, based on a comparison of signal intensities with detection in bulk gas. The nascent ions were extracted through a slit into a time~f-dint (TOF) chamber and mass
selectively detected on a m~tichanne1 plate. The mass resolution of the TOF spectrometer is in general I in 100, which is sufficient to separate “Nz from 14NisN. However, the very strong signals at mass 28 ( “N?) prevent observation of underlying features of 14N’*N at mass 29. Strong ion signals at mass 32 caused by OZ H 3l-I,-X “Cc autoionization transitions in O2 from O2 contamination were also observed in differ- ent parts of the Nz spectrum.
The laser system consists of a Quanta-Ray DCR 1 A Nd: YAG laser, a PDL 1 dye laser and a WEX fre- quency doubling and tracking device. Special care was taken that the UV power in the range 289.5-298.0 nm was held constant at 9-10 mJ/pulse. Different dye mixtures of rhodamine 590, 6 10 and 640 (Exci- ton) were used in several overlapping parts of this wavelength range. For the spectroscopic measure- ments an air spaced etalon (Molectron) was inserted in the oscillator cavity, resulting in a laser bandwidth in the visible of 0.03-0.04 cm-l and a reduction of UV power to 5-8 mJfpufse. Pressure tuning of the cavity with COz gas allows for continuous scans of 10 cm-‘, corresponding to 60 cm-’ in the XUV. The residual visible light is used for calibration purposes. The I2 absorption spectrum and transmission fringes of a calibrated solid etalon (FSRz0.650 & 0.001 cm-’ ) were recorded simultaneously with the MPI spectrum on a three-pen chart recorder. In nonlinear upconversion processes the exact harmonics of the fundamental frequency are produced; therefore, the
Fast
r its
LGCP To pump PD PD
detector
Fig. 1. Schematic diagram of the XUV spectrometer used for 1 + 1 MPI detection.
W. Ubachs et al. / I + 1 MPI of NJ b ‘II, 3
accuracy in the observed spectral line positions in the XUV region is directly related to the calibrated IZ spectrum in the visible.
The XUV power was calibrated in another setup, described in detail by Softley et al. [ 31. The XUV is separated from the UV fundamental by a set of two dichroic mirrors and a thin In-Ti foil (Acton Re- search). The XUV radiation transmitted through the foil is detected on an electron multiplier. The conver- sion efficiencies for tripling in Xe and Kr fluctuate over more than an order of magnitude within the wavelength range relevant to the experiment. For tri- pling in acetylene (C,H,), the conversion efficiency is substantially less but is nearly wavelength indepen- dent between 99.3 and 95.5 nm, i.e. fluctuations are less than 20%. We estimate the number of photons to be 1 08- 1 O’/pulse, corresponding to a power of 0.2-2 nJ/pulse. For the v= 3 linewidth measurements the more efficient krypton and xenon were used as non- linear media. In all cases the power density (in a 5 ns pulse, beam diameter 5 mm) is far too low to satu- rate a transition at 100 nm. It should be noted that all the MPI studies were performed without the XUV/UV separation unit.
3. Spectroscopy of the N2 b ‘II, v=O and v= 1 levels
3.1. 14N2
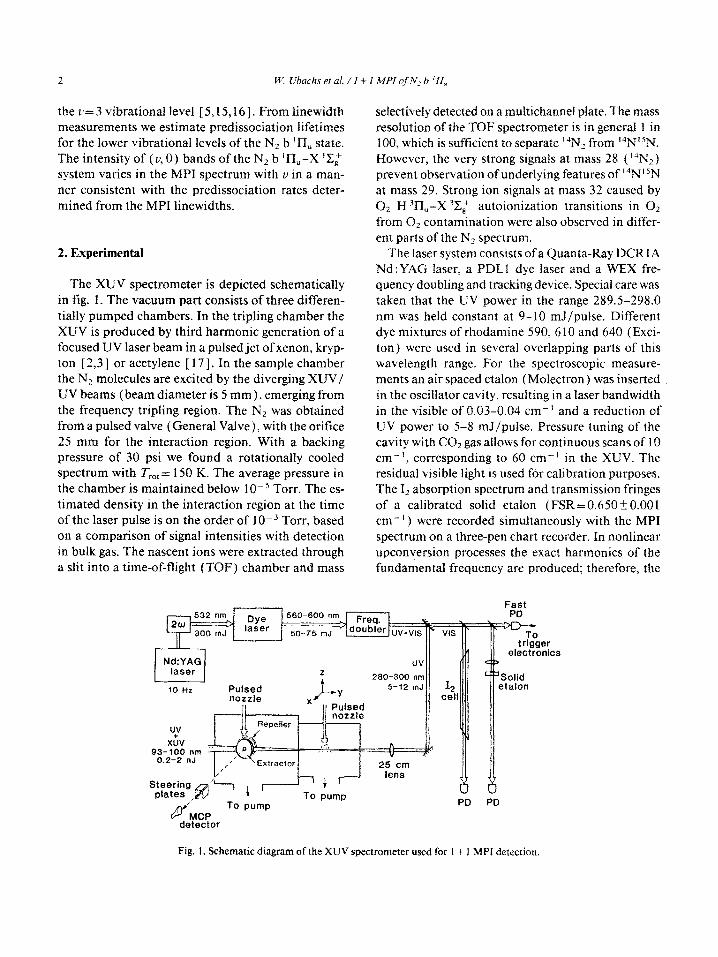
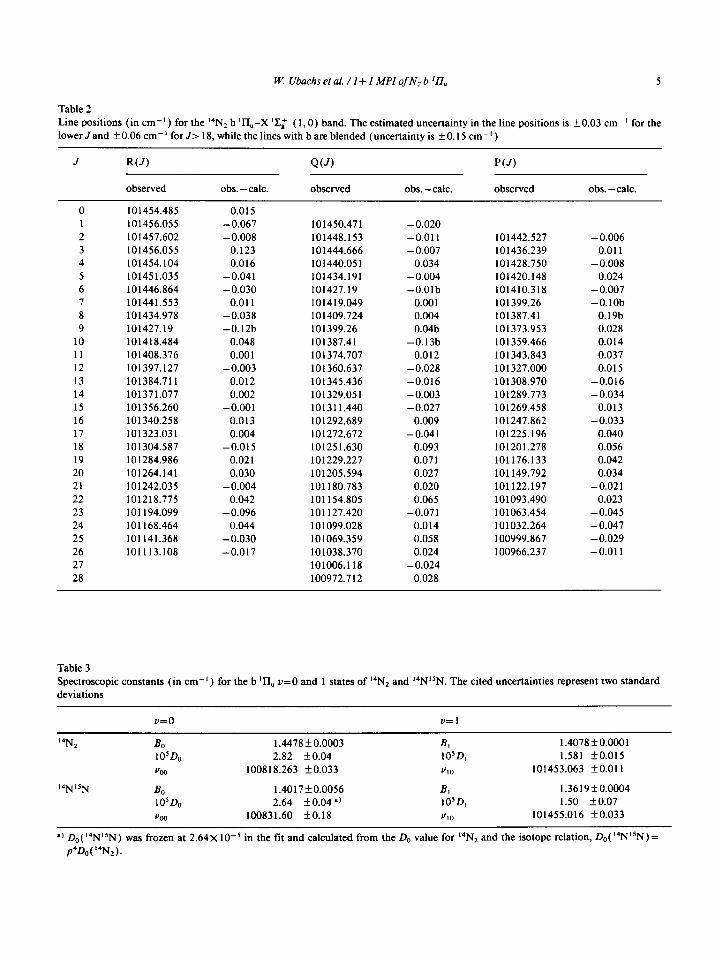
We limited our high-resolution rotational analysis of the b ‘II, electronic state to the v=O and 1 levels and did not attempt to analyze the higher v levels be- cause they are known to be perturbed. A medium res- olution spectrum of the ( 1,O) bandhead portion of the 14Nz b ‘II,-X ‘Cl system is shown in fig. 2. The exact position of the spectral lines was determined from interpolation between I2 lines that are accu- rately tabulated [ 18,191. Single resolved rotational lines have an experimental linewidth of 0.3 cm-’ in the XUV. We therefore estimate an error of kO.03 cm-’ in the absolute position of the strong Nz lines and -to.06 cm-’ for the weaker ones, i.e. those for J>lginthe(l,O)bandandthelinesinthe (0,O) band. Tables 1 and 2 list the line positions of all ob- served N2 b ‘II,-X ‘Cc (0,O) and ( 1,0) transitions, respectively. The data were fit in a least-squares man- ner to Hamiltonians of the form
H=B,[J(J+l)-A’]-D,[.J(J+l)-A”]‘, (1)
for both the b ‘II, and X ‘Ep’ states. In the fit of the (0,O) band we included the line positions for transi- tions to higher J states from Carroll and Collins [ 5 1. The rotational constant B and the centrifugal distor- tion constant D for the v= 0 level of the ground state were fixed at the very accurate values of Bendtsen [ 13 1, obtained by rotational Raman spectroscopy: B,=l.98574(12) cm-’ and D,=5.76(3)~10-~ cm-‘. The resulting B and D constants for the b ‘l-I” v= 0 and v= 1 levels, listed in table 3, are an order of magnitude more accurate than the best known values [ 5,6]. For all the data the experimental and calcu- lated values match within twice the estimated errors. Therefore, we conclude that the rotational structure of the N2 b ‘II,,, v= 0 and u= 1 levels is well behaved. An attempt to include a /i-doubling constant for either the b ‘II v= 0 or v= 1 level in the least-squares fit yielded no significant improvement. Based on a two- standard-deviation error, we conclude that q<4x10⁻⁴cm-‘forthev=Olevelandqc5X10-5 cm-’ for the v= 1 level.
3.2. 14N “N
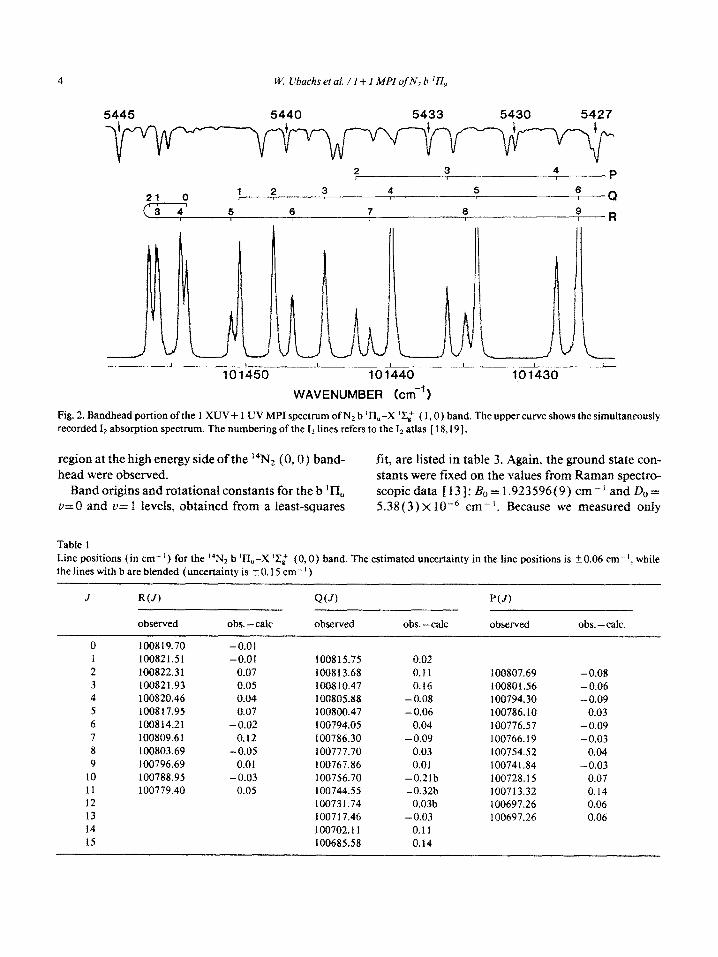
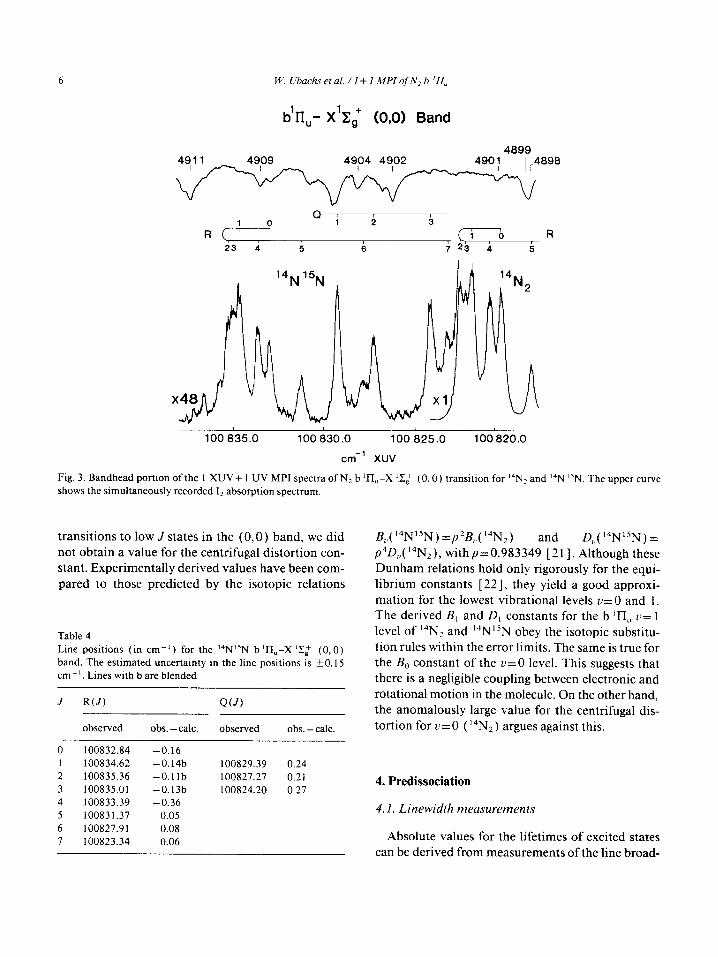
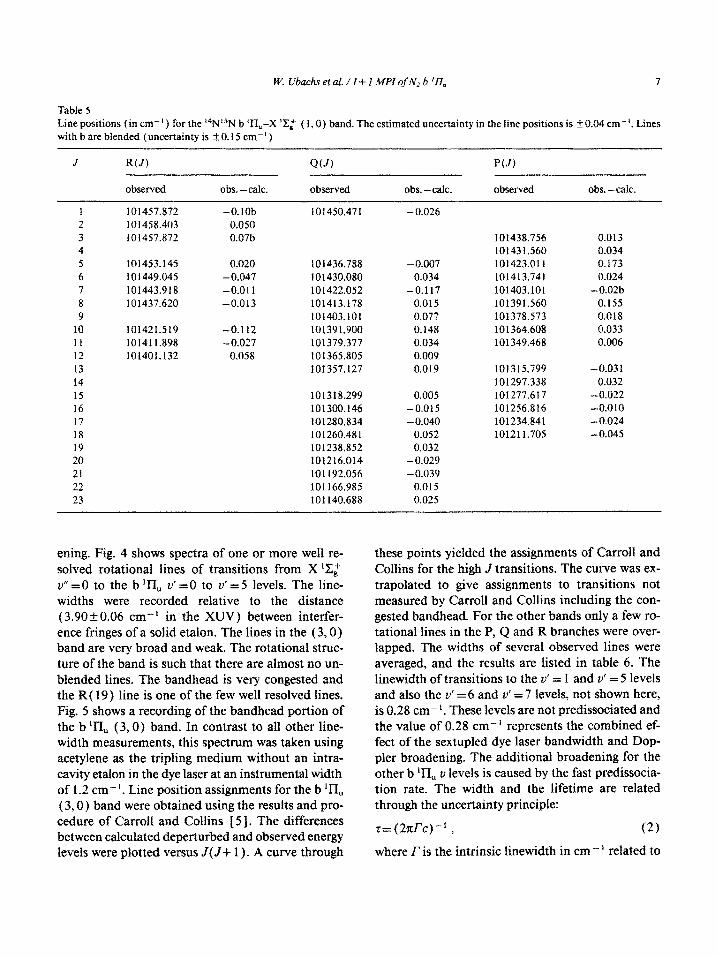
The mass selectivity and the high sensitivity of our XUV spectrometer allowed us to measure the spec- trum of the b ‘II,-X ‘Zg’ transition of the 14N”N molecule in natural abundance (0.74%). It is the first observation of the b-X system for the 14N”N mole- cule. Fig. 3 shows a recording of the bandhead por- tion of the b ‘II,-X ‘Zz (0,O) transition for 14N2 and 14N15N. It should be noted that the apparent sensitiv- ity difference of a factor of 48 does not reflect the natural abundance ratio between the two isotopes. It is known that heavier isotopes are often less predis- sociated [ 201. Robbe [ 161 found that for the b ‘I&-X ‘Cc (3,0) transition “N2 was a factor of 2.7 less predissociated than 14N2. We estimate that 14N15N is a factor of 2.8 less predissociated than 14N2 for the b ‘II,-X ‘xl (0,O) transition. The observed line positions are presented in table 4 for the (0,O) band and in table 5 for the ( 1,O) band. As men- tioned previously, the 14N15N rotational lines that coincide with very strong 14N2 lines could not be sep- arated in the mass selective ion detector. For the weak (0,O) band, only the rotational lines in the 12 cm- ’
4 W. Ubachs et al. / 1-k 1 MPI ofN, b ‘I&
5445 5440 5433 5430 5427
2 3 4 I I P
21 0 1 2 3 4 5 6 t I Q
1 3 4 5 6 7 8 9
I I R
I I I I I
101450 101440 101430
WAVENUMBER (cm-‘)
Fig. 2. Bandhead portion of the 1 XUV+ 1 UV MPI spectrum of NZ b ‘II,-X ‘Z: ( 1,O) band. The upper curve shows the simultaneously recorded Iz absorption spectrum. The numbering of the I2 lines refers to the Iz atlas [ l&19].
region at the high energy side of the 14N2 (0,O) band- fit, are listed in table 3. Again, the ground state con- head were observed. stants were fixed on the values from Raman spectro-
Band origins and rotational constants for the b ‘II, scopicdata 1131: &=1.923596(9) cm-’ and&= v=O and Y= 1 fevels, obtained from a least-squares 5.38(3)~10-~ cm-‘. Because we measured only
Table 1 Line positions (in cm-‘) for the 14NZ b ‘I&-X ‘C: (0,O) band. The estimated uncertainty in the line positions is kO.06 cm-‘! while the lines with b are blended (uncertainty is k 0.15 cm - I )
J R(J) Q(f) P(J)
observed obs. - talc observed obs. -talc observed obs. - talc.
0 100819.70 -0.01 1 100821.51 -0.01 100815.75 0.02 2 100822.31 0.07 100813.68 0.11 1~807.69 -0.08 3 100821.93 0.05 1~810.47 0.16 1~801.56 -0.06 4 100820.46 0.04 100805.88 -0.08 100794.30 -0.09 5 100817.95 0.07 100800.47 -0.06 100786.10 0.03 6 100814.21 -0.02 100794.05 0.04 100776.57 -0.09 7 100809.61 0.12 100786.30 -0.09 100766.19 -0.03 8 100803.69 -0.05 100777.70 0.03 100754.52 0.04 9 100796.69 0.01 100767.86 0.01 100741.84 -0.03
10 100788.95 - 0.03 100756.70 -0.21b 100728. I5 0.07 11 100779.40 0.05 100744.55 -0.32b 100713.32 0.14 12 100731.74 0.03b 100697.26 0.06 13 1007 17.46 -0.03 100697.26 0.06 14 100702.ll 0.11 15 100685.58 0.14
W Ubachs et al. / I + I MPI of NJ b ‘II, 5
Table 2
Line positions (in cm-’ ) for the 14N2 b ‘lI,-X ‘Z: ( 1,O) band. The estimated uncertainty in the line positions is k 0.03 cm- ’ for the
lower J and k 0.06 cm- ’ for .I> 18, while the lines with b are blended (uncertainty is k 0.15 cm- ’ )
J R(J) Q(J) P(J)
observed obs. - talc. observed obs. -talc. observed obs. - talc.
0 1
2
3 4
5
6
7
8
9
10
11
12
13
14
15
16
17
18 19
20
21
22
23
24
25
26
27
28
101454.485 0.015
101456.055 -0.067
101457.602 -0.008 101456.055 0.123 101454.104 0.016
101451.035 -0.041
101446.864 - 0.030
101441.553 0.011 101434.978 -0.038 101427.19 -0.12b 101418.484 0.048 101408.376 0.001 101397.127 -0.003 101384.711 0.012 101371.077 0.002 101356.260 -0.001
101340.258 0.013
101323.031 0.004 101304.587 -0.015 101284.986 0.021
101264.141 0.030 101242.035 - 0.004 101218.775 0.042 101194.099 -0.096
101168.464 0.044
101141.368 -0.030
101113.108 -0.017
101450.471 - 0.020
101448.153 -0.011
101444.666 - 0.007
101440.051 0.034 101434.191 -0.004
101427.19 -0.Olb
101419.049 0.001 101409.724 0.004
101399.26 0.04b
101387.41 -0.13b 101374.707 0.012
101360.637 -0.028
101345.436 -0.016
101329.051 - 0.003 101311.440 -0.027
101292.689 0.009
101272.672 -0.041
101251.630 0.093
101229.227 0.07 1
101205.594 0.027
101180.783 0.020
101154.805 0.065
101127.420 -0.071
101099.028 0.014
101069.359 0.058
101038.370 0.024
101006.118 - 0.024
100972.712 0.028
101442.527 -0.006
101436.239 0.011
101428.750 - 0.008
101420.148 0.024
101410.318 - 0.007
101399.26 -O.lOb
101387.41 0.19b
101373.953 0.028
101359.466 0.014
101343.843 0.037
101327.000 0.015
101308.970 -0.016
101289.773 - 0.034
101269.458 0.013
101247.862 -0.033
101225.196 0.040
101201.278 0.056
101176.133 0.042
101149.792 0.034
101122.197 -0.021
101093.490 0.023
101063.454 - 0.045
101032.264 -0.047
100999.867 -0.029
100966.237 -0.011
Table 3
Spectroscopic constants (in cm-‘) for the b ‘II, v=O and 1 states of 14Nz and 14N”N. The cited uncertainties represent two standard
deviations
v=o v=l
‘4N* BO 1.4478 + 0.0003 B, 1.4078 + 0.000 1
IOr& 2.82 kO.04 105D, 1.581 f0.015
%JJ 100818.263 f0.033 VI0 101453.063 kO.011
I4N15N BO 1.4017+0.0056 B, 1.3619_+0.0004 105D,, 2.64 k 0.04 ‘) 105D, 1.50 kO.07
VOO 100831.60 1kO.18 VI0 101455.016 f0.033
‘) D,,( r4Nr5N) was frozen at 2.64x lO-5 in the tit and calculated from the Do value for IAN2 and the isotope relation, Do( 14N15N) =
P~Do(‘~N~.
W. Ubachs et al. / I -!- I MPI qf N_, b ‘Ii’,
b?Iu- X1$ (0,O) Band
4899
b R 23 4 4 5
100 835.0 i 00 a30 .o 100 825.0 i 00 820.0
cm -’ xuv
Fig. 3. Bandhead portion of the 1 XUV+ 1 UV MPI spectra of N, b ‘n,-X ‘Z: (0,O) transition for 14Nz and 14N “N. The upper curve shows the simultaneously recorded I2 absorption spectrum
transitions to low J states in the (0,O) band, we did not obtain a value for the centrifugal distortion con- stant. Experimentally derived values have been com- pared to those predicted by the isotopic relations
Table 4 Line positions (in cm-‘) for the “‘N”N b ‘II,-X ‘XL (0,O) band. The estimated uncertainty in the line positions is f 0.15 cm-‘. Lines with bare blended
J R(J) Q(J)
observed obs. - talc. observed obs. -talc.
0 100832.84 -0.16 1 100834.62 -0.14b 100829.39 0.24 2 100835.36 -0.1 lb 100827.27 0.21 3 100835.01 -0.13b 100824.20 0.27 4 100833.39 -0.36 5 100831.37 0.05 6 100827.91 0.08 7 100823.34 0.06
B,,( 14N”N) =p2B,,( j4N2) and D,.( 14NrSN) = p4D,.( 14N2), withp=0.983349 [21]. Although these Dunham relations hold only rigorously for the equi- librium constants [ 221, they yield a good approxi- mation for the lowest vibrational levels v= 0 and 1. The derived B, and D, constants for the b ‘II, v= 1 level of 14N2 and 14N”N obey the isotopic substitu- tion rules within the error limits. The same is true for the B. constant of the v=O level. This suggests that there is a negligible coupling between electronic and rotational motion in the molecule. On the other hand, the anomalously large value for the centrifugal dis- tortion for v=O ( 14Nz) argues against this.
4. Predissociation
4. I. Linewidth measurements
Absolute values for the lifetimes of excited states can be derived from measurements of the line broad-
K Ubachs et al. / I + 1 A&PI &iv, b ‘IT, 7
Table 5
Line positions (in cm-’ ) for the ‘%‘*N b ‘II,-X ‘Z: ( 1,O) band. The estimated unce~ainty in the line positions is kO.04 em-‘. Lines with b are blended (uncertainty is + 0.15 cm- ’ )
J
1 2 3
4 5
6 7
8
9
10
11
12 13
14 15
16
17
18
19
20
21
22
23
R(J)
observed
101457.872
lOi458.403 101457.872
101453.145
101449.045 101443.918
101437.620
101421.519
101411.898
101401.132
obs. -talc.
-O.lOb
0.050 0.07b
0.020
-0.047 -0.011
-0.013
-0.112
-0.027
0.058
Q(J)
observed
101450.471
101436.788
101430.080 101422.052
101413.178
101403.101
101391.900
101379.377
101365.805 101357.127
101318.299
1013~.146
101280.834
101260.481
101238.852
101216.014
101192.056
101166.985
101140.688
obs. - cak.
- 0.026
- 0.007
0.034 -0.117
0.015
0.077
0.148
0.034
0.009 0.019
0.005
-0.015
-0.040
0.052
0.032
-0.029
-0.039
0.015
0.025
f’(J)
observed
101438.756
101431.560 101423.011
101413.741 101403.101
101391.560
101378.573
101364.608
101349.468
101315.799
101297.338 101277.617
101256.816
101234.84I
101211.705
obs. - talc.
0.013
0.034 0.173
0.024 -0.02b
0.155
0.018
0.033
0.006
-0.031
0.032 -0.022
-0.010
- 0.024
-0.045
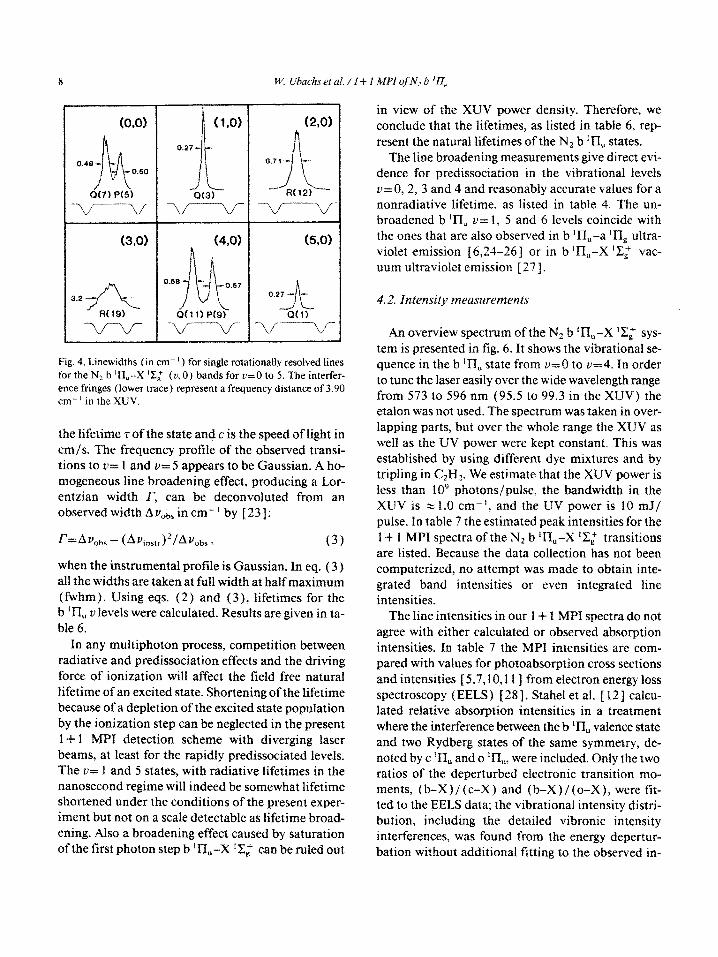
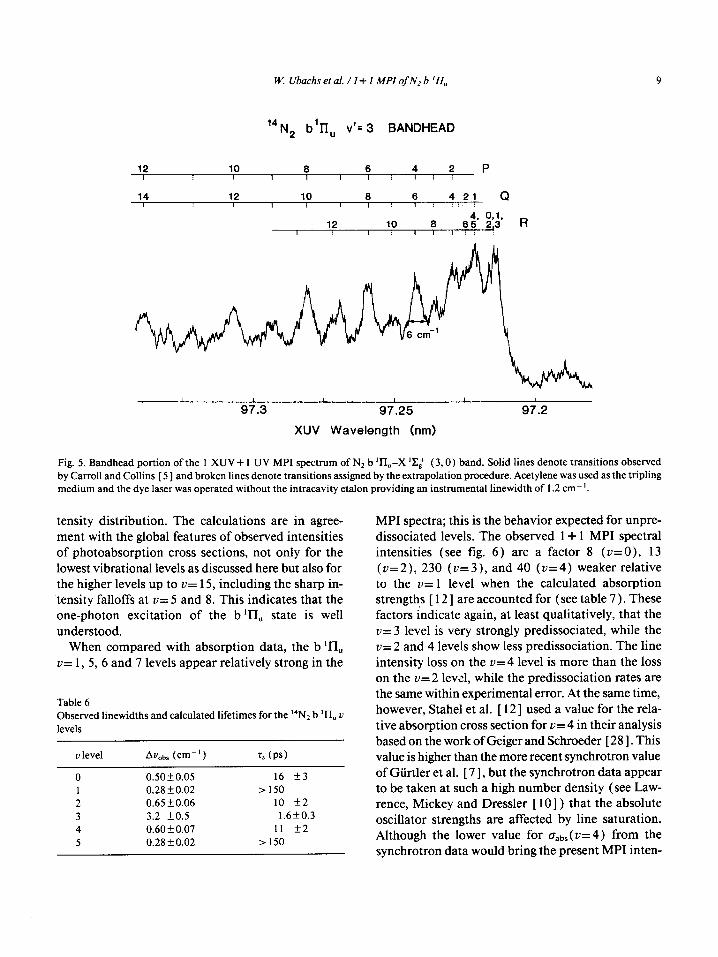
ening. Fig. 4 shows spectra of one or more well re- solved rotational lines of transitions from X ‘2: v” = 0 to the b ‘II, v’ = 0 to v’ = 5 levels. The line- widths were recorded relative to the distance (3.90~0.06 cm-’ in the XUV) between interfer- ence fringes of a solid etalon. The lines in the ( 3,0) band are very broad and weak. The rotational struc- ture of the band is such that there are almost no un- blended lines. The bandhead is very congested and the R( 19 ) line is one of the few well resolved lines. Fig. 5 shows a recording of the bandhead portion of the b ‘II, (3,O) band. In contrast to all other line- width measurements, this spectrum was taken using acetylene as the tripling medium without an intra- cavity etalon in the dye laser at an instrumental width of 1.2 cm-‘. Line position assignments for the b ‘El, (3,0) band were obtained using the results and pro- cedure of Carroll and Collins [ 5 J. The differences between calculated deperturbed and observed energy levels were plotted versus J(f+ 1). A curve through
these points yielded the assignments of Carroll and Collins for the high J transitions. The curve was ex- trapolated to give assignments to transitions not measured by Carroll and Collins including the con- gested bandhead. For the other bands only a few ro- tational lines in the P, Q and R branches were over- lapped. The widths of several observed lines were averaged, and the results are listed in table 6. The linewidth of transitions to the ZJ’ = I and v’ = .5 levels and also the v’ = 6 and u’ = 7 levels, not shown here, is 0.28 cm- ’ . These levels are not predissociated and the value of 0.28 cm- ’ represents the combined ef- fect of the sextupled dye laser bandwidth and Dop- pler broadening. The additional broadening for the other b ‘II, v levels is caused by the fast predissocia- tion rate. The width and the lifetime are related through the uncertainty principle:
r= (2xTc) --! ) (2)
where r is the intrinsic linewidth in cm -’ related to
0.4@-
~
- 0.50
Q(7) P(5)
3.2*
0.27-
~ Q(3)
-kf----v
0.58-
~~
-0.57
Qtli) P(Q)
(2,Ol
0.7 1 -
_I\ R(12)
-v---J
601
0.2?- -
__A Q(i)
-v----v-
Fig. 4. Linewidths (in cm-‘) for single rotationally resolved lines for the N2 b ‘II,-X ‘Z,+ (u, 0) bands for v=O to 5. The interfer- ence fringes (lower trace) represent a frequency distance of 3.90 cm-’ in the XUV.
the lifetime r of the state and c is the speed of light in cm/s. The frequency profile of the observed transi- tions to u= 1 and v= 5 appears to be Gaussian. A ho- mogeneous line broadening effect, producing a Lor- entzian width r, can be deconvoluted from an observed width AY,~~ in cm-’ by [23]:
rcAvobs- (AVinstr)2/Avobs t (3)
when the instrumental profile is Gaussian. In eq. (3) all the widths are taken at full width at half maximum (fwhm). Using eqs. (2) and (3), lifetimes for the b ‘II, v levels were calculated. Results are given in ta- ble 6.
In any multiphoton process, competition between radiative and predissociation effects and the driving force of ionization will affect the field free natural lifetime of an excited state. Shortening of the lifetime because of a depletion of the excited state population by the ionization step can be neglected in the present 1 + I MPI detection scheme with diverging laser beams, at least for the rapidly predissociated levels. The v= 1 and 5 states, with radiative lifetimes in the nanosecond regime will indeed be somewhat lifetime shortened under the conditions of the present exper- iment but not on a scale detectable as lifetime broad- ening. Also a broadening effect caused by saturation of the first photon step b ‘K&-X ‘Cp’ can be ruled out
in view of the XUV power density. Therefore, we conclude that the lifetimes, as listed in table 6, rep- resent the natural lifetimes of the Nz b ‘H, states.
The line broadening measurements give direct evi- dence for predissociation in the vibrational levels v= 0,2, 3 and 4 and reasonably accurate values for a nonradiative lifetime, as listed in table 4. The un- broadened b ‘H, v= 1, 5 and 6 levels coincide with the ones that are also observed in b ‘II,--a ‘I& ultra- violet emission [6,24-261 or in b I&,-X ‘ZZz vac- uum ultraviolet emission [ 27 1.
4.2. Intensify measurements
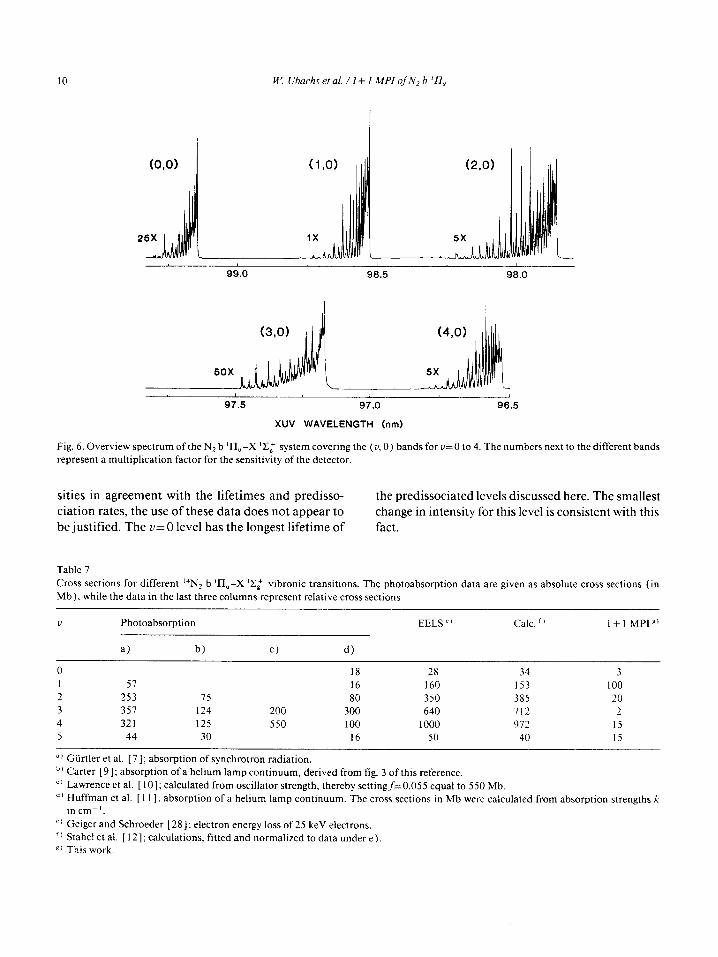
An overview spectrum of the NZ b ‘l&-X ‘;fg“ sys- tem is presented in fig. 6. It shows the vibrational se- quence in the b ‘I?, state from z’= 0 to v=4. In order to tune the laser easily over the wide wavelength range from 573 to 596 nm (95.5 to 99.3 in the XUV) the etalon was not used. The spectrum was taken in over- lapping parts, but over the whole range the XUV as well as the UV power were kept constant. This was established by using different dye mixtures and by tripling in C2H2. We estimate that the XUV power is Iess than lo9 photons/pulse, the bandwidth in the XUV is = 1.0 cm-‘, and the UV power is 10 mJ/ pulse. In table 7 the estimated peak intensities for the l-i- 1 MPI spectra of the N2 b ‘II,-X ‘C: transitions are listed. Because the data collection has not been computerized, no attempt was made to obtain inte- grated band intensities or even integrated line intensities.
The line intensities in our 1 + 1 MPI spectra do not agree with either calculated or observed absorption intensities. In table 7 the MPI intensities are com- pared with values for photoabso~tion cross sections and intensities [ 5,7,10,11] from electron energy loss spectroscopy (EELS) [28]. Stahel et al. [ 121 calcu- lated relative absorption intensities in a treatment where the interference between the b ‘H, valence state and two Rydberg states of the same symmetry, de- noted by c ‘II, and o ‘I&, were induded. Only the two ratios of the deperturbed electronic transition mo- ments, (b-X)/(c-X) and (b-X)/(0-X), were fit- ted to the EELS data; the vibrational intensity distri- bution, including the detailed vibronic intensity interferences, was found from the energy depertur- bation without additional fitting to the observed in-
W. Ubachs et al. / I + 1 MPI of NJ b ‘lI,,
14N, b’I-l, v’= 3 BANDHEAD
12 10 8 8 4 2 P I I I I I I : I ! i
14 12 10 8 8 421 Q I I I 1 I I ! I i i:.::
4. 0.1. 12 10 8 85
I , I I,' :: 2,3 R
: :
I I I I I
97.3 97.25 97.2
XUV Wavelength (nm)
Fig. 5. Bandhead portion of the I XUV+ 1 UV MPI spectrum of N2 b r&-X ‘Xc (3,0) band. Solid lines denote transitions observed
by Carroll and Collins [ 5 ] and broken lines denote transitions assigned by the extrapolation procedure. Acetylene was used as the tripling medium and the dye laser was operated without the intracavity etalon providing an instrumental linewidth of 1.2 cm-‘.
tensity distribution. The calculations are in agree- ment with the global features of observed intensities of photoabsorption cross sections, not only for the lowest vibrational levels as discussed here but also for the higher levels up to zi= 15, including the sharp in- tensity falloffs at V= 5 and 8. This indicates that the one-photon excitation of the b ‘II, state is well
understood. When compared with absorption data, the b ‘II,
v= 1, 5, 6 and 7 levels appear relatively strong in the
Table 6
Observed linewidths and calculated lifetimes for the 14NZ b ‘TI, v
levels
v level AQ,~ (cm-’ )
0 0.50+0.05 1 0.28 * 0.02 2 0.65 * 0.06 3 3.2 kO.5 4 0.6Orf:O.O7 5 0.28+0.02
5” (PS)
16 &3 >150
10 IL2
1.6kO.3
11 +2
>I50
MPI spectra; this is the behavior expected for unpre- dissociated levels. The observed 1 + 1 MPI spectral intensities (see fig. 6) are a factor 8 (v=O), 13 (v=2), 230 (u=3), and 40 (~=4) weaker relative to the V= 1 level when the calculated absorption strengths [ 12 ] are accounted for (see table 7 ). These factors indicate again, at least qualitatively, that the u=3 level is very strongly predissociated, while the u= 2 and 4 levels show less predissociation. The line intensity loss on the v=4 level is more than the loss on the V= 2 level, while the predissociation rates are the same within experimental error. At the same time, however, Stahel et al. [ 12 ] used a value for the rela- tive absorption cross section for v= 4 in their analysis based on the work of Geiger and Schroeder [ 28 1. This value is higher than the more recent synchrotron value of Giirtler et al. [ 7 1, but the synchrotron data appear to be taken at such a high number density (see Law- rence, Mickey and Dressler [ lo] ) that the absolute oscillator strengths are affected by line saturation. Although the lower value for a,,,(v=4) from the synchrotron data would bring the present MPI inten-
10 W. Ubachs et al. / I+ 1 MPI qf NJ b ‘rr,,
99.0 98.5 98.0
97.5 97.0 96.5
XUV WAVELENGTH (nm)
Fig. 6. Overview spectrum of the N2 b ‘II-X ‘Z: system covering the (~0) bands for v=O to 4. The numbers next to the different bands
represent a multiplication factor for the sensitivity of the detector.
sities in agreement with the lifetimes and predisso- the predissociated levels discussed here. The smallest ciation rates, the use of these data does not appear to change in intensity for this level is consistent with this be justified. The u= 0 level has the longest lifetime of fact.
Table 7
Cross sections for different “‘NZ b ITI,-X ‘I?Il vibronic transitions. The photoabsorption data are given as absolute cross sections (in
Mb), while the data in the last three columns represent relative cross sections
L’ Photoabsorption
a) b) c) d)
EELS ” Calc. f’ 1+1 MPI”’
0 18 28 34 3 1 57 16 160 153 100 2 253 75 80 350 385 20 3 357 124 200 300 640 712 2 4 321 125 550 100 1000 912 I5 5 44 30 16 50 40 15
a) Giirtler et al. [ 71; absorption of synchrotron radiation.
bJ Carter [ 91; absorption of a helium lamp continuum, derived from fig. 3 of this reference.
‘) Lawrence et al. [ lo]: calculated from oscillator strength, thereby settingf=0.055 equal to 550 Mb.
d’ Huffman et al. [ 111: absorption of a helium lamp continuum. The cross sections in Mb were calculated from absorption strengths k in cm-‘.
‘) Geiger and Schroeder 128 1; electron energy loss of 25 keV electrons. ‘) Stahel et al. [ 121; calculations, fitted and normalized to data under e). g) This work.
W. Vbachs et al. / I + 1 MPI of NJ b ‘l7, II
The 1 + 1 MPI signal intensity for the U= 5 level is a factor of 7 lower than for the v= 1 level. In the EELS data [ 281 and in the calculation [ 121 the intensity reduction for v= 5 relative to v= 1 is only a factor 3- 4, whereas in the photoabsorption measurements [ 7,111 both bands appear equally strong. The rela- tively low intensity on the v=5 level might be ex- plained by a slow rate of predissociation not detect- able by line broadening.
5. Discussion
The Nz b ‘II, state is a celebrated example of pre- dissociation in diatomic molecules [ 201. The first quantitative analysis of predissociation rates as a function of vibrational level was performed by Leoni and Dressler [ 151 for the Nz b-X band system. The N2 b ‘II, state lies above the N(4S)+N(4S) and N( 4S) +N( *D) dissociation limits and is exten- sively predissociated. Using photoelectric recording and fitting the band profiles as a function of pressure, Leoni and Dressler deduced the widths for the v=O, 1,2,3,and41evels:~o=0.13cm-‘,~l<0.003cm-’, r,=O.20 cm-‘, r,=20.0 cm-‘, and r,=O.25 cm-’ where r represents the width caused by predissocia- tion. Leoni and Dressler suggested that an interac- tion between the b ‘II, state and the continuum of the C’ 311U state was responsible for the predissocia- tion of the b ‘II, state. This direct (spin-orbit) pre- dissociation mechanism is able to predict that the U= 0 and 2 levels are broadened by the amount observed, while the U= 1 level remains sharp. However, this model cannot account for the unusually large width of the v=3 level and the more modest width of the U= 4 level. Leoni and Dressler suggested that the b ‘II, v= 3 level interacts with a nearby diffuse level iden- tified as the F 311U v= 0 level, based on the observa- tion by Ogawa and Tanaka [ 29 ] of higher members of this triplet Rydberg series. The diffuseness of the levels of the F 311, state is postulated to arise from an interaction with the continuum of the C’ 3HU state. Leoni and Dressler speculate that this coupling may also contribute to the observed widths of the b ‘II, v=2 and v=4 levels.
The triplet states of Nz have been studied by Joyez et al. [ 301 using electron impact. Two types of exper- iments were performed: (1) electron energy loss
measurements for various scattering angles at a fixed incident energy ( 14.3 eV); and (2 ) threshold energy electron measurements in which nearly zero kinetic energy electrons are recorded as a function of the in- cident electron energy for the range 11.8-l 3.8 eV as well as scattering angle. In the energy loss spectra the dominant features, which showed no angular depen- dence, correspond to vibrational excitation of the b ‘II, state. In threshold excitation spectra the b ‘II, state is only weakly excited and the spectrum is dom- inated by features assigned to various vibrational levels of different triplet states. Joyez et al. were able to identify three vibrational levels of a singlet-triplet system on the basis of angular dependence of the in- tensity whose upper levels were assigned to ZI= 1, 2, and 3 of the F 311U state. This assignment would make the v= 0 level of the F 311U state coincide with the b ‘II, v= 3 level, in support of Leoni and Dressler’s inter- pretation. However, the angular dependence of the peak at b ‘II, v= 3 did not indicate an appreciable triplet contribution.
More recently, Hammond et al. [ 311 have re- corded the threshold electron energy spectrum of N2 at higher resolution. Their measurements support the suggestion of Joyez et al. [ 301 that the F 311U state is excited at threshold. Hammond et al. conclude that the b ‘II, v= 3 feature in their threshold energy spec- trum may be a sum of the direct excitation of the b ‘II” U= 3 and F 311U v=O levels and a resonance decay to
either or both of these states. Robbe [ 16 ] reinvestigated the predissociation of
the b ‘II, v= 3 level using photographic techniques. He found a significantly smaller width for the v=3 level than Leoni and Dressler, namely, Av3=3 cm-’ for 14N2 and Au3 - - 1.5 cm-’ for 15Nz, corresponding to r3=2.7 cm-’ for 14N2 and r,= 1 cm-’ for 15N2. Robbe proposed an alternative explanation for the large width of the b ‘II, v= 3 level. The b ‘II, v= 3 level interacts strongly by spin-orbit coupling with the quasi-degenerate C 311U v= 8 level which, in turn, is predissociated by the continuum levels of the C’ 311U state. This interpretation is the one favored by Le- febvre-Brion and Field [ 201. Both spectroscopic and predissociation phenomena in the C ‘II, and C’ 311U states have been studied by Carroll and Mulliken [ 321 and by Ledbetter and Dressler [ 33 1. From a calcu- lation of spin-orbit matrix elements between the C 311U and b ‘II” states, Robbe derived a width
12 B< Ubachs et al. / I + I MPI ojN> b ‘Ii’,
r )._,= = 1.7 cm- ‘, somewhat smaller than the experi- mental value. However, the calculated line broaden- ing for vibrational levels other than v= 3 on the basis of these matrix elements is much smaller than ob- served. Consequently, an interaction with the C 311u state cannot account for all the predissociation effects.
Robbe argues against the hypothesis that the F 311u v= 0 level is the main perturber of the b ‘II” u= 3 level. Actually, Robbe [ 161 prefers to renumber the vibra- tional levels of the F311, state so that the level as- signed by Joyez et al. [ 301 and by Hammond et al. [ 3 1 ] to u= 1 is instead u= 0. Even if the F 311, v= 0 level is coincident with the b ‘II, v= 3 level, Robbe believes that these two levels are not coupled by spin- orbit interaction because the electronic conligura- tions of the F and b states differ by two molecular orbitals. In contrast, the configurations of the C and b states are the same in the energy region considered. Although the v= 8 level of the state has not been di- rectly observed, Hammond et al. have identified in the energy region near 11 eV the first four vibrational levels of this state, but the intensity in their threshold energy spectrum decreased rapidly with increasing v.
In the present study, we have determined accurate linewidths for the v=O, 2, 3 and 4 levels of the 14Nz b ‘II, state from which we have derived the following predissociation widths: r, = 0.34 rt 0.05 cm- ‘, r, = 0.53kO.05 cm-‘, r,=3.2+0.5 cm-‘, and r,= 0.47 kO.05 cm-‘. Comparison with the previous work of Leoni and Dressler shows that their widths are a factor of 2.5 smaller except for v= 3, which is excessively large. Leoni and Dressler determined natural linewidths from a curve of growth analysis by measuring apparent absorption at different pres- sures. They did not directly measure the linewidths because their experimental apparatus provided an instrumental width of only 4 cm-‘. In contrast, our linewidths were directly measured from our spectra. Our measurement of r3 agrees within experimental error with that of Robbe. Leoni and Dressler suggest that their 20.0 cm-’ width applies to the low Jlevels of the b ‘II, v= 3 level. However, we have examined the (3,O) bandhead which is formed at low J and found closely spaced structure (see fig. 5 ) . Because of the congestion at the bandhead, we cannot deter- mine a linewidth, but we estimate an upper limit for the linewidth of the lower J levels to be r3 (low J) < 5.8 cm- ‘.
The dispute between the interpretations of Leoni and Dressler [ 15 ] and that of Robbe [ 16 ] concerns whether the b ‘II, v= 3 level interacts with the disso- ciative C’ ‘II, state via the F 311u v= 0 level or the C ‘II, u= 8 level. Unfortunately, the electron impact data of Joyez et al. [ 30 ] and Hammond et al. [ 3 1 ] cannot resolve this question unambiguously, and the possibility of both interactions contributing has not been ruled out. Our own measurements also do not settle this question, although they contribute to a bet- ter understanding of the predissociation rate. It may be that the observed accidental predissociation of the b ‘II, state is more complicated than previously
suspected.
Acknowledgement
We thank R.W. Field for making available to us the thesis of J.M. Robbe and gratefully acknowledge the valuable comments from K. Dressler and H. Le- febvre-Brion. We would also like to acknowledge the National Science Foundation under NSF PHY 85- 06668 for its support of this research.
References
[ 1 ] J.F. Reintjes, Nonlinear optical parametric processes in
liquids and gases (Academic Press, New York, 1984 )
[2] E.E. Marinero, CT. Rettner, R.N. Zare and A.H. Kung, J.
Phys. Chem. 88 (1983) 486.
[ 3 ] T.P. Softley, W.E. Ernst. L.M. Tashiro and R.N. Zare, Chem.
Phys. 116 (1987) 299.
[4] R.H. Page, R.J. Larkin, A.H. Kung, Y.R. ShenandY.T. Lee,
Rev. Sci. Instr. 58 (1987) 1616.
[ 51 P.K. Carroll and C.P. Collins, Can. J. Phys. 47 (1969) 563.
[6] K.J. RaJan, Proc. Roy. Irish Acad. 74A ( 1974) 17.
[ 71 P. Giirtler, V. Saile and E.E. Koch, Chem. Phys. Letters 48
(1977) 245.
[ 81 K. Dressler. Can. J. Phys. 47 (1969) 547.
[9] V. Carter, J. Chem. Phys. 56 (1972) 4195.
[lo] G.M. Lawrence, D.L. Mickey and K. Dressier. I. Chem.
Phys. 48 (1968) 1989.
[ 111 R. Huffman, Y. Tanaka and J.C. Larrabee. J. Chem. Phys.
39 (1963) 910.
[ 121 P. Stahel, M. Leoni and K. Dressier, J. Chem. Phys. 79
(1983) 2541. [ 131 J. Bendtsen, J. Ram. Spectry. 2 (1974) 133.
[ 141 ST. Pratt, P.M. Dehmer and J.L. Dehmer, J. Chem. Phys.
81 (1984) 3444.
W. Ubachs et al. / 1 + 1 MPI of N2 b ‘II. 13
[ 151 M. Leoni and K. Dressler, J. Appl. Math. Phys. (ZAMP) [ 241 J. Janin, Compt. Rend. Acad. Sci. (Paris) 217 ( 1943) 392; 22 (1971) 794. 223 (1946) 321.
[ 161 J.M. Robbe, Ph.D. Thesis, Universite des Sciences et
Techniques de Lille, 1978, Lille, France. [ 171 L. Tashiro, W. Ubachs and R.N. Zare, unpublished results. [ 181 S. Gerstenkom and P. Luc, Atlas du spectroscopic de la
molecule d’iode (CNRS, Paris, 1978). [ 191 S. Gerstenkom and P. Luc, Rev. Phys. Appl. 14 ( 1979) 791. [20] H. Lefebvre-Brion and R.W. Field, Perturbations in the
spectra of diatomic molecules (Academic Press, New York, 1986).
[25] A. Lofthus, Can. J. Phys. 35 (1957) 216.
[ 261 A.G. Gaydon, Proc. Roy. Sot. A 182 ( 1944) 286.
[27] S.G. Tilford and P.G. Wilkinson, J. Mol. Spectry. 12 ( 1964)
231.
[ 281 J. Geiger and B. Schroeder, J. Chem. Phys. 50 ( 1969) 7.
[29] M. Ogawa and Y. Tanaka, Can. J. Phys. 40 ( 1962) 1593.
[ 301 G. Joyez, R.I. Hall, J. Reinhardt and J. Mazeau, J. Electron
Spectry. 2 (1973) 873.
[ 211 J.T. Vanderslice, S.G. Tilford and P.G. Wilkinson,
Astrophys. J. 142 (1965) 84. [22] G.H. Herzberg, Spectra of diatomic molecules (Van
Nostrand, Princeton, 1950). [23] S.N. Dobryakov and Y.S. Lebedev, Soviet Phys. Dokl. 13
(1969) 873.
[31] P. Hammond, G. King, J. Jureta and F.H. Read, J. Phys. B
20 (1987) 4255.
[32] P.K. Carroll and R.S. Mulliken, J. Chem. Phys. 43 (1965)
2170.
[33] J.W. Ledbetter and K. Dressler, J. Mol. Spectry. 63 ( 1976)
370.