Study of m n Oscillation via 2-D ECEI in a Low Tokamak Plasma
8
1 EXS/10-1Rb Study of m/n = 1/1 and High-order Harmonic Modes During the Sawtooth Oscillation via 2-D ECEI in a Low β Tokamak Plasma X.Y. Xu 1), M. Xu 1), J. Wang 1), Y.Z. Wen 1), C.X. Yu 1), B.X. Gao 1), C. Luo 1) B.N. Wan 2), X. Gao 2) 1) CAS Key Laboratory of Basic Plasma Physics, Department of Modern Physics, University of Science and Technology of China 2) Institute of Plasma Physics, Chinese Academy of Sciences Email contact of main author: [email protected] Abstract The high-order harmonic modes (m,n≥2), along with m = n = 1 mode, in the sawtooth precursor, and the occurrence of the reconnection process during the sawtooth crash have been demonstrated (Plasma Phys. Control. Fusion, 52 (2010) 015008). The harmonics and sawtooth collapse in lower β p are compared with the theoretical model in further. Assuming constant rotation period on the q = 1 radius, circumference images on the q = 1 radius are recovered from the rectangular region of ECEI. The rotation period is estimated about T = 240 μs. The time space between the neighboring island is about Δt. The higher-order harmonics can therefore be inferred to be m = T /Δt on the q = 1 radius. The circumference images show the heat flow collapses through multiple penetration position on the q = 1 radius. The wavelet spectrum shows that the frequency of the m = 1, 2, 3, 4 is about f = 4.5, 9, 13.5, 18kHz. The high-order harmonic mode is sensitive to the electron density ( β p ) and the q profile. It is found that at a fixed q a value, in the case of low density plasma, the maximum amplitude of the m/n=1/1 mode and the harmonics are about the same; when the density increases above a threshold, the maximum amplitude of the m/n = 1/1 mode significantly increases, while that of the harmonics remains or decreases to a lower level. The threshold ¯ n e,crit ∝ 1/q a as q a value increases from q a = 2.9 to q a = 4.2. The dependence of the edge MHD 3/1 mode on the electron density is similar to the 1/1 mode. The 3/1 mode is compared with a stability diagram of the ideal MHD theory. The stability diagram of the ideal MHD mode shows the occurrence of the modes depending on both q a and q 0 value. The higher q 0 is expected corresponding to higher electron density: q 0 ∝ ¯ n e . Moreover, the density threshold ¯ n e,crit ∝ 1/q a of the harmonics is reasonable according to the theory. Assuming a monotonically increasing q profile, the stochasticity is predicted to depend on q 0 in some recent investigations (Nucl. Fusion, 47 (2007) 23). 1 Introduction To understand the mechanism underlying the sawtooth crash, Kadomtsev firstly proposed a 2D full Reconnection model [1]. The model points out the safety factor q is greater than unity inside the q = 1 surface before the sawtooth crash. As the electron temperature increases, once the q 0 on the magnetic axis is lower than 1. The circular hot core will move from the magnetic axis to the q = 1 radius, and reconnection happens there. On the opposite side, a cold crescent island forms simultaneously. As the reconnection processes, the hot core collapses out of the q = 1 radius, accompanying with the crescent island growing, and occupying the region inside the q = 1 radius. And it causes the center q 0 to recover above 1. In large tokamaks, the q 0 not always recover above 1 [2, 3, 4]. And the crash time is much longer than that predicted by the theory. Along with the contradiction, all kinds of models are proposed. The quasi-interchange model predicts a crescent hot spot and the cooler part of the plasma convects into the core. 3-D
Transcript of Study of m n Oscillation via 2-D ECEI in a Low Tokamak Plasma
1 EXS/10-1Rb
Study of m/n = 1/1 and High-order Harmonic Modes During the SawtoothOscillation via 2-D ECEI in a Low β Tokamak Plasma
X.Y. Xu 1), M. Xu 1), J. Wang 1), Y.Z. Wen 1), C.X. Yu 1), B.X. Gao 1), C. Luo 1)B.N. Wan 2), X. Gao 2)
1) CAS Key Laboratory of Basic Plasma Physics, Department of Modern Physics, Universityof Science and Technology of China2) Institute of Plasma Physics, Chinese Academy of Sciences
Email contact of main author: [email protected]
Abstract The high-order harmonic modes (m,n≥2), along with m = n = 1 mode, in the sawtooth precursor, and theoccurrence of the reconnection process during the sawtooth crash have been demonstrated (Plasma Phys. Control.Fusion, 52 (2010) 015008). The harmonics and sawtooth collapse in lower βp are compared with the theoreticalmodel in further. Assuming constant rotation period on the q = 1 radius, circumference images on the q = 1radius are recovered from the rectangular region of ECEI. The rotation period is estimated about T = 240 µs. Thetime space between the neighboring island is about ∆t. The higher-order harmonics can therefore be inferred tobe m = T/∆t on the q = 1 radius. The circumference images show the heat flow collapses through multiplepenetration position on the q = 1 radius. The wavelet spectrum shows that the frequency of the m = 1, 2, 3, 4 isabout f = 4.5, 9, 13.5, 18kHz. The high-order harmonic mode is sensitive to the electron density ( βp ) and theq profile. It is found that at a fixed qa value, in the case of low density plasma, the maximum amplitude of them/n=1/1 mode and the harmonics are about the same; when the density increases above a threshold, the maximumamplitude of the m/n = 1/1 mode significantly increases, while that of the harmonics remains or decreases to alower level. The threshold ne,crit ∝ 1/qa as qa value increases from qa = 2.9 to qa = 4.2. The dependence ofthe edge MHD 3/1 mode on the electron density is similar to the 1/1 mode. The 3/1 mode is compared with astability diagram of the ideal MHD theory. The stability diagram of the ideal MHD mode shows the occurrenceof the modes depending on both qa and q0 value. The higher q0 is expected corresponding to higher electrondensity: q0 ∝ ne. Moreover, the density threshold ne,crit ∝ 1/qa of the harmonics is reasonable according to thetheory. Assuming a monotonically increasing q profile, the stochasticity is predicted to depend on q0 in somerecent investigations (Nucl. Fusion, 47 (2007) 23).
1 IntroductionTo understand the mechanism underlying the sawtooth crash, Kadomtsev firstly proposed a 2Dfull Reconnection model [1]. The model points out the safety factor q is greater than unityinside the q = 1 surface before the sawtooth crash. As the electron temperature increases, oncethe q0 on the magnetic axis is lower than 1. The circular hot core will move from the magneticaxis to the q = 1 radius, and reconnection happens there. On the opposite side, a cold crescentisland forms simultaneously. As the reconnection processes, the hot core collapses out of theq = 1 radius, accompanying with the crescent island growing, and occupying the region insidethe q = 1 radius. And it causes the center q0 to recover above 1. In large tokamaks, the q0 notalways recover above 1 [2, 3, 4]. And the crash time is much longer than that predicted by thetheory.
Along with the contradiction, all kinds of models are proposed. The quasi-interchangemodel predicts a crescent hot spot and the cooler part of the plasma convects into the core. 3-D
2 EXS/10-1Rb
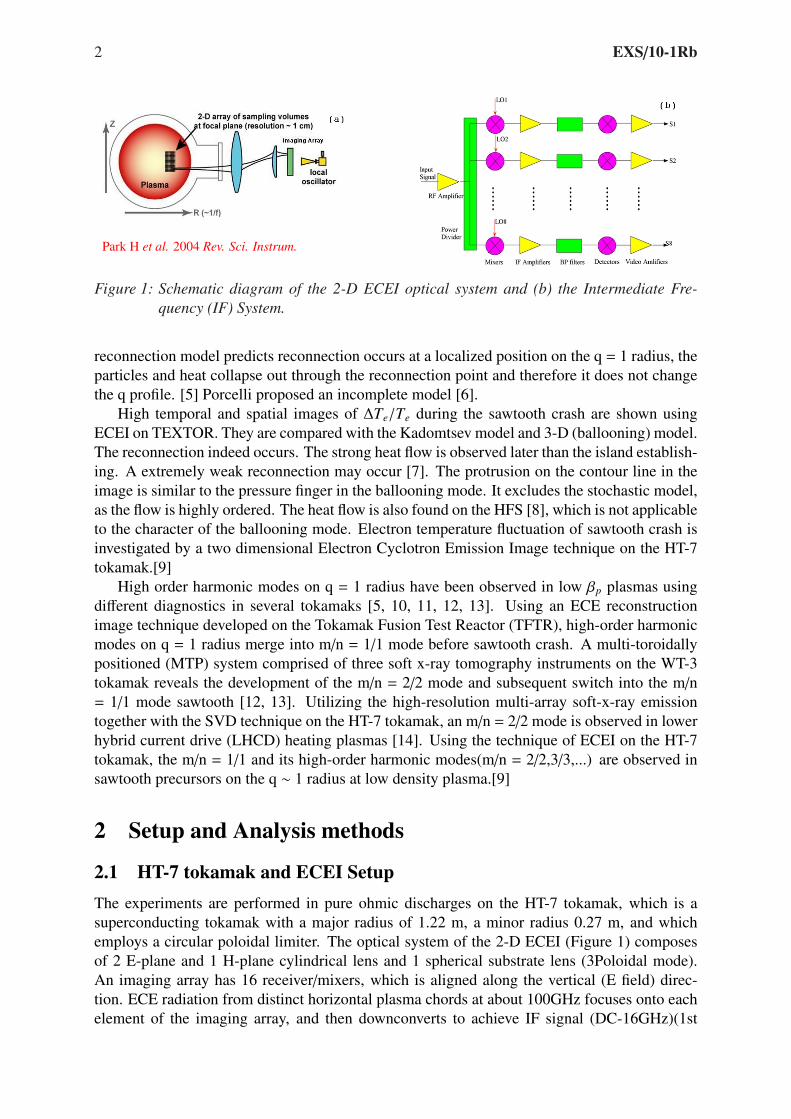
Park H et al. 2004 Rev. Sci. Instrum.
Figure 1: Schematic diagram of the 2-D ECEI optical system and (b) the Intermediate Fre-quency (IF) System.
reconnection model predicts reconnection occurs at a localized position on the q = 1 radius, theparticles and heat collapse out through the reconnection point and therefore it does not changethe q profile. [5] Porcelli proposed an incomplete model [6].
High temporal and spatial images of ∆Te/Te during the sawtooth crash are shown usingECEI on TEXTOR. They are compared with the Kadomtsev model and 3-D (ballooning) model.The reconnection indeed occurs. The strong heat flow is observed later than the island establish-ing. A extremely weak reconnection may occur [7]. The protrusion on the contour line in theimage is similar to the pressure finger in the ballooning mode. It excludes the stochastic model,as the flow is highly ordered. The heat flow is also found on the HFS [8], which is not applicableto the character of the ballooning mode. Electron temperature fluctuation of sawtooth crash isinvestigated by a two dimensional Electron Cyclotron Emission Image technique on the HT-7tokamak.[9]
High order harmonic modes on q = 1 radius have been observed in low βp plasmas usingdifferent diagnostics in several tokamaks [5, 10, 11, 12, 13]. Using an ECE reconstructionimage technique developed on the Tokamak Fusion Test Reactor (TFTR), high-order harmonicmodes on q = 1 radius merge into m/n = 1/1 mode before sawtooth crash. A multi-toroidallypositioned (MTP) system comprised of three soft x-ray tomography instruments on the WT-3tokamak reveals the development of the m/n = 2/2 mode and subsequent switch into the m/n= 1/1 mode sawtooth [12, 13]. Utilizing the high-resolution multi-array soft-x-ray emissiontogether with the SVD technique on the HT-7 tokamak, an m/n = 2/2 mode is observed in lowerhybrid current drive (LHCD) heating plasmas [14]. Using the technique of ECEI on the HT-7tokamak, the m/n = 1/1 and its high-order harmonic modes(m/n = 2/2,3/3,...) are observed insawtooth precursors on the q ∼ 1 radius at low density plasma.[9]
2 Setup and Analysis methods
2.1 HT-7 tokamak and ECEI SetupThe experiments are performed in pure ohmic discharges on the HT-7 tokamak, which is asuperconducting tokamak with a major radius of 1.22 m, a minor radius 0.27 m, and whichemploys a circular poloidal limiter. The optical system of the 2-D ECEI (Figure 1) composesof 2 E-plane and 1 H-plane cylindrical lens and 1 spherical substrate lens (3Poloidal mode).An imaging array has 16 receiver/mixers, which is aligned along the vertical (E field) direc-tion. ECE radiation from distinct horizontal plasma chords at about 100GHz focuses onto eachelement of the imaging array, and then downconverts to achieve IF signal (DC-16GHz)(1st
3 EXS/10-1Rb
mixing). The IF signal is then divided into 8 sub-signals and downconverts with 8 distinct LOs.The resultant signal are amplified, bandpass filtered and detected. The resultant effective IFbandwidth (double side band) is 300 MHz. After the 2nd mixing, the ECEI has 8 channelscorresponding to 8 narrow discrete band signals from each element of the array.
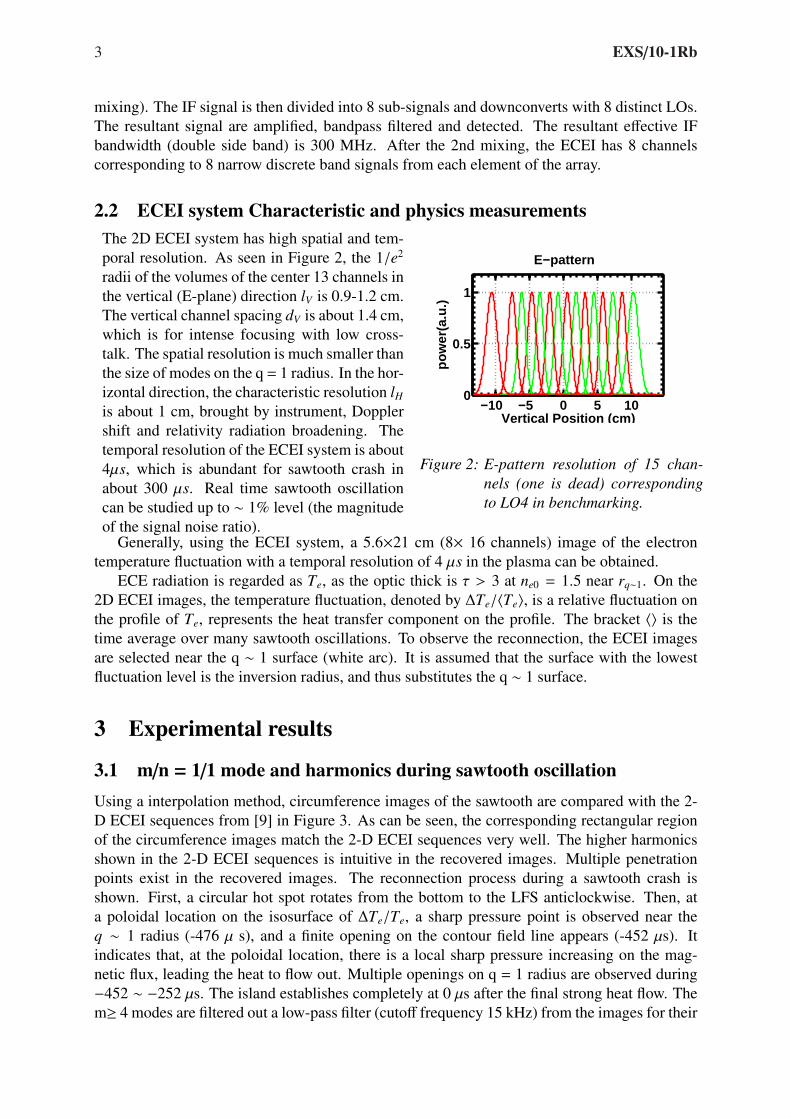
2.2 ECEI system Characteristic and physics measurementsThe 2D ECEI system has high spatial and tem-poral resolution. As seen in Figure 2, the 1/e2
radii of the volumes of the center 13 channels inthe vertical (E-plane) direction lV is 0.9-1.2 cm.The vertical channel spacing dV is about 1.4 cm,which is for intense focusing with low cross-talk. The spatial resolution is much smaller thanthe size of modes on the q = 1 radius. In the hor-izontal direction, the characteristic resolution lH
is about 1 cm, brought by instrument, Dopplershift and relativity radiation broadening. Thetemporal resolution of the ECEI system is about4µs, which is abundant for sawtooth crash inabout 300 µs. Real time sawtooth oscillationcan be studied up to ∼ 1% level (the magnitudeof the signal noise ratio).
−10 −5 0 5 100
0.5
1
Vertical Position (cm)
pow
er(a
.u.)
E−pattern
Figure 2: E-pattern resolution of 15 chan-nels (one is dead) correspondingto LO4 in benchmarking.
Generally, using the ECEI system, a 5.6×21 cm (8× 16 channels) image of the electrontemperature fluctuation with a temporal resolution of 4 µs in the plasma can be obtained.
ECE radiation is regarded as Te, as the optic thick is τ > 3 at ne0 = 1.5 near rq∼1. On the2D ECEI images, the temperature fluctuation, denoted by ∆Te/〈Te〉, is a relative fluctuation onthe profile of Te, represents the heat transfer component on the profile. The bracket 〈〉 is thetime average over many sawtooth oscillations. To observe the reconnection, the ECEI imagesare selected near the q ∼ 1 surface (white arc). It is assumed that the surface with the lowestfluctuation level is the inversion radius, and thus substitutes the q ∼ 1 surface.
3 Experimental results
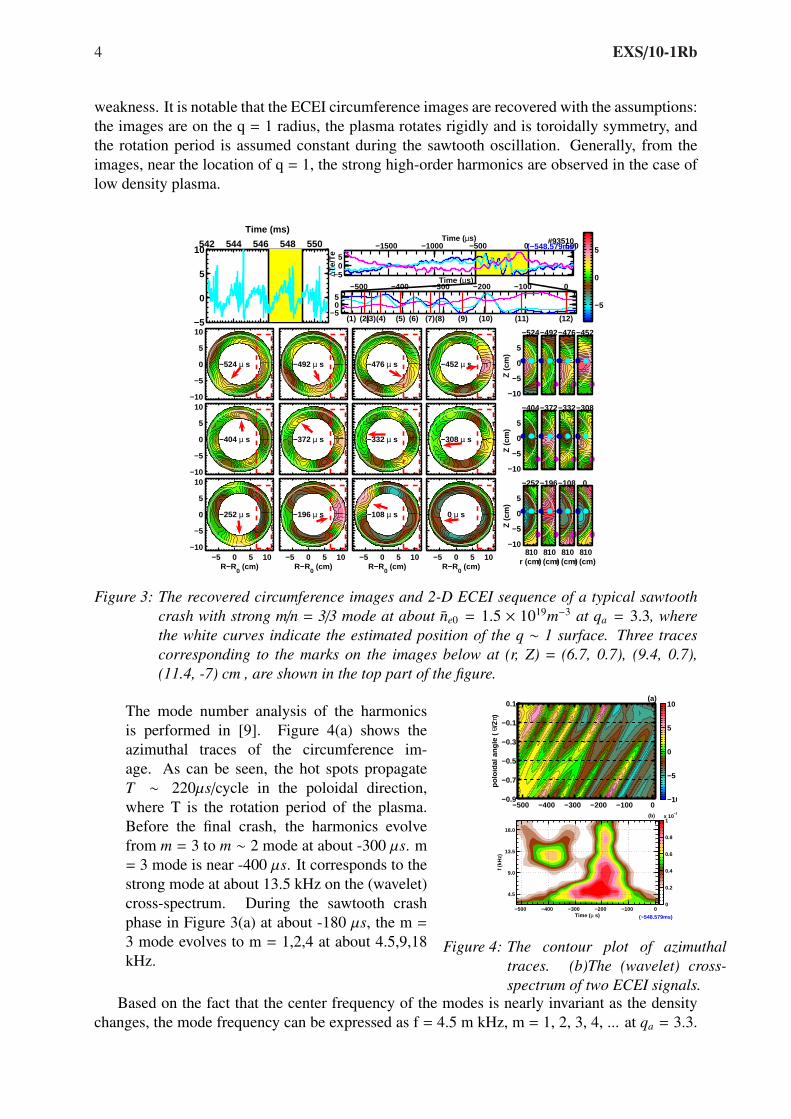
3.1 m/n = 1/1 mode and harmonics during sawtooth oscillationUsing a interpolation method, circumference images of the sawtooth are compared with the 2-D ECEI sequences from [9] in Figure 3. As can be seen, the corresponding rectangular regionof the circumference images match the 2-D ECEI sequences very well. The higher harmonicsshown in the 2-D ECEI sequences is intuitive in the recovered images. Multiple penetrationpoints exist in the recovered images. The reconnection process during a sawtooth crash isshown. First, a circular hot spot rotates from the bottom to the LFS anticlockwise. Then, ata poloidal location on the isosurface of ∆Te/Te, a sharp pressure point is observed near theq ∼ 1 radius (-476 µ s), and a finite opening on the contour field line appears (-452 µs). Itindicates that, at the poloidal location, there is a local sharp pressure increasing on the mag-netic flux, leading the heat to flow out. Multiple openings on q = 1 radius are observed during−452 ∼ −252 µs. The island establishes completely at 0 µs after the final strong heat flow. Them≥ 4 modes are filtered out a low-pass filter (cutoff frequency 15 kHz) from the images for their
4 EXS/10-1Rb
weakness. It is notable that the ECEI circumference images are recovered with the assumptions:the images are on the q = 1 radius, the plasma rotates rigidly and is toroidally symmetry, andthe rotation period is assumed constant during the sawtooth oscillation. Generally, from theimages, near the location of q = 1, the strong high-order harmonics are observed in the case oflow density plasma.
542 544 546 548 550
−5
0
5
10
Time (ms)
2
−524 µ s
−10
−5
0
5
10
−492 µ s −476 µ s −452 µ s
−404 µ s
−10
−5
0
5
10
−372 µ s −332 µ s −308 µ s
R−R0 (cm)
−252 µ s
−5 0 5 10−10
−5
0
5
10
R−R0 (cm)
−196 µ s
−5 0 5 10R−R
0 (cm)
−108 µ s
−5 0 5 10R−R
0 (cm)
0 µ s
−5 0 5 10
−1500 −1000 −500 0 500
−505
Time (µs)(~548.579ms)
#93510
∆Te/
Te
−500 −400 −300 −200 −100 0
−505
Time (µs)
(1) (2)(3)(4) (5) (6) (7)(8) (9) (10) (11) (12)
−524
Z (
cm)
−10
−5
0
5
−492−476−452
−404
Z (
cm)
−10
−5
0
5
−372−332−308
−252
r (cm)
Z (
cm)
810−10
−5
0
5
−196
r (cm)810
−108
r (cm)810
0
r (cm)
810
−5
0
5
Figure 3: The recovered circumference images and 2-D ECEI sequence of a typical sawtoothcrash with strong m/n = 3/3 mode at about ne0 = 1.5 × 10¹⁹m−3 at qa = 3.3, wherethe white curves indicate the estimated position of the q ∼ 1 surface. Three tracescorresponding to the marks on the images below at (r, Z) = (6.7, 0.7), (9.4, 0.7),(11.4, -7) cm , are shown in the top part of the figure.
The mode number analysis of the harmonicsis performed in [9]. Figure 4(a) shows theazimuthal traces of the circumference im-age. As can be seen, the hot spots propagateT ∼ 220µs/cycle in the poloidal direction,where T is the rotation period of the plasma.Before the final crash, the harmonics evolvefrom m = 3 to m ∼ 2 mode at about -300 µs. m= 3 mode is near -400 µs. It corresponds to thestrong mode at about 13.5 kHz on the (wavelet)cross-spectrum. During the sawtooth crashphase in Figure 3(a) at about -180 µs, the m =
3 mode evolves to m = 1,2,4 at about 4.5,9,18kHz.
polo
idal
ang
le (
θ/
2π)
(a)
−500 −400 −300 −200 −100 0−0.9
−0.7
−0.5
−0.3
−0.1
0.1
−10
−5
0
5
10
Time (µ s)
f (kH
z)
(b)
(~548.579ms)
−500 −400 −300 −200 −100 0
4.5
9.0
13.5
18.0
0
0.2
0.4
0.6
0.8
1x 10
−5
Figure 4: The contour plot of azimuthaltraces. (b)The (wavelet) cross-spectrum of two ECEI signals.
Based on the fact that the center frequency of the modes is nearly invariant as the densitychanges, the mode frequency can be expressed as f = 4.5 m kHz, m = 1, 2, 3, 4, ... at qa = 3.3.

5 EXS/10-1Rb
Time (µs)
f (kH
z)
546 548 550 552 554 556
4.59.0
13.518.022.527.031.5
0
1
2
3
4x 10
−7
(a)
Time (µs)
f (kH
z)
600 605 610 615
4.59.0
13.518.022.527.031.5
0
1
2
3
4x 10
−7
(b)
Figure 5: The (wavelet) cross-spectrum of two ECEI signals for several sawteeth at (a) lowdensity ne0 = 1.5 × 10¹⁹m−3 and (b) high density ne0 = 3.1 × 10¹⁹m−3.
Figure 5 compares the spectrum at low and high density. As can be seen, at low density, themode frequency is mainly below 18 kHz. Only a few sawteeth have higher frequency. As aresult, using a low-pass filter with a cutoff frequency of 15 kHz is reasonable for 2D images ofthe sawtooth crash above. While at high density, the frequency is mainly around 4.5 kHz. Theharmonics are therefore concluded depending on the electron density. Moreover, the harmonicsdepend on qa value, which will be discussed later.
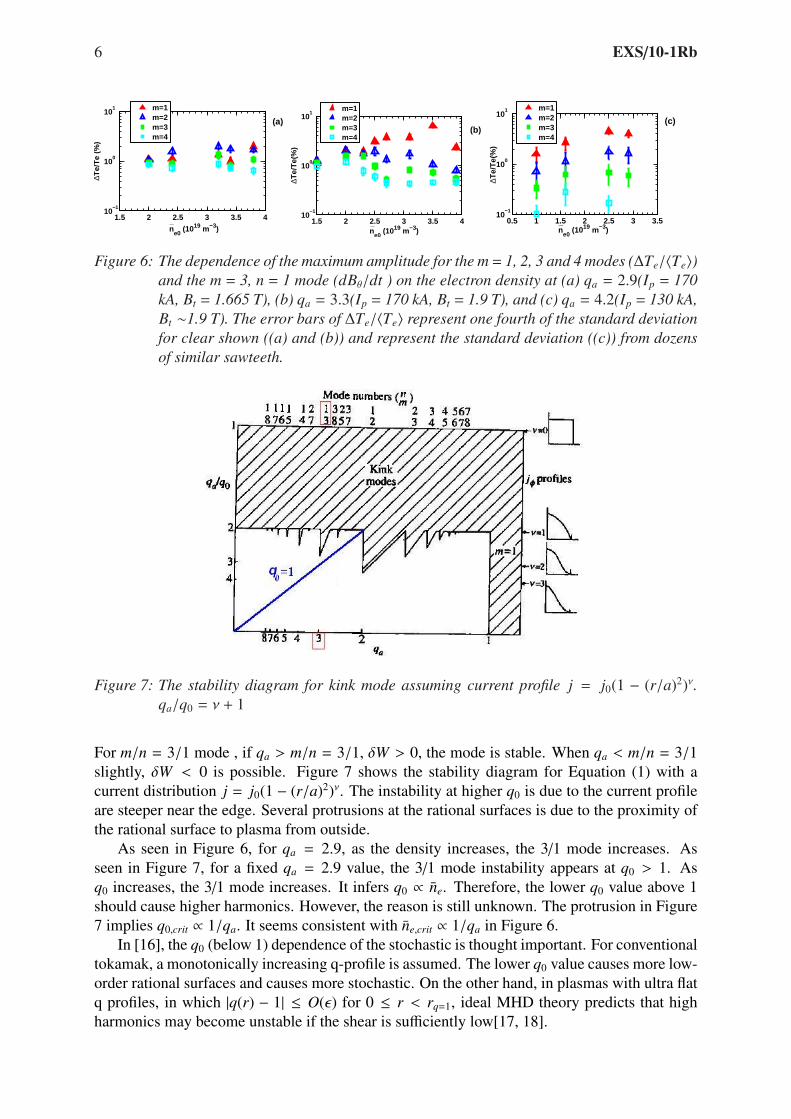
3.2 Parametric study of the amplitude of the modesAs the high-order harmonic mode is sensitive to the electron density ( βp ) and the q profile,the amplitude of the 1/1 mode and harmonics are investigated in further in Figure 6 at differentdensity and qa value. The modes with m = 1 ∼ 4 are filtered out respectively by a ChebyshevType II Bandpass Filter with a bandwidth of ±1 kHz and an attenuation of 20dB outside theband. As can be seen, at qa = 3.3, the 1/1 mode increases dramatically as the density exceedsne0 = 2.5 × 10¹⁹m−3. The higher harmonics are nearly invariant or decrease a little. It should bea density threshold for the m/n = 1/1 mode and harmonics. The threshold is found to decreaseas qa increases, which we try to understand in the following discussion. In order to understandthe harmonics on the q = 1 radius, the maximum amplitude of the m/n = 3/1 mode is shownin Figure 6. The 3/1 mode represented in Figure 6 is filtered out using a bandpass filter with acenter frequency of 4.5 kHz and bandwidth of ± 1 kHz using the signal from magnetic probes.As can be seen, the dependence of the edge MHD 3/1 mode on the electron density is similar tothe 1/1 mode.
4 DiscussionAccording to ideal MHD theory, for a circular, large aspect-ratio tokamak with low β(∼ ε2)tokamak (βp ∼ 1 ), the complete form of the potential energy of a kink mode perturbationincluding Wp and Wv in plasma are[15]
δW =π2B2
φ
µ0R{∫ a
0[(r
dξdr
)2 + (m2 − 1)ξ2](nm− 1
q)2rdr
+[2qa
(nm− 1
qa) + (1 + mλ)(
nm− 1
qa)2]a2ξa
2} (1)
6 EXS/10-1Rb
1.5 2 2.5 3 3.5 410
−1
100
101
∆Te/
Te
(%)
_ n
e0 (1019 m−3)
(a)
m=1m=2m=3m=4
1.5 2 2.5 3 3.5 410
−1
100
101
∆Te/
Te(
%)
(b)
_ n
e0 (1019 m−3)
m=1m=2m=3m=4
0.5 1 1.5 2 2.5 3 3.510
−1
100
101
∆Te/
Te(
%)
(c)
_ n
e0 (1019 m−3)
m=1m=2m=3m=4
Figure 6: The dependence of the maximum amplitude for the m = 1, 2, 3 and 4 modes (∆Te/〈Te〉)and the m = 3, n = 1 mode (dBθ/dt ) on the electron density at (a) qa = 2.9(Ip = 170kA, Bt = 1.665 T), (b) qa = 3.3(Ip = 170 kA, Bt = 1.9 T), and (c) qa = 4.2(Ip = 130 kA,Bt ∼1.9 T). The error bars of ∆Te/〈Te〉 represent one fourth of the standard deviationfor clear shown ((a) and (b)) and represent the standard deviation ((c)) from dozensof similar sawteeth.
Figure 7: The stability diagram for kink mode assuming current profile j = j0(1 − (r/a)2)ν.qa/q0 = ν + 1
For m/n = 3/1 mode , if qa > m/n = 3/1, δW > 0, the mode is stable. When qa < m/n = 3/1slightly, δW < 0 is possible. Figure 7 shows the stability diagram for Equation (1) with acurrent distribution j = j0(1 − (r/a)2)ν. The instability at higher q0 is due to the current profileare steeper near the edge. Several protrusions at the rational surfaces is due to the proximity ofthe rational surface to plasma from outside.
As seen in Figure 6, for qa = 2.9, as the density increases, the 3/1 mode increases. Asseen in Figure 7, for a fixed qa = 2.9 value, the 3/1 mode instability appears at q0 > 1. Asq0 increases, the 3/1 mode increases. It infers q0 ∝ ne. Therefore, the lower q0 value above 1should cause higher harmonics. However, the reason is still unknown. The protrusion in Figure7 implies q0,crit ∝ 1/qa. It seems consistent with ne,crit ∝ 1/qa in Figure 6.
In [16], the q0 (below 1) dependence of the stochastic is thought important. For conventionaltokamak, a monotonically increasing q-profile is assumed. The lower q0 value causes more low-order rational surfaces and causes more stochastic. On the other hand, in plasmas with ultra flatq profiles, in which |q(r) − 1| ≤ O(ε) for 0 ≤ r < rq=1, ideal MHD theory predicts that highharmonics may become unstable if the shear is sufficiently low[17, 18].
7 EXS/10-1Rb
5 Summary2D ECEI on the HT-7 tokamak measures ∆Te/ < Te >, a relative fluctuation on the profile of Te,represents the heat transfer component on the profile. It has a high spatial(∼ 1cm < island width)and temporal(4 µs� tcrash ∼300 µs) resolution. It provides a partial image on the q = 1 radiuswith about 1/4 of the poloidal circumference. The m/n = 1/1 mode and high-order(m,n≥2)harmonics in the precursor and the heat flow during the sawtooth crash are investigated deeply.Modes’ relationship with the density and qa are investigated in [9]. A density threshold exists forthe modes. At low density, the maximum amplitude of the m/n = 1/1 and harmonics are close.At high density, the m/n = 1/1 mode is prominent. Multiple penetrations at several poloidalposition (≤ 3) on the q∼1 radius in the low density plasma are shown, especially evident onthe recovered circumference image using an interpolation method. The lower q0 value above1 should cause higher harmonics. However, the reason is still unknown. The idea kink modetheory predicts q0,crit ∝ 1/qa. It seems consistent with ne,crit ∝ 1/qa.
6 AcknowledgementsThe authors would like to thank the colleague working on the HT-7 tokamak for their greathelp. This work is supported by the National Basic Research Program of China under Grant No.2008CB717800, the National Nature Science Foundation of China No. 10335060, the PRC-USFusion Cooperation Program (Plasma Physics, Project A-5) and CAS-JSPS Core UniversityProgram in Plasma and Nuclear Fusion and Grants from the Ministry of Education and theAcademy of Science of P R China, and the US Department of Energy, Office of Fusion EnergyScience.
References[1] Kadomtsev, B.B., Sov. J. Plasma Phys. 1 (1975) 389.
[2] Soltwisch, H., Rev. Sci. Instrum. 59 (1988) 1599.
[3] Levinton, F.M., et al., Phys. Fluids B 5 (1993) 2554.
[4] Yamada, M., et al., Phys. Plasmas 1 (1994) 3269.
[5] Nagayama, Y., Yamada, M., Park, W., Fredrickson, E.D., Janos, A.C., McGuire, K.M.,and Taylor, G., Phys. Plasmas 3 (1996) 1647.
[6] Porcelli, F., Plasma Phys. Control. Fusion 38 (1996) 2163.
[7] Park, H.K., Luhmann, N.C., Donne, A.J.H., Classen, I.G.J., Domier, C.W., Mazzucato,E., Munsat, T., van de Pol, M.J., Xia, Z., and TEXTOR team, Phys. Rev. Lett. 96 (2006)195004.
[8] Park, H.K., Luhmann, N.C., Donne, A.J.H., Classen, I.G.J., Domier C.W., Mazzucato,E., Munsat, T., van de Pol, M.J., Xia, Z., and TEXTOR team, Phys. Rev. Lett. 96 (2006)195003.
[9] Xu, X.Y., et al., Plasma Phys. Control. Fusion, 52 (2010) 015008.
8 EXS/10-1Rb
[10] Sauthoff, N.R., Von Hoeler S. and Stodick W., Nucl. Fusion 18 (1978) 1445.
[11] Nagayama, Y., Taylor G., Yamada M., Fredrickson E.D., Janos A.C., and McGuire K.M.,Nucl. Fusion 36 (1996) 521.
[12] Yamaguchi, S., Igami H., Tanaka H. and Maekawa T., Plasma Phys. Control. Fusion 46(2004) 1163.
[13] Yamaguchi, S., Igami, H., Tanaka, H., and Maekawa, T., Phys. Rev. Lett. 93 (2004)045005-1.
[14] Sun, Y.W., Wan, B.N., Hu, L.Q., Chen, K.Y., Shen, B. and Mao, J.S., Plasma Phys. Con-trol. Fusion 51 (2009) 065001.
[15] Wesson, J., et al., Tokamaks, Third Edition, Clarendon Press, Oxford (2004), 316-317.
[16] Igochine, V., Dumbrajs, O., Zohm, H., Flaws, A. and the ASDEX Upgrade Team Nucl.Fusion, 47 (2007) 23.
[17] Hastie, R.J. and Hender, T.C., Nucl. Fusion 28 (1988) 585.
[18] Wahlberg, C. and Grave, J., Phys. Plasmas 14 (2007) 110703.