Transient inhibition of ROR- γt therapeutically limits ... · Transient inhibition of ROR-γt...
10
Transient inhibition of ROR-γ γt therapeutically limits intestinal inflammation by reducing T H 17 cells and preserving ILC3 David R. Withers, Matthew R. Hepworth, Xinxin Wang, Emma C. Mackley, Emily E. Halford, Emma E. Dutton, Clare L. Marriott, Verena Brucklacher-Waldert, Marc Veldhoen, Judith Kelsen, Robert N. Baldassano, Gregory F. Sonnenberg Nature Medicine: doi:10.1038/nm.4046
Transcript of Transient inhibition of ROR- γt therapeutically limits ... · Transient inhibition of ROR-γt...
Transient inhibition of ROR-γγt therapeutically limits intestinal inflammation by reducing TH17 cells and preserving ILC3 David R. Withers, Matthew R. Hepworth, Xinxin Wang, Emma C. Mackley, Emily E. Halford, Emma E. Dutton, Clare L. Marriott, Verena Brucklacher-Waldert, Marc Veldhoen, Judith Kelsen, Robert N. Baldassano, Gregory F. Sonnenberg
Nature Medicine: doi:10.1038/nm.4046
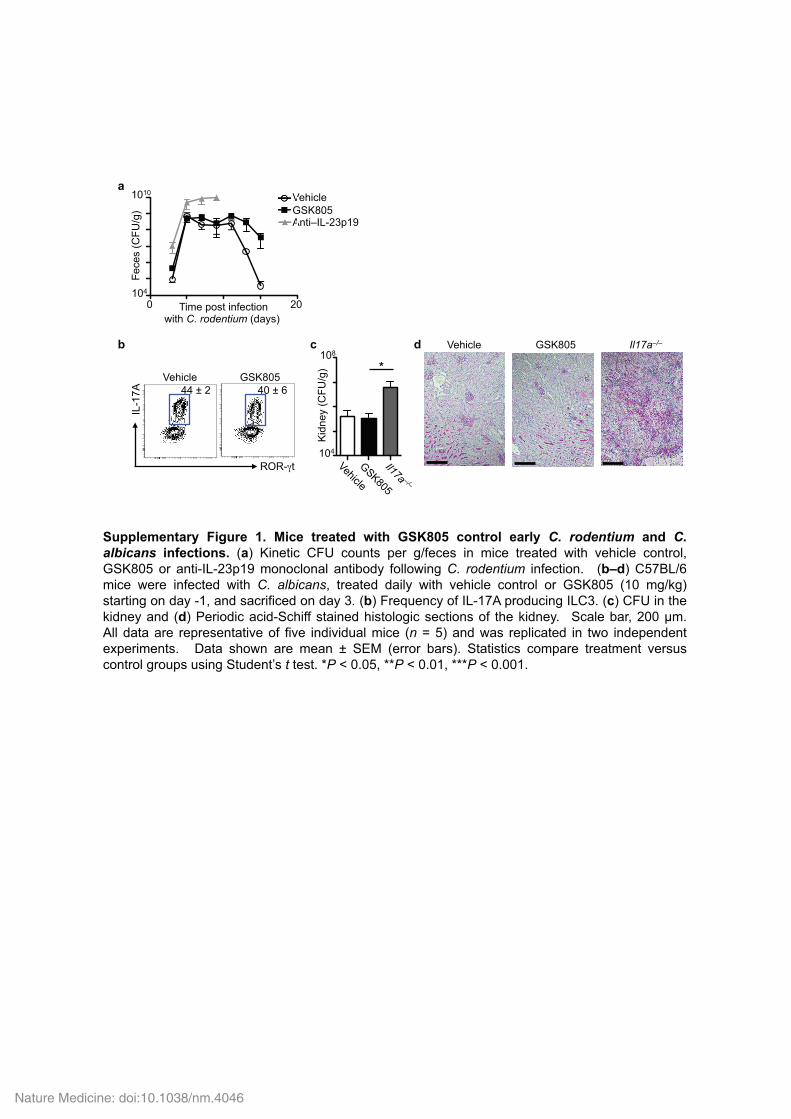
Supplementary Figure 1. Mice treated with GSK805 control early C. rodentium and C. albicans infections. (a) Kinetic CFU counts per g/feces in mice treated with vehicle control, GSK805 or anti-IL-23p19 monoclonal antibody following C. rodentium infection. (b–d) C57BL/6 mice were infected with C. albicans, treated daily with vehicle control or GSK805 (10 mg/kg) starting on day -1, and sacrificed on day 3. (b) Frequency of IL-17A producing ILC3. (c) CFU in the kidney and (d) Periodic acid-Schiff stained histologic sections of the kidney. Scale bar, 200 μm. All data are representative of five individual mice (n = 5) and was replicated in two independent experiments. Data shown are mean ± SEM (error bars). Statistics compare treatment versus control groups using Student’s t test. *P < 0.05, **P < 0.01, ***P < 0.001.
1010
Fece
s (C
FU/g
)
104 Time post infection
with C. rodentium (days) 0 20
Vehicle GSK805 Anti–IL-23p19
VGA
b
44 ± 2 40 ± 6
c
108
Kid
ney
(CFU
/g) *
104
IL-1
7A Vehicle GSK805
ROR-γt
d Vehicle GSK805 Il17a–/–
a
Nature Medicine: doi:10.1038/nm.4046
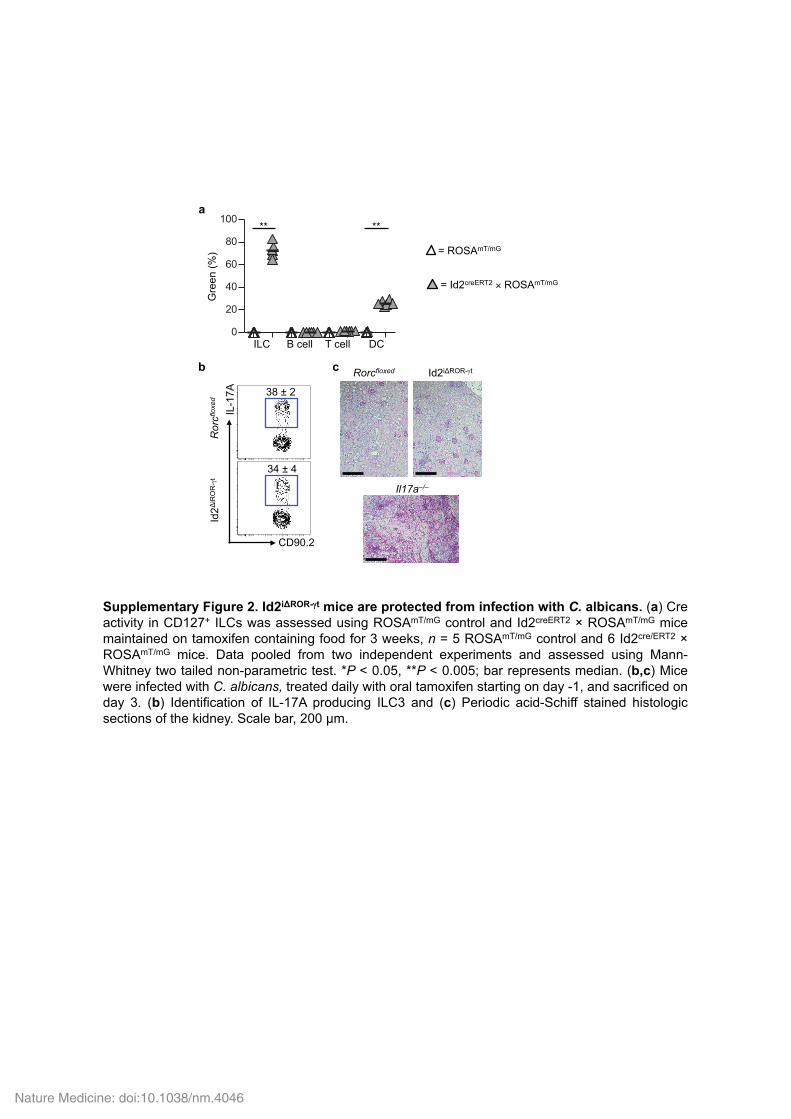
Supplementary Figure 2. Id2iΔROR-γγt mice are protected from infection with C. albicans. (a) Cre activity in CD127+ ILCs was assessed using ROSAmT/mG control and Id2creERT2 × ROSAmT/mG mice maintained on tamoxifen containing food for 3 weeks, n = 5 ROSAmT/mG control and 6 Id2cre/ERT2 × ROSAmT/mG mice. Data pooled from two independent experiments and assessed using Mann-Whitney two tailed non-parametric test. *P < 0.05, **P < 0.005; bar represents median. (b,c) Mice were infected with C. albicans, treated daily with oral tamoxifen starting on day -1, and sacrificed on day 3. (b) Identification of IL-17A producing ILC3 and (c) Periodic acid-Schiff stained histologic sections of the kidney. Scale bar, 200 μm.
% G
reen
0
20
40
60
80
100
ILC B cell T cell DC
= ROSAmT/mG
= Id2creERT2 × ROSAmT/mG
** **
b c
IL-1
7A
CD90.2
38 ± 2
34 ± 4
Id2Δ
iRO
R-γ
t R
orcf
loxe
d
Id2iΔROR-γt Rorcfloxed
Il17a–/–
a G
reen
(%)
Nature Medicine: doi:10.1038/nm.4046
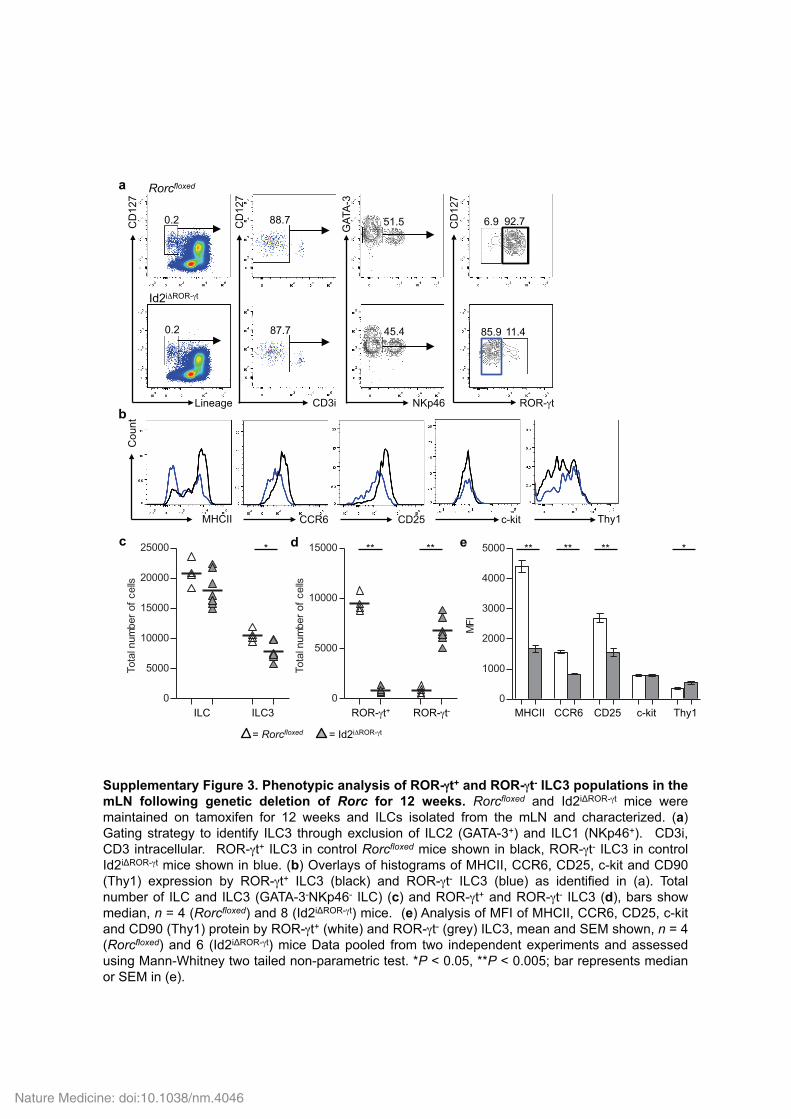
Supplementary Figure 3. Phenotypic analysis of ROR-γγt+ and ROR-γt- ILC3 populations in the mLN following genetic deletion of Rorc for 12 weeks. Rorcfloxed and Id2iΔROR-γt mice were maintained on tamoxifen for 12 weeks and ILCs isolated from the mLN and characterized. (a) Gating strategy to identify ILC3 through exclusion of ILC2 (GATA-3+) and ILC1 (NKp46+). CD3i, CD3 intracellular. ROR-γt+ ILC3 in control Rorcfloxed mice shown in black, ROR-γt- ILC3 in control Id2iΔROR-γt mice shown in blue. (b) Overlays of histograms of MHCII, CCR6, CD25, c-kit and CD90 (Thy1) expression by ROR-γt+ ILC3 (black) and ROR-γt- ILC3 (blue) as identified in (a). Total number of ILC and ILC3 (GATA-3-NKp46- ILC) (c) and ROR-γt+ and ROR-γt- ILC3 (d), bars show median, n = 4 (Rorcfloxed) and 8 (Id2iΔROR-γt) mice. (e) Analysis of MFI of MHCII, CCR6, CD25, c-kit and CD90 (Thy1) protein by ROR-γt+ (white) and ROR-γt- (grey) ILC3, mean and SEM shown, n = 4 (Rorcfloxed) and 6 (Id2iΔROR-γt) mice Data pooled from two independent experiments and assessed using Mann-Whitney two tailed non-parametric test. *P < 0.05, **P < 0.005; bar represents median or SEM in (e).
MFI
0
1000
2000
3000
4000
5000 ** ** **
= Rorcfloxed
Lineage
CD
127
CD3i
CD
127
NKp46
GAT
A-3
ROR-γt
CD
127
51.5
45.4
88.7
87.7
0.2
0.2
92.7
11.4
6.9
85.9
Tota
l num
ber o
f cel
ls
0
5000
10000
15000
20000
25000
Tota
l num
ber o
f cel
ls
0
5000
10000
15000
= Id2iΔROR-γt
ILC ILC3 ROR-γt+ ROR-γt- MHCII CCR6 CD25 c-kit Thy1
MHCII CCR6 CD25 c-kit Thy1
Cou
nt
a
b
c d e ** ** * *
Rorcfloxed
Id2iΔROR-γt
Nature Medicine: doi:10.1038/nm.4046
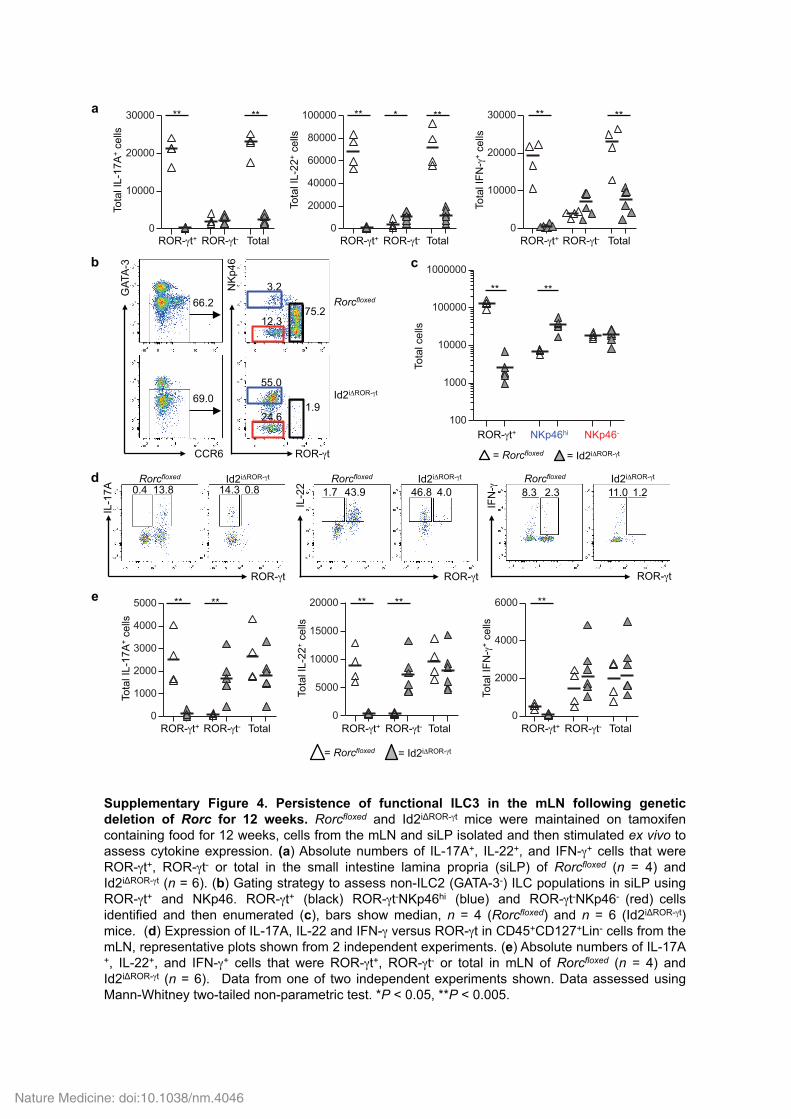
Supplementary Figure 4. Persistence of functional ILC3 in the mLN following genetic deletion of Rorc for 12 weeks. Rorcfloxed and Id2iΔROR-γt mice were maintained on tamoxifen containing food for 12 weeks, cells from the mLN and siLP isolated and then stimulated ex vivo to assess cytokine expression. (a) Absolute numbers of IL-17A+, IL-22+, and IFN-γ+ cells that were ROR-γt+, ROR-γt- or total in the small intestine lamina propria (siLP) of Rorcfloxed (n = 4) and Id2iΔROR-γt (n = 6). (b) Gating strategy to assess non-ILC2 (GATA-3-) ILC populations in siLP using ROR-γt+ and NKp46. ROR-γt+ (black) ROR-γt-NKp46hi (blue) and ROR-γt-NKp46- (red) cells identified and then enumerated (c), bars show median, n = 4 (Rorcfloxed) and n = 6 (Id2iΔROR-γt) mice. (d) Expression of IL-17A, IL-22 and IFN-γ versus ROR-γt in CD45+CD127+Lin- cells from the mLN, representative plots shown from 2 independent experiments. (e) Absolute numbers of IL-17A+, IL-22+, and IFN-γ+ cells that were ROR-γt+, ROR-γt- or total in mLN of Rorcfloxed (n = 4) and Id2iΔROR-γt (n = 6). Data from one of two independent experiments shown. Data assessed using Mann-Whitney two-tailed non-parametric test. *P < 0.05, **P < 0.005.
Num
ber o
f IL-
17A
+ ce
lls
0
10000
20000
30000
Num
ber o
f IL-
22+
cells
0
20000
40000
60000
80000
100000
Num
ber o
f IFNγ +
cel
ls
0
10000
20000
30000
ROR-γt+ ROR-γt- Total ROR-γt+ ROR-γt- Total ROR-γt+ ROR-γt- Total
** ** ** * ** ** ** a
= Id2iΔROR-γt
Num
ber o
f IL-
17A
+ ce
lls
0
1000
2000
3000
4000
5000
Num
ber o
f IL-
22+
cells
0
5000
10000
15000
20000
Num
ber o
f IFNγ +
cel
ls
0
2000
4000
6000
ROR-γt+ ROR-γt- Total ROR-γt+ ROR-γt- Total ROR-γt+ ROR-γt- Total
** ** ** ** **
d
e
= Rorcfloxed
ROR-γt ROR-γt ROR-γt
IL-1
7A
14.3 0.8 0.4 13.8
IL-2
2 1.7 43.9 46.8 4.0 8.3 2.3 11.0 1.2 IF
N-γ
Rorcfloxed Id2iΔROR-γt Rorcfloxed Id2iΔROR-γt Rorcfloxed Id2iΔROR-γt
ROR-γt
NK
p46
CCR6
GAT
A-3
55.0
24.6 1.9
3.2
12.3 75.2
b
Rorcfloxed
Id2iΔROR-γt Tota
l num
ber o
f cel
ls100
1000
10000
100000
1000000
ROR-γt+ NKp46hi NKp46-
** **
c
= Id2iΔROR-γt = Rorcfloxed
69.0
66.2
Tota
l IL-
17A
+ ce
lls
Tota
l IL-
22+
cells
Tota
l IFN
-γ+
cells
Tota
l cel
ls
Tota
l IL-
17A
+ ce
lls
Tota
l IL-
22+
cells
Tota
l IFN
-γ+
cells
Nature Medicine: doi:10.1038/nm.4046
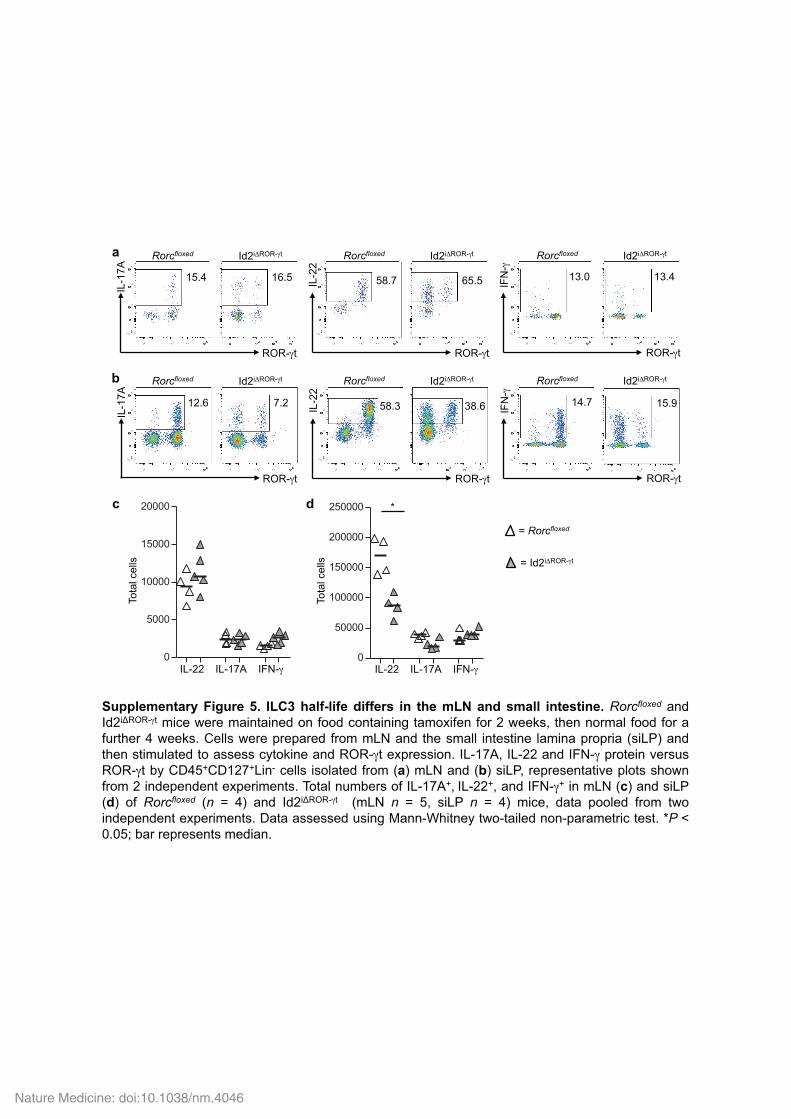
Supplementary Figure 5. ILC3 half-life differs in the mLN and small intestine. Rorcfloxed and Id2iΔROR-γt mice were maintained on food containing tamoxifen for 2 weeks, then normal food for a further 4 weeks. Cells were prepared from mLN and the small intestine lamina propria (siLP) and then stimulated to assess cytokine and ROR-γt expression. IL-17A, IL-22 and IFN-γ protein versus ROR-γt by CD45+CD127+Lin- cells isolated from (a) mLN and (b) siLP, representative plots shown from 2 independent experiments. Total numbers of IL-17A+, IL-22+, and IFN-γ+ in mLN (c) and siLP (d) of Rorcfloxed (n = 4) and Id2iΔROR-γt (mLN n = 5, siLP n = 4) mice, data pooled from two independent experiments. Data assessed using Mann-Whitney two-tailed non-parametric test. *P < 0.05; bar represents median.
Tota
l num
ber o
f cel
ls
0
50000
100000
150000
200000
250000
Tota
l num
ber o
f cel
ls
0
5000
10000
15000
20000
IL-22 IL-17A IFN-γ
*
15.4
a
c
= Rorcfloxed
= Id2iΔROR-γt
58.7 13.0 16.5 65.5 13.4
IL-22 IL-17A IFN-γ
d
b
ROR-γt
IL-1
7A
12.6
ROR-γt
IL-2
2
ROR-γt
IFN
-γ
58.3 14.7 7.2 38.6 15.9
Rorcfloxed Id2iΔROR-γt Rorcfloxed Id2iΔROR-γt Rorcfloxed Id2iΔROR-γt
Rorcfloxed Id2iΔROR-γt Rorcfloxed Id2iΔROR-γt Rorcfloxed Id2iΔROR-γt
Tota
l cel
ls
Tota
l cel
ls
ROR-γt
IL-1
7A
ROR-γt
IL-2
2
ROR-γt
IFN
-γ
Nature Medicine: doi:10.1038/nm.4046
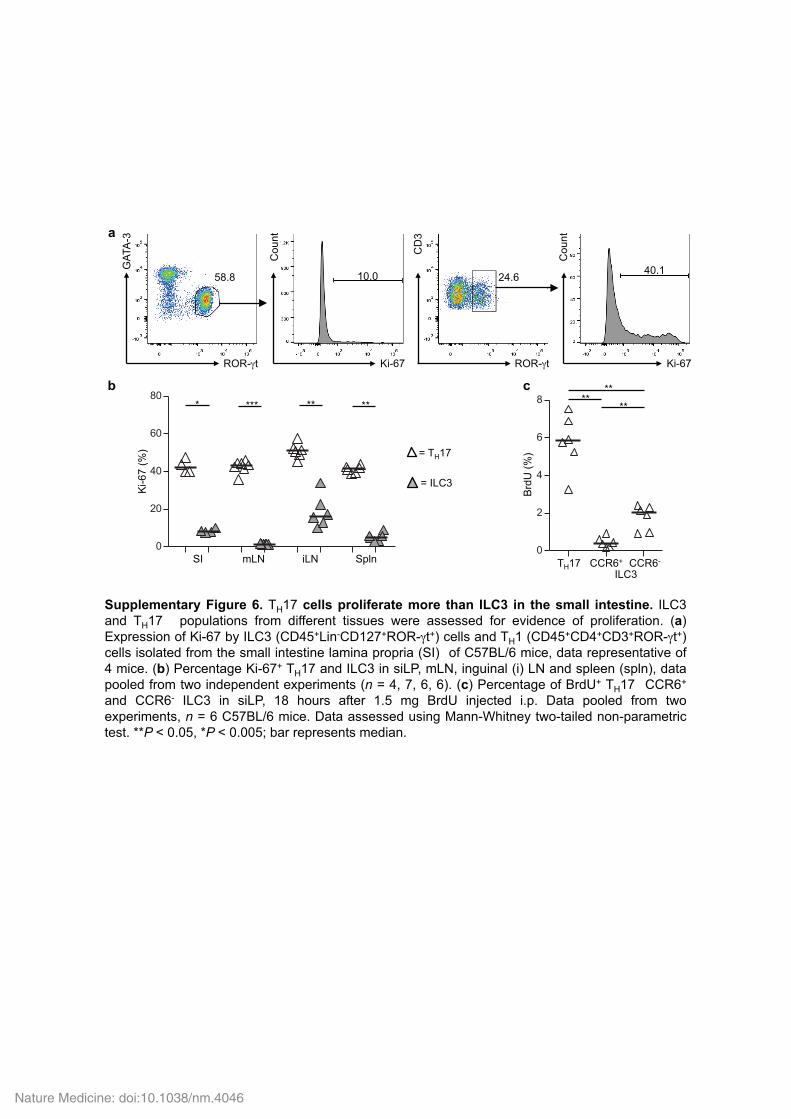
Supplementary Figure 6. TH17 cells proliferate more than ILC3 in the small intestine. ILC3 and TH17 populations from different tissues were assessed for evidence of proliferation. (a) Expression of Ki-67 by ILC3 (CD45+Lin-CD127+ROR-γt+) cells and TH1 (CD45+CD4+CD3+ROR-γt+) cells isolated from the small intestine lamina propria (SI) of C57BL/6 mice, data representative of 4 mice. (b) Percentage Ki-67+ TH17 and ILC3 in siLP, mLN, inguinal (i) LN and spleen (spln), data pooled from two independent experiments (n = 4, 7, 6, 6). (c) Percentage of BrdU+ TH17 CCR6+ and CCR6- ILC3 in siLP, 18 hours after 1.5 mg BrdU injected i.p. Data pooled from two experiments, n = 6 C57BL/6 mice. Data assessed using Mann-Whitney two-tailed non-parametric test. **P < 0.05, *P < 0.005; bar represents median.
% B
rdU+
0
2
4
6
8
ROR-γt Ki-67
GAT
A-3
ROR-γt Ki-67
CD
3
% K
i-67+
0
20
40
60
80
SI mLN iLN Spln
* *** ** **
a
b c
58.8 24.6 10.0 40.1
= TH17
= ILC3
CCR6+ CCR6- TH17
ILC3
** **
**
Ki-6
7 (%
)
Brd
U (%
)
Cou
nt
Cou
nt
Nature Medicine: doi:10.1038/nm.4046
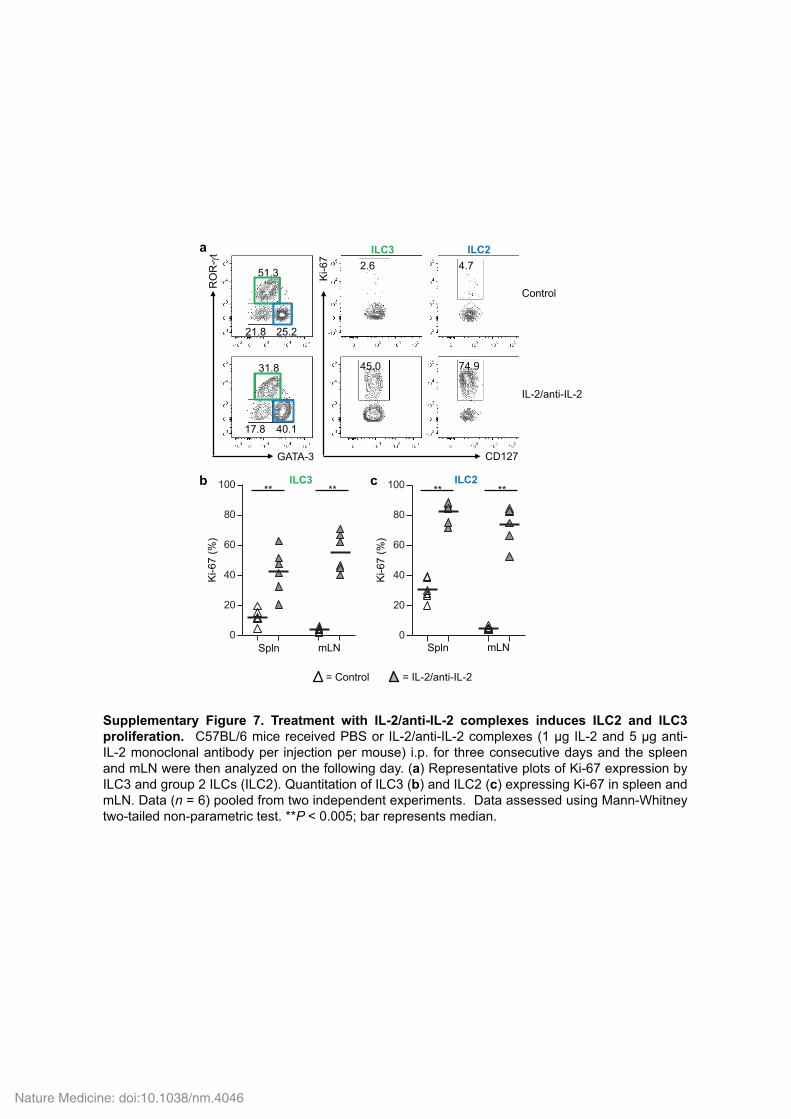
Supplementary Figure 7. Treatment with IL-2/anti-IL-2 complexes induces ILC2 and ILC3 proliferation. C57BL/6 mice received PBS or IL-2/anti-IL-2 complexes (1 µg IL-2 and 5 µg anti-IL-2 monoclonal antibody per injection per mouse) i.p. for three consecutive days and the spleen and mLN were then analyzed on the following day. (a) Representative plots of Ki-67 expression by ILC3 and group 2 ILCs (ILC2). Quantitation of ILC3 (b) and ILC2 (c) expressing Ki-67 in spleen and mLN. Data (n = 6) pooled from two independent experiments. Data assessed using Mann-Whitney two-tailed non-parametric test. **P < 0.005; bar represents median.
0
20
40
60
80
100
Perc
enta
ge e
xpre
ssin
Ki-6
7
GATA-3
RO
R-γ
t
45.0 74.9
ILC2
51.3
25.2 21.8
31.8
40.1 17.8
CD127
Ki-6
7
2.6 4.7 ILC3
Control
IL-2/anti-IL-2
0
20
40
60
80
100
Perc
enta
ge e
xpre
ssin
Ki-6
7
Spln mLN Spln mLN
ILC3 ILC2 ** ** ** **
a
b c
= Control = IL-2/anti-IL-2
Ki-6
7 (%
)
Ki-6
7 (%
)
Nature Medicine: doi:10.1038/nm.4046
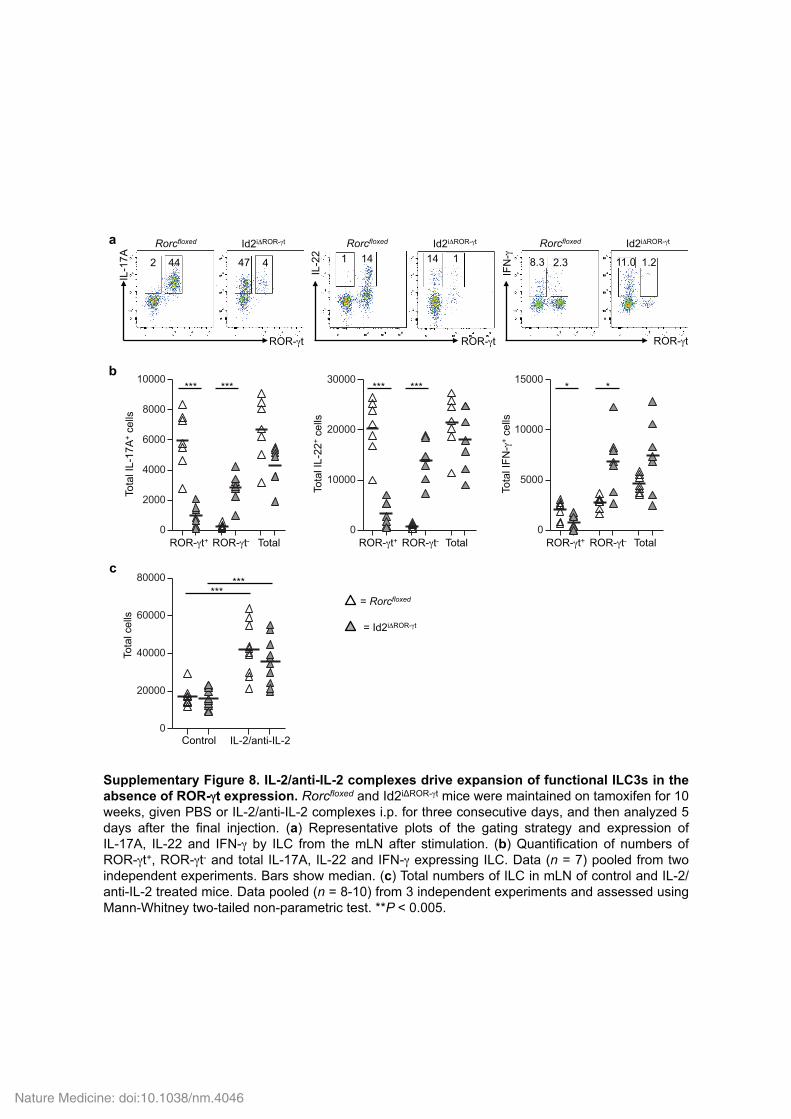
Supplementary Figure 8. IL-2/anti-IL-2 complexes drive expansion of functional ILC3s in the absence of ROR-γγt expression. Rorcfloxed and Id2iΔROR-γt mice were maintained on tamoxifen for 10 weeks, given PBS or IL-2/anti-IL-2 complexes i.p. for three consecutive days, and then analyzed 5 days after the final injection. (a) Representative plots of the gating strategy and expression of IL-17A, IL-22 and IFN-γ by ILC from the mLN after stimulation. (b) Quantification of numbers of ROR-γt+, ROR-γt- and total IL-17A, IL-22 and IFN-γ expressing ILC. Data (n = 7) pooled from two independent experiments. Bars show median. (c) Total numbers of ILC in mLN of control and IL-2/anti-IL-2 treated mice. Data pooled (n = 8-10) from 3 independent experiments and assessed using Mann-Whitney two-tailed non-parametric test. **P < 0.005.
Tota
l num
ber o
f cel
ls
0
5000
10000
15000* * *** *** *** ***
Tota
l num
ber o
f cel
ls
0
2000
4000
6000
8000
10000
Tota
l num
ber o
f cel
ls
0
10000
20000
30000
ROR-γt+ ROR-γt- Total ROR-γt+ ROR-γt- Total ROR-γt+ ROR-γt- Total
14 1 1 14 2 44 47 4
a
b
Tota
l num
ber o
f cel
ls
0
20000
40000
60000
80000
Control IL-2/anti-IL-2
c ***
***
= Rorcfloxed
= Id2iΔROR-γt
8.3 2.3 11.0 1.2
Rorcfloxed Id2iΔROR-γt Rorcfloxed Id2iΔROR-γt Rorcfloxed Id2iΔROR-γt
ROR-γt
IL-1
7A
ROR-γt
IL-2
2
ROR-γt
IFN
-γ
Tota
l IL-
17A
+ ce
lls
Tota
l IL-
22+
cells
Tota
l IFN
-γ+
cells
Tota
l cel
ls
Nature Medicine: doi:10.1038/nm.4046
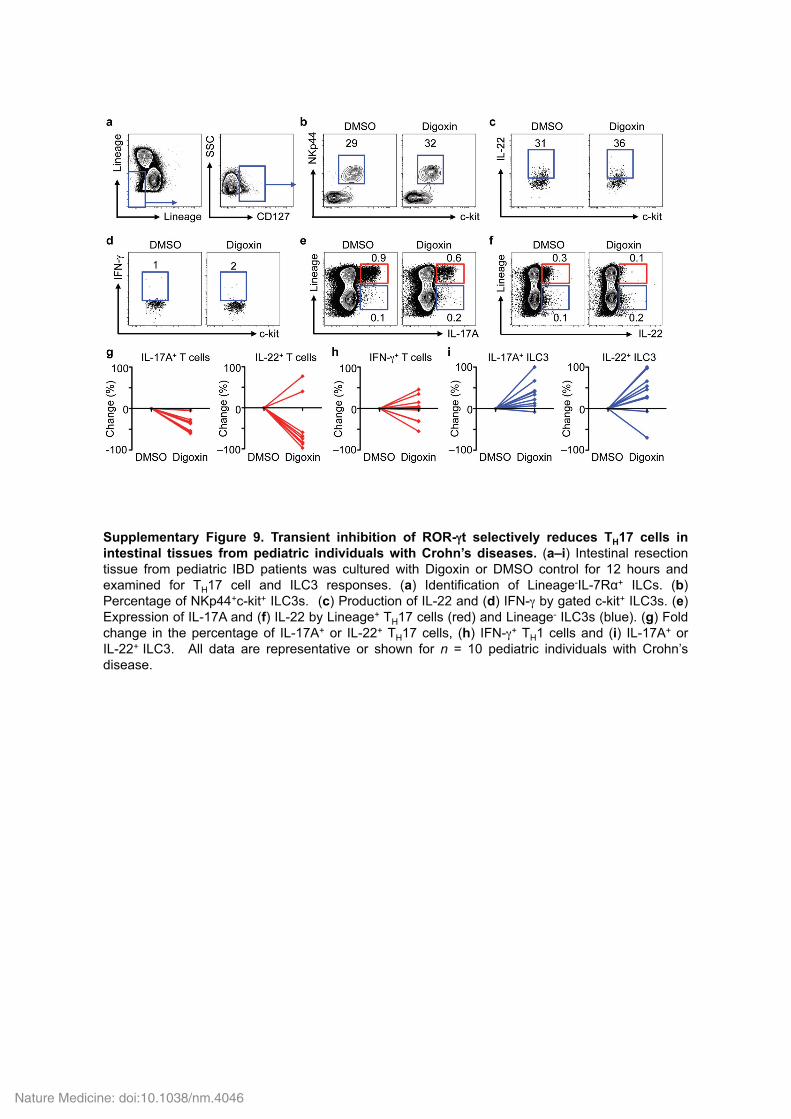
Supplementary Figure 9. Transient inhibition of ROR-γγt selectively reduces TH17 cells in intestinal tissues from pediatric individuals with Crohn’s diseases. (a–i) Intestinal resection tissue from pediatric IBD patients was cultured with Digoxin or DMSO control for 12 hours and examined for TH17 cell and ILC3 responses. (a) Identification of Lineage-IL-7Rα+ ILCs. (b) Percentage of NKp44+c-kit+ ILC3s. (c) Production of IL-22 and (d) IFN-γ by gated c-kit+ ILC3s. (e) Expression of IL-17A and (f) IL-22 by Lineage+ TH17 cells (red) and Lineage- ILC3s (blue). (g) Fold change in the percentage of IL-17A+ or IL-22+ TH17 cells, (h) IFN-γ+ TH1 cells and (i) IL-17A+ or IL-22+ ILC3. All data are representative or shown for n = 10 pediatric individuals with Crohn’s disease.
Nature Medicine: doi:10.1038/nm.4046