The SINFONI Integral Field Spectroscopy Survey for Galaxy ... · The Messenger 143 – March 2011...
5
37 The Messenger 143 – March 2011 Astronomical Science The SINFONI Integral Field Spectroscopy Survey for Galaxy Counterparts to Damped Lyman- α Systems Céline Péroux 1 Nicolas Bouché 2, 3 Varsha Kulkarni 4 Donald York 5 Giovanni Vladilo 6 1 Laboratoire d’Astrophysique de Marseille, OAMP, Université Aix- Marseille & CNRS, France 2 Department of Physics, University of California, Santa Barbara, USA 3 Laboratoire d’Astrophysique de Toulouse–Tarbes, CNRS, Observatoire Midi-Pyrénnées, France 4 Department of Physics and Astronomy, University of South Carolina, Columbia, USA 5 Department of Astronomy and Astro- physics and The Enrico Fermi Institute, University of Chicago, USA 6 INAF–Osservatorio Astronomico di Trieste, Italy A complete picture of galaxy formation can only be obtained by detailed study of the processes by which galax- ies convert their gas into stars. One approach is to relate the H I gas and the stars in galaxies. Damped and sub- damped Lyman-α systems (DLAs), which are galaxies probed by the ab- sorption they produce in the spectra of background quasars, are purely selected on H I gas, but identifying the galaxy responsible for the absorber with more traditional methods remains challenging. Integral field spectroscopy provides an efficient way of detecting faint galaxies near bright quasars, fur- ther providing immediate redshift con- firmation. Here, we report on the de tection of DLA and sub-DLA systems identified in Hα emission with VLT/ SINFONI at near-infrared wavelengths. Tremendous progress has been made over the last decade in establishing a broad cosmological framework in which galaxies and large-scale structure de- velop hierarchically over time, as a result of gravitational instabilities in the den- sity field. The next challenge is to under - stand the physical processes of the formation of galaxies and structures and their interactions with the surrounding medium. Of particular importance are the processes through which these galaxies accrete gas and subsequently form stars. The accretion of baryonic gas is com- plex. Recently, several teams have real- ised that, in halos with mass < 10 11.5–12 M A baryonic accretion may not involve the traditional shock heating process. But the observational evidence for ac- cretion is scarce. A related signature is that the total amount of neutral gas in the Universe, H I, is almost constant over most of the cosmic time (Péroux et al., 2005; Noterdaeme et al., 2009), unlike the history of the star formation rate, which peaks around z = 1. This shows the importance of ongoing global gas accretion and the conversion of atomic gas to molecular gas in the star formation process. One way to tackle these problems is to relate the H I gas and the stars in galax- ies. While radio observations now provide detailed constraints on the H I content of large samples of galaxies, they are still limited to redshift z ~ 0. Conversely, the study of quasar absorbers, the galaxies probed by the absorption they produce in a background quasar spectrum, is insen- sitive to the redshift of the object. Indeed, the H I content of the strongest of these quasar absorbers, the so-called damped Lyman-α systems, have been measured in samples of several hundreds of objects from the Sloan Digital Sky Survey (SDSS). A new observational technique Nevertheless, studying the stellar con- tent of all these systems turns out to be rather challenging: the galaxies that produce such DLA absorption may be faint, thus requiring deep observations to detect their stellar/interstellar emission; in addition, they have small angular sepa- rations from the bright background qua- sars, which makes it difficult to disentan- gle the light of the galaxy from that of the quasar. Any broadband identification of a candidate absorber galaxy requires follow-up spectroscopy to confirm that the emission redshift of the object corre- sponds to the absorption redshift meas- ured in the quasar spectrum. This time- consuming step is sometimes missing, thus complicating the interpretation of the observations made so far. As a result of these issues, only 15 spectroscopically confirmed identifications of DLA/sub-DLA galaxies with measured N HI are known at cosmological redshift z < 1 and five at z > 1. Imaging spectroscopy at near-infrared (NIR) wavelengths with adaptive optics can be used to solve the above-men- tioned problems efficiently. The advan- tages afforded by this technique are manifold: 1) The contribution from the quasar is deconvolved from the absorber in the spectral dimension, thus allowing virtually zero impact parameters to be reached if the flux of the galaxy is greater than the quasar continuum flux. 2) The data provide a spectrum of the absorbing galaxy for immediate red- shift confirmation. 3) The detection of nebular emission lines such as Hα, a robust estimator of star formation rate, redshifted to the NIR at z > 0.6, can give clues to the stellar content of the galaxy and metallicity of the warm gas producing the nebular lines. 4) The spatially resolved kinematic data provide information on the dynamical state of the system. The powerful combination of an 8-metre class Very Large Telescope (VLT) and the SINFONI instrument has been suc- cessfully pioneered by Bouché et al. (2007). These authors have detected 67% (14 out of 21) of the systems in a sam- ple of Mg II absorbers at z ~ 1. The Hα detections are used to derive star forma- tion rates of the order 1–20 M A /yr. Their observations are sensitive to fluxes F(Hα) > 1.2 × 10 17 erg s –1 cm –2 , corre- sponding to star formation rates of ~ 0.5 M A /yr. Interestingly, lower detection rates are found at higher redshifts around z ~ 2 (Bouché et al., 2011). Here, we report the first results of our H I-selected survey aimed at detecting the host gal- axies via their Hα signature. In the pre- sent work, we report the detections of two DLA/sub-DLAs at z ~ 1 for which N HI , and hence absorption metallicities, are known from high resolution spec- troscopy out of five quasar fields with intervening absorbers (one with two sub- DLAs) searched.
Transcript of The SINFONI Integral Field Spectroscopy Survey for Galaxy ... · The Messenger 143 – March 2011...
37The Messenger 143 – March 2011
Astronomical Science
The SINFONI Integral Field Spectroscopy Survey for Galaxy Counterparts to Damped Lyman-α Systems
Céline Péroux1
Nicolas Bouché2,3
Varsha Kulkarni 4
Donald York5
Giovanni Vladilo6
1 Laboratoire d’Astrophysique de Marseille, OAMP, Université Aix- Marseille & CNRS, France
2 Department of Physics, University of California, Santa Barbara, USA
3 Laboratoire d’Astrophysique de Toulouse–Tarbes, CNRS, Observatoire Midi-Pyrénnées, France
4 Department of Physics and Astronomy, University of South Carolina, Columbia, USA
5 Department of Astronomy and Astro-physics and The Enrico Fermi Institute, University of Chicago, USA
6 INAF–Osservatorio Astronomico di Trieste, Italy
A complete picture of galaxy formation can only be obtained by detailed study of the processes by which galax-ies convert their gas into stars. One approach is to relate the H i gas and the stars in galaxies. Damped and sub-damped Lyman-α systems (DLAs), which are galaxies probed by the ab-sorption they produce in the spectra of background quasars, are purely selected on H i gas, but identifying the galaxy responsible for the absorber with more traditional methods remains challenging. Integral field spectroscopy provides an efficient way of detecting faint galaxies near bright quasars, fur-ther providing immediate redshift con-firmation. Here, we report on the de tection of DLA and sub-DLA systems identified in Hα emission with VLT/ SINFONI at near-infrared wavelengths.
Tremendous progress has been made over the last decade in establishing a broad cosmological framework in which galaxies and large-scale structure de -velop hierarchically over time, as a result of gravitational instabilities in the den- sity field. The next challenge is to under-stand the physical processes of the formation of galaxies and structures and their interactions with the surrounding
medium. Of particular importance are the processes through which these galaxies accrete gas and subsequently form stars. The accretion of baryonic gas is com- plex. Recently, several teams have real-ised that, in halos with mass < 1011.5–12 MA baryonic accretion may not involve the traditional shock heating process. But the observational evidence for ac -cretion is scarce. A related signature is that the total amount of neutral gas in the Universe, H i, is almost constant over most of the cosmic time (Péroux et al., 2005; Noterdaeme et al., 2009), unlike the history of the star formation rate, which peaks around z = 1. This shows the importance of ongoing global gas accretion and the conversion of atomic gas to molecular gas in the star formation process.
One way to tackle these problems is to relate the H i gas and the stars in galax-ies. While radio observations now provide detailed constraints on the H i content of large samples of galaxies, they are still limited to redshift z ~ 0. Conversely, the study of quasar absorbers, the galaxies probed by the absorption they produce in a background quasar spectrum, is insen-sitive to the redshift of the object. Indeed, the H i content of the strongest of these quasar absorbers, the so-called damped Lyman-α systems, have been measured in samples of several hundreds of objects from the Sloan Digital Sky Survey (SDSS).
A new observational technique
Nevertheless, studying the stellar con- tent of all these systems turns out to be rather challenging: the galaxies that produce such DLA absorption may be faint, thus requiring deep observations to detect their stellar/interstellar emission; in addition, they have small angular sepa-rations from the bright background qua-sars, which makes it difficult to disentan-gle the light of the galaxy from that of the quasar. Any broadband identification of a candidate absorber galaxy requires follow-up spectroscopy to confirm that the emission redshift of the object corre-sponds to the absorption redshift meas-ured in the quasar spectrum. This time-consuming step is sometimes missing, thus complicating the interpretation of the
observations made so far. As a result of these issues, only 15 spectroscopically confirmed identifications of DLA/sub-DLA galaxies with measured NH i are known at cosmological redshift z < 1 and five at z > 1.
Imaging spectroscopy at near-infrared (NIR) wavelengths with adaptive optics can be used to solve the above-men-tioned problems efficiently. The advan-tages afforded by this technique are manifold: 1) The contribution from the quasar is
deconvolved from the absorber in the spectral dimension, thus allowing virtually zero impact parameters to be reached if the flux of the galaxy is greater than the quasar continuum flux.
2) The data provide a spectrum of the absorbing galaxy for immediate red-shift confirmation.
3) The detection of nebular emission lines such as Hα, a robust estimator of star formation rate, redshifted to the NIR at z > 0.6, can give clues to the stellar content of the galaxy and metallicity of the warm gas producing the nebular lines.
4) The spatially resolved kinematic data provide information on the dynamical state of the system.
The powerful combination of an 8-metre class Very Large Telescope (VLT) and the SINFONI instrument has been suc-cessfully pioneered by Bouché et al. (2007). These authors have detected 67% (14 out of 21) of the systems in a sam- ple of Mg ii absorbers at z ~ 1. The Hα detections are used to derive star forma-tion rates of the order 1–20 MA/yr. Their ob servations are sensitive to fluxes F(Hα) > 1.2 × 10¹⁷ erg s–1 cm–2, corre-sponding to star formation rates of ~ 0.5 MA/yr. Interestingly, lower detection rates are found at higher redshifts around z ~ 2 (Bouché et al., 2011). Here, we report the first results of our H i-selected survey aimed at detecting the host gal-axies via their Hα signature. In the pre-sent work, we report the detections of two DLA/sub-DLAs at z ~ 1 for which NH i, and hence absorption metallicities, are known from high resolution spec-troscopy out of five quasar fields with intervening absorbers (one with two sub-DLAs) searched.
38 The Messenger 143 – March 2011
Astronomical Science
New detections
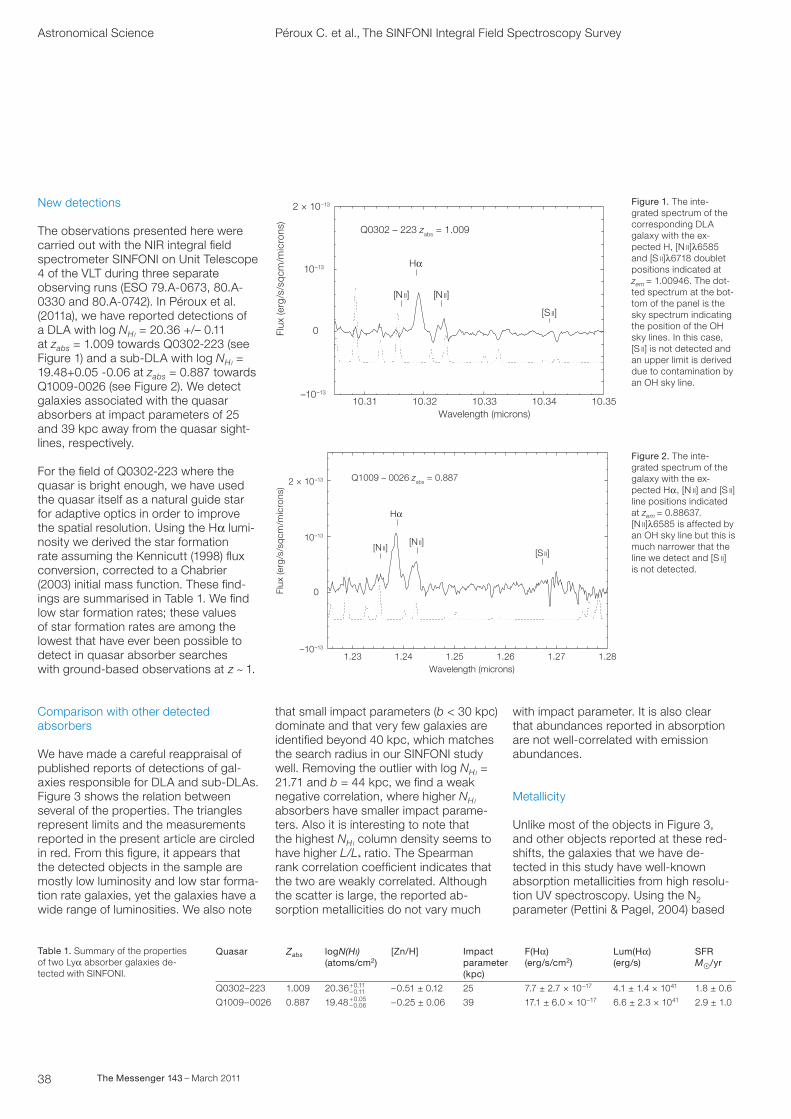
The observations presented here were carried out with the NIR integral field spectrometer SINFONI on Unit Telescope 4 of the VLT during three separate observing runs (ESO 79.A-0673, 80.A-0330 and 80.A-0742). In Péroux et al. (2011a), we have reported detections of a DLA with log NH i = 20.36 +/– 0.11 at zabs = 1.009 towards Q0302-223 (see Figure 1) and a sub-DLA with log NH i = 19.48+0.05 -0.06 at zabs = 0.887 towards Q1009-0026 (see Figure 2). We detect galaxies associated with the quasar absorbers at impact parameters of 25 and 39 kpc away from the quasar sight-lines, respectively.
For the field of Q0302-223 where the quasar is bright enough, we have used the quasar itself as a natural guide star for adaptive optics in order to improve the spatial resolution. Using the Hα lumi-nosity we derived the star formation rate assuming the Kennicutt (1998) flux conversion, corrected to a Chabrier (2003) initial mass function. These find-ings are summarised in Table 1. We find low star formation rates; these values of star formation rates are among the lowest that have ever been possible to detect in quasar absorber searches with ground-based observations at z ~ 1.
Comparison with other detected absorbers
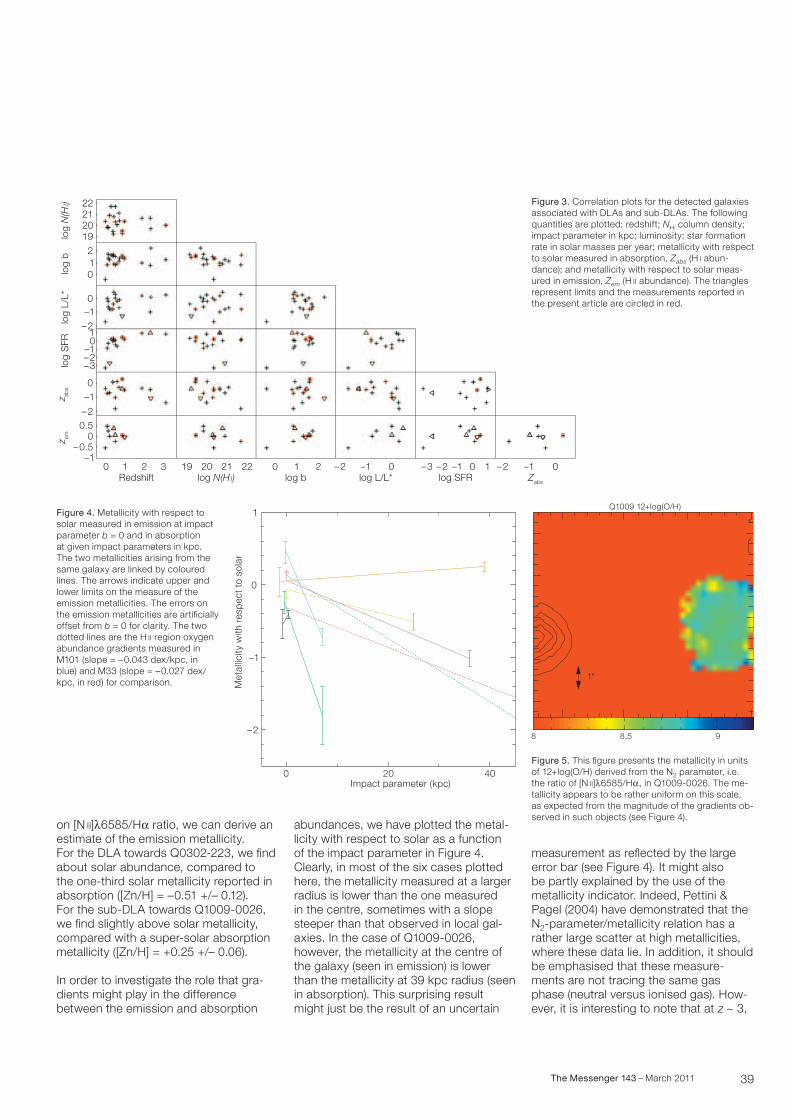
We have made a careful reappraisal of published reports of detections of gal-axies responsible for DLA and sub-DLAs. Figure 3 shows the relation between several of the properties. The triangles represent limits and the measurements reported in the present article are circled in red. From this figure, it appears that the detected objects in the sample are mostly low luminosity and low star forma-tion rate galaxies, yet the galaxies have a wide range of luminosities. We also note
that small impact parameters (b < 30 kpc) dominate and that very few galaxies are identified beyond 40 kpc, which matches the search radius in our SINFONI study well. Removing the outlier with log NH i = 21.71 and b = 44 kpc, we find a weak negative correlation, where higher NH i absorbers have smaller impact parame-ters. Also it is interesting to note that the highest NH i column density seems to have higher L/L* ratio. The Spearman rank correlation coefficient indicates that the two are weakly correlated. Although the scatter is large, the reported ab -sorption metallicities do not vary much
with impact parameter. It is also clear that abundances reported in absorption are not well-correlated with emission abundances.
Metallicity
Unlike most of the objects in Figure 3, and other objects reported at these red-shifts, the galaxies that we have de- tected in this study have well-known absorption metallicities from high resolu-tion UV spectroscopy. Using the N2 parameter (Pettini & Pagel, 2004) based
Péroux C. et al., The SINFONI Integral Field Spectroscopy Survey
α
Figure 1. The inte- grated spectrum of the corresponding DLA galaxy with the ex-pected H, [N ii]λ6585 and [S ii]λ6718 doublet positions indicated at zem = 1.00946. The dot-ted spectrum at the bot-tom of the panel is the sky spectrum indicating the position of the OH sky lines. In this case, [S ii] is not detected and an upper limit is derived due to contamination by an OH sky line.
α
Figure 2. The inte- grated spectrum of the galaxy with the ex-pected Hα, [N ii] and [S ii] line positions indicated at zem = 0.88637. [N ii]λ6585 is affected by an OH sky line but this is much narrower that the line we detect and [S ii] is not detected.
Quasar
Q0302–223
Q1009–0026
Zabs
1.009
0.887
logN(Hi)(atoms/cm2)
20.36
19.48
+0.11– 0.11+0.05– 0.06
[Zn/H]
–0.51 ± 0.12
–0.25 ± 0.06
Impact parameter(kpc)
25
39
F(Hα)(erg/s/cm2)
7.7 ± 2.7 × 10⁻¹⁷
17.1 ± 6.0 × 10⁻¹⁷
Lum(Hα)(erg/s)
4.1 ± 1.4 × 1041
6.6 ± 2.3 × 1041
SFRMA/yr
1.8 ± 0.6
2.9 ± 1.0
Table 1. Summary of the properties of two Lyα absorber galaxies de- tected with SINFONI.
39The Messenger 143 – March 2011
on [N ii]λ6585/Hα ratio, we can derive an estimate of the emission metallicity. For the DLA towards Q0302-223, we find about solar abundance, compared to the one-third solar metallicity reported in absorption ([Zn/H] = –0.51 +/– 0.12). For the sub-DLA towards Q1009-0026, we find slightly above solar metallicity, compared with a super-solar absorption metallicity ([Zn/H] = +0.25 +/– 0.06).
In order to investigate the role that gra-dients might play in the difference between the emission and absorption
abundances, we have plotted the metal-licity with respect to solar as a function of the impact parameter in Figure 4. Clearly, in most of the six cases plotted here, the metallicity measured at a larger radius is lower than the one measured in the centre, sometimes with a slope steeper than that observed in local gal-axies. In the case of Q1009-0026, however, the metallicity at the centre of the galaxy (seen in emission) is lower than the metallicity at 39 kpc radius (seen in absorption). This surprising result might just be the result of an uncertain
measurement as reflected by the large error bar (see Figure 4). It might also be partly explained by the use of the metallicity indicator. Indeed, Pettini & Pagel (2004) have demonstrated that the N2-parameter/metallicity relation has a rather large scatter at high metallicities, where these data lie. In addition, it should be emphasised that these measure- ments are not tracing the same gas phase (neutral versus ionised gas). How-ever, it is interesting to note that at z ~ 3,
Redshift0 1 2 3 19 20 21 22 0 1 2 –2 –1 –1 10 –3 –2 0 –1–2 0
log N(HI) log b log L/L* log SFR Zabs
–1
–1
–1
–1
–0.50z em
z abs
log
SFR
0
0
0
012
19202122
1
0.5–2
–3–2
–2log
L/L*
log
blo
g N(H
I) Figure 3. Correlation plots for the detected galaxies associated with DLAs and sub-DLAs. The following quantities are plotted: redshift; NHi column density; impact parameter in kpc; luminosity; star formation rate in solar masses per year; metallicity with respect to solar measured in absorption, Zabs (H i abun-dance); and metallicity with respect to solar meas-ured in emission, Zem (H ii abundance). The triangles represent limits and the measurements reported in the present article are circled in red.
Figure 4. Metallicity with respect to solar measured in emission at impact parameter b = 0 and in absorption at given impact parameters in kpc. The two metallicities arising from the same galaxy are linked by coloured lines. The arrows indicate upper and lower limits on the measure of the emission metallicities. The errors on the emission metallicities are artificially offset from b = 0 for clarity. The two dotted lines are the H ii region oxygen abundance gradients measured in M101 (slope = –0.043 dex/kpc, in blue) and M33 (slope = –0.027 dex/kpc, in red) for comparison.
�
Figure 5. This figure presents the metallicity in units of 12+log(O/H) derived from the N2 parameter, i.e. the ratio of [N ii]λ6585/Hα, in Q1009-0026. The me-tallicity appears to be rather uniform on this scale, as expected from the magnitude of the gradients ob-served in such objects (see Figure 4).
40 The Messenger 143 – March 2011
Astronomical Science
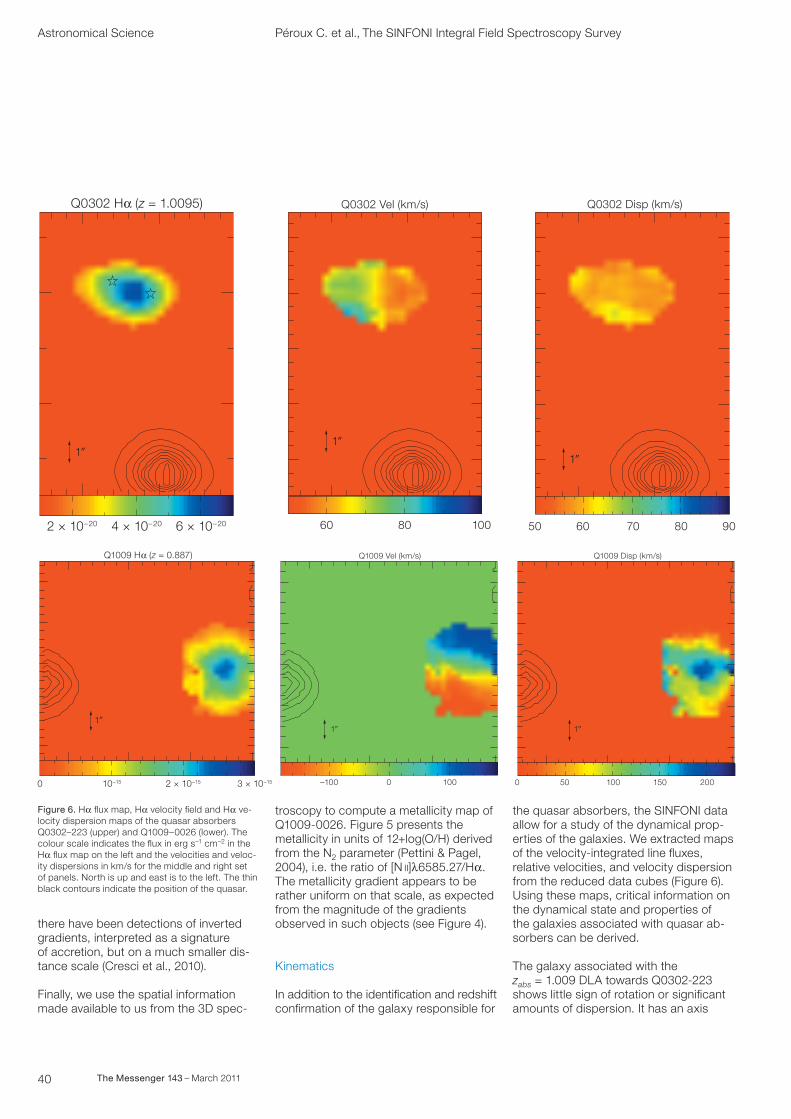
the quasar absorbers, the SINFONI data allow for a study of the dynamical prop-erties of the galaxies. We extracted maps of the velocity-integrated line fluxes, relative velocities, and velocity dispersion from the reduced data cubes (Figure 6). Using these maps, critical information on the dynamical state and properties of the galaxies associated with quasar ab -sorbers can be derived.
The galaxy associated with the zabs = 1.009 DLA towards Q0302-223 shows little sign of rotation or significant amounts of dispersion. It has an axis
Figure 6. Hα flux map, Hα velocity field and Hα ve-locity dispersion maps of the quasar absorbers Q0302–223 (upper) and Q1009–0026 (lower). The colour scale indicates the flux in erg s–1 cm–2 in the Hα flux map on the left and the velocities and veloc-ity dispersions in km/s for the middle and right set of panels. North is up and east is to the left. The thin black contours indicate the position of the quasar.
α
��
α
�
�
� �
there have been detections of inverted gradients, interpreted as a signature of accretion, but on a much smaller dis-tance scale (Cresci et al., 2010).
Finally, we use the spatial information made available to us from the 3D spec-
troscopy to compute a metallicity map of Q1009-0026. Figure 5 presents the metallicity in units of 12+log(O/H) derived from the N2 parameter (Pettini & Pagel, 2004), i.e. the ratio of [N ii]λ6585.27/Hα. The metallicity gradient appears to be rather uniform on that scale, as expected from the magnitude of the gradients observed in such objects (see Figure 4).
Kinematics
In addition to the identification and redshift confirmation of the galaxy responsible for
Péroux C. et al., The SINFONI Integral Field Spectroscopy Survey
41The Messenger 143 – March 2011
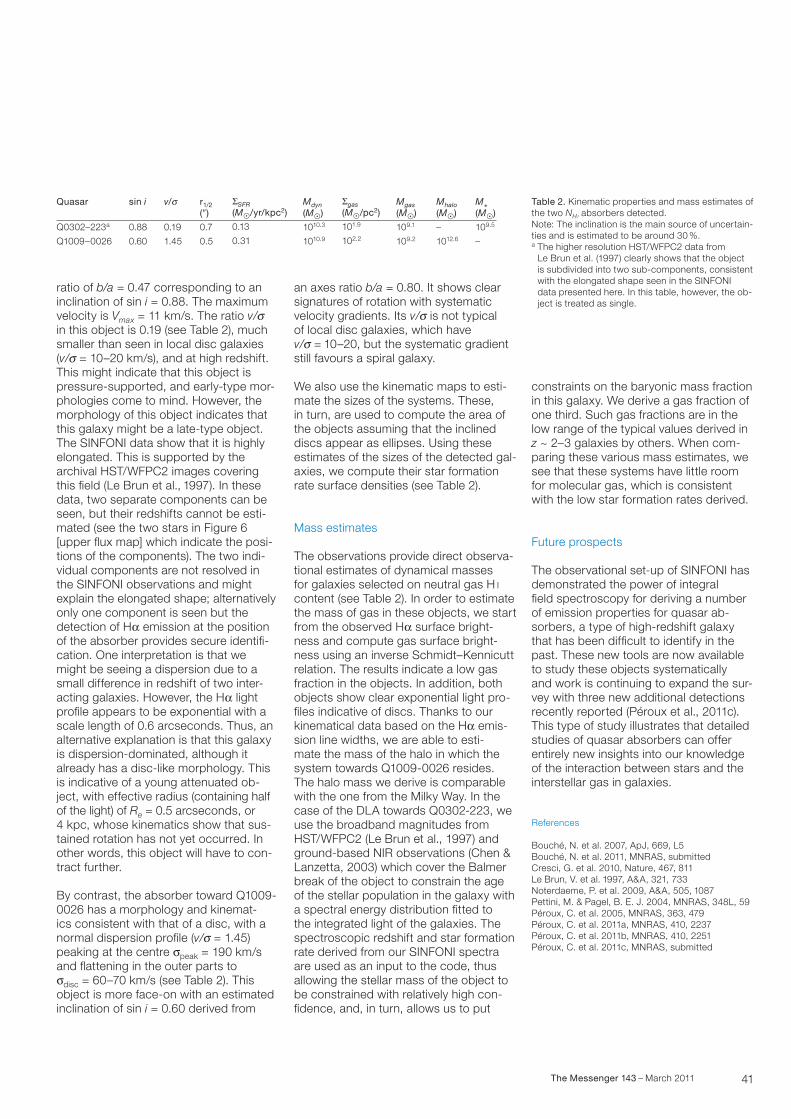
an axes ratio b/a = 0.80. It shows clear signatures of rotation with systematic velocity gradients. Its v/s is not typical of local disc galaxies, which have v/s = 10–20, but the systematic gradient still favours a spiral galaxy.
We also use the kinematic maps to esti-mate the sizes of the systems. These, in turn, are used to compute the area of the objects assuming that the inclined discs appear as ellipses. Using these estimates of the sizes of the detected gal-axies, we compute their star formation rate surface densities (see Table 2).
Mass estimates
The observations provide direct observa-tional estimates of dynamical masses for galaxies selected on neutral gas H i content (see Table 2). In order to estimate the mass of gas in these objects, we start from the observed Hα surface bright- ness and compute gas surface bright-ness using an inverse Schmidt–Kennicutt relation. The results indicate a low gas fraction in the objects. In addition, both objects show clear exponential light pro-files indicative of discs. Thanks to our kinematical data based on the Hα emis-sion line widths, we are able to esti- mate the mass of the halo in which the system towards Q1009-0026 resides. The halo mass we derive is comparable with the one from the Milky Way. In the case of the DLA towards Q0302-223, we use the broadband magnitudes from HST/WFPC2 (Le Brun et al., 1997) and ground-based NIR observations (Chen & Lanzetta, 2003) which cover the Balmer break of the object to constrain the age of the stellar population in the galaxy with a spectral energy distribution fitted to the integrated light of the galaxies. The spectroscopic redshift and star formation rate derived from our SINFONI spectra are used as an input to the code, thus allowing the stellar mass of the object to be constrained with relatively high con-fidence, and, in turn, allows us to put
ratio of b/a = 0.47 corresponding to an incli nation of sin i = 0.88. The maximum velocity is Vmax = 11 km/s. The ratio v/s in this object is 0.19 (see Table 2), much smaller than seen in local disc galaxies (v/s = 10–20 km/s), and at high redshift. This might indicate that this object is pressure-supported, and early-type mor-phologies come to mind. However, the morphology of this object indicates that this galaxy might be a late-type object. The SINFONI data show that it is highly elongated. This is supported by the archival HST/WFPC2 images covering this field (Le Brun et al., 1997). In these data, two separate components can be seen, but their redshifts cannot be esti-mated (see the two stars in Figure 6 [upper flux map] which indicate the posi-tions of the components). The two indi-vidual components are not resolved in the SINFONI observations and might explain the elongated shape; alternatively only one component is seen but the detection of Hα emission at the position of the absorber provides secure identifi-cation. One interpretation is that we might be seeing a dispersion due to a small difference in redshift of two inter-acting galaxies. However, the Hα light profile appears to be exponential with a scale length of 0.6 arcseconds. Thus, an alternative explanation is that this galaxy is dispersion-dominated, although it already has a disc-like morphology. This is indicative of a young attenuated ob- ject, with effective radius (containing half of the light) of Re = 0.5 arcseconds, or 4 kpc, whose kinematics show that sus-tained rotation has not yet occurred. In other words, this object will have to con-tract further.
By contrast, the absorber toward Q1009-0026 has a morphology and kinemat- ics consistent with that of a disc, with a normal dispersion profile (v/s = 1.45) peaking at the centre speak = 190 km/s and flattening in the outer parts to sdisc = 60–70 km/s (see Table 2). This object is more face-on with an estimated inclination of sin i = 0.60 derived from
Table 2. Kinematic properties and mass estimates of the two NHi absorbers detected. Note: The inclination is the main source of uncertain-ties and is estimated to be around 30 %. a The higher resolution HST/WFPC2 data from
Le Brun et al. (1997) clearly shows that the object is subdivided into two sub-components, consistent with the elongated shape seen in the SINFONI data presented here. In this table, however, the ob-ject is treated as single.
Quasar
Q0302–223a
Q1009–0026
sin i
0.88
0.60
v/s
0.19
1.45
r1/2(?)
0.7
0.5
SSFR(MA/yr/kpc2)
0.13
0.31
Mdyn(MA)
1010.3
1010.9
Sgas(MA/pc2)
101.9
102.2
Mgas(MA)
109.1
109.2
Mhalo(MA)
–
1012.6
M*(MA)
109.5
–
constraints on the baryonic mass fraction in this galaxy. We derive a gas fraction of one third. Such gas fractions are in the low range of the typical values derived in z ~ 2–3 galaxies by others. When com-paring these various mass estimates, we see that these systems have little room for molecular gas, which is consistent with the low star formation rates derived.
Future prospects
The observational set-up of SINFONI has demonstrated the power of integral field spectroscopy for deriving a number of emission properties for quasar ab -sorbers, a type of high-redshift galaxy that has been difficult to identify in the past. These new tools are now available to study these objects systematically and work is continuing to expand the sur-vey with three new additional detections recently reported (Péroux et al., 2011c). This type of study illustrates that detailed studies of quasar absorbers can offer entirely new insights into our knowledge of the interaction between stars and the interstellar gas in galaxies.
References
Bouché, N. et al. 2007, ApJ, 669, L5Bouché, N. et al. 2011, MNRAS, submittedCresci, G. et al. 2010, Nature, 467, 811Le Brun, V. et al. 1997, A&A, 321, 733Noterdaeme, P. et al. 2009, A&A, 505, 1087Pettini, M. & Pagel, B. E. J. 2004, MNRAS, 348L, 59Péroux, C. et al. 2005, MNRAS, 363, 479Péroux, C. et al. 2011a, MNRAS, 410, 2237Péroux, C. et al. 2011b, MNRAS, 410, 2251Péroux, C. et al. 2011c, MNRAS, submitted