THE INFLUENCE OF CALCINATION TEMPERATURE ON IRON … · 2016-12-07 · dikenalpasti menggunakan...
13
Malaysian Journal of Analytical Sciences, Vol 20 No 6 (2016): 1286 - 1298 DOI: http://dx.doi.org/10.17576/mjas-2016-2006-07 1286 MALAYSIAN JOURNAL OF ANALYTICAL SCIENCES Published by The Malaysian Analytical Sciences Society THE INFLUENCE OF CALCINATION TEMPERATURE ON IRON OXIDE (α-Fe 2 O 3 ) TOWARDS CO 2 ADSORPTION PREPARED BY SIMPLE MIXING METHOD (Kesan Suhu Pengkalsinan Ferum Oksida (α-Fe 2 O 3 ) Disediakan Melalui Kaedah Campuran Ringkas Terhadap Penjerapan CO 2 ) Azizul Hakim 1 *, Mohd. Ambar Yarmo 1 , Tengku Sharifah Marliza 1,2 , Maratun Najiha Abu Tahari 1 , Wan Zurina Samad 1 , Muhammad Rahimi Yusop 1 , Mohamed Wahab Mohamed Hisham 1 , Norliza Dzakaria 1,3 1 Catalysis Research Group, School of Chemical Sciences and Food Technology, Faculty of Science and Technology, Universiti Kebangsaan Malaysia, 43600 UKM Bangi, Selangor, Malaysia 2 Catalysis Science and Technology Research Centre, Faculty of Science, Universiti Putra Malaysia, 43400 UPM Serdang, Selangor, Malaysia 3 School of Chemistry and Environmental, Faculty of Applied Science, University Teknologi Mara (UiTM) Negeri Sembilan, Kampus Kuala Pilah, Pekan Parit Tinggi, 72000 Kuala Pilah, Negeri Sembilan, Malaysia *Corresponding author: [email protected] Received: 7 February 2016; Accepted: 3 July 2016 Abstract Synthesized iron oxide, α-Fe 2 O 3 used for CO 2 capturing was prepared by a simple mixing method and calcined at temperatures in a range of 350 – 850 °C. CO 2 adsorption isotherms at 25 °C and 1 atm found that the sample namely s450 that calcined at 450 °C gave the highest CO 2 adsorption activity with the adsorption capacity of 17.0 mg CO2 /g adsorbent . Monodentate carbonate, bidentate carbonate and bicarbonates formation were observed on s450 through the IR spectra. The basicity of s450 was identified by chemisorption of CO-TPD which contains weak, medium and strong basic sites with CO total adsorbed amount of 1.99 cm 3 /g. It was found that s450 calcined at 450 °C has certain crystallite peaks that abruptly increased through the XRD diffractogram. The texture properties of s450 generated high porosity and more uniform sphere shape particle size with high surface area (50.5 m 2 /g). Furthermore, it is composed of trimodal distribution for pore size distribution curve desirable for CO 2 adsorption. Keywords: CO 2 capture, adsorption, iron oxide, solid adsorbent, porosity Abstrak Penjerapan CO 2 terhadap ferum oksida, α-Fe 2 O 3 yang disintesis melalui kaedah campuran ringkas dan dikalsin pada suhu 350- 850 °C. Penjerapan isoterma CO 2 pada suhu bilik, 25 °C and 1 atm mendapati sampel s450 yang dikalsin pada suhu 450 °C menunjukkan aktiviti penjerapan CO 2 paling tinggi dengan keupayaan penjerapan sebanyak 17.0 mg CO2 /g penjerap . Spektrum IR telah membuktikan pembentukan spesis monodentat karbonat, bidentat karbonat dan bikarbonat pada s450. Sifat bes s450 yang dikenalpasti menggunakan jerapan kimia CO-TPD dimana jumlah CO yang dijerap oleh tapak bes lemah, sederhana dan kuat adalah 1.99 cm 3 /g. Difraktogram XRD pula menunjukkan terdapat beberapa puncak kekisi yang meningkat. Tekstur s450 pula mempunyai keporosan yang tinggi dan bentuk sfera yang lebih sekata serta luas permukaan yang tinggi (50.5 m 2 /g). Tambahan lagi, graf taburan saiz liang s450 juga terdiri daripada taburan jenis trimodal yang menjadi salah satu faktor penting dalam penjerapan CO 2 . Kata kunci: penjerapan CO 2 , penjerapan, ferum oksida, penjerapan pepejal, keporosan ISSN 1394 - 2506
Transcript of THE INFLUENCE OF CALCINATION TEMPERATURE ON IRON … · 2016-12-07 · dikenalpasti menggunakan...
Malaysian Journal of Analytical Sciences, Vol 20 No 6 (2016): 1286 - 1298
DOI: http://dx.doi.org/10.17576/mjas-2016-2006-07
1286
MALAYSIAN JOURNAL OF ANALYTICAL SCIENCES
Published by The Malaysian Analytical Sciences Society
THE INFLUENCE OF CALCINATION TEMPERATURE ON IRON OXIDE
(α-Fe2O3) TOWARDS CO2 ADSORPTION PREPARED BY SIMPLE MIXING
METHOD
(Kesan Suhu Pengkalsinan Ferum Oksida (α-Fe2O3) Disediakan Melalui Kaedah Campuran
Ringkas Terhadap Penjerapan CO2)
Azizul Hakim1*, Mohd. Ambar Yarmo
1, Tengku Sharifah Marliza
1,2, Maratun Najiha Abu Tahari
1,
Wan Zurina Samad1, Muhammad Rahimi Yusop
1, Mohamed Wahab Mohamed Hisham
1, Norliza Dzakaria
1,3
1Catalysis Research Group, School of Chemical Sciences and Food Technology, Faculty of Science and Technology,
Universiti Kebangsaan Malaysia, 43600 UKM Bangi, Selangor, Malaysia 2Catalysis Science and Technology Research Centre, Faculty of Science,
Universiti Putra Malaysia, 43400 UPM Serdang, Selangor, Malaysia 3School of Chemistry and Environmental, Faculty of Applied Science,
University Teknologi Mara (UiTM) Negeri Sembilan,
Kampus Kuala Pilah, Pekan Parit Tinggi, 72000 Kuala Pilah, Negeri Sembilan, Malaysia
*Corresponding author: [email protected]
Received: 7 February 2016; Accepted: 3 July 2016
Abstract
Synthesized iron oxide, α-Fe2O3 used for CO2 capturing was prepared by a simple mixing method and calcined at temperatures
in a range of 350 – 850 °C. CO2 adsorption isotherms at 25 °C and 1 atm found that the sample namely s450 that calcined at 450
°C gave the highest CO2 adsorption activity with the adsorption capacity of 17.0 mgCO2/gadsorbent. Monodentate carbonate,
bidentate carbonate and bicarbonates formation were observed on s450 through the IR spectra. The basicity of s450 was
identified by chemisorption of CO-TPD which contains weak, medium and strong basic sites with CO total adsorbed amount of
1.99 cm3/g. It was found that s450 calcined at 450 °C has certain crystallite peaks that abruptly increased through the XRD
diffractogram. The texture properties of s450 generated high porosity and more uniform sphere shape particle size with high
surface area (50.5 m2/g). Furthermore, it is composed of trimodal distribution for pore size distribution curve desirable for CO2
adsorption.
Keywords: CO2 capture, adsorption, iron oxide, solid adsorbent, porosity
Abstrak
Penjerapan CO2 terhadap ferum oksida, α-Fe2O3 yang disintesis melalui kaedah campuran ringkas dan dikalsin pada suhu 350-
850 °C. Penjerapan isoterma CO2 pada suhu bilik, 25 °C and 1 atm mendapati sampel s450 yang dikalsin pada suhu 450 °C
menunjukkan aktiviti penjerapan CO2 paling tinggi dengan keupayaan penjerapan sebanyak 17.0 mgCO2/gpenjerap. Spektrum IR
telah membuktikan pembentukan spesis monodentat karbonat, bidentat karbonat dan bikarbonat pada s450. Sifat bes s450 yang
dikenalpasti menggunakan jerapan kimia CO-TPD dimana jumlah CO yang dijerap oleh tapak bes lemah, sederhana dan kuat
adalah 1.99 cm3/g. Difraktogram XRD pula menunjukkan terdapat beberapa puncak kekisi yang meningkat. Tekstur s450 pula
mempunyai keporosan yang tinggi dan bentuk sfera yang lebih sekata serta luas permukaan yang tinggi (50.5 m2/g). Tambahan
lagi, graf taburan saiz liang s450 juga terdiri daripada taburan jenis trimodal yang menjadi salah satu faktor penting dalam
penjerapan CO2.
Kata kunci: penjerapan CO2, penjerapan, ferum oksida, penjerapan pepejal, keporosan
ISSN
1394 - 2506
Azizul Hakim et al: THE INFLUENCE OF CALCINATION TEMPERATURE ON IRON OXIDE (α-Fe2O3)
TOWARDS CO2 ADSORPTION PREPARED BY SIMPLE MIXING METHOD
1287
Introduction
The main concern worldwide over the recent years is renewable energy which could generate for the rest of decades
without worrying about the depletion of sources in the earth. Human population and consumption are directly
proportional with the addition of technology provided and yet keep growth explosively which completed with
extensive research and development in the industry and academic. This progressive situation made human realized
with considerable attentions were paid to the green technology by using the anthropocentric environmental ethics
which is people centered as an approach to reduce environmental pollutions and save the earth and future
generation. It gave rise to anthropocentric individuals to feel the environment should be protected because of its
value in maintaining or enhancing the quality of life for human [1].
Rapid growth development resulting in harmful air pollutants released into the atmosphere which became the major
contribution in the global warming and several issues on urban smog, acid rain, and health problems contributed
from emission of anthropogenic CO2 [2]. The CO2 in atmosphere, one of the major greenhouse gases, is now higher
than the safety limit for the atmospheric CO2 level of 350 ppm. According to the National Oceanic and Atmospheric
Administration (NOAA) in U.S, the CO2 level was higher than the safety limit since 80’s and to date on September
2015 was approximately 397.63 ppm. Furthermore, the increased CO2 growth rate about 2.0 ppm/year gives rise to
the mitigating measure of capturing CO2 [3].
According to Freund and Roberts [4], chemisorbed species is connected with the formation of CO2δ-
, the anionic
molecule, which involves the charge transfer from the metal to the molecule. Consequently, the α-Fe2O3 decorated
as the basic oxide where the CO2 chemisorption involves the basic sites that act as electron donors and are
associated with O2− ions localized on surface defects [5]. The physisorption is found in almost all cases whereas the
chemisorbed species are only observed under very specific conditions: the surfaces have to be either atomically
rough, containing a high defect: density in order to stabilize the chemisorbed species, or are alkali metal modified
surfaces [4].
Metal oxides of calcium oxide (CaO) were among the earliest studies in the CO2 capture that has promising
properties of high adsorption capacity [6]. However, it consumed high energy during the desorption process up to
900 °C which is economically not favourable. Thus, the capability of the alternative adsorbents from the metal
oxides was studied. The desorption process that required heat to dissociate formed carbonate can be explained by
the interaction of CO2 as adsorbate on the adsorbent which depends on its binding energy. In fact, others than alkali
metal and alkali earth metal oxides, several metal oxides have been reported for a single crystal oxide that shows its
capability in the CO2 capture. Kwon et al. [7] reported the dissociation carbonate product on lanthanum sesquioxide
(La2O3) using the IR frequencies at 500°C. Furthermore, the desorption temperature was increased to 700 °C when
higher pressure was used during the CO2 adsorption [8]. Silver oxide (AgO) exhibited desorption temperature at
247°C that was observed under the scanning tunnelling microscopy (STM) [9]. Meanwhile, Yoshikawa [10]
discovered the order of dissociation of the different carbonate species (bicarbonate, monodentate, bidentate and
polydentate carbonate) on cerium oxide (CeO2) at the temperature range of 50 – 450 °C. Among the copper oxides
(CuO and Cu2O), it was found that copper (II) oxide (CuO) showed a higher adsorption capacity by physisorbed of
17.7 mg CO2/g adsorbent and chemisorbed of 9.5 mmol/g with three times regeneration without significant loss of
performance [11]. Our works reported that NiO exhibited adsorption capacity of 14.1 and 87.0 mg CO2/g adsorbent
by physio- and chemisorption respectively, with the desorption temperature range of 400 – 460 °C [12].
Previous studies of iron oxides, α-Fe2O3 as adsorbent showed evidence on the presence of various carbonate species
formations such as monodentate, bidentate, and bicarbonate forms on the metal oxides adsorbent surface [13-17].
These studies described carbonates formation using the Fourier transfer infra red (FTIR) spectroscopy to analyze the
configuration of C-O interaction with iron oxide surface. Ismail et al. [18] reported CO2 adsorption by using the iron
material from a steel-pickling waste (97 wt% FeSO4.7H2O). The original material was roasted at 700 °C for 5 hours
in air, oxygen, and nitrogen prior to the adsorption process. However, none of these researches reported the basicity
active site that contributes to CO2.
Malaysian Journal of Analytical Sciences, Vol 20 No 6 (2016): 1286 - 1298
DOI: http://dx.doi.org/10.17576/mjas-2016-2006-07
1288
In this study, α-Fe2O3 was synthesized by using a simple mixing method in order to obtain the preferable surfaces.
The α-Fe2O3 was synthesized by using a low cost method to identify the optimum calcination temperature and
quantify the basicity properties. Hence, the amount of CO2 adsorbed physically at room temperature, 25°C and 1
atm was measured using the volumetric adsorption technique.
Materials and Methods
Sample preparation
The analytical grade iron (III) nitrate nonahydrate (Fe(NO3)3·9H2O, 98%) and ethanol (C2H5OH, 99.7%) were
purchased from Sigma-Aldrich, USA and Systerm, Malaysia respectively. The bulk α-Fe2O3 obtained from BDH,
United Kingdom was treated by calcined under nitrogen flow at 150 °C for 1 hour. The simple mixing method is
very useful to produce α-Fe2O3 nanoparticles with low cost of starting materials. This method was modified from
literature reported by Dong et al. [19]. The Fe(NO3)3·9H2O was weighed to 16.16 g and dissolved in 20 ml distilled
water to have concentration of 2 M. To this solution, ethanol was added with a volume percentage of 25% from the
distilled water used and stirred for 1 hour at room temperature. The concentration of 2 M precursor was found to be
the shortest time formation with a connection of large number of Fe(OH)3 fine particles. Ethanol acts as a stabilizer
for the colloidal particles avoid aggregation [19]. The solution was sonicated for 20 minutes to obtain better
homogeneous condition and dried with vigorous stirring at the temperature of 80 – 100 °C. The dried solid was
ground and kept in an oven for 24 hours at 110 °C. Finally, it was calcined under the air flow at the temperature
ranging from 350 – 850 °C. The samples were labeled by the calcination temperatures namely: bulk, s350, s450,
s550, s650, s750 and s850.
Characterization
These samples were characterized with Bruker AXS D8 Advance type with X-ray radiation source of Cu Kα (40
kV, 40 mA) to obtain the X-ray Diffraction (XRD) pattern. The crystal structures were verified by recording 2θ
diffraction angle from 10° to 90° at wavelength (λ = 0.154 nm). The diffraction pattern obtained was matched with a
standard diffraction data (JCPDS) file for identification of the crystalline phase composition.
The physical surface analysis of N2 adsorption-desorption was conducted at 77 K in a Micromeritics ASAP 2020
instrument to determine the textural surface properties of the prepared samples. The catalysts were degassed at
200°C for 6 hours prior to analysis. The volumetric adsorption apparatus was used to determine the surface area and
N2 adsorption-desorption isotherm using the BET equation [20]. Pore volumes and pore size distribution were
determined by Barret–Joyner–Halenda (BJH) method and applied based on the adsorption branch. The t-plot
method was used to calculate the non-microporous (or external) surface area considerable as the mesoporous
surface area [21-23]. The total pore volumes were estimated to be the liquid volume of adsorbate (N2) at a relative
pressure. All surface areas were calculated from the N2 adsorption isotherms by assuming the area of a N2 molecule
to be 0.162 nm2 [20]. The CO2 adsorption behaviors of the sorbents were evaluated using the above mentioned
instrument and evaluated at 25°C and 1 atm with circulated water bath and using 99.9% of purified CO2 gas as
adsorbate.
The particle sizes and morphology of the catalysts were measured by the transmission electron microscopy (TEM,
CM12 Philips) which is equipped with an electron gun 200 kV. The synthesized of α-Fe2O3 before and after the
exposure with CO2 (5% and 15% of CO2) as well as after temperature programmed desorption (TPD) at 650°C were
examined using the Fourier transform infrared (FTIR) spectroscopy. The spectra of the samples were recorded
between 4000 and 650 cm-1
in spectrum 400, FTIR Spectrometer (Perkin Elmer, UK) using the Attenuated Total
Reflection (ATR) method for the sample preparation technique.
The basicity properties of catalysts were performed by the TPD from a conventional apparatus of Chemisorption
Analyzer, Micrometrics 2920 Chemisorb. This instrument is equipped with a thermal conductivity detector (TCD).
Approximately 50 mg of catalyst was preheated to 150°C to remove the moisture for 30 minutes before it was
cooled down to 30°C under the pure He gas flow rate of 30 mL/min. The catalyst was exposed with a gas mixture of
5% CO in He in a constant temperature of 40°C under flow rate 30 mL/min for 60 minutes. The pure He gas again
was introduced to the catalyst for the purpose of removing excess of the weak physically adsorbed CO at 50°C for
30 minutes. The TPD required ice to trap the moisture which was placed in the container of instrument prior to the
Azizul Hakim et al: THE INFLUENCE OF CALCINATION TEMPERATURE ON IRON OXIDE (α-Fe2O3)
TOWARDS CO2 ADSORPTION PREPARED BY SIMPLE MIXING METHOD
1289
measurements and heated to 900°C with the heating rate of 10°C/min under pure He. The samples after the
CO2-TPD analysis by using 5% and 15% CO2 were collected using above mentioned conditions and observed
through FTIR.
Results and Discussion
XRD pattern
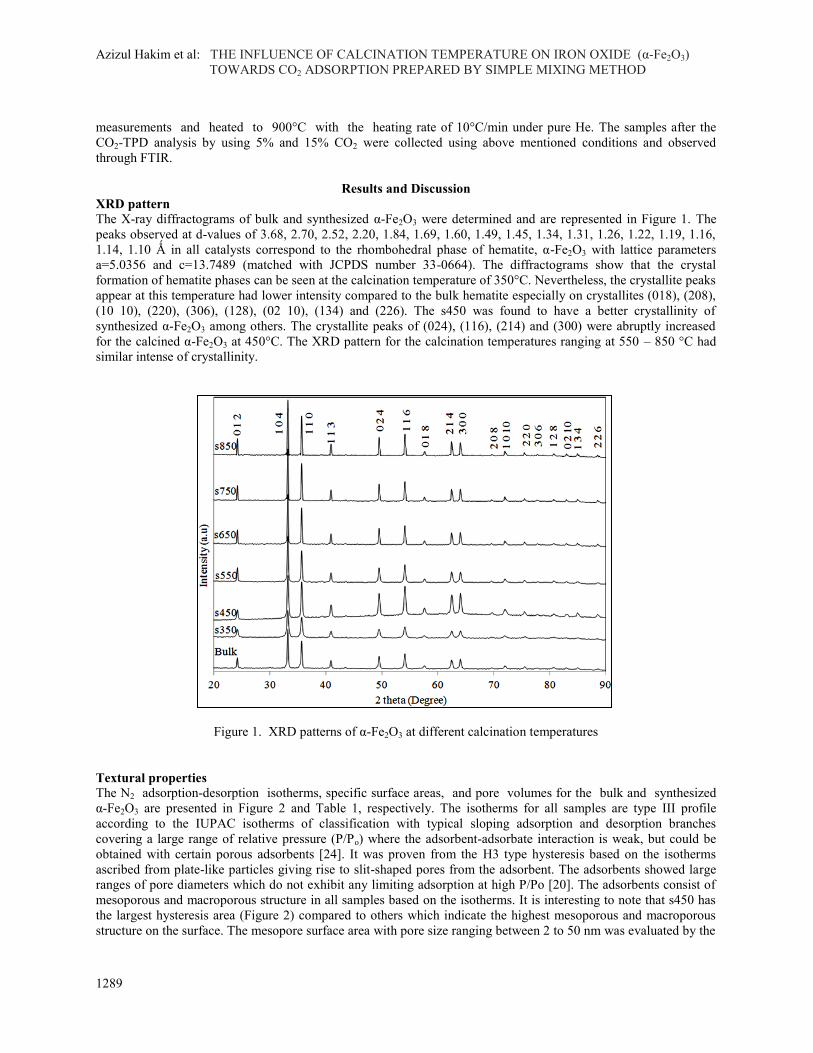
The X-ray diffractograms of bulk and synthesized α-Fe2O3 were determined and are represented in Figure 1. The
peaks observed at d-values of 3.68, 2.70, 2.52, 2.20, 1.84, 1.69, 1.60, 1.49, 1.45, 1.34, 1.31, 1.26, 1.22, 1.19, 1.16,
1.14, 1.10 Ǻ in all catalysts correspond to the rhombohedral phase of hematite, α-Fe2O3 with lattice parameters
a=5.0356 and c=13.7489 (matched with JCPDS number 33-0664). The diffractograms show that the crystal
formation of hematite phases can be seen at the calcination temperature of 350°C. Nevertheless, the crystallite peaks
appear at this temperature had lower intensity compared to the bulk hematite especially on crystallites (018), (208),
(10 10), (220), (306), (128), (02 10), (134) and (226). The s450 was found to have a better crystallinity of
synthesized α-Fe2O3 among others. The crystallite peaks of (024), (116), (214) and (300) were abruptly increased
for the calcined α-Fe2O3 at 450°C. The XRD pattern for the calcination temperatures ranging at 550 – 850 °C had
similar intense of crystallinity.
Figure 1. XRD patterns of α-Fe2O3 at different calcination temperatures
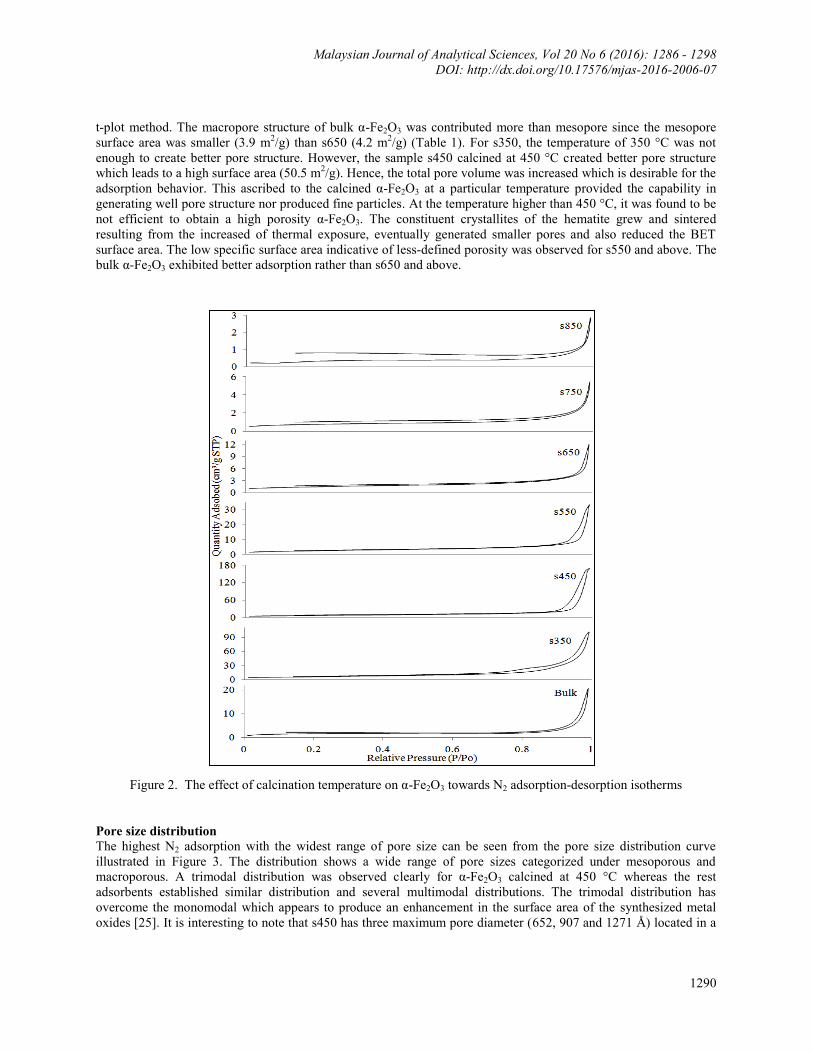
Textural properties
The N2 adsorption-desorption isotherms, specific surface areas, and pore volumes for the bulk and synthesized
α-Fe2O3 are presented in Figure 2 and Table 1, respectively. The isotherms for all samples are type III profile
according to the IUPAC isotherms of classification with typical sloping adsorption and desorption branches
covering a large range of relative pressure (P/Po) where the adsorbent-adsorbate interaction is weak, but could be
obtained with certain porous adsorbents [24]. It was proven from the H3 type hysteresis based on the isotherms
ascribed from plate-like particles giving rise to slit-shaped pores from the adsorbent. The adsorbents showed large
ranges of pore diameters which do not exhibit any limiting adsorption at high P/Pο [20]. The adsorbents consist of
mesoporous and macroporous structure in all samples based on the isotherms. It is interesting to note that s450 has
the largest hysteresis area (Figure 2) compared to others which indicate the highest mesoporous and macroporous
structure on the surface. The mesopore surface area with pore size ranging between 2 to 50 nm was evaluated by the
Malaysian Journal of Analytical Sciences, Vol 20 No 6 (2016): 1286 - 1298
DOI: http://dx.doi.org/10.17576/mjas-2016-2006-07
1290
t-plot method. The macropore structure of bulk α-Fe2O3 was contributed more than mesopore since the mesopore
surface area was smaller (3.9 m2/g) than s650 (4.2 m
2/g) (Table 1). For s350, the temperature of 350 °C was not
enough to create better pore structure. However, the sample s450 calcined at 450 °C created better pore structure
which leads to a high surface area (50.5 m2/g). Hence, the total pore volume was increased which is desirable for the
adsorption behavior. This ascribed to the calcined α-Fe2O3 at a particular temperature provided the capability in
generating well pore structure nor produced fine particles. At the temperature higher than 450 °C, it was found to be
not efficient to obtain a high porosity α-Fe2O3. The constituent crystallites of the hematite grew and sintered
resulting from the increased of thermal exposure, eventually generated smaller pores and also reduced the BET
surface area. The low specific surface area indicative of less-defined porosity was observed for s550 and above. The
bulk α-Fe2O3 exhibited better adsorption rather than s650 and above.
Figure 2. The effect of calcination temperature on α-Fe2O3 towards N2 adsorption-desorption isotherms
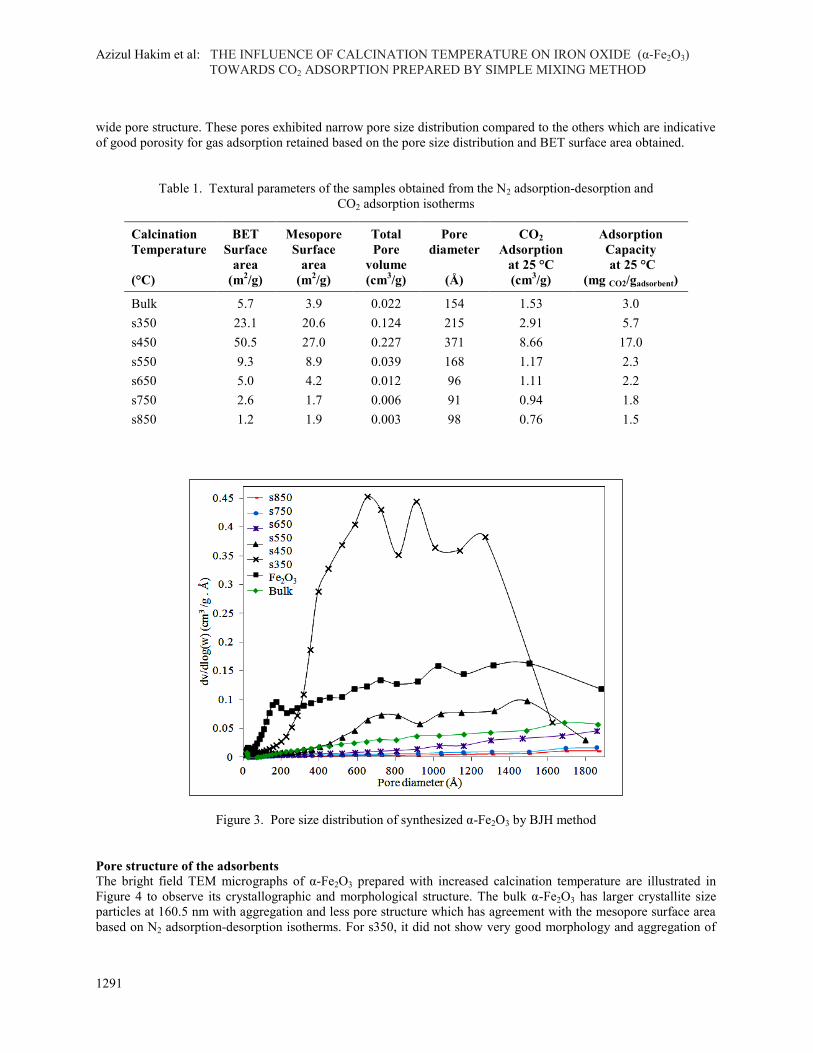
Pore size distribution
The highest N2 adsorption with the widest range of pore size can be seen from the pore size distribution curve
illustrated in Figure 3. The distribution shows a wide range of pore sizes categorized under mesoporous and
macroporous. A trimodal distribution was observed clearly for α-Fe2O3 calcined at 450 °C whereas the rest
adsorbents established similar distribution and several multimodal distributions. The trimodal distribution has
overcome the monomodal which appears to produce an enhancement in the surface area of the synthesized metal
oxides [25]. It is interesting to note that s450 has three maximum pore diameter (652, 907 and 1271 Å) located in a
Azizul Hakim et al: THE INFLUENCE OF CALCINATION TEMPERATURE ON IRON OXIDE (α-Fe2O3)
TOWARDS CO2 ADSORPTION PREPARED BY SIMPLE MIXING METHOD
1291
wide pore structure. These pores exhibited narrow pore size distribution compared to the others which are indicative
of good porosity for gas adsorption retained based on the pore size distribution and BET surface area obtained.
Table 1. Textural parameters of the samples obtained from the N2 adsorption-desorption and
CO2 adsorption isotherms
Figure 3. Pore size distribution of synthesized α-Fe2O3 by BJH method
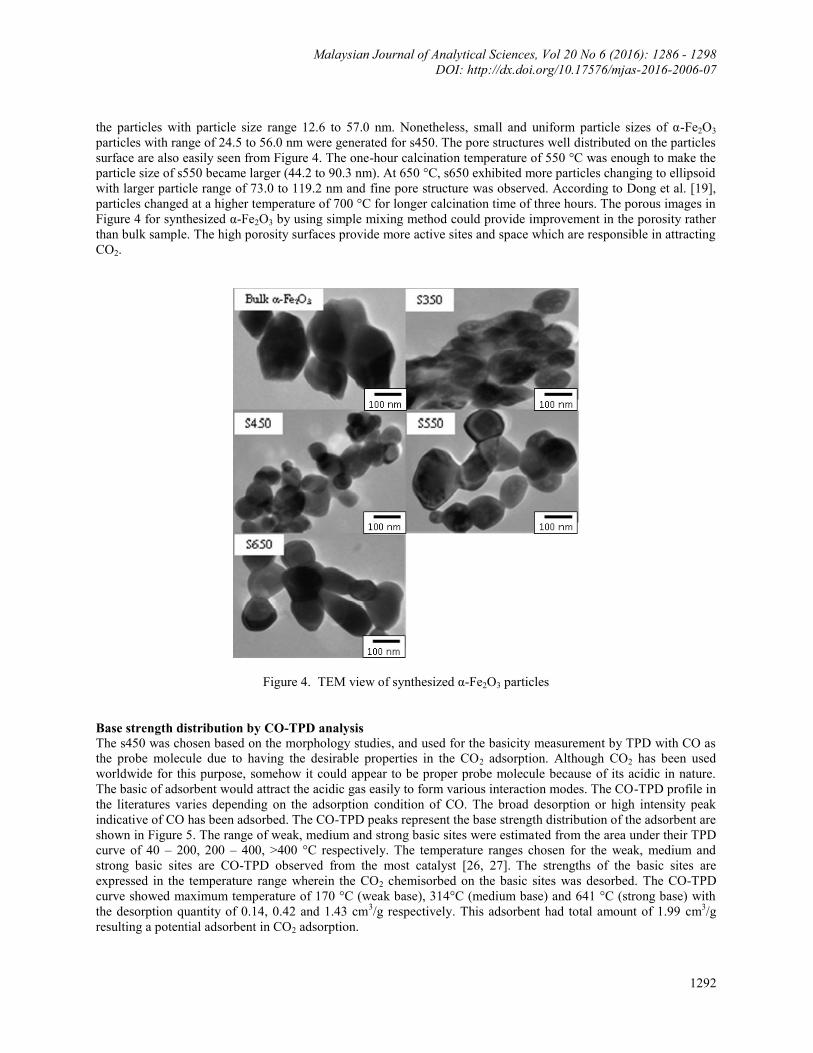
Pore structure of the adsorbents
The bright field TEM micrographs of α-Fe2O3 prepared with increased calcination temperature are illustrated in
Figure 4 to observe its crystallographic and morphological structure. The bulk α-Fe2O3 has larger crystallite size
particles at 160.5 nm with aggregation and less pore structure which has agreement with the mesopore surface area
based on N2 adsorption-desorption isotherms. For s350, it did not show very good morphology and aggregation of
Calcination
Temperature
(°C)
BET
Surface
area
(m2/g)
Mesopore
Surface
area
(m2/g)
Total
Pore
volume
(cm3/g)
Pore
diameter
(Å)
CO2
Adsorption
at 25 °C
(cm3/g)
Adsorption
Capacity
at 25 °C
(mg CO2/gadsorbent)
Bulk 5.7 3.9 0.022 154 1.53 3.0
s350 23.1 20.6 0.124 215 2.91 5.7
s450 50.5 27.0 0.227 371 8.66 17.0
s550 9.3 8.9 0.039 168 1.17 2.3
s650 5.0 4.2 0.012 96 1.11 2.2
s750 2.6 1.7 0.006 91 0.94 1.8
s850 1.2 1.9 0.003 98 0.76 1.5
Malaysian Journal of Analytical Sciences, Vol 20 No 6 (2016): 1286 - 1298
DOI: http://dx.doi.org/10.17576/mjas-2016-2006-07
1292
the particles with particle size range 12.6 to 57.0 nm. Nonetheless, small and uniform particle sizes of α-Fe2O3
particles with range of 24.5 to 56.0 nm were generated for s450. The pore structures well distributed on the particles
surface are also easily seen from Figure 4. The one-hour calcination temperature of 550 °C was enough to make the
particle size of s550 became larger (44.2 to 90.3 nm). At 650 °C, s650 exhibited more particles changing to ellipsoid
with larger particle range of 73.0 to 119.2 nm and fine pore structure was observed. According to Dong et al. [19],
particles changed at a higher temperature of 700 °C for longer calcination time of three hours. The porous images in
Figure 4 for synthesized α-Fe2O3 by using simple mixing method could provide improvement in the porosity rather
than bulk sample. The high porosity surfaces provide more active sites and space which are responsible in attracting
CO2.
Figure 4. TEM view of synthesized α-Fe2O3 particles
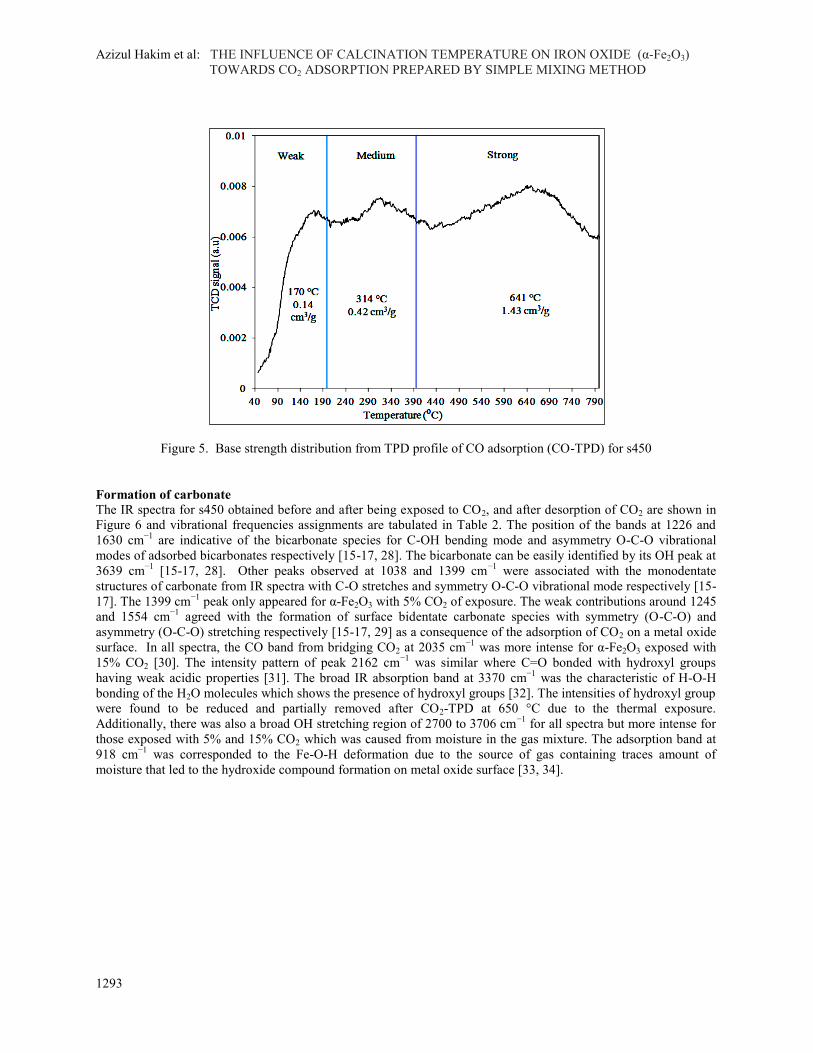
Base strength distribution by CO-TPD analysis
The s450 was chosen based on the morphology studies, and used for the basicity measurement by TPD with CO as
the probe molecule due to having the desirable properties in the CO2 adsorption. Although CO2 has been used
worldwide for this purpose, somehow it could appear to be proper probe molecule because of its acidic in nature.
The basic of adsorbent would attract the acidic gas easily to form various interaction modes. The CO-TPD profile in
the literatures varies depending on the adsorption condition of CO. The broad desorption or high intensity peak
indicative of CO has been adsorbed. The CO-TPD peaks represent the base strength distribution of the adsorbent are
shown in Figure 5. The range of weak, medium and strong basic sites were estimated from the area under their TPD
curve of 40 – 200, 200 – 400, >400 °C respectively. The temperature ranges chosen for the weak, medium and
strong basic sites are CO-TPD observed from the most catalyst [26, 27]. The strengths of the basic sites are
expressed in the temperature range wherein the CO2 chemisorbed on the basic sites was desorbed. The CO-TPD
curve showed maximum temperature of 170 °C (weak base), 314°C (medium base) and 641 °C (strong base) with
the desorption quantity of 0.14, 0.42 and 1.43 cm3/g respectively. This adsorbent had total amount of 1.99 cm
3/g
resulting a potential adsorbent in CO2 adsorption.
Azizul Hakim et al: THE INFLUENCE OF CALCINATION TEMPERATURE ON IRON OXIDE (α-Fe2O3)
TOWARDS CO2 ADSORPTION PREPARED BY SIMPLE MIXING METHOD
1293
Figure 5. Base strength distribution from TPD profile of CO adsorption (CO-TPD) for s450
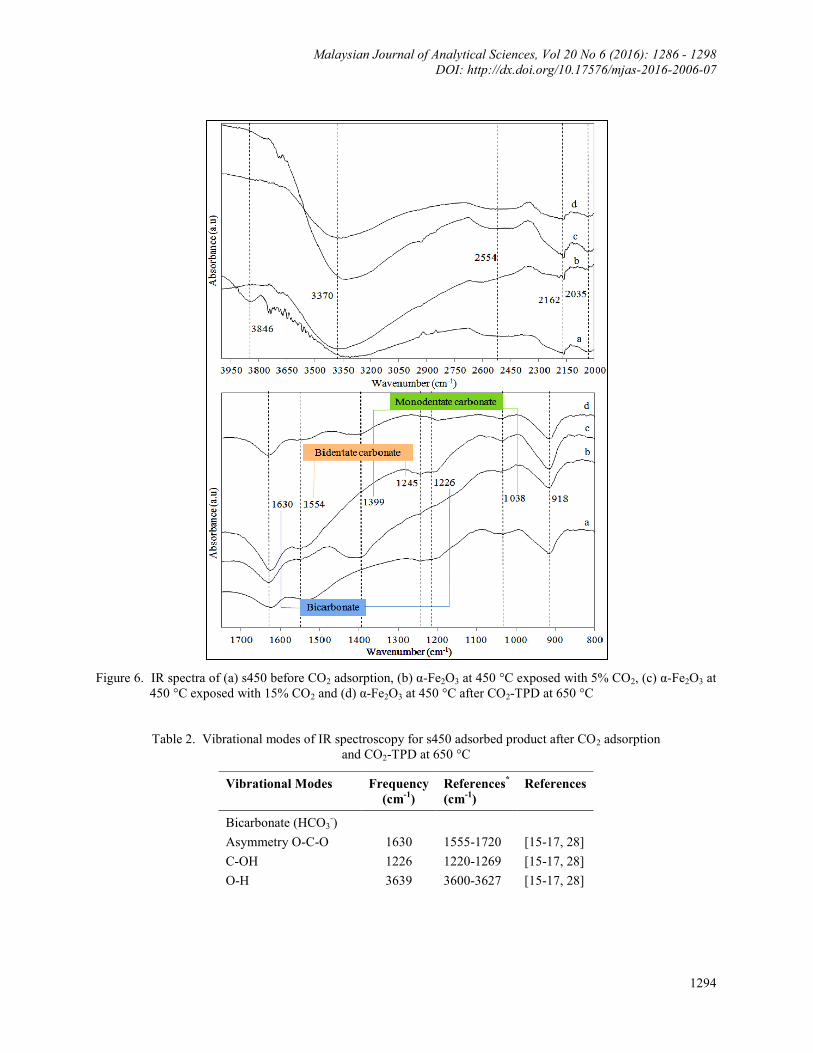
Formation of carbonate
The IR spectra for s450 obtained before and after being exposed to CO2, and after desorption of CO2 are shown in
Figure 6 and vibrational frequencies assignments are tabulated in Table 2. The position of the bands at 1226 and
1630 cm−1
are indicative of the bicarbonate species for C-OH bending mode and asymmetry O-C-O vibrational
modes of adsorbed bicarbonates respectively [15-17, 28]. The bicarbonate can be easily identified by its OH peak at
3639 cm−1
[15-17, 28]. Other peaks observed at 1038 and 1399 cm−1
were associated with the monodentate
structures of carbonate from IR spectra with C-O stretches and symmetry O-C-O vibrational mode respectively [15-
17]. The 1399 cm−1
peak only appeared for α-Fe2O3 with 5% CO2 of exposure. The weak contributions around 1245
and 1554 cm−1
agreed with the formation of surface bidentate carbonate species with symmetry (O-C-O) and
asymmetry (O-C-O) stretching respectively [15-17, 29] as a consequence of the adsorption of CO2 on a metal oxide
surface. In all spectra, the CO band from bridging CO2 at 2035 cm−1
was more intense for α-Fe2O3 exposed with
15% CO2 [30]. The intensity pattern of peak 2162 cm−1
was similar where C=O bonded with hydroxyl groups
having weak acidic properties [31]. The broad IR absorption band at 3370 cm−1
was the characteristic of H-O-H
bonding of the H2O molecules which shows the presence of hydroxyl groups [32]. The intensities of hydroxyl group
were found to be reduced and partially removed after CO2-TPD at 650 °C due to the thermal exposure.
Additionally, there was also a broad OH stretching region of 2700 to 3706 cm−1
for all spectra but more intense for
those exposed with 5% and 15% CO2 which was caused from moisture in the gas mixture. The adsorption band at
918 cm−1
was corresponded to the Fe-O-H deformation due to the source of gas containing traces amount of
moisture that led to the hydroxide compound formation on metal oxide surface [33, 34].
Malaysian Journal of Analytical Sciences, Vol 20 No 6 (2016): 1286 - 1298
DOI: http://dx.doi.org/10.17576/mjas-2016-2006-07
1294
Figure 6. IR spectra of (a) s450 before CO2 adsorption, (b) α-Fe2O3 at 450 °C exposed with 5% CO2, (c) α-Fe2O3 at
450 °C exposed with 15% CO2 and (d) α-Fe2O3 at 450 °C after CO2-TPD at 650 °C
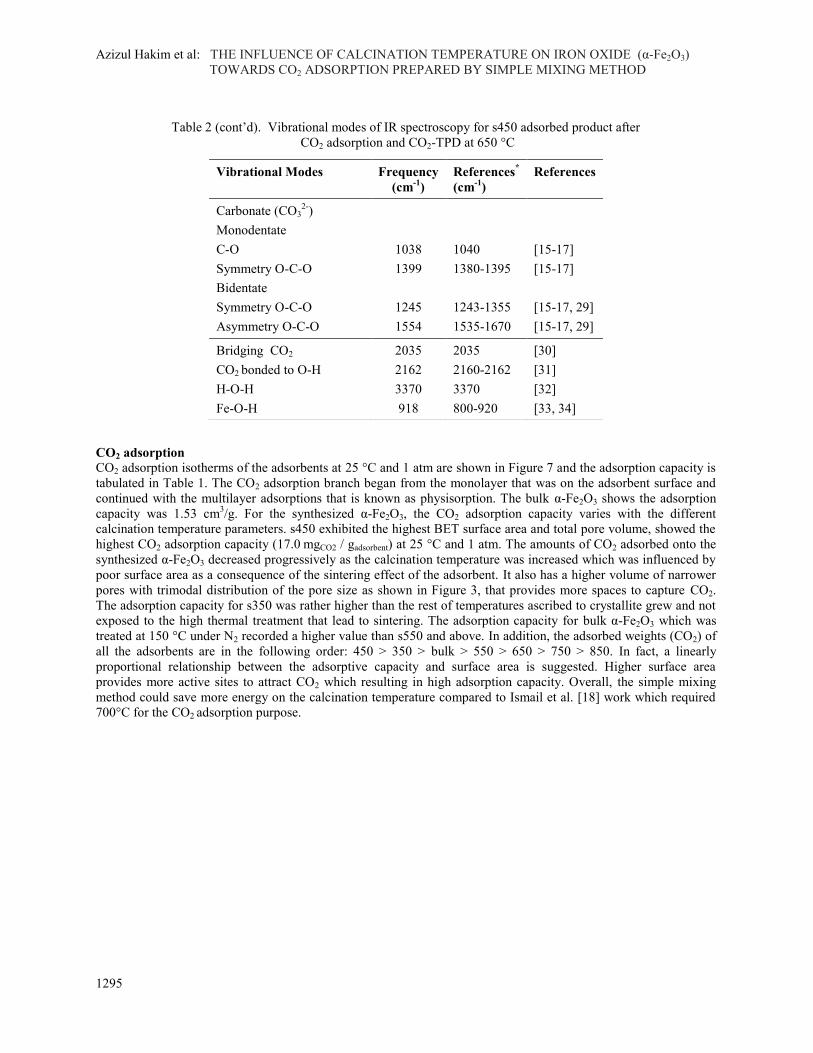
Table 2. Vibrational modes of IR spectroscopy for s450 adsorbed product after CO2 adsorption
and CO2-TPD at 650 °C
Vibrational Modes Frequency
(cm-1
)
References*
(cm-1
)
References
Bicarbonate (HCO3-)
Asymmetry O-C-O 1630 1555-1720 [15-17, 28]
C-OH 1226 1220-1269 [15-17, 28]
O-H 3639 3600-3627 [15-17, 28]
Azizul Hakim et al: THE INFLUENCE OF CALCINATION TEMPERATURE ON IRON OXIDE (α-Fe2O3)
TOWARDS CO2 ADSORPTION PREPARED BY SIMPLE MIXING METHOD
1295
Table 2 (cont’d). Vibrational modes of IR spectroscopy for s450 adsorbed product after
CO2 adsorption and CO2-TPD at 650 °C
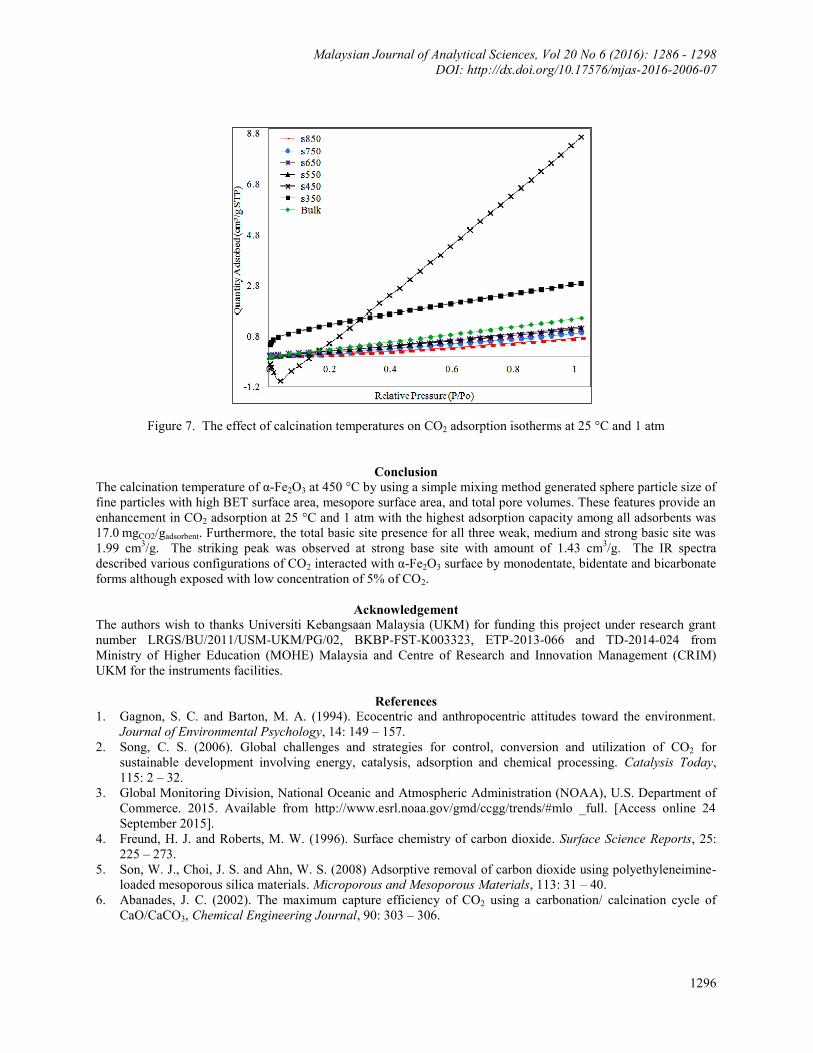
CO2 adsorption
CO2 adsorption isotherms of the adsorbents at 25 °C and 1 atm are shown in Figure 7 and the adsorption capacity is
tabulated in Table 1. The CO2 adsorption branch began from the monolayer that was on the adsorbent surface and
continued with the multilayer adsorptions that is known as physisorption. The bulk α-Fe2O3 shows the adsorption
capacity was 1.53 cm3/g. For the synthesized α-Fe2O3, the CO2 adsorption capacity varies with the different
calcination temperature parameters. s450 exhibited the highest BET surface area and total pore volume, showed the
highest CO2 adsorption capacity (17.0 mgCO2 / gadsorbent) at 25 °C and 1 atm. The amounts of CO2 adsorbed onto the
synthesized α-Fe2O3 decreased progressively as the calcination temperature was increased which was influenced by
poor surface area as a consequence of the sintering effect of the adsorbent. It also has a higher volume of narrower
pores with trimodal distribution of the pore size as shown in Figure 3, that provides more spaces to capture CO2.
The adsorption capacity for s350 was rather higher than the rest of temperatures ascribed to crystallite grew and not
exposed to the high thermal treatment that lead to sintering. The adsorption capacity for bulk α-Fe2O3 which was
treated at 150 °C under N2 recorded a higher value than s550 and above. In addition, the adsorbed weights (CO2) of
all the adsorbents are in the following order: 450 > 350 > bulk > 550 > 650 > 750 > 850. In fact, a linearly
proportional relationship between the adsorptive capacity and surface area is suggested. Higher surface area
provides more active sites to attract CO2 which resulting in high adsorption capacity. Overall, the simple mixing
method could save more energy on the calcination temperature compared to Ismail et al. [18] work which required
700°C for the CO2 adsorption purpose.
Vibrational Modes Frequency
(cm-1
)
References*
(cm-1
)
References
Carbonate (CO32-
)
Monodentate
C-O 1038 1040 [15-17]
Symmetry O-C-O 1399 1380-1395 [15-17]
Bidentate
Symmetry O-C-O 1245 1243-1355 [15-17, 29]
Asymmetry O-C-O 1554 1535-1670 [15-17, 29]
Bridging CO2 2035 2035 [30]
CO2 bonded to O-H 2162 2160-2162 [31]
H-O-H 3370 3370 [32]
Fe-O-H 918 800-920 [33, 34]
Malaysian Journal of Analytical Sciences, Vol 20 No 6 (2016): 1286 - 1298
DOI: http://dx.doi.org/10.17576/mjas-2016-2006-07
1296
Figure 7. The effect of calcination temperatures on CO2 adsorption isotherms at 25 °C and 1 atm
Conclusion
The calcination temperature of α-Fe2O3 at 450 °C by using a simple mixing method generated sphere particle size of
fine particles with high BET surface area, mesopore surface area, and total pore volumes. These features provide an
enhancement in CO2 adsorption at 25 °C and 1 atm with the highest adsorption capacity among all adsorbents was
17.0 mgCO2/gadsorbent. Furthermore, the total basic site presence for all three weak, medium and strong basic site was
1.99 cm3/g. The striking peak was observed at strong base site with amount of 1.43 cm
3/g. The IR spectra
described various configurations of CO2 interacted with α-Fe2O3 surface by monodentate, bidentate and bicarbonate
forms although exposed with low concentration of 5% of CO2.
Acknowledgement
The authors wish to thanks Universiti Kebangsaan Malaysia (UKM) for funding this project under research grant
number LRGS/BU/2011/USM-UKM/PG/02, BKBP-FST-K003323, ETP-2013-066 and TD-2014-024 from
Ministry of Higher Education (MOHE) Malaysia and Centre of Research and Innovation Management (CRIM)
UKM for the instruments facilities.
References
1. Gagnon, S. C. and Barton, M. A. (1994). Ecocentric and anthropocentric attitudes toward the environment.
Journal of Environmental Psychology, 14: 149 – 157.
2. Song, C. S. (2006). Global challenges and strategies for control, conversion and utilization of CO2 for
sustainable development involving energy, catalysis, adsorption and chemical processing. Catalysis Today,
115: 2 – 32.
3. Global Monitoring Division, National Oceanic and Atmospheric Administration (NOAA), U.S. Department of
Commerce. 2015. Available from http://www.esrl.noaa.gov/gmd/ccgg/trends/#mlo _full. [Access online 24
September 2015].
4. Freund, H. J. and Roberts, M. W. (1996). Surface chemistry of carbon dioxide. Surface Science Reports, 25:
225 – 273.
5. Son, W. J., Choi, J. S. and Ahn, W. S. (2008) Adsorptive removal of carbon dioxide using polyethyleneimine-
loaded mesoporous silica materials. Microporous and Mesoporous Materials, 113: 31 – 40.
6. Abanades, J. C. (2002). The maximum capture efficiency of CO2 using a carbonation/ calcination cycle of
CaO/CaCO3, Chemical Engineering Journal, 90: 303 – 306.
Azizul Hakim et al: THE INFLUENCE OF CALCINATION TEMPERATURE ON IRON OXIDE (α-Fe2O3)
TOWARDS CO2 ADSORPTION PREPARED BY SIMPLE MIXING METHOD
1297
7. Kwon, J. H., Dai, M., Halls, M. D., Langereis, E., Chabal, Y. J. and Gordon, R. G. (2009). In situ infrared
characterization during atomic layer deposition of lanthanum oxide. Journal of Physical Chemistry C., 113: 654
– 660.
8. Rosynek, M. P. and Magnuson, D. T. (1977). Infrared study of CO2 adsorption on lanthanum sesquioxide and
trihydroxide. Journal of Catalysis, 48: 417 – 421.
9. Okawa, Y. and Tanaka, K. (1995). STM investigation of the reaction of Ag-O added rows with CO2 on a Ag
(ll0) surface. Surface Science, 344: 1207 – 1212.
10. Yoshikawa, K., Sato, H., Kaneeda, M. and Kondo, J. M. (2014). Synthesis and analysis of CO2 adsorbents
based on cerium oxide. Journal of CO2 Utilization, 8: 34 – 38.
11. Wan Isahak, W. N. R., Che Ramli, Z. A., Ismail, M. W., Ismail, K., Yusop, R. M., Mohamed Hisham, M. W.
and Yarmo, M. A. (2013). Adsorption–desorption of CO2 on different type of copper oxides surfaces: Physical
and chemical attractions studies. Journal of CO2 Utilization, 2: 8 – 15.
12. Hakim, A., Wan Isahak, W. N. R., Abu Tahari, M. N., Yusop, M. R., Mohamed Hisham, M. W., and Yarmo,
M. A. (2014). Temperature programmed desorption of carbon dioxide for activated carbon supported nickel
oxide: The adsorption and desorption studies. Advanced Materials Research, 1087: 45 – 49.
13. Seyller, T., Borgmann, D. and Wedler. G. (1998). Interaction of CO2 with Cs-promoted Fe (110) as compared
to Fe (110) /K + CO2. Surface Science, 400: 63 – 79.
14. Ramis, G., Busca, G. and Lorenzelli. V. (1991). Low-temperature CO2 adsorption on metal oxides:
Spectroscopic characterization of some weakly adsorbed species. Materials Chemistry and Physics, 29: 425 –
435.
15. Ferretto, L. and Glisenti, A. (2002). Study of the surface acidity of an hematite powder. Journal of Molecular
Catalysis A: Chemical, 187: 119 – 128.
16. Lefevre. G. (2004). In situ Fourier-transform infrared spectroscopy studies of inorganic ions adsorption on
metal oxides and hydroxides. Advance in Colloid and Interface Science, 107: 109 – 123.
17. Baltrusaitis. J., Schuttlefield, J., Zeitler, E. and Grassian, V. H. (2011). Carbon dioxide adsorption on oxide
nanoparticle surfaces. Chemical Engineering Journal, 170: 471 – 481.
18. Ismail, H. M., Cadenhead D. A. and Zaki, M. I. (1997). Surface reactivity of iron oxide pigmentary powders
toward atmospheric components: XPS, FESEM, and gravimetry of CO and CO2 adsorption. Journal of Colloid
and Interface Science, 194: 482 – 488.
19. Dong, W. T., Wu, S. X., Chen, D. P., Jiang, X. W. and Zhu, C. S. (2000). Preparation of α-Fe2O3 nanoparticles
by sol-gel process with inorganic iron salt. Chemistry Letters, 496 – 497.
20. Condon, J. B. (2006). Surface area and porosity determinations by physisorption measurements and theory, 1st
ed., Elsevier, UK: pp. 1 – 28.
21. Hu, Z. H., Srinivasan, M. P. and Ni, Y. M. (2001). Novel activation process for preparing highly microporous
and mesoporous activated carbons. Carbon, 39: 877 – 886.
22. Puziy, A. M., Poddubnaya, O. I., Martinez-Alonso, A., Suarez-Garcia, F. and Tascon, J. M. D. (2002).
Synthetic carbons activated with phosphoric acid II. Porous structure. Carbon, 40: 1507 – 1519.
23. Kennedy, L. J., Mohan das, K. and Sekaran, G. (2004). Integrated biological and catalytic oxidation of
organics/ inorganics in tannery wastewater by rice husk based mesoporous activated carbon-Bacillus sp.
Carbon, 42: 2399 – 2407.
24. Sing, K. S. W., Everett, D. H., Haul, R. A. W., Moscou, L., Pierotti, R. A., Rouquerol, J. and Siemieniewska, T.
(1985). Reporting physisorption data for gas/solid systems with special reference to the determination of
surface area and porosity. International Union of Pure and Applied Chemistry, 57 (4): 603 – 619.
25. Gauden, O. A., Terzyk, A. P., Jaroniec, M. and Kowalczyk, P. (2007). Bimodal pore size distributions for
carbons: Experimental results and computational studies. Journal of Colloid and Interface Science, 310: 205 –
216.
26. Choudhary, V. R., Mulla, S. A. R. and Uphade, B. S. (1999). Oxidative coupling of methane over alkaline earth
oxides deposited on commercial support pre-coated with rare earth oxides. Fuel, 78: 427 – 437.
27. Kus, S., Otremba, M., Torz, A. and Taniewski, M. (2002). Further evidence of responsibility of impurities in
MgO for variability in its basicity and catalytic performance in oxidative coupling of methane. Fuel, 81: 1755 –
1760.
28. Di Cosimo, J. I., Diez, V. K., Xu, M., Iglesia, E. and Apesteguia, C. R. (1998). Structure and surface and
catalytic properties of Mg-Al basic oxides. Journal of Catalysis, 178: 499 – 510.
Malaysian Journal of Analytical Sciences, Vol 20 No 6 (2016): 1286 - 1298
DOI: http://dx.doi.org/10.17576/mjas-2016-2006-07
1298
29. Su, C. M. and Suarez, D. L. (1997). In situ infrared speciation of adsorbed carbonate on aluminium and iron
oxides. Clays and Clay Mineral, 45(6): 814 – 825.
30. Rebenstorf, B. (1991). Modified chromium/silica gel catalysts: An FTIR study of the addition of alkali metal
ions. Acta Chemica Scandinavica, 45: 1012 – 1017.
31. Belskaya, O. B., Danilova, I. G., Kazakov, M. O., Mironenko, R. M., Lavrenov, A. V. and Likholobov, V. A.
(2012). FTIR spectroscopy of adsorbed probe molecules for analyzing the surface properties of supported Pt
(Pd) Catalysts, In T. Theophile (Ed.). Infrared Spectroscopy - Materials Science, Engineering and Technology,
In Tech., Croatia: pp. 149 – 178
32. Chauhan, S. M. and Chakrabarty, B. S. (2014). Lead (Pb) doped fluoride nanocrystals: structural and optical
properties. International Journal of Advanced Research, 2 (7): 607 – 614.
33. Bishop, J. L., Murad, E., Madejova, J., Komadel, P., Wagner, U. and Scheinost, A. C. (1999). Visible,
Mossbauer and infrared spectroscopy of dioctahedral smectites: Structural analyses of the Fe-bearing smectites
Sampor, SWy-1 and SWa-1: 11th
International Clay Conference, Ottawa: pp. 413 – 419.
34. Taylor, R. M. (1980). Formation and properties of Fe (II) Fe (III) hydroxyl-carbonate and its possible
significance in soil formation. Clay Mineral, 15: 369 – 382.