The Coulomb Dissociation of 8B: The Triumph of Good Science
28
The Coulomb Dissociation of 8 B: The Triumph of Good Science Moshe Gai Laboratory for Nuclear Science at Avery Point 1. The Method of CD. 2. The Caltech 94 Saga. 3. The Seattle 05 Saga. 4. What Have We Learned? (Standard Solar Model) San Diego, March 18, 2006
Transcript of The Coulomb Dissociation of 8B: The Triumph of Good Science
The Coulomb Dissociation of 8B: The Triumph of Good Science
Moshe Gai
Laboratory for Nuclear Science at Avery Point
1. The Method of CD. 2. The Caltech 94 Saga. 3. The Seattle 05 Saga. 4. What Have We Learned? (Standard Solar Model)
San Diego, March 18, 2006

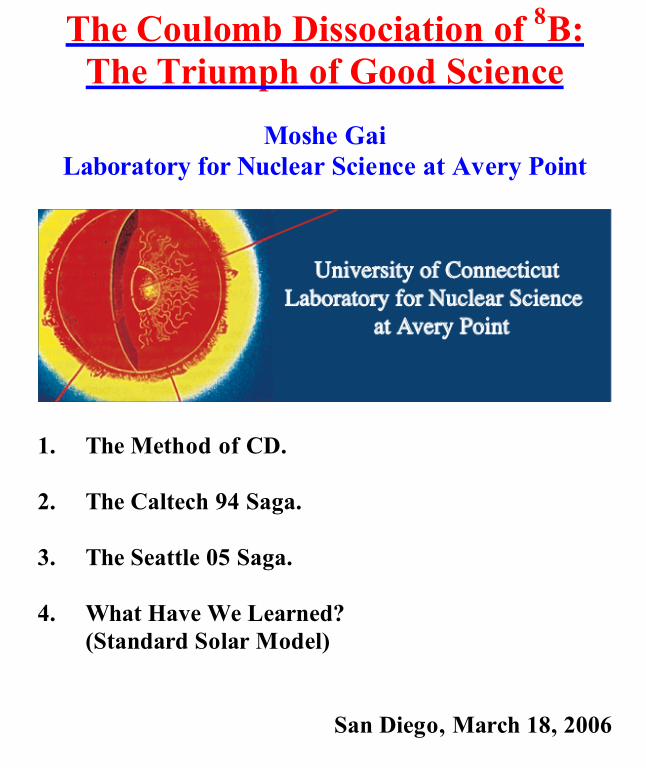
The Laboratory for Nuclear Science At Avery Point
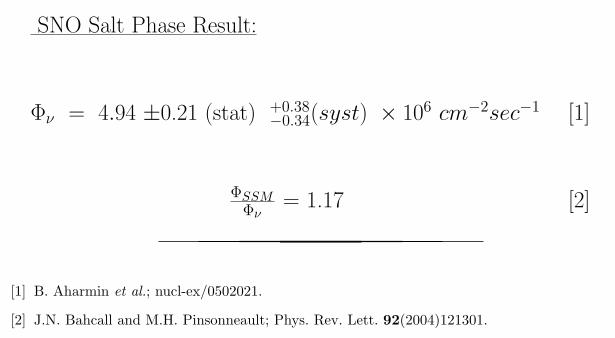
SNO Salt Phase Result:
Φν = 4.94 ±0.21 (stat) +0.38−0.34(syst) × 106 cm−2sec−1 [1]
ΦSSMΦν
= 1.17 [2]
[1] B. Aharmin et al.; nucl-ex/0502021.
[2] J.N. Bahcall and M.H. Pinsonneault; Phys. Rev. Lett. 92(2004)121301.
1
Moshe Gai
Rectangle
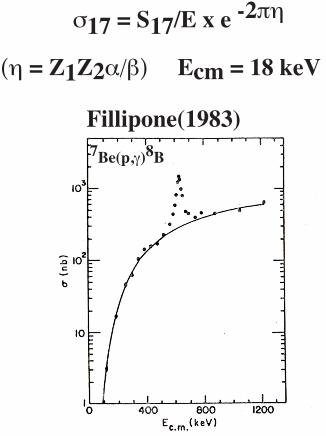
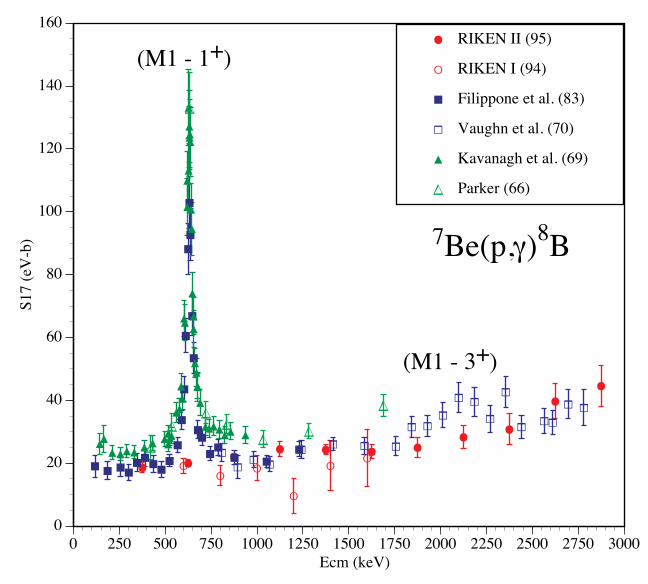
7Be(p,γ)8B
Fillipone(1983)
σ17 = S17/E x e -2πη
(η = Z1Z2α/β) Ecm = 18 keV
Moshe Gai
σ17 = S17/E x e -2πη
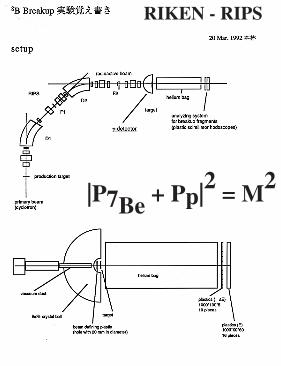
RIKEN - RIPS
|P7Be + Pp|2 = M2
Moshe Gai
Moshe Gai

J JJ
J J J JJ
J
J
J
EE
E
E
EE
BB BB
BBBBB
B
B
B
B
B
B
B
B
B
BB
BBB B
BG
GGG
GG G G
G GG
G G
G
G
GGG
G G
HH
HH
HH
H
H
H
H
H
H
H
H
H
H
H
H
H
H
H
H
HH
H
H
H
H
H
H
H
HHHHHH
H
HH
HHH
H
C
CC
CC
C
C
C
0
20
40
60
80
100
120
140
160
0 250 500 750 1000 1250 1500 1750 2000 2250 2500 2750 3000
S17
(eV
-b)
Ecm (keV)
J RIKEN II (95)
E RIKEN I (94)
B Filippone et al. (83)
G Vaughn et al. (70)
H Kavanagh et al. (69)
C Parker (66)
7Be(p,γ)8B
(M1 - 1+)
(M1 - 3+)
Moshe Gai
Rectangle
Moshe Gai
Rectangle
Moshe Gai
Rectangle
Moshe Gai
Rectangle
Moshe Gai
Rectangle
Moshe Gai
Rectangle
Moshe Gai
Rectangle
Moshe Gai
Rectangle
Moshe Gai
Rectangle
Moshe Gai
Rectangle
Moshe Gai
Rectangle
Moshe Gai
Rectangle
Moshe Gai
Rectangle
Moshe Gai
Rectangle
Moshe Gai
Line
Moshe Gai
Line
Moshe Gai
Line
Moshe Gai
Rectangle
Moshe Gai
Rectangle
Moshe Gai
Rectangle
Moshe Gai
Rectangle
10
0
1000
2000
3000
E1E1+E2
a) θ8<0.620
-30 0 30
cou
nts
a) θ8<1.00
-30 0 30
ptin (MeV/c)
a) θ8<2.50
-30 0 30
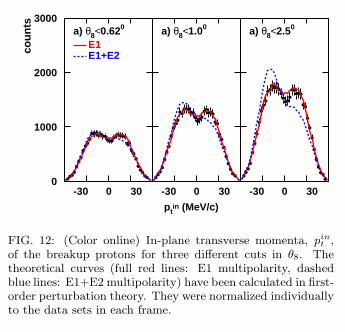
FIG. 12: (Color online) In-plane transverse momenta, pint ,
of the breakup protons for three different cuts in θ8. Thetheoretical curves (full red lines: E1 multipolarity, dashedblue lines: E1+E2 multipolarity) have been calculated in first-order perturbation theory. They were normalized individuallyto the data sets in each frame.
sical Rutherford scattering, this corresponds to impactparameters of 30 fm, 18.5 fm, and 7 fm, respectively.Relative energies between p and 7Be up to 1.5 MeV wereselected. The experimental data for all three θ8-cuts canbe reproduced well by a PT calculation that includes onlyE1 multipolarity (full histograms in Fig. 12, the theoreti-cal curves were normalized individually to the data sets).If E1-plus-E2 multipolarity is used in the PT calculation,the different impact-parameter dependences of E1 andE2 multipolarity lead to markedly different shapes forthe different θ8-cuts (dashed histograms in Fig.12). Inparticular for large values of θ8, the latter distributionsshow a large asymmetry with respect to pin
t = 0 that isin clear disagreement with our data points.
By comparing Fig.12 with similar plots in our earlierLetter (Fig.2 of Ref.[13]) one can see the improvement inthe GEANT simulation which was achieved by the mod-ified prescription for the p-Be hit resolution (see sub-sect. IV.3.1). The dips near pin
t ≈ 0 in the theoreticaldistributions are now much closer to the experimentalones (though small residual discrepancies are still visiblein the rightmost panel).
Fig.13 depicts the experimental θcm distributions forthree different Erel bins, as indicated in the figure. A“safe” θ8 limit of 1◦ was chosen. As expected, thesedistributions are mostly isotropic at low Erel (indica-tive of s-waves) and become increasingly anisotropic forlarger values (contributions from higher orbital angularmomenta). As in Fig.12, also for the θcm distributionsthe calculations for pure E1 multipolarity fit all spec-tra well; inclusion of an E2 component may lead to aslightly better fit at low Erel, but diverges clearly for thelarge-Erel bin where E2 should play a major role. Thecalculations with a dynamical model will be discussedbelow.
0
200
400
600
800
0
200
400
600
800
1.order PT
E1+E2E1
a) 0.2-0.5 MeV
-0.5 0 0.5
cou
nts
b) 0.7-0.9 MeV
cos(θc.m.)-0.5 0 0.5
c) 1.1-1.9 MeV
-0.5 0 0.5
E1+E2E1
dyn.calc
a) 0.2-0.5 MeV
-0.5 0 0.5co
un
ts
b) 0.7-0.9 MeV
cos(θc.m.)-0.5 0 0.5
c) 1.1-1.9 MeV
-0.5 0 0.5
FIG. 13: (Color online) Top: Experimental proton polar an-gle (θc.m.) distributions for three different bins of the p-7Berelative energy, Erel. The full red curves denote a first-order perturbation-theory calculation for E1 multipolarity,the dashed blue ones for E1+E2. All theoretical curves wereindividually normalized to the data points in each frame.Bottom: the same data compared to dynamical calculations,again for E1 (full curves) and for E1+E2 (dashed curves) mul-tipolarities (see text for details).
2. Comparison to dynamical calculations
As mentioned above, Esbensen et al. [30, 31] suggestedthat dynamical calculations are required to properly de-scribe CD and to evaluate S17 from the measured CDcross sections. A sensitive test if such a theory describesthe experimental data better than first-order PT calcu-lations is given by comparing the dynamical predictions(using the model described in subsect. II.B.2) to the sameangular distributions (bottom part in Fig.13). In all threeframes shown, our E1-only dynamical calculations do notagree well with the data points. Dynamical calculationswith E1+E2 seem to introduce a slight improvement aslong as the effect of E2 multipolarity is small, but a ma-jor discrepancy shows up when E2 should have a strongerinfluence (rightmost lower panel in Fig.13).
In general, one would expect that the more completedescription of the Coulomb breakup within the semiclas-sical dynamical approach leads to a better agreementwith the experimental data than the simpler perturbative
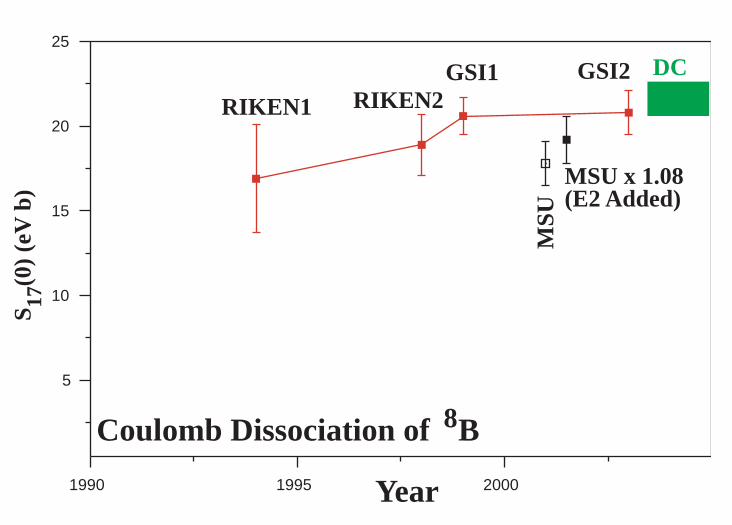
1990 1995 2000
5
10
15
20
25
Year
S 17(0
) (e
V b
)
GSI1
RIKEN1 RIKEN2GSI2
MSU
Coulomb Dissociation of 8B
MSU x 1.08(E2 Added)
DC
When a Dog Speaks it Does NotMatter What it Says.
Igal Talmi
except at the highest energiess1100–1200 keVd where DBfalls a few percent low. The energy dependence inferredfrom the CD experiments issignificantly steeperthan the DBtheory and does not agree with the direct results.
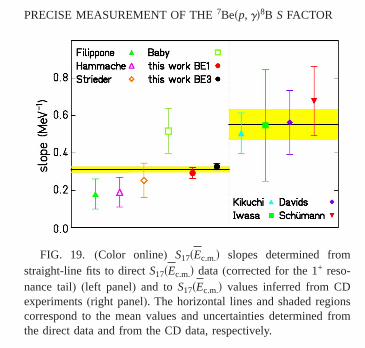
We have quantified the difference in energy dependencebetween direct and CD experiments by fitting a straight lineof the form S17sEc.m.d=as1+bEc.m.d to data in the rangeEc.m.ø425 keV and 830 keVøEc.m.ø1300 keV. Figure 19displaysb, the fitted slope, for each experiment. For the di-rect data,S17sEc.m.d values near the 1+ resonance were ex-cluded, and the high-energy tail of the 1+ resonance wassubtracted fromS17sEc.m.d values above the resonance beforefitting, based on the M1/DB ratio determined from our data.Since the CDS17sEc.m.d values do not include the 1+ reso-nance contribution, they were fitted directly. All of the fitshadx2/n,1.3, indicating that the straight line is a good ap-proximation. The results, shown in Fig. 19, demonstrate asystematic difference in slope between the two types of ex-periments. From the direct experiments the mean slope is3.11±0.14 MeV−1, with x2/n=1.9, and the mean slope deter-mined from the CD data is 5.5±0.8 MeV−1, with x2/n=0.2.Increasing the uncertainty on the direct mean by the factors1.9d1/2 to account for the fitx2/n, we find the probability thatthese two results arise from the same parent distribution isPsx2, nd=0.003.
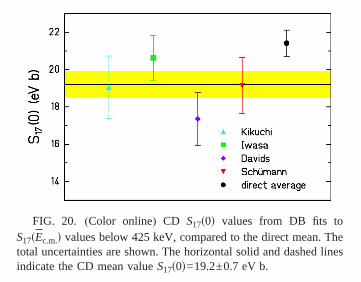
Because of the different energy dependences observed inCD and direct experiments, it is difficult to know how tomake a meaningful quantitativeS17s0d comparison. If we ig-nore this problem, and focus on CD data below 425 keV, inorder to minimize multipole uncertainties in the conversionof the measured breakup cross sections to inferred7Besp, gd8B cross sections, then our DB fits yield theS17s0dvalues shown in Fig. 20. These values are mutually consis-tent, with a mean of 19.2±0.7 eV b. A fit to this mean valuetogether with the mean value deduced from direct experi-ments of 21.4±0.5 eV b has probabilityPsx2, nd=0.01 thatthese results arise from the same parent distribution. On theother hand, if we fit the CD data between 750–1400(or
1000–1200) keV with the DB theory, the mean CD value isS17s0d<22 eV b, in very good agreement with the direct re-sult (see Fig. 18, bottom panel). However, there seems to beno independent motivation for fitting only high-energy CDdata.
2. Heavy-ion transfer and breakup
A Texas A&M group has used measurements of periph-eral heavy-ion transfer and breakup cross sections to deducethe asymptotic normalization coefficient for the7Be+p com-ponent of the8B ground-state wave function. This coeffi-cient, together with a capture-model calculation(and an as-sumedp3/2/p1/2 ratio in 7Be+p) can be used to inferS17s0d.The valueS17s0d=17.3±1.8 eV b has recently been inferredfrom the weighted average of10Bs7Be,8Bd9Be and14Ns7Be,8Bd13C results atEs7Bed=85 MeV [21], and a vari-ety of peripheral heavy-ion breakup results at 28 to285 MeV/nucleon have been used to inferS17s0d=17.4±1.5 eV b[22]. However, a different analysis[48] ofthe same breakup reaction measured with a C target leads toa substantially largerS17s0d value of 21.2±1.3 eV b in goodagreement with the direct mean value of 21.4 eV b. A deter-mination of the asymptotic normalization coefficients for thep1/2 and p3/2 components of8Li →7Li+ n together with theassumption of mirror symmetry leads toS17s0d=17.6±1.7 eV b for7Be+p [49]. TheseS-factor determina-tions thus tend to be even smaller than those deduced fromCD experiments.
SsEd values inferred from16Os3He,dd17F cross-sectionmeasurements [50] have been compared to direct16Osp, gd17F cross-section measurements[51,52] for captureto the ground state and to the first excited state. For the firstexcited state transition, thesp, gd results of Ref.[51] and thetransfer-reaction results agree to<s6±11d%, where the un-certainty is determined by the ±10% systematic uncertaintyin the transfer reaction and ±5% uncertainty in the absolutesp, gd cross section. For the ground-state transition, the cen-tral values fromsp, gd [52] and from s3He,dd agree within10% or so but it is difficult to quantify the significance of thecomparison[50] since the absolutesp, gd cross-section un-certainty was not specified.
FIG. 19. (Color online) S17sEc.m.d slopes determined fromstraight-line fits to directS17sEc.m.d data(corrected for the 1+ reso-nance tail) (left panel) and to S17sEc.m.d values inferred from CDexperiments(right panel). The horizontal lines and shaded regionscorrespond to the mean values and uncertainties determined fromthe direct data and from the CD data, respectively.
FIG. 20. (Color online) CD S17s0d values from DB fits toS17sEc.m.d values below 425 keV, compared to the direct mean. Thetotal uncertainties are shown. The horizontal solid and dashed linesindicate the CD mean valueS17s0d=19.2±0.7 eV b.
PRECISE MEASUREMENT OF THE7Besp, gd8B S FACTOR PHYSICAL REVIEW C68, 065803(2003)
065803-17
Moshe Gai
Because of the different energy dependences observed
Moshe Gai
CD experiments is significantly steeper than the DB theory and does not agree with the direct results.
Moshe Gai
CD and direct experiments,
Moshe Gai
observed in
Moshe Gai
Highlight
Moshe Gai
Highlight
Moshe Gai
Rectangle
except at the highest energiess1100–1200 keVd where DBfalls a few percent low. The energy dependence inferredfrom the CD experiments issignificantly steeperthan the DBtheory and does not agree with the direct results.
We have quantified the difference in energy dependencebetween direct and CD experiments by fitting a straight lineof the form S17sEc.m.d=as1+bEc.m.d to data in the rangeEc.m.ø425 keV and 830 keVøEc.m.ø1300 keV. Figure 19displaysb, the fitted slope, for each experiment. For the di-rect data,S17sEc.m.d values near the 1+ resonance were ex-cluded, and the high-energy tail of the 1+ resonance wassubtracted fromS17sEc.m.d values above the resonance beforefitting, based on the M1/DB ratio determined from our data.Since the CDS17sEc.m.d values do not include the 1+ reso-nance contribution, they were fitted directly. All of the fitshadx2/n,1.3, indicating that the straight line is a good ap-proximation. The results, shown in Fig. 19, demonstrate asystematic difference in slope between the two types of ex-periments. From the direct experiments the mean slope is3.11±0.14 MeV−1, with x2/n=1.9, and the mean slope deter-mined from the CD data is 5.5±0.8 MeV−1, with x2/n=0.2.Increasing the uncertainty on the direct mean by the factors1.9d1/2 to account for the fitx2/n, we find the probability thatthese two results arise from the same parent distribution isPsx2, nd=0.003.
Because of the different energy dependences observed inCD and direct experiments, it is difficult to know how tomake a meaningful quantitativeS17s0d comparison. If we ig-nore this problem, and focus on CD data below 425 keV, inorder to minimize multipole uncertainties in the conversionof the measured breakup cross sections to inferred7Besp, gd8B cross sections, then our DB fits yield theS17s0dvalues shown in Fig. 20. These values are mutually consis-tent, with a mean of 19.2±0.7 eV b. A fit to this mean valuetogether with the mean value deduced from direct experi-ments of 21.4±0.5 eV b has probabilityPsx2, nd=0.01 thatthese results arise from the same parent distribution. On theother hand, if we fit the CD data between 750–1400(or
1000–1200) keV with the DB theory, the mean CD value isS17s0d<22 eV b, in very good agreement with the direct re-sult (see Fig. 18, bottom panel). However, there seems to beno independent motivation for fitting only high-energy CDdata.
2. Heavy-ion transfer and breakup
A Texas A&M group has used measurements of periph-eral heavy-ion transfer and breakup cross sections to deducethe asymptotic normalization coefficient for the7Be+p com-ponent of the8B ground-state wave function. This coeffi-cient, together with a capture-model calculation(and an as-sumedp3/2/p1/2 ratio in 7Be+p) can be used to inferS17s0d.The valueS17s0d=17.3±1.8 eV b has recently been inferredfrom the weighted average of10Bs7Be,8Bd9Be and14Ns7Be,8Bd13C results atEs7Bed=85 MeV [21], and a vari-ety of peripheral heavy-ion breakup results at 28 to285 MeV/nucleon have been used to inferS17s0d=17.4±1.5 eV b[22]. However, a different analysis[48] ofthe same breakup reaction measured with a C target leads toa substantially largerS17s0d value of 21.2±1.3 eV b in goodagreement with the direct mean value of 21.4 eV b. A deter-mination of the asymptotic normalization coefficients for thep1/2 and p3/2 components of8Li →7Li+ n together with theassumption of mirror symmetry leads toS17s0d=17.6±1.7 eV b for7Be+p [49]. TheseS-factor determina-tions thus tend to be even smaller than those deduced fromCD experiments.
SsEd values inferred from16Os3He,dd17F cross-sectionmeasurements [50] have been compared to direct16Osp, gd17F cross-section measurements[51,52] for captureto the ground state and to the first excited state. For the firstexcited state transition, thesp, gd results of Ref.[51] and thetransfer-reaction results agree to<s6±11d%, where the un-certainty is determined by the ±10% systematic uncertaintyin the transfer reaction and ±5% uncertainty in the absolutesp, gd cross section. For the ground-state transition, the cen-tral values fromsp, gd [52] and from s3He,dd agree within10% or so but it is difficult to quantify the significance of thecomparison[50] since the absolutesp, gd cross-section un-certainty was not specified.
FIG. 19. (Color online) S17sEc.m.d slopes determined fromstraight-line fits to directS17sEc.m.d data(corrected for the 1+ reso-nance tail) (left panel) and to S17sEc.m.d values inferred from CDexperiments(right panel). The horizontal lines and shaded regionscorrespond to the mean values and uncertainties determined fromthe direct data and from the CD data, respectively.
FIG. 20. (Color online) CD S17s0d values from DB fits toS17sEc.m.d values below 425 keV, compared to the direct mean. Thetotal uncertainties are shown. The horizontal solid and dashed linesindicate the CD mean valueS17s0d=19.2±0.7 eV b.
PRECISE MEASUREMENT OF THE7Besp, gd8B S FACTOR PHYSICAL REVIEW C68, 065803(2003)
065803-17
Moshe Gai
Because of the different energy dependences observed
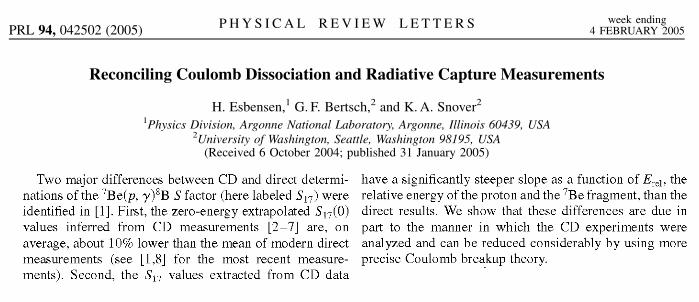
Reconciling Coulomb Dissociation and Radiative Capture Measurements
H. Esbensen,1 G. F. Bertsch,2 and K. A. Snover2
1Physics Division, Argonne National Laboratory, Argonne, Illinois 60439, USA2University of Washington, Seattle, Washington 98195, USA
(Received 6 October 2004; published 31 January 2005)
PRL 94, 042502 (2005) P H Y S I C A L R E V I E W L E T T E R S week ending4 FEBRUARY 2005
Moshe Gai
Line
Moshe Gai
Line
Moshe Gai
Line
Moshe Gai
Line
Moshe Gai
Line
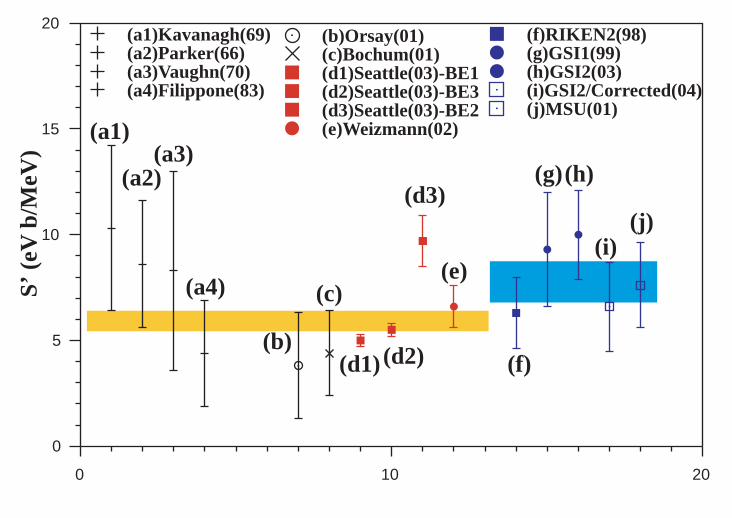
0 10 20
0
5
10
15
20S’
(eV
b/M
eV)
(a1)Kavanagh(69) (a2)Parker(66) (a3)Vaughn(70) (a4)Filippone(83)
(b)Orsay(01) (c)Bochum(01) (d1)Seattle(03)-BE1 (d2)Seattle(03)-BE3 (d3)Seattle(03)-BE2 (e)Weizmann(02)(a1)
(a3)
(a4)
(a2)
(b)
(c)
(d1) (d2)
(d3)
(e)
(f)
(g)
(f)RIKEN2(98) (g)GSI1(99) (h)GSI2(03) (i)GSI2/Corrected(04) (j)MSU(01)
(h)
(i)(j)
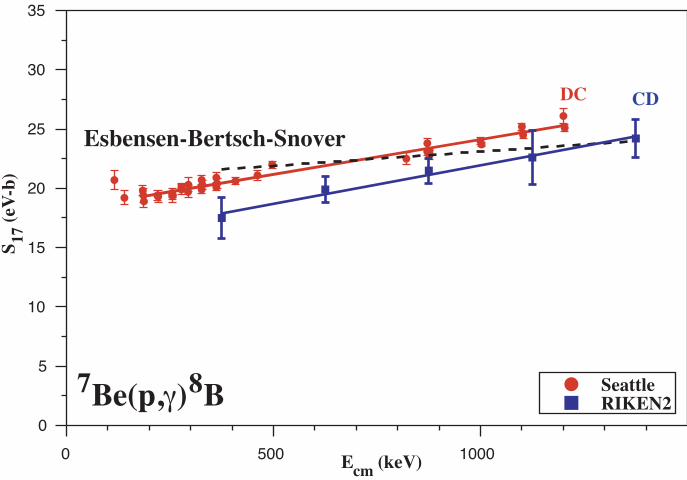
0 500 1000
0
5
10
15
20
25
30
35
Ecm (keV)
S 17 (
eV-b
)
Seattle RIKEN2
Esbensen-Bertsch-Snover
7Be(p,γ)8B
DC CD
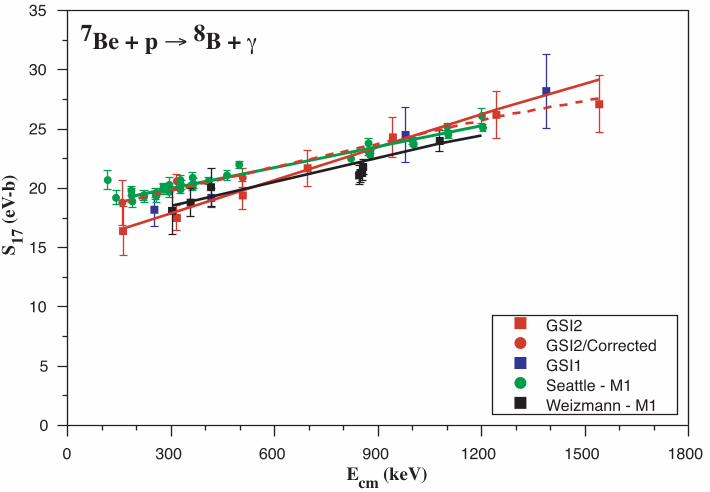
0 300 600 900 1200 1500 1800
0
5
10
15
20
25
30
35
Ecm (keV)
S 17 (
eV-b
)
GSI2 GSI2/Corrected GSI1 Seattle - M1 Weizmann - M1
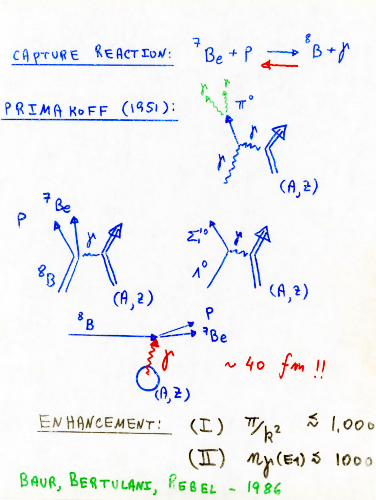
7Be + p → 8B + γ
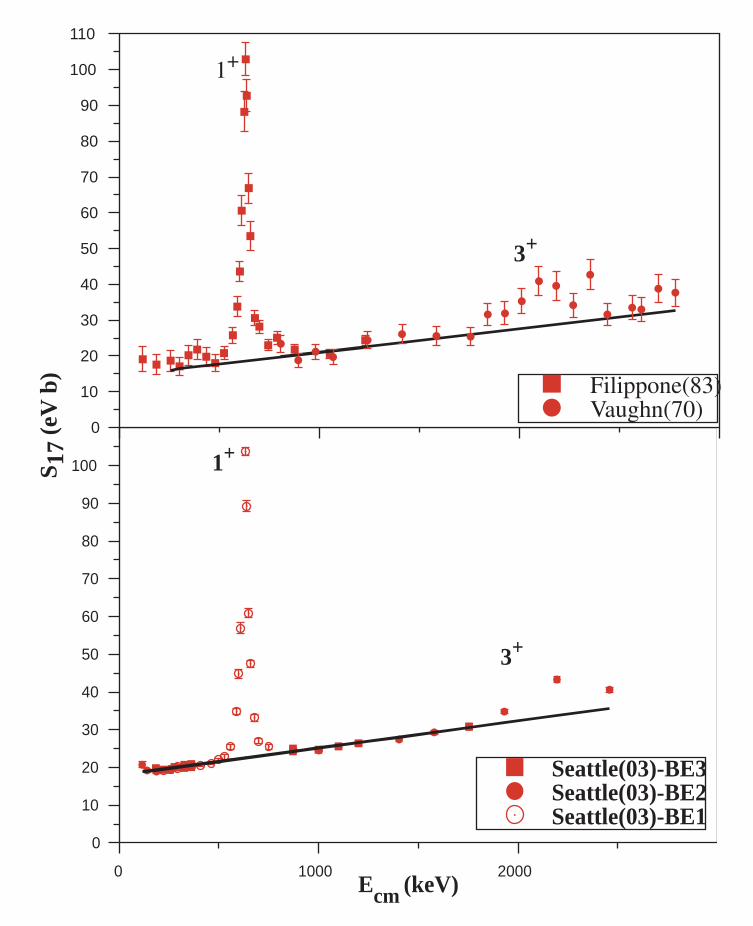
0
10
20
30
40
50
60
70
80
90
100
110
3+
1+
Filippone(83)Vaughn(70)
0 1000 2000
0
10
20
30
40
50
60
70
80
90
100
Ecm (keV)
Seattle(03)-BE3 Seattle(03)-BE2 Seattle(03)-BE1
1+
3+
S 17
(eV
b)
0 500 1000 1500
0
5
10
15
20
25
30
35
Ecm (keV)
S 17 (
eV b
)
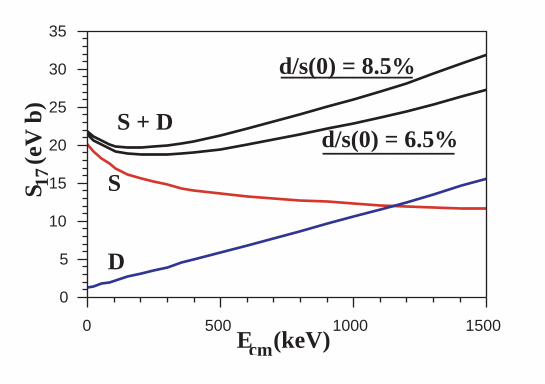
d/s(0) = 6.5%
d/s(0) = 8.5%
S
D
S + D
___________
___________
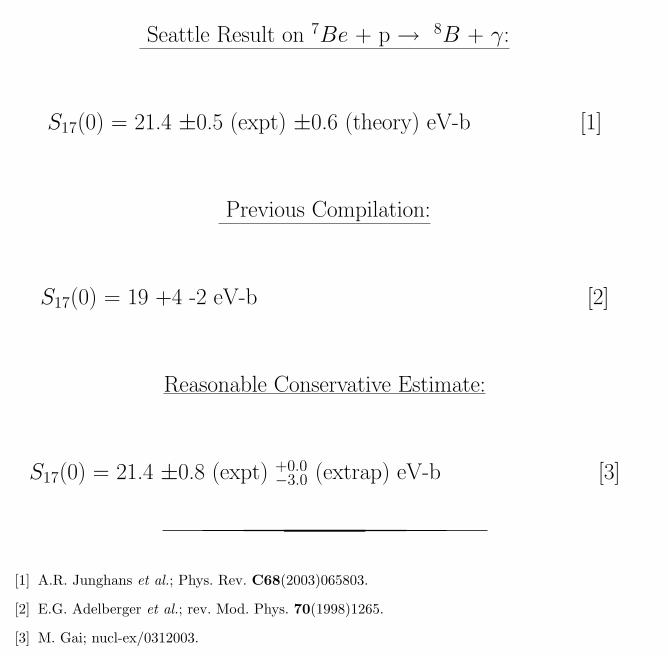
Seattle Result on 7Be + p → 8B + γ:
S17(0) = 21.4 ±0.5 (expt) ±0.6 (theory) eV-b [1]
Previous Compilation:
S17(0) = 19 +4 -2 eV-b [2]
Reasonable Conservative Estimate:
S17(0) = 21.4 ±0.8 (expt) +0.0−3.0 (extrap) eV-b [3]
[1] A.R. Junghans et al.; Phys. Rev. C68(2003)065803.
[2] E.G. Adelberger et al.; rev. Mod. Phys. 70(1998)1265.
[3] M. Gai; nucl-ex/0312003.
1
Moshe Gai
Rectangle
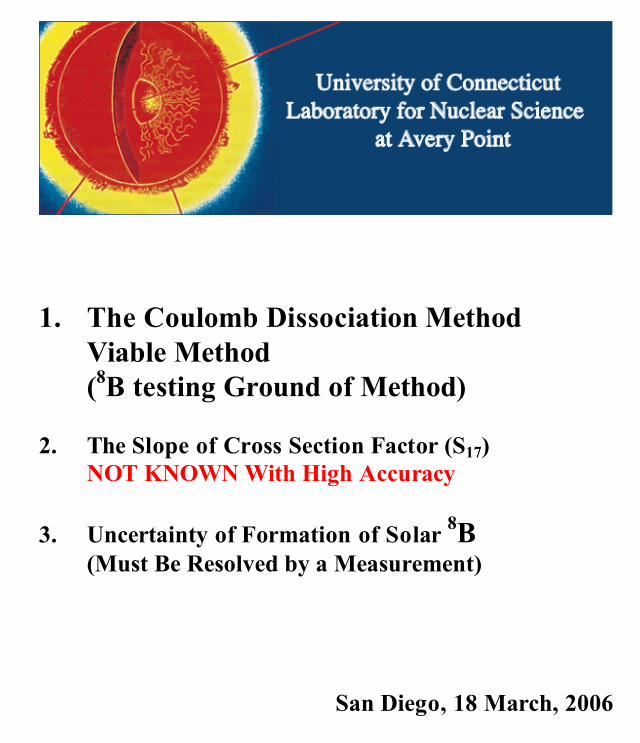
1. The Coulomb Dissociation Method Viable Method (8B testing Ground of Method) 2. The Slope of Cross Section Factor (S17) NOT KNOWN With High Accuracy 3. Uncertainty of Formation of Solar 8B (Must Be Resolved by a Measurement)
San Diego, 18 March, 2006


![Caractérisation et Dissociation du Complexe … · calcul des niveaux d'énergie du C60 par la méthode de Hückelii,iii. 3 Figure 1 : le fullerène[60] ... Le C60 est constitué](https://static.fdocument.org/doc/165x107/5b9cdae209d3f2f94c8d53c6/caracterisation-et-dissociation-du-complexe-calcul-des-niveaux-denergie-du.jpg)