Equilibrium and Kinetic Studies of Isomerization of (CO)5W ...

Overtone-induced dissociation and isomerization dynamics of thehydroxymethyl radical (CH2OH and CD2OH). II. Velocity map imagingstudiesM. Ryazanov, C. Rodrigo, and H. Reisler Citation: J. Chem. Phys. 136, 084305 (2012); doi: 10.1063/1.3685899 View online: http://dx.doi.org/10.1063/1.3685899 View Table of Contents: http://jcp.aip.org/resource/1/JCPSA6/v136/i8 Published by the American Institute of Physics. Additional information on J. Chem. Phys.Journal Homepage: http://jcp.aip.org/ Journal Information: http://jcp.aip.org/about/about_the_journal Top downloads: http://jcp.aip.org/features/most_downloaded Information for Authors: http://jcp.aip.org/authors
THE JOURNAL OF CHEMICAL PHYSICS 136, 084305 (2012)
Overtone-induced dissociation and isomerization dynamicsof the hydroxymethyl radical (CH2OH and CD2OH). II. Velocitymap imaging studies
M. Ryazanov, C. Rodrigo, and H. Reislera)
Department of Chemistry, University of Southern California, Los Angeles, California 90089-0482, USA
(Received 2 December 2011; accepted 31 January 2012; published online 24 February 2012)
The dissociation of the hydroxymethyl radical, CH2OH, and its isotopolog, CD2OH, following ex-citation in the 4ν1 region (OH stretch overtone, near 13 600 cm−1) was studied using sliced velocitymap imaging. A new vibrational band near 13 660 cm−1 arising from interaction with the antisym-metric CH stretch was discovered for CH2OH. In CD2OH dissociation, D atom products (correlatedwith CHDO) were detected, providing the first experimental evidence of isomerization in the CH2OH↔ CH3O (CD2OH ↔ CHD2O) system. Analysis of the H (D) fragment kinetic energy distributionsshows that the rovibrational state distributions in the formaldehyde cofragments are different for theOH bond fission and isomerization pathways. Isomerization is responsible for 10%–30% of disso-ciation events in all studied cases, and its contribution depends on the excited vibrational level ofthe radical. Accurate dissociation energies were determined: D0(CH2OH → CH2O + H) = 10 160± 70 cm−1, D0(CD2OH → CD2O + H) = 10 135 ± 70 cm−1, D0(CD2OH → CHDO + D)= 10 760 ± 60 cm−1. © 2012 American Institute of Physics. [http://dx.doi.org/10.1063/1.3685899]
I. INTRODUCTION
The CH2OH and its less stable isomer, CH3O, are rele-vant to atmospheric and combustion chemistry, being impli-cated as intermediates in reactions such as O + CH3 and CH+ H2O.1–4 CH2OH and CD2OH also play an important role inthe unusual deuterium enrichment of interstellar methanol.5
The high-level electronic structure calculations reported inPart I (Ref. 6) show that the barrier heights for CH2OH→ CH2O + H and CH2OH → CH3O processes are within∼400 cm−1 of each other and very close to the studied exci-tation energy range (∼13 600–13 660 cm−1). The barrier forCH3O → H + CH2O dissociation is lower than the isomeriza-tion barrier by ∼1700 cm−1, ensuring that CH2OH isomeriza-tion is quickly followed by decomposition. It should be noted,however, that the rates for these two possible CH2OH disso-ciation pathways depend not only on the barrier heights, butalso on the character of the excited vibrational states, and thusmight be highly state-specific.
Temps and co-workers studied the state-specific disso-ciation of the methoxy radical, using stimulated emissionpumping from an excited electronic state to reach high vi-brational levels of the ground electronic state, mainly in theCO stretch.7 They determined state-specific decay rates in thetunneling regime and up to ∼1500 cm−1 above the dissoci-ation barrier, almost reaching the isomerization barrier top.However, no indications of isomerization to CH2OH wereobserved, in agreement with the relative barrier heights. Thestate-specific dissociation rates showed large fluctuations andwere consistent with statistical theories.
Due to experimental difficulties, there are relatively fewstudies of the ground electronic state of CH2OH in spite of
a)Author to whom correspondence should be addressed. Electronic mail:[email protected].
its importance. Most fundamental vibrations of CH2OH andits isotopologs were observed in an Ar matrix by Jacox8 us-ing infrared (IR) absorption spectroscopy. Few fundamen-tals and several overtones and combinations of out-of-planemodes were observed in effusive molecular beam experimentsby Johnson and Hudgens9 who used resonance enhancedmultiphoton ionization (REMPI) detection. In more recentstudies10 our group employed a supersonic molecular beamand IR–UV double resonance techniques to observe partiallyresolved rotational structure of the antisymmetric and sym-metric CH stretch fundamentals (ν2 and ν3, respectively), aswell as the OH stretch fundamental and its first overtone (ν1,2ν1). In the following work,11 these investigations were ex-tended to 3ν1 and 4ν1 levels of CH2OH and 4ν1 of CD2OH.The 4ν1 levels of the two isotopologs lie above the dissoci-ation thresholds and could be detected only by monitoringH photofragments, indicating a relatively fast predissociation(lifetime ∼25 ps estimated from the spectral linewidths) of thehydroxymethyl radical at this energy. That work was the onlyknown experimental study of the predissociation dynamics ofthe hydroxymethyl radical.
The observation of predissociation induced by OH stretchovertone excitation is intriguing because the OH stretch is thereaction coordinate leading to CH2O + H, as opposed to othercases of overtone-induced dissociation,12 where the excitedbond was not broken in the dissociation and retained its boundcharacter even above the dissociation threshold. The existenceof a barrier for CH2OH dissociation was assumed to be thereason why the OH stretch preserved its character of a boundvibration. Despite the fact that the available calculations,3, 13
all placed the barrier for isomerization to methoxy lower thanthe barrier for OH bond fission, no D products from CD2OHwere detected. Therefore, it was concluded that isomeriza-tion to CHD2O was at best a minor channel, and that the
0021-9606/2012/136(8)/084305/9/$30.00 © 2012 American Institute of Physics136, 084305-1
084305-2 Ryazanov, Rodrigo, and Reisler J. Chem. Phys. 136, 084305 (2012)
dissociation proceeded by tunneling through the barrier toCH2O + H.
In our previous studies, we could not investigate the dy-namics of the hydroxymethyl radical predissociation becausethe time-of-flight (TOF) detection method that we employeddid not have sufficient resolution to reveal structure in the Hfragment kinetic energy distribution (KED). We have there-fore replaced it with a sliced velocity map imaging (SVMI)arrangement which allowed us to obtain internal energy dis-tributions of CH2O, CHDO, and CD2O cofragments from im-ages of H+ and D+ following dissociation of CH2OH andCD2OH.
The major experimental complication in our studies in-volved contributions from dissociation upon electronic exci-tation to the 3s and 3p Rydberg states14 by 2- and 3-photon ab-sorption at the high laser intensities needed to effect excitationof the 4ν1 ← 0 transition. While this multiphoton excitationgives rise predominantly to H fragments with high velocities,in the usual velocity map imaging (VMI) setup the projectionsof these high velocities on the two-dimensional detector con-tribute to signal at both large and small radii of the raw image.In image reconstruction, these large interfering signals leadto unacceptable background noise in the region of the imagethat contains contributions from one-photon dissociation. Forsituations like this, the SVMI method15 is advantageous be-cause there is no need for image reconstruction. It is thereforepossible to record only the one-photon region of the image,effectively discriminating against background signals at highkinetic energies, and to obtain photofragment yield spectrawith resolved translational energies, i.e., correlated with spe-cific vibrational levels of the formaldehyde cofragment.
This article presents our results on the overtone-induceddissociation dynamics of CH2OH and CD2OH, with specialemphasis on the role of isomerization to CH3O (CHD2O).Observation of a D product from CD2OH provides direct ev-idence of isomerization in the CD2OH ↔ CHD2O system.Analysis of the formaldehyde products rovibrational state dis-tributions shows that they are qualitatively different for thetwo decomposition channels (OH bond fission and isomeriza-tion followed by dissociation), and this allows us to estimatethe state-specific branchings between these two pathways.
II. EXPERIMENTAL ARRANGEMENTAND PROCEDURES
The experimental procedures for the preparation ofCH2OH samples and detection of H and D atoms were simi-lar to those used in our previous studies10, 11 and are describedonly briefly here. A molecular beam of CH2OH (CD2OH)radicals was created in the source chamber, skimmed, andintroduced into the differentially pumped detection chamber,where the radicals were dissociated by focused visible laserradiation. H (D) products were ionized by a counterpropa-gating laser radiation using REMPI, and the H+ (D+) ionswere detected by SVMI. Two kinds of measurements wereperformed: (1) the dependence of fragment yields on excita-tion wavelength (action spectra); (2) velocity distributions ofthe fragments.
CH2OH (CD2OH) radicals were produced as before bythe reaction of CH3OH (CD3OH) with Cl atoms. Typicallya mixture of 3% methanol32 and 1% Cl2 (by volume) in∼1.5 bar of helium was introduced into a piezoelectricallydriven pulsed nozzle that has a quartz tube attached to it.Cl2 molecules were dissociated inside the quartz tube by355 nm laser light (3rd harmonic of Quanta-Ray GCR11Nd:YAG laser, ∼20 mJ, focused with 15 cm focal length (f.l.)cylindrical lens). The molecular beam with reaction productswas introduced into the detection chamber through a skimmer(Beam Dynamics, ø1 mm). The rotational temperature of theradicals in the detection region was 10–15 K.
The radical excitation radiation was generatedby a Nd:YAG laser pumped dye laser (ContinuumPL8000/ND6000, LDS 722 dye, ∼35 mJ; 0.1 cm−1,30 cm f. l. lens). H (D) fragments were ionized using a 1+ 1′ REMPI scheme through the 2p ← 1s transition. Theradiation near Lyman-α (82 290 cm−1, 121.6 nm) wasgenerated, as described before,11 by frequency tripling2–3 mJ of the doubled output of a Nd:YAG pumped dyelaser (Continuum NY-81C/ND6000, LDS 751 dye, InradAutotracker-II doubler with KDP-D crystal) in a Kr/Ar gascell.16 The unconverted part of the radiation passing throughthe tripling cell was used for near-threshold ionization of theexcited H (D) atoms. Because the bandwidth of the detectionlaser was narrower than the Doppler profile of the H (D)fragments, velocity map images were recorded by frequencyscanning of the laser across the Doppler profile to achieveunbiased detection efficiency. However, for recording actionspectra such scans take too long, and since qualitative KEDsare sufficient, the detection frequency was fixed at a valueoptimized for best one-photon signal.
The main modification in the experimental arrangementwas the incorporation of inline SVMI for detection of H+
(D+) ions. The SVMI method has been described before, andthe difficulties in implementing it for light H and D ions wereexplained.15 A full description of our experimental arrange-ment will be given elsewhere; here we describe briefly theessential components and performance characteristics.
In general terms, the ion optics consists of an immer-sion electrostatic lens resembling the arrangement describedin Ref. 15 for acceleration and focusing of ions, and aneinzel lens installed in the drift region for additional con-trol of the image magnification (see Ref. 17 for a similarapproach). With this system the TOF focusing18 and veloc-ity map focusing19 conditions can be satisfied simultaneously,and the temporal stretching of the ion cloud required for slic-ing is independent of the imaged kinetic energy range.
To achieve thin time slices, we have built a fast high-voltage pulser based on the design given in Ref. 20. The effec-tive slice profile, determined by convolution of the ionizationlaser pulse time profile, the MCP gain variation controlled bythe electric pulse shape, and the relative timing jitter distribu-tion, is nearly Gaussian with FWHM of ∼5 ns. The VMI con-ditions are chosen such that the total time spread of the ioncloud is ∼50 ns, leading to reasonable collection efficiencywith sufficient resolution (�E/E ≈ 1%).
Imaging data from the detector (Galileo/Photonis,ø40 mm microchannel plate chevron stack) are recorded at
084305-3 VMI studies of CH2OH decomposition J. Chem. Phys. 136, 084305 (2012)
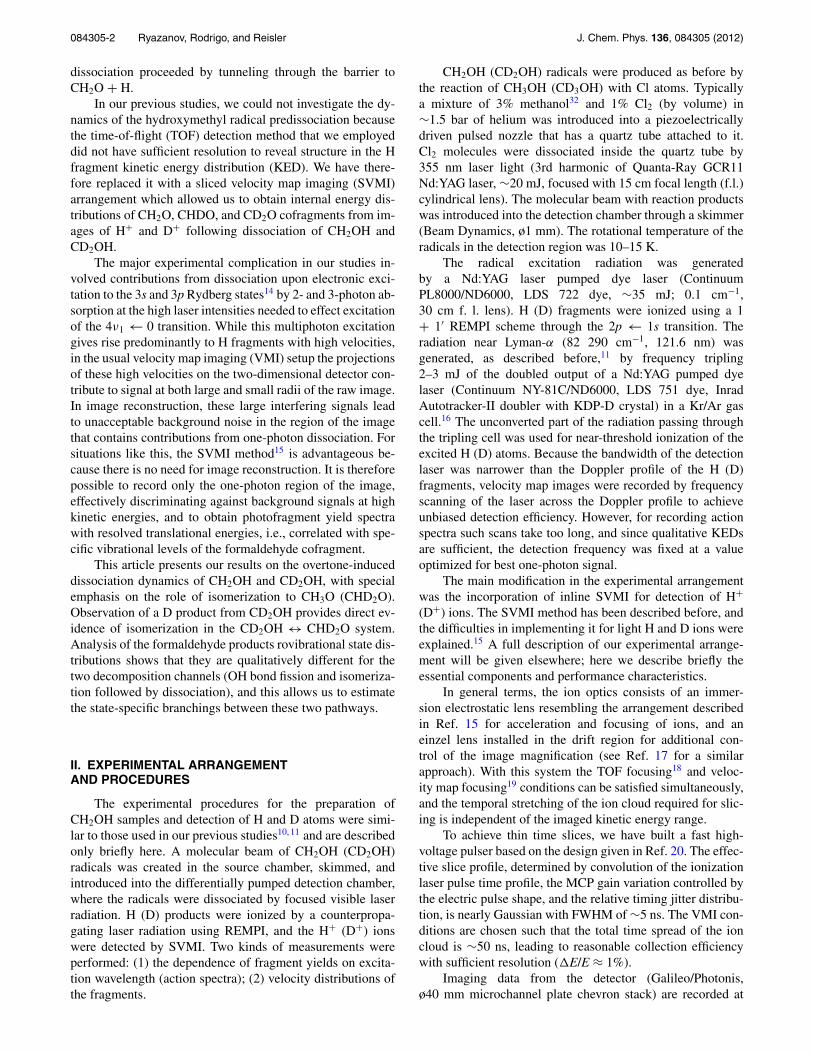
FIG. 1. Sliced velocity map image obtained by monitoring H fragments fromCH2OH dissociation at 13 602 cm−1. The intense outer ring correlates withvibrationless CH2O cofragment. The weak inner rings correspond to CH2rock, wag, and scissors, and CO stretch excitations in the CH2O.
1 megapixel resolution (PixeLink PL-B741F CMOS camera,Tamron 23FM25SP f/1.4 lens). The positions of ion spots foreach laser pulse are analyzed by a centroiding algorithm sim-ilar to the one described before,21 and the coordinates with atime stamp are saved to a file for further analysis. An exampleof a typical image obtained by monitoring H photofragmentsfrom CH2OH is shown in Fig. 1.
Kinetic energy release (KER) distributions are obtainedby binning all recorded ion positions into small speed inter-vals and converting the H (D) speed distribution to KED inthe usual way. Kinetic energy calibration was performed byusing the photodissociation of O2, HBr, and H2S. It showedexcellent agreement with the predictions obtained with the ionoptics simulation software package SIMION 8 (Ref. 22) (∼1%difference in kinetic energy) in all modes of operation, andtherefore numerical simulations were used for selection of theoptimal ion optics parameters and analysis of the recordedimages.
Action spectra are obtained by changing the excita-tion laser frequency in small steps while continuously run-ning SVMI detection. Time stamps for each frequency arerecorded, allowing subsequent binning of the detected iondistributions by laser frequency intervals. The results are an-alyzed as (1) two-dimensional spectra, i.e., ion yield as afunction of the excitation frequency and ion speed and (2)state-resolved photofragment yield spectra, by integration ofthe two-dimensional spectrum over selected speed intervals.
The application of SVMI in our experiment significantlyenhanced the detection sensitivity because of the following:
1. The use of event counting essentially eliminates detec-tion background noise; only statistical fluctuations of thesignal remain. This allowed us to observe small signals
and to improve the signal-to-noise ratio (SNR) by in-creasing the accumulation time, limited only by stabilityof the experimental conditions.
2. Velocity resolution allows discrimination between sig-nals from the studied one-photon process and those gen-erated by spurious processes, such as photodissociationof the radical by the detection laser and/or multiphotonabsorption of the excitation radiation. This is importantin our case because both of these processes are some-times more efficient than the overtone-induced dissocia-tion. Although some interfering signals (e.g., from pho-todissociation of unreacted methanol in the molecularbeam) remain, most of this background has higher ki-netic energy and is easily rejected.
3. The measured KEDs allow unambiguous identificationof the dissociation cofragment through its vibrationalstructure, and the parent radical by the observed ki-netic energy maximum (which should be consistent withthe corresponding dissociation energy). This has per-mitted us to increase the radical production yield with-out the risk of possible signal contamination by reactionbyproducts.
III. EXPERIMENTAL RESULTS AND ANALYSIS
A. Action spectra
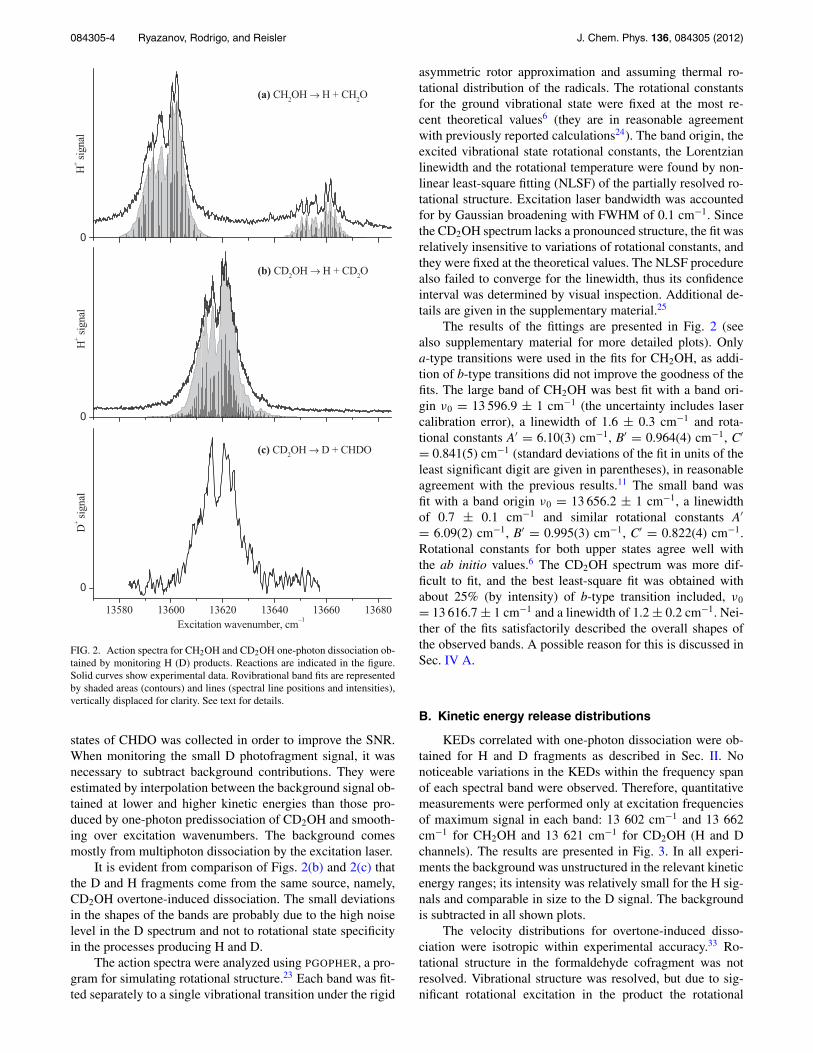
Figure 2 shows action spectra for photodissociationof CH2OH and CD2OH obtained by monitoring H (D)photofragments in the region of the previously observed 4ν1
← 0 transition.11 Each spectrum is derived from data ob-tained as described in Sec. II. In monitoring H fragments,only the signal correlated with one-photon excitation andthe formaldehyde cofragment in the ground vibrational state(which is the most populated, see below) is plotted. Signalscorrelated with vibrationally excited cofragments were signif-icantly smaller but had identical excitation wavenumber de-pendencies. Background in the images was relatively small atkinetic energies corresponding to one-photon signals and thusis not subtracted in the plots.
The bands near 13 600 cm−1 for CH2OH and 13 620cm−1 for CD2OH (Figs. 2(a) and 2(b), respectively) are ingood agreement with previous results,11 but have much bet-ter SNR. With CH2OH excitation, an additional band near13 660 cm−1 was observed in the present work. It has nar-rower linewidths and 4–5 times lower integrated intensity thanthe main band. In contrast, CD2OH did not show other de-tectable bands within ±100 cm−1 of the observed band. Asdiscussed below, the two bands in CH2OH arise from an ac-cidental resonance with another state involving the antisym-metric CH stretch.
The higher SNR achieved in the present work enabled usto detect also a small amount of D products from CD2OH dis-sociation. Figure 2(c) shows the D fragment yield spectrumfrom CD2OH, which is correlated with CHDO cofragments.As with the other bands, all state-resolved action spectra hadidentical shapes. However, in contrast to the H fragment chan-nel, the fraction of vibrationally excited cofragments was sig-nificant. Therefore, the signal correlated with all vibrational
084305-4 Ryazanov, Rodrigo, and Reisler J. Chem. Phys. 136, 084305 (2012)
→
−
→
→
FIG. 2. Action spectra for CH2OH and CD2OH one-photon dissociation ob-tained by monitoring H (D) products. Reactions are indicated in the figure.Solid curves show experimental data. Rovibrational band fits are representedby shaded areas (contours) and lines (spectral line positions and intensities),vertically displaced for clarity. See text for details.
states of CHDO was collected in order to improve the SNR.When monitoring the small D photofragment signal, it wasnecessary to subtract background contributions. They wereestimated by interpolation between the background signal ob-tained at lower and higher kinetic energies than those pro-duced by one-photon predissociation of CD2OH and smooth-ing over excitation wavenumbers. The background comesmostly from multiphoton dissociation by the excitation laser.
It is evident from comparison of Figs. 2(b) and 2(c) thatthe D and H fragments come from the same source, namely,CD2OH overtone-induced dissociation. The small deviationsin the shapes of the bands are probably due to the high noiselevel in the D spectrum and not to rotational state specificityin the processes producing H and D.
The action spectra were analyzed using PGOPHER, a pro-gram for simulating rotational structure.23 Each band was fit-ted separately to a single vibrational transition under the rigid
asymmetric rotor approximation and assuming thermal ro-tational distribution of the radicals. The rotational constantsfor the ground vibrational state were fixed at the most re-cent theoretical values6 (they are in reasonable agreementwith previously reported calculations24). The band origin, theexcited vibrational state rotational constants, the Lorentzianlinewidth and the rotational temperature were found by non-linear least-square fitting (NLSF) of the partially resolved ro-tational structure. Excitation laser bandwidth was accountedfor by Gaussian broadening with FWHM of 0.1 cm−1. Sincethe CD2OH spectrum lacks a pronounced structure, the fit wasrelatively insensitive to variations of rotational constants, andthey were fixed at the theoretical values. The NLSF procedurealso failed to converge for the linewidth, thus its confidenceinterval was determined by visual inspection. Additional de-tails are given in the supplementary material.25
The results of the fittings are presented in Fig. 2 (seealso supplementary material for more detailed plots). Onlya-type transitions were used in the fits for CH2OH, as addi-tion of b-type transitions did not improve the goodness of thefits. The large band of CH2OH was best fit with a band ori-gin ν0 = 13 596.9 ± 1 cm−1 (the uncertainty includes lasercalibration error), a linewidth of 1.6 ± 0.3 cm−1 and rota-tional constants A′ = 6.10(3) cm−1, B′ = 0.964(4) cm−1, C′
= 0.841(5) cm−1 (standard deviations of the fit in units of theleast significant digit are given in parentheses), in reasonableagreement with the previous results.11 The small band wasfit with a band origin ν0 = 13 656.2 ± 1 cm−1, a linewidthof 0.7 ± 0.1 cm−1 and similar rotational constants A′
= 6.09(2) cm−1, B′ = 0.995(3) cm−1, C′ = 0.822(4) cm−1.Rotational constants for both upper states agree well withthe ab initio values.6 The CD2OH spectrum was more dif-ficult to fit, and the best least-square fit was obtained withabout 25% (by intensity) of b-type transition included, ν0
= 13 616.7 ± 1 cm−1 and a linewidth of 1.2 ± 0.2 cm−1. Nei-ther of the fits satisfactorily described the overall shapes ofthe observed bands. A possible reason for this is discussed inSec. IV A.
B. Kinetic energy release distributions
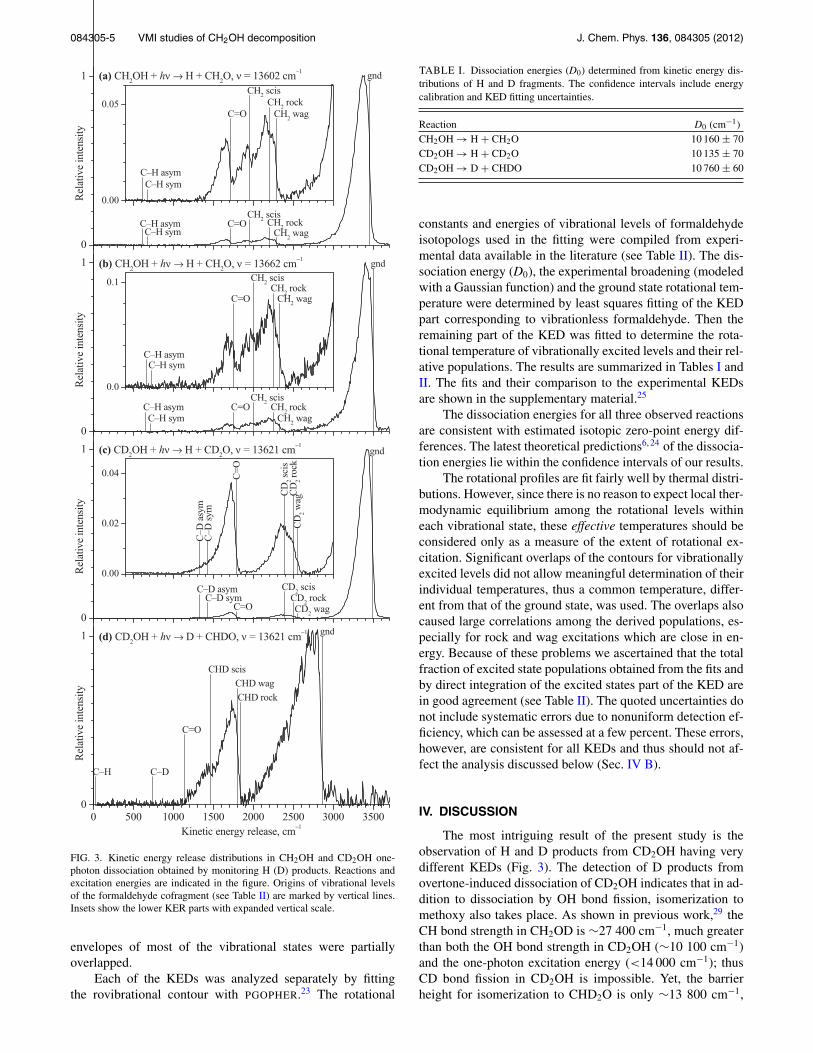
KEDs correlated with one-photon dissociation were ob-tained for H and D fragments as described in Sec. II. Nonoticeable variations in the KEDs within the frequency spanof each spectral band were observed. Therefore, quantitativemeasurements were performed only at excitation frequenciesof maximum signal in each band: 13 602 cm−1 and 13 662cm−1 for CH2OH and 13 621 cm−1 for CD2OH (H and Dchannels). The results are presented in Fig. 3. In all experi-ments the background was unstructured in the relevant kineticenergy ranges; its intensity was relatively small for the H sig-nals and comparable in size to the D signal. The backgroundis subtracted in all shown plots.
The velocity distributions for overtone-induced disso-ciation were isotropic within experimental accuracy.33 Ro-tational structure in the formaldehyde cofragment was notresolved. Vibrational structure was resolved, but due to sig-nificant rotational excitation in the product the rotational
084305-5 VMI studies of CH2OH decomposition J. Chem. Phys. 136, 084305 (2012)
ν → ν −1
ν → ν −1
ν → ν −1
ν → ν −1
−1
FIG. 3. Kinetic energy release distributions in CH2OH and CD2OH one-photon dissociation obtained by monitoring H (D) products. Reactions andexcitation energies are indicated in the figure. Origins of vibrational levelsof the formaldehyde cofragment (see Table II) are marked by vertical lines.Insets show the lower KER parts with expanded vertical scale.
envelopes of most of the vibrational states were partiallyoverlapped.
Each of the KEDs was analyzed separately by fittingthe rovibrational contour with PGOPHER.23 The rotational
TABLE I. Dissociation energies (D0) determined from kinetic energy dis-tributions of H and D fragments. The confidence intervals include energycalibration and KED fitting uncertainties.
Reaction D0 (cm−1)CH2OH → H + CH2O 10 160 ± 70CD2OH → H + CD2O 10 135 ± 70CD2OH → D + CHDO 10 760 ± 60
constants and energies of vibrational levels of formaldehydeisotopologs used in the fitting were compiled from experi-mental data available in the literature (see Table II). The dis-sociation energy (D0), the experimental broadening (modeledwith a Gaussian function) and the ground state rotational tem-perature were determined by least squares fitting of the KEDpart corresponding to vibrationless formaldehyde. Then theremaining part of the KED was fitted to determine the rota-tional temperature of vibrationally excited levels and their rel-ative populations. The results are summarized in Tables I andII. The fits and their comparison to the experimental KEDsare shown in the supplementary material.25
The dissociation energies for all three observed reactionsare consistent with estimated isotopic zero-point energy dif-ferences. The latest theoretical predictions6, 24 of the dissocia-tion energies lie within the confidence intervals of our results.
The rotational profiles are fit fairly well by thermal distri-butions. However, since there is no reason to expect local ther-modynamic equilibrium among the rotational levels withineach vibrational state, these effective temperatures should beconsidered only as a measure of the extent of rotational ex-citation. Significant overlaps of the contours for vibrationallyexcited levels did not allow meaningful determination of theirindividual temperatures, thus a common temperature, differ-ent from that of the ground state, was used. The overlaps alsocaused large correlations among the derived populations, es-pecially for rock and wag excitations which are close in en-ergy. Because of these problems we ascertained that the totalfraction of excited state populations obtained from the fits andby direct integration of the excited states part of the KED arein good agreement (see Table II). The quoted uncertainties donot include systematic errors due to nonuniform detection ef-ficiency, which can be assessed at a few percent. These errors,however, are consistent for all KEDs and thus should not af-fect the analysis discussed below (Sec. IV B).
IV. DISCUSSION
The most intriguing result of the present study is theobservation of H and D products from CD2OH having verydifferent KEDs (Fig. 3). The detection of D products fromovertone-induced dissociation of CD2OH indicates that in ad-dition to dissociation by OH bond fission, isomerization tomethoxy also takes place. As shown in previous work,29 theCH bond strength in CH2OD is ∼27 400 cm−1, much greaterthan both the OH bond strength in CD2OH (∼10 100 cm−1)and the one-photon excitation energy (<14 000 cm−1); thusCD bond fission in CD2OH is impossible. Yet, the barrierheight for isomerization to CHD2O is only ∼13 800 cm−1,
084305-6 Ryazanov, Rodrigo, and Reisler J. Chem. Phys. 136, 084305 (2012)
TABLE II. Formaldehyde fragment rovibrational distribution parameters obtained from fitting of H and D cofragment kinetic energy distributions (standarddeviations in units of the least significant digit are given in parentheses).
Relative population (fit)b
Energya (cm−1) CH2OH → H + CH2O CD2OH (13 621 cm−1)
Fragment excitation CH2O CD2O CHDO 13 602 cm−1 13 662 cm−1 H + CD2O D + CHDOGround 0 0 0 1 1 1 1C=O 1746 1702 1724 0.0219(5) 0.0294(10) 0.0333(2) 0Scissors 1500 1100 1396 0.0179(5) 0.0300(11) 0.0103(3) 0.062(3)Rock 1249 989 1028 0.0212(7) 0.0466(17) 0.0083(6) 0.151(9)Wag 1167 938 1059 0.0211(7) 0.0377(17) 0.0091(5) 0.185(9)
Excited fraction (%) Fit 7.6 12.6 5.7 28.8Integration 7.8 12.8 5.9 28.4
T effrot (K) Ground 145(10) 155(10) 120(5) 320(20)
Excited 110(10) 140(20) 130(15) 180(15)
aExperimental vibrational energies taken from Refs. 26 (CH2O), 27 (CD2O), and 28 (CHDO).bPopulation estimations for rock and wag are strongly correlated (ρ ∼ −0.8) in all cases due to a significant overlap of their rotational envelopes.
and the barrier for CHD2O → D + CHDO dissociationis even lower (∼12 600 cm−1).6 We conclude thereforethat D atoms are produced by isomerization followed bydissociation.
A. Overtone spectroscopy and state interactions
The action spectra and their analyses are in agreementwith previous results,11 except that with better SNR we areable to observe an additional band near 13 660 cm−1. Basedon previous analysis, it appears that the zeroth-order 4ν1 statecarries most of the oscillator strength for the observed transi-tions. However, in this work we demonstrate that it is mixed inCH2OH with another close-lying vibrational state. The mix-ing does not occur in CD2OH, reinforcing the interpretationthat the interaction derives from an accidental near-resonancespecific to CH2OH. A very similar situation exists in the over-tone spectroscopy of CH3OH, where 5ν1 is strongly mixedwith 4ν1 + ν2 (ν1 is the OH stretch and ν2 is one of the asym-metric CH stretches), and this interaction is also affected byisotopic substitutions.30
In CH2OH the lower-frequency level of the coupled pairlies very close to the 4ν1 energy extrapolated from the lowerν1 overtones,11 whereas the higher-frequency level is close tothe sum of the 3ν1 and ν2 levels (10 484 + 3162 = 13 646cm−1, using the values from Refs. 11 and 10). Since the ν2
mode has weaker IR intensity than ν1,10, 24 the 4–5 timeslower relative integrated intensity of the higher-frequencyband is consistent with this assignment (although the zeroth-order 3ν1 + ν2 state could be excited directly, its dissocia-tion without coupling to 4ν1 is unlikely, as discussed below).The vibrational configuration interaction (VCI) calculationsreported in Part I (Ref. 6) support this analysis, showing thatboth bright states found in this region have large contributionsfrom 4ν1 and 3ν1 + ν2 basis functions.
Based on the similarity in the linewidths of the transitionsto 4ν1 in CH2OH and CD2OH, it was suggested previouslythat the linewidths are dominated by the dissociation rate.11
Otherwise, one might expect substantially different broad-enings for the two isotopologs, which have different densi-ties of states and couplings. We confirm that the bands that
are mostly 4ν1 have similar linewidths, but the band with alarge 3ν1 + ν2 contribution has noticeable narrower lines (seeSec. III A). This suggests state-specificity in the dissociation,as discussed below.
Our inability to fit well the action spectra with isolatedtransitions is quite likely caused by the presence of otherweakly absorbing states arising from weaker couplings of thebright states discussed above with combinations of lower fre-quency vibrations. The inclusion of a b-type transition to im-prove the fit shown in Fig. 2(b) might therefore be misleadingand simply serve as apparent compensation of small contribu-tions from other bands.
B. Product state distributions
The analysis of the H and D KEDs summarized inTable II sheds light on the dissociation dynamics of the hy-droxymethyl radical in the ground electronic state. The dis-sociation of the CD2OH isotopolog enables us to distinguishbetween the H atom initially in the OH group (which carriesmost of the optical excitation) and the D atoms initially at-tached to the carbon atom, and thus observe the isomerizationchannel explicitly. Such distinction, however, is impossiblefor CH2OH. Nevertheless, analysis of the experimental resultsindicates that isomerization is responsible for a fraction of Hproducts in both radical isotopologs.
We note that when monitoring D from CD2OH, thereis no CO stretch excitation in the formaldehyde cofrag-ment, whereas all H-producing reactions lead to a small butquite consistent population (∼3%) in this mode. In con-trast, methylene group deformation modes (scissors, rock, andwag) are significantly excited (∼28% total population) in theD-producing reaction, but show smaller and variable excita-tions when monitoring H. These observations suggest thatdirect OH bond fission produces formaldehyde that is pre-dominantly vibrationless or has small CO stretch excitation,but excitation of the deformation modes is associated mainlywith the isomerization channel contribution that is different ineach case. The positive correlation between the effective rota-tional temperatures and the extent of the deformation modes
084305-7 VMI studies of CH2OH decomposition J. Chem. Phys. 136, 084305 (2012)
TABLE III. Formaldehyde vibrational populations predicted by the model described in Sec. IV B. Deviations from the experimental values in units of the leastsignificant digit are given in parentheses.
Relative population
CH2OH → H + CH2O CD2OH (13 621 cm−1)
Fragment excitation 13 602 cm−1 13 662 cm−1 H + CD2O D + CHDO Direct dissociationa
Ground 1 1 1 1 1C=O 0.0293(+74) 0.0251(−43) 0.0320(−13) 0.000(+00) 0.0320–0.0333Scissors 0.0160(−20) 0.0234(−65) 0.0113(+10) 0.068(+12) 0.0113–0.0089Rock 0.0218(+06) 0.0450(−16) 0.0072(−11) 0.183(+07) 0.0072–0.0000Wag 0.0218(+07) 0.0414(+37) 0.0095(+04) 0.158(−12) 0.0095–0.0034
% Isomerization 11–15 26–30 0–5 100 0
aIsomerization channel distribution can be seen in the D + CHDO column.
excitations indicates that rotational excitation is lower fordirect OH bond fission and higher for dissociation afterisomerization.34
In order to estimate the branching between isomerizationand direct dissociation, the experimental vibrational popula-tion distributions were analyzed in terms of a simple modelwith the following assumptions:
1. The products observed in each experiment come fromtwo independent dissociation channels (direct andthrough isomerization), and thus the observed distribu-tions are linear combinations of the distributions for eachchannel.
2. The distribution for each of the two channels is the samein all experiments. That is, it does not depend on isotopicsubstitution effects and variations in the radical excita-tion energy in the narrow range (∼100 cm−1) used inthe present experiments.
These assumptions allow us to write 16 equations (fourvibrational populations in four experiments) for the observedrelative populations pe, v of state v in experiment e:
pe,v = (1 − ke)pd,v + kepi,v , (1)
where pd,v and pi,v are the populations of state v for the directand isomerization channels, respectively, and ke is the frac-tional contribution of isomerization channel in experiment e.Normalization to pe, 0 = 1 is automatically satisfied by settingpd,0 = pi,0 = 1. For the CD2OH → D + CHDO experimentthe value ke = 1 is known, and thus the 16 equations have 11unknowns: 4 excited vibrational populations for each of the 2channels plus the isomerization contributions ke in 3 experi-ments.
The system of nonlinear equations was solved numeri-cally by minimization of weighted squared error (using co-variance matrices for the experimental populations obtainedin the KED fittings) under the constraints pd,v ≥ 0, pi,v ≥ 0,and 0 ≤ ke ≤ 1. Despite the fact that the number of unknownsis smaller than the number of equations, the system has onedegree of freedom. Namely, (1) can be recast as
pe,v = (1 − ke)pd,v + kepi,v = (1 − k′e)p′
d,v + k′epi,v ,
(2)
{p′
d,v = (1 + α)pd,v − αpi,v
k′e = (ke + α)/(1 + α),
(3)
for any α. This variation, however, is limited by pd,v
≥ 0, ke ≥ 0 restrictions, which are reached at pd,v = 0 forrock population on one side and ke = 0 for CD2OH → H+ CD2O experiment on the other. The model results aresummarized in Table III, where the percentage of productsfrom isomerization refers to the total yield and was calcu-lated as ke
∑v pi,v/
∑v pe,v . Detailed plots comparing the ex-
perimental KEDs and those obtained by using the model areshown in the supplementary material.25 It is evident that theuncertainty caused by underdeterminacy of the system is rel-atively small and does not affect the usability of the results.35
As can be seen from comparing Tables II and III, thissimple model reproduces the experimental results fairly well,except the CO population for the main band of CH2OH, forwhich the discrepancy is ∼16 standard deviations of the fitand ∼1/3 of the observed value. This disagreement is mostprobably a result of deviations from the second assumption ofthe model and does not undermine the qualitative conclusions.The model outcome is that in CH2OH dissociation 11%–15%of the events proceed by isomerization when the excited levelis dominated by 4ν1, whereas the corresponding branchingfor the level dominated by 3ν1 + ν2 is larger, 26%–30%. Indissociation of CD2OH from a purer 4ν1 level, isomerizationaccounts for <13% events (estimated from <5% fraction forthe H channel).
It is noteworthy that no excitation of CH (CD) stretch vi-brations in the formaldehyde products was observed in eitherreaction, even though the VCI calculations6 show that the in-volved CH2OH (CD2OH) excited states contain considerableantisymmetric CH (CD) stretch contributions, and the CD fre-quencies in CD2O and CHDO are rather similar to the COfrequencies.
C. Competition between OH bond fissionand isomerization
The radical decomposition mechanism in the experi-ments reported above is not immediately obvious. On the onehand, one might expect that excitation of vibrations with prin-cipally OH stretch character and energies very close to thebarrier height for OH bond fission should lead to relatively
084305-8 Ryazanov, Rodrigo, and Reisler J. Chem. Phys. 136, 084305 (2012)
quick dissociation. However, while this fission is actually ob-served, its rate is too low (the barrier height estimated fromthe dissociation rate11 is ∼1000 cm−1 higher than the presentab initio value). On the other hand, the isomerization barrieris lower by ∼400 cm−1 than the barrier for OH bond fission.Nevertheless, the isomerization rate is even smaller than theOH bond fission rate (but is not negligible).
The calculations6 in fact show that the lowest barrier forOH bond fission corresponds to the geometry with the OHgroup twisted from the quasiplanar structure of the radical6, 24
such that the HOC plane becomes perpendicular to the HCHplane. The isomerization pathway involves the same OHgroup torsion, but additionally requires a large change of theHOC angle (see Fig. 2 in Ref. 6). Therefore, the OH stretchovertone excitation is not an effective way to promote disso-ciation and is even less effective for isomerization, leading torelatively long lifetimes of the vibrationally excited states.
Assuming that the observed spectral linewidths are de-termined by upper state lifetimes dominated by dissociationrates, it appears that the overall dissociation rate from the levelthat is of purer 4ν1 composition is nearly twice higher than therate from the level with smaller 4ν1 contribution. At the sametime the observed fraction of isomerization products showsthe opposite trend (approximately twice the total hydrogenyield from isomerization for the longer-lived state). These ob-servations suggest that the isomerization rate is largely insen-sitive to the initial state composition, whereas the OH bondfission rate decreases when the state has a smaller 4ν1 com-ponent. Indeed, the state dominated by 3ν1 + ν2 must havesmaller wavefunction amplitudes at large OH distances thanthe state dominated by 4ν1, which explains its lower disso-ciation rate (regardless of whether tunneling or passing justabove the barrier is involved), even though the total excitationenergy is slightly higher. Since the isomerization transitionstate has less extended OH distance,6 the isomerization rateshould be less sensitive to the degree of OH stretch excita-tion.
A quantitative description of these decomposition pro-cesses would require quantum-mechanical calculations in atleast three dimensions (OH stretch, torsion, and HOC bend-ing), and perhaps full dimensionality to adequately describethe product state distributions (although CH (CD) stretchesare not excited in the products, they must participate in theCD2OH → CHD2O → D + CHDO process).
V. CONCLUSIONS
The overtone-induced dissociation of CH2OH andCD2OH was studied experimentally at energies near the bar-rier tops for OH bond fission and isomerization to methoxy.Hydrogen products were monitored by SVMI, and actionspectra and KEDs were measured in the region of excitationto 4ν1. The action spectrum of CD2OH showed only a transi-tion to the 4ν1 overtone, whereas two bands were observed inCH2OH in the corresponding excitation region. These bandswere assigned as transitions to two coupled states, the moreintense band dominated by 4ν1 and the less intense oneby 3ν1 + ν2.
KEDs obtained from SVMI data show distinct dynamicalsignatures in the formaldehyde cofragment associated withOH bond fission and isomerization to methoxy. Dissociationproceeding by OH bond fission leads mainly to formaldehydein the vibrationless state, with a small (∼3%) excitation inthe CO stretch and yet smaller excitations in the methylenedeformation modes (scissors, rock, and wag). On the otherhand, dissociation following isomerization leads to formalde-hyde that is rotationally hotter and has a much larger frac-tion (∼28%) of the energy deposited in methylene deforma-tions, but not in the CO stretch. No excitation in the CH (CD)stretches was observed in formaldehyde from either reaction.Analysis of the data also suggests that the dissociation ratefor OH fission depends more strongly on the initially excitedlevel than the isomerization rate, at least for the levels exam-ined in this study.
The CH2OH ↔ CH3O dissociative system has provento be amenable to detailed experiments on its dynamics inthe ground electronic state. Most of the previous experimen-tal work7, 31 has dealt with initial excitation of CH3O forwhich isomerization is unlikely by energetic considerations.Our work is the first detailed study of excitation and disso-ciation of CH2OH and CD2OH that demonstrates the role ofisomerization. We hope in the future to extend the experimen-tal studies to higher energies, other vibrational overtones andcombination bands and rotationally resolved states by em-ploying IR-IR double resonance excitation techniques.
ACKNOWLEDGMENTS
Support by the (U.S.) Department of Energy (DOE)(Grant No. DE-FG02-05ER15629) is gratefully acknowl-edged. The authors thank Eugene Kamarchik, Joel Bowman,and Anna Krylov for sharing their theoretical results.
1P. W. Seakins and S. R. Leone, J. Phys. Chem. 96, 4478 (1992); W. Hack,M. Hold, K. Hoyermann, J. Wehmeyer, and T. Zeuch, Phys. Chem. Chem.Phys. 7, 1977 (2005).
2J. Lindner, R. A. Loomis, J. J. Klaassen, and S. R. Leone, J. Chem. Phys.108, 1944 (1998); C. Fockenberg, G. E. Hall, J. Preses, T. J. Sears, andJ. T. Muckerman, J. Phys. Chem. A 103, 5722 (1999); V. D. Knyazev, J.Phys. Chem. A 106, 8741 (2002); N. Balucani, F. Leonori, A. Bergeat,R. Petrucci, and P. Casavecchia, Phys. Chem. Chem. Phys. 13, 8322 (2011).
3T. P. Marcy, R. R. Díaz, D. Heard, S. R. Leone, L. B. Harding, andS. J. Klippenstein, J. Phys. Chem. A 105, 8361 (2001).
4A. Bergeat, S. Moisan, R. Méreau, and J.-C. Loison, Chem. Phys. Lett. 480,21 (2009).
5T. P. M. Goumans and J. Kästner, J. Phys. Chem. A, 115, 10767 (2011).6E. Kamarchik, C. Rodrigo, J. M. Bowman, A. I. Krylov, and H. Reisler,J. Chem. Phys. 136, 084304 (2012).
7A. Geers, J. Kappert, F. Temps, and J. W. Wiebrecht, J. Chem. Phys. 99,2271 (1993); S. Dertinger, A. Geers, J. Kappert, J. W. Wiebrecht, andF. Temps, Faraday Discuss. 102, 31 (1995).
8M. E. Jacox, Chem. Phys. 59, 213 (1981).9R. D. Johnson III and J. W. Hudgens, J. Phys. Chem. 100, 19874 (1996).
10L. Feng, J. Wei, and H. Reisler, J. Phys. Chem. A 108, 7903 (2004).11J. Wei, B. Karpichev, and H. Reisler, J. Chem. Phys. 125, 034303 (2006).12D. W. Chandler, W. E. Farneth, and R. N. Zare, J. Chem. Phys. 77, 4447
(1982); M.-C. Chuang, J. E. Baggott, D. W. Chandler, W. E. Farneth,and R. N. Zare, Faraday Discuss. Chem. Soc. 75, 301 (1983); X. Luo,P. R. Fleming, T. A. Seckel, and T. R. Rizzo, J. Chem. Phys. 93, 9194(1990); D. Luckhaus, J. L. Scott, and F. F. Crim, J. Chem. Phys. 110, 1533(1999); B. Kuhn and T. R. Rizzo, J. Chem. Phys. 112, 7461 (2000); F.Reiche, B. Abel, R. D. Beck, and T. R. Rizzo, J. Chem. Phys. 112, 8885(2000).
084305-9 VMI studies of CH2OH decomposition J. Chem. Phys. 136, 084305 (2012)
13S. Saebø, L. Radom, and H. F. Schaefer III, J. Chem. Phys. 78, 845(1983).
14V. Aristov, D. Conroy, and H. Reisler, Chem. Phys. Lett. 318, 393 (2000);D. Conroy, V. Aristov, L. Feng, and H. Reisler, J. Phys. Chem. A 104,10288 (2000); L. Feng, X. Huang, and H. Reisler, J. Chem. Phys. 117,4820 (2002); L. Feng, A. V. Demyanenko, and H. Reisler, J. Chem. Phys.118, 9623 (2003); L. Feng and H. Reisler, J. Phys. Chem. A 108, 9847(2004).
15J. J. Lin, J. Zhou, W. Shiu, and K. Liu, Rev. Sci. Instrum. 74, 2495(2003).
16R. Mahon, T. J. McIlrath, V. P. Myerscough, and D. W. Koopman, IEEE J.Quantum Electron. 15, 444 (1979).
17G. A. Garcia, L. Nahon, C. J. Harding, E. M. Mikajlo, and I. Powis, Rev.Sci. Instrum. 76, 053302 (2005).
18W. C. Wiley and I. H. McLaren, Rev. Sci. Instrum. 26, 1150 (1955).19A. T. J. B. Eppink and D. H. Parker, Rev. Sci. Instrum. 68, 3477 (1997).20A. Kuthi, P. Gabrielsson, M. R. Behrend, P. T. Vernier, and M. A.
Gundersen, IEEE Trans. Plasma Sci. 33, 1192 (2005).21W. Li, S. D. Chambreau, S. A. Lahankar, and A. G. Suits, Rev. Sci. Instrum.
76, 063106 (2005).22D. A. Dahl, Int. J. Mass. Spectrom. 200, 3 (2000); see
http://www.simion.com.23C. M Western, PGOPHER, a program for simulating rotational structure,
University of Bristol, 2010, see http://pgopher.chm.bris.ac.uk.24A. V. Marenich and J. E. Boggs, J. Chem. Phys. 119, 10105 (2003).25See supplementary material at http://dx.doi.org/10.1063/1.3685899 for the
detailed description of procedures and results of data fittings.26R. J. Bouwens, J. A. Hammerschmidt, M. M. Grzeskowiak, T. A. Stegink,
P. M. Yorba, and W. F. Polik, J. Chem. Phys. 104, 460 (1996).27M. M. Wohar and P. W. Jagodzinski, J. Mol. Spectrosc. 148, 13
(1991); A. Perrin, J. M. Flaud, A. Predoi-Cross, M. Winnewisser, B. P.Winnewisser, G. Mellau, and M. Lock, J. Mol. Spectrosc. 187, 61 (1998).
28R. Bocquet, J. Demaison, J. Cosléou, A. Friedrich, L. Margulès, S.Macholl, H. Mäder, M. M. Beaky, and G. Winnewisser, J. Mol. Spec-trosc. 195, 345 (1999); K. K. Ellsworth, B. D. Lajiness, J. P. Lajiness, andW. F. Polik, J. Mol. Spectrosc. 252, 205 (2008).
29L. Feng, A. V. Demyanenko, and H. Reisler, J. Chem. Phys. 120, 6524(2004).
30O. V. Boyarkin, L. Lubich, R. D. F. Settle, D. S. Perry, and T. R. Rizzo,J. Chem. Phys. 107, 8409 (1997).
31A. Geers, J. Kappert, F. Temps, and J. W. Wiebrecht, J. Chem. Phys. 101,3618 (1994).
32CH3OH and CD3OH (Aldrich, 99.5 atom % D) were used without furtherpurification.
33The small apparent anisotropy seen in Fig. 1 is caused by nonuniform de-tection of H fragments created in the dissociation region with different ve-locity directions. Namely, the light H atoms are fast enough (∼9 μm/ns) totravel a distance comparable to the laser beam waist radius in few nanosec-onds between the radical dissociation and their ionization. Therefore, thedetected fraction of vertically ejected fragments is smaller than that offragments ejected horizontally (and thus remaining within the ionizationlaser beam). The employed lasers cannot produce pulses shorter than afew nanoseconds, so the average delay can be reduced only by reducingthe temporal overlap, when the end of the ionization pulse overlaps withthe beginning of the dissociation pulse. This indeed reduced the apparentanisotropy, but at the expense of significant reduction in the detected sig-nal. SVMI and TOF studies did not show any noticeable dependence on thelaser polarization, thus it was concluded that the velocity distributions wereisotropic.
34To be precise, only the two cases of CH2OH dissociation can be compareddirectly, because different masses of the H and D fragments and differ-ent moments of inertia of the formaldehyde cofragments should affect theenergy partitioning between translations and rotations in the isotopicallysubstituted species. However, these isotopic effects alone cannot explainthe almost threefold difference between the rotational temperatures of vi-brationless CD2O and CHDO.
35A quantitative measurement of D/H product ratio in CD2OH dissociationwould allow unambiguous estimation of the direct dissociation distribution.However, an accurate measurement is difficult, and the model assumptionsdo not warrant a more quantitative evaluation. Qualitatively, the D yieldwas at least an order of magnitude smaller than the H yield, which is con-sistent with the branching estimated from the model.


![Caractérisation et Dissociation du Complexe … · calcul des niveaux d'énergie du C60 par la méthode de Hückelii,iii. 3 Figure 1 : le fullerène[60] ... Le C60 est constitué](https://static.fdocument.org/doc/165x107/5b9cdae209d3f2f94c8d53c6/caracterisation-et-dissociation-du-complexe-calcul-des-niveaux-denergie-du.jpg)