Supplementary information - media.nature.com · 1 Supplementary information Small molecule promotes...
28
1 Supplementary information Small molecule promotes β-catenin citrullination and inhibits Wnt signaling in cancer Yi Qu 1,2,3 , Jan Roger Olsen 1 , Xing Yuan 4 , Phil F Cheng 5 , Mitchell P. Levesque 5 , Karl A. Brokstad 6 , Paul S. Hoffman 7 , Anne Margrete Oyan 1 , Weidong Zhang 3,4 *, Karl-Henning Kalland 1, 2, 8 *, Xisong Ke 1,3 * 1 Department of Clinical Science, University of Bergen, Bergen, Norway 2 Department of Microbiology, Haukeland University Hospital, Bergen, Norway 3 Institute of Interdisciplinary Integrative Medicine Research, Shanghai University of Traditional Chinese Medicine, Shanghai, P.R. China 4 Department of Phytochemistry, College of Pharmacy, Second Military Medical University, Shanghai, P.R. China 5 Department of Dermatology, University of Zürich, University of Zürich Hospital, Zürich, Switzerland 6 Broegelmann Research Laboratory, Department of Clinical Science, University of Bergen, Bergen, Norway 7 Department of Medicine, Division of Infectious Diseases and International Health, University of Virginia School of Medicine, Charlottesville, VA, USA 8 Centre for Cancer Biomarkers, University of Bergen, Bergen, Norway *Correspondence to: [email protected], [email protected] or [email protected] Nature Chemical Biology: doi:10.1038/nchembio.2510
Transcript of Supplementary information - media.nature.com · 1 Supplementary information Small molecule promotes...
1
Supplementary information
Small molecule promotes β-catenin citrullination and
inhibits Wnt signaling in cancer
Yi Qu1,2,3
, Jan Roger Olsen1, Xing Yuan
4, Phil F Cheng
5, Mitchell P. Levesque
5, Karl A.
Brokstad6, Paul S. Hoffman
7, Anne Margrete Oyan
1, Weidong Zhang
3,4*, Karl-Henning
Kalland1, 2, 8
*, Xisong Ke1,3
*
1 Department of Clinical Science, University of Bergen, Bergen, Norway
2 Department of Microbiology, Haukeland University Hospital, Bergen, Norway
3 Institute of Interdisciplinary Integrative Medicine Research, Shanghai University of
Traditional Chinese Medicine, Shanghai, P.R. China
4 Department of Phytochemistry, College of Pharmacy, Second Military Medical University,
Shanghai, P.R. China
5 Department of Dermatology, University of Zürich, University of Zürich Hospital, Zürich,
Switzerland
6 Broegelmann Research Laboratory, Department of Clinical Science, University of Bergen,
Bergen, Norway
7 Department of Medicine, Division of Infectious Diseases and International Health,
University of Virginia School of Medicine, Charlottesville, VA, USA
8 Centre for Cancer Biomarkers, University of Bergen, Bergen, Norway
*Correspondence to: [email protected], [email protected] or [email protected]
Nature Chemical Biology: doi:10.1038/nchembio.2510
2
Supplementary Results
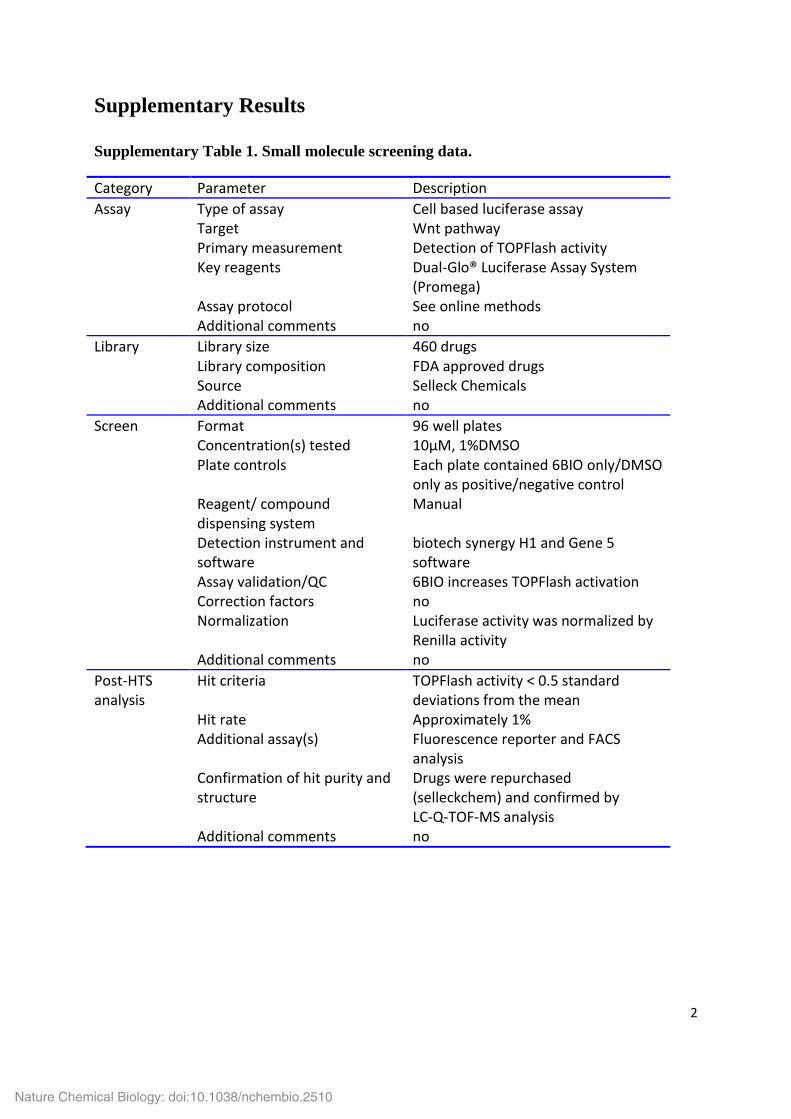
Supplementary Table 1. Small molecule screening data.
Category Parameter Description
Assay Type of assay Cell based luciferase assay Target Wnt pathway Primary measurement Detection of TOPFlash activity Key reagents Dual-Glo® Luciferase Assay System
(Promega) Assay protocol See online methods Additional comments no
Library Library size 460 drugs Library composition FDA approved drugs Source Selleck Chemicals Additional comments no
Screen Format 96 well plates Concentration(s) tested 10μM, 1%DMSO Plate controls Each plate contained 6BIO only/DMSO
only as positive/negative control Reagent/ compound
dispensing system Manual
Detection instrument and software
biotech synergy H1 and Gene 5 software
Assay validation/QC 6BIO increases TOPFlash activation Correction factors no Normalization Luciferase activity was normalized by
Renilla activity Additional comments no
Post-HTS analysis
Hit criteria TOPFlash activity < 0.5 standard deviations from the mean
Hit rate Approximately 1% Additional assay(s) Fluorescence reporter and FACS
analysis Confirmation of hit purity and
structure Drugs were repurchased (selleckchem) and confirmed by LC-Q-TOF-MS analysis
Additional comments no
Nature Chemical Biology: doi:10.1038/nchembio.2510
3
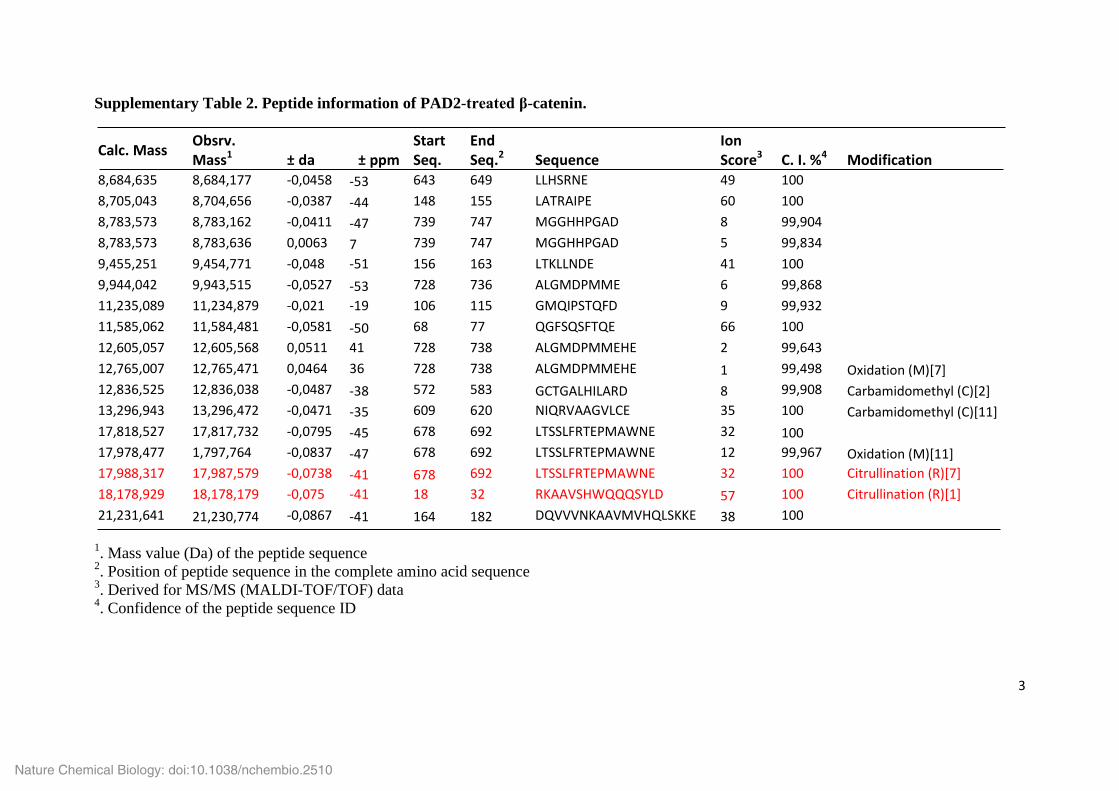
Supplementary Table 2. Peptide information of PAD2-treated β-catenin.
Calc. Mass Obsrv. Mass1 ± da ± ppm
Start Seq.
End Seq.2 Sequence
Ion Score3 C. I. %4 Modification
8,684,635 8,684,177 -0,0458 -53 643 649 LLHSRNE 49 100
8,705,043 8,704,656 -0,0387 -44 148 155 LATRAIPE 60 100
8,783,573 8,783,162 -0,0411 -47 739 747 MGGHHPGAD 8 99,904
8,783,573 8,783,636 0,0063 7 739 747 MGGHHPGAD 5 99,834
9,455,251 9,454,771 -0,048 -51 156 163 LTKLLNDE 41 100
9,944,042 9,943,515 -0,0527 -53 728 736 ALGMDPMME 6 99,868
11,235,089 11,234,879 -0,021 -19 106 115 GMQIPSTQFD 9 99,932
11,585,062 11,584,481 -0,0581 -50 68 77 QGFSQSFTQE 66 100
12,605,057 12,605,568 0,0511 41 728 738 ALGMDPMMEHE 2 99,643
12,765,007 12,765,471 0,0464 36 728 738 ALGMDPMMEHE 1 99,498 Oxidation (M)[7]
12,836,525 12,836,038 -0,0487 -38 572 583 GCTGALHILARD 8 99,908 Carbamidomethyl (C)[2]
13,296,943 13,296,472 -0,0471 -35 609 620 NIQRVAAGVLCE 35 100 Carbamidomethyl (C)[11]
17,818,527 17,817,732 -0,0795 -45 678 692 LTSSLFRTEPMAWNE 32 100 17,978,477 1,797,764 -0,0837 -47 678 692 LTSSLFRTEPMAWNE 12 99,967 Oxidation (M)[11]
17,988,317 17,987,579 -0,0738 -41 678 692 LTSSLFRTEPMAWNE 32 100 Citrullination (R)[7]
18,178,929 18,178,179 -0,075 -41 18 32 RKAAVSHWQQQSYLD 57 100 Citrullination (R)[1]
21,231,641 21,230,774 -0,0867 -41 164 182 DQVVVNKAAVMVHQLSKKE 38 100
1. Mass value (Da) of the peptide sequence
2. Position of peptide sequence in the complete amino acid sequence
3. Derived for MS/MS (MALDI-TOF/TOF) data
4. Confidence of the peptide sequence ID
Nature Chemical Biology: doi:10.1038/nchembio.2510
4
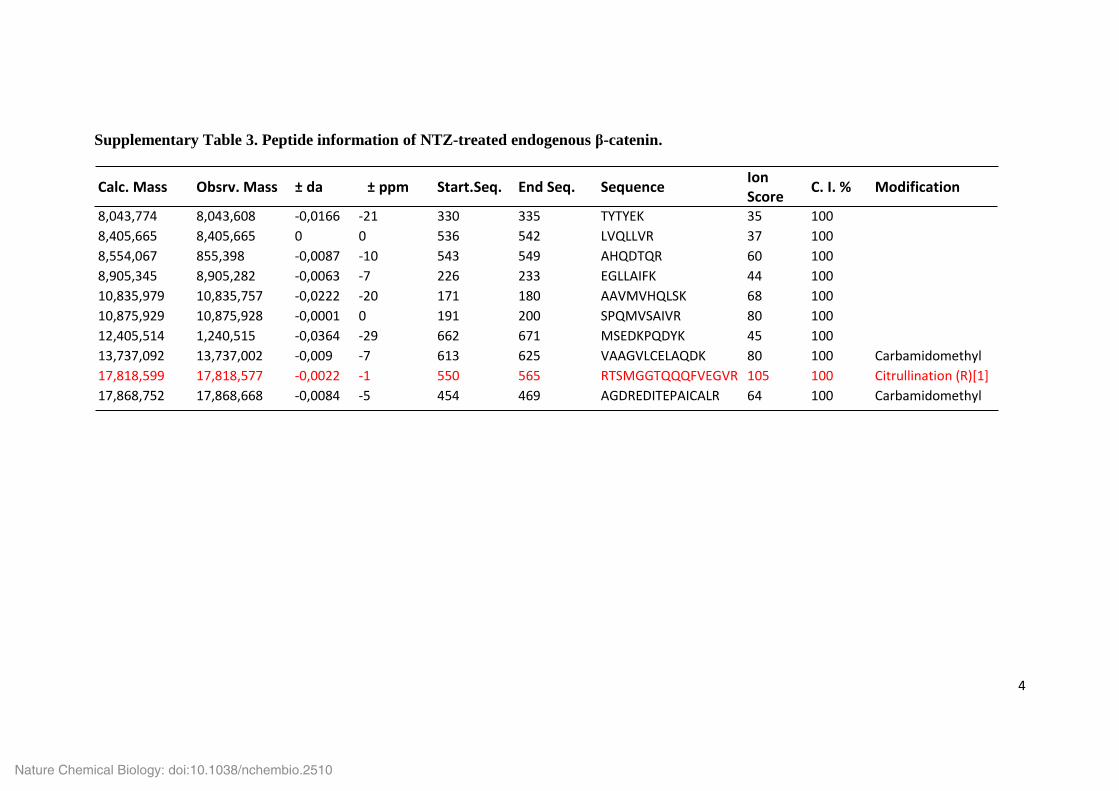
Supplementary Table 3. Peptide information of NTZ-treated endogenous β-catenin.
Calc. Mass Obsrv. Mass ± da ± ppm Start.Seq. End Seq. Sequence Ion Score
C. I. % Modification
8,043,774 8,043,608 -0,0166 -21 330 335 TYTYEK 35 100
8,405,665 8,405,665 0 0 536 542 LVQLLVR 37 100
8,554,067 855,398 -0,0087 -10 543 549 AHQDTQR 60 100
8,905,345 8,905,282 -0,0063 -7 226 233 EGLLAIFK 44 100
10,835,979 10,835,757 -0,0222 -20 171 180 AAVMVHQLSK 68 100
10,875,929 10,875,928 -0,0001 0 191 200 SPQMVSAIVR 80 100
12,405,514 1,240,515 -0,0364 -29 662 671 MSEDKPQDYK 45 100
13,737,092 13,737,002 -0,009 -7 613 625 VAAGVLCELAQDK 80 100 Carbamidomethyl
17,818,599 17,818,577 -0,0022 -1 550 565 RTSMGGTQQQFVEGVR 105 100 Citrullination (R)[1]
17,868,752 17,868,668 -0,0084 -5 454 469 AGDREDITEPAICALR 64 100 Carbamidomethyl
Nature Chemical Biology: doi:10.1038/nchembio.2510
5
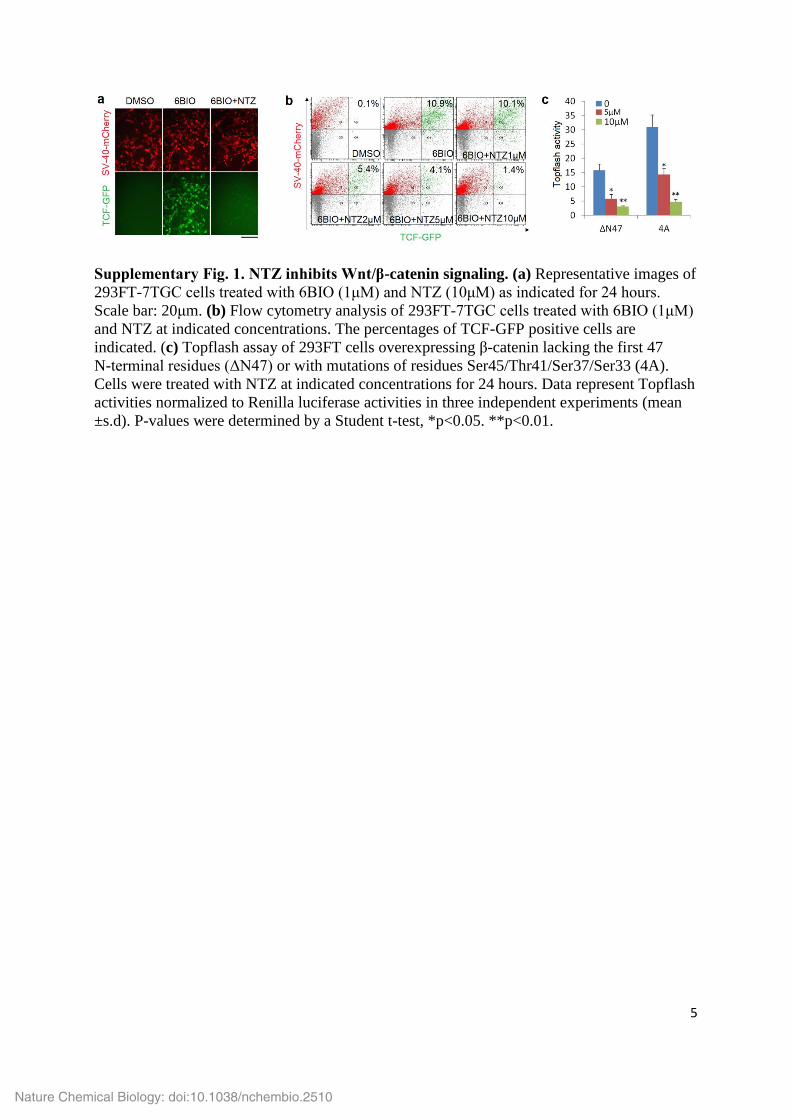
Supplementary Fig. 1. NTZ inhibits Wnt/β-catenin signaling. (a) Representative images of
293FT-7TGC cells treated with 6BIO (1μM) and NTZ (10μM) as indicated for 24 hours.
Scale bar: 20μm. (b) Flow cytometry analysis of 293FT-7TGC cells treated with 6BIO (1μM)
and NTZ at indicated concentrations. The percentages of TCF-GFP positive cells are
indicated. (c) Topflash assay of 293FT cells overexpressing β-catenin lacking the first 47
N-terminal residues (ΔN47) or with mutations of residues Ser45/Thr41/Ser37/Ser33 (4A).
Cells were treated with NTZ at indicated concentrations for 24 hours. Data represent Topflash
activities normalized to Renilla luciferase activities in three independent experiments (mean
±s.d). P-values were determined by a Student t-test, *p<0.05. **p<0.01.
Nature Chemical Biology: doi:10.1038/nchembio.2510

6
Supplementary Fig. 2. CRISPR/Cas9 deletion of CTNNB1. (a) Schematic depiction of
GFP-tagged CRISPR/Cas9 lentiviral vector pL-CRISPR.EFS.GFP (Addgene #57818). (b)
Schematic program of CRISPR/Cas9 based genomic DNA deletion and PCR-based colony
screening. Yellow indicates the DNA sequence encoding the ARM repeats of CTNNB1.Two
sgRNAs (PAM sequences in red) were designed to target upstream and downstream of the
fragment for deletion. To screen deletion colonies, one primer pair matched the internal
region of the deletion (blue arrows) and one primer pair localized external to the deletion (red
arrows). (c) DNA sequencing confirmed the expected deletion at the sgRNA recognition sites
in HCT116 cells overexpressing GFP tagged Cas9 and sgRNAs. (d) PCR confirmed CTNNB1
deletion clones (M11, M32) in HCT116 cells. PCR products with primers detecting the
internal (Int) and external (Ext) regions are indicated with blue and red arrows, respectively.
(e) Immunoblot confirmed β-catenin deletion in clones (M11,M32) of HCT116 cells. Full blot
image for e is shown in Supplementary Figure 21.
Nature Chemical Biology: doi:10.1038/nchembio.2510

7
Supplementary Fig. 3. Clonogenic growth assay of SW480 and HCT116 cells. (a)
Representative images of colony formation of cancer cells overexpressing CTNNB1sgRNAs.
HCT116 and SW480 cells were transfected with GFP-tagged Cas9 sgRNAs for deletion of
CTNNB1, two days later the top 3% GFP positive cells were sorted and plated in low density
for 12 days. Colonies were imaged and quantified by Trypan blue staining and OD590nm in
three independent experiments. (b) Representative images of colony formation of HCT116
clones (M11 and M32) with CTNNB1 deletion. Cells were treated with NTZ at indicated
concentrations for 12 days. The colony growth was quantified by Trypan blue staining and
OD590 nm in three independent experiments. In a and b, P-values were determined by a
Student t-test, *p<0.05. **p<0.01.
Nature Chemical Biology: doi:10.1038/nchembio.2510
8
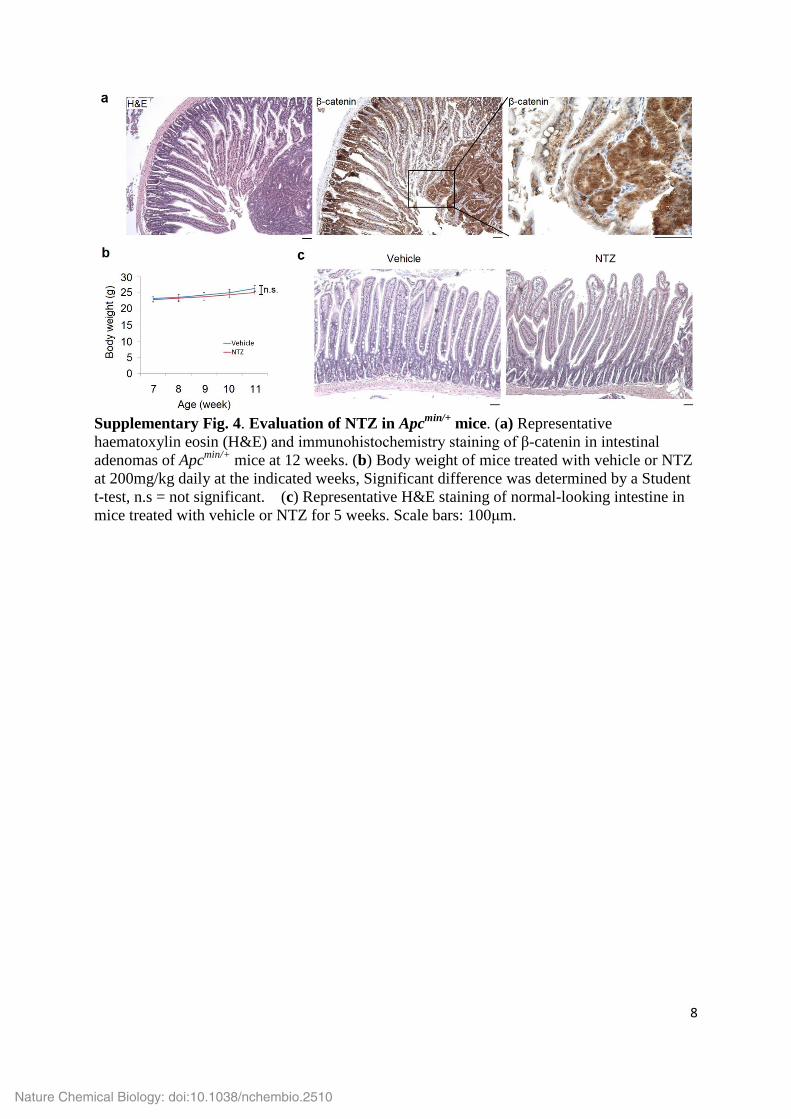
Supplementary Fig. 4. Evaluation of NTZ in Apc
min/+ mice. (a) Representative
haematoxylin eosin (H&E) and immunohistochemistry staining of β-catenin in intestinal
adenomas of Apcmin/+
mice at 12 weeks. (b) Body weight of mice treated with vehicle or NTZ
at 200mg/kg daily at the indicated weeks, Significant difference was determined by a Student
t-test, n.s = not significant. (c) Representative H&E staining of normal-looking intestine in
mice treated with vehicle or NTZ for 5 weeks. Scale bars: 100μm.
Nature Chemical Biology: doi:10.1038/nchembio.2510

9
Supplementary Fig. 5. NTZ promotes β-catenin degradation. (a) Immunoblotting analysis
of β-catenin in DLD1 and Colo320 cells treated with NTZ at indicated concentrations for 24
hours. (b) Immunoblotting analysis of SW480 cells treated with NTZ at indicated
concentrations for 24 hours. SW480 cells overexpressing FLAG-tagged STAT3 was used as a
control. Full blot images for a-b are shown in Supplementary Figure 21.
Nature Chemical Biology: doi:10.1038/nchembio.2510
10
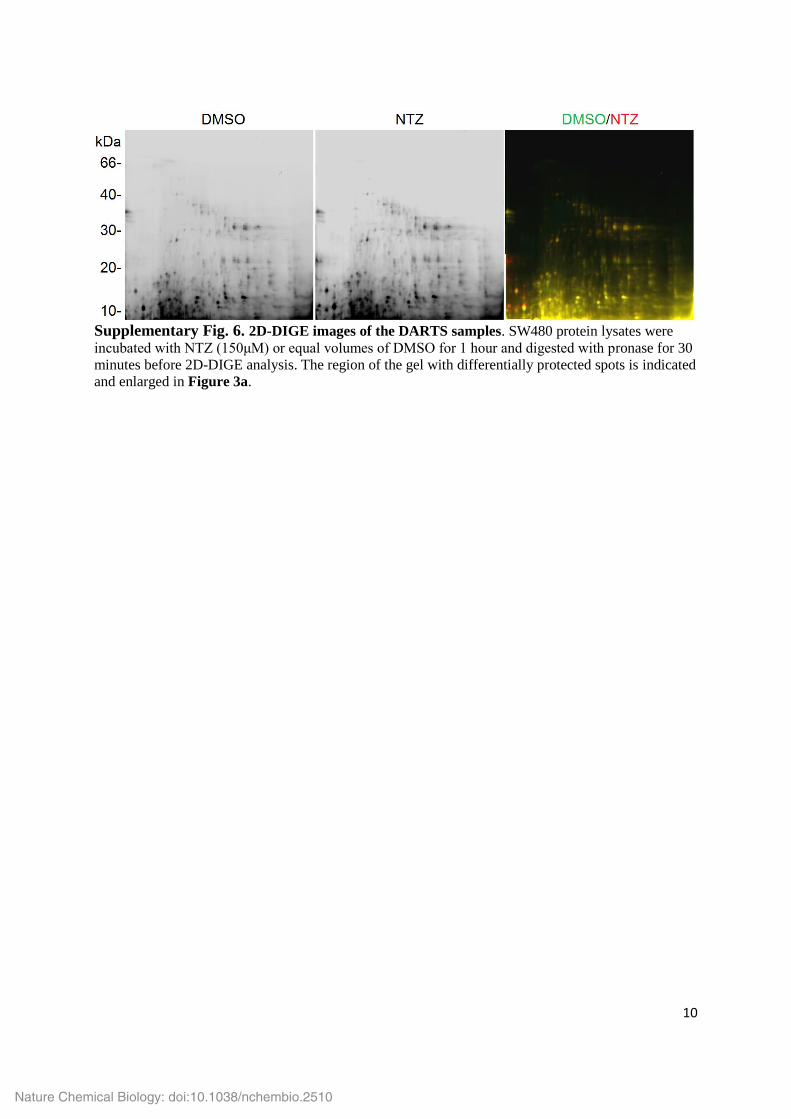
Supplementary Fig. 6. 2D-DIGE images of the DARTS samples. SW480 protein lysates were
incubated with NTZ (150μM) or equal volumes of DMSO for 1 hour and digested with pronase for 30
minutes before 2D-DIGE analysis. The region of the gel with differentially protected spots is indicated
and enlarged in Figure 3a.
Nature Chemical Biology: doi:10.1038/nchembio.2510
11
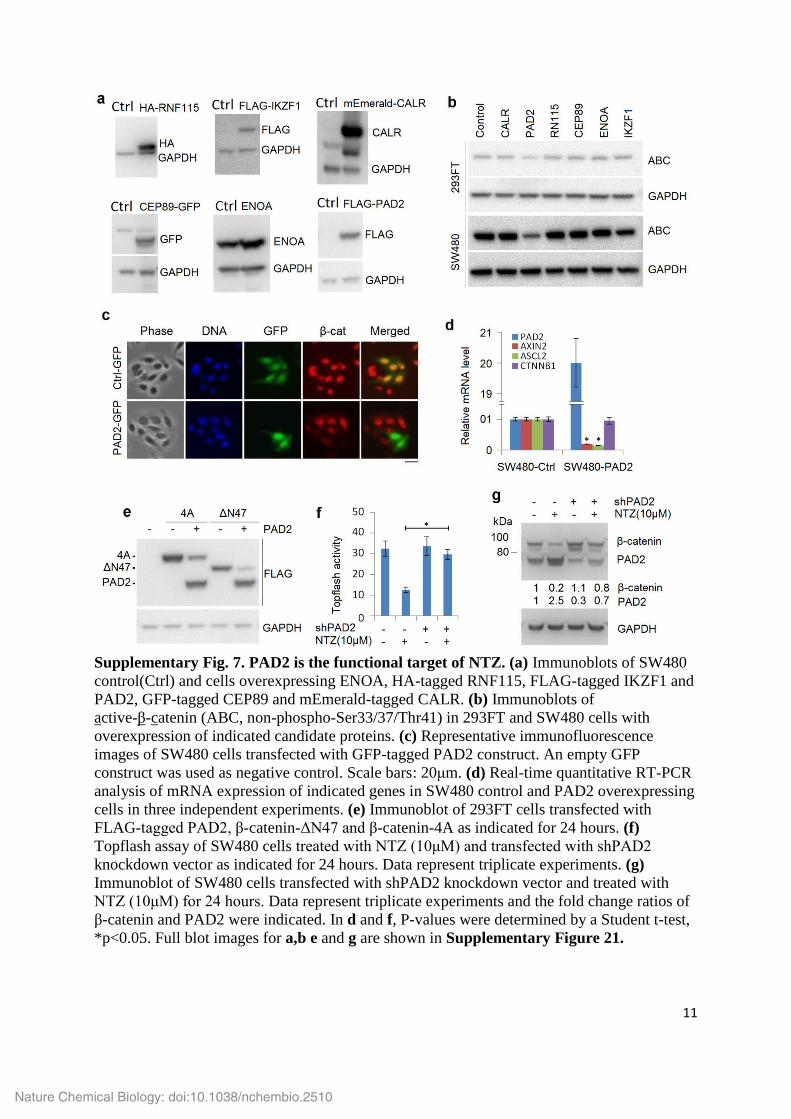
Supplementary Fig. 7. PAD2 is the functional target of NTZ. (a) Immunoblots of SW480
control(Ctrl) and cells overexpressing ENOA, HA-tagged RNF115, FLAG-tagged IKZF1 and
PAD2, GFP-tagged CEP89 and mEmerald-tagged CALR. (b) Immunoblots of
active-β-catenin (ABC, non-phospho-Ser33/37/Thr41) in 293FT and SW480 cells with
overexpression of indicated candidate proteins. (c) Representative immunofluorescence
images of SW480 cells transfected with GFP-tagged PAD2 construct. An empty GFP
construct was used as negative control. Scale bars: 20μm. (d) Real-time quantitative RT-PCR
analysis of mRNA expression of indicated genes in SW480 control and PAD2 overexpressing
cells in three independent experiments. (e) Immunoblot of 293FT cells transfected with
FLAG-tagged PAD2, β-catenin-ΔN47 and β-catenin-4A as indicated for 24 hours. (f)
Topflash assay of SW480 cells treated with NTZ (10μM) and transfected with shPAD2
knockdown vector as indicated for 24 hours. Data represent triplicate experiments. (g)
Immunoblot of SW480 cells transfected with shPAD2 knockdown vector and treated with
NTZ (10μM) for 24 hours. Data represent triplicate experiments and the fold change ratios of
β-catenin and PAD2 were indicated. In d and f, P-values were determined by a Student t-test,
*p<0.05. Full blot images for a,b e and g are shown in Supplementary Figure 21.
Nature Chemical Biology: doi:10.1038/nchembio.2510

12
Supplementary Fig. 8. CRISPR/Cas9 deletion of PAD2. (a) Schematic of CRISPR/Cas9
based genomic DNA deletion and PCR-based colony screening. Two sgRNAs (PAM
sequences in red) were designed to target upstream and downstream of the fragment for
deletion. To screen deletion colonies, one primer pair matched the internal region of the
deletion (blue arrows) and one primer pair localized external to the deletion (red arrows). (b)
DNA sequencing confirmed the expected deletion at the sgRNA recognition sites in SW480
cells overexpressing Cas9 and sgRNAs. (c) PCR confirmed deletion PAD2 deletion
clones(M10, M11)of SW480 cells. PCR products with primers detecting the internal (Int) and
external (Ext) regions are indicated with blue and red arrows, respectively. (d)
Immunoblotting confirmed PAD2 deletion in clones of SW480 cells. Full blot image for d is
shown in Supplementary Figure 21.
Nature Chemical Biology: doi:10.1038/nchembio.2510
13
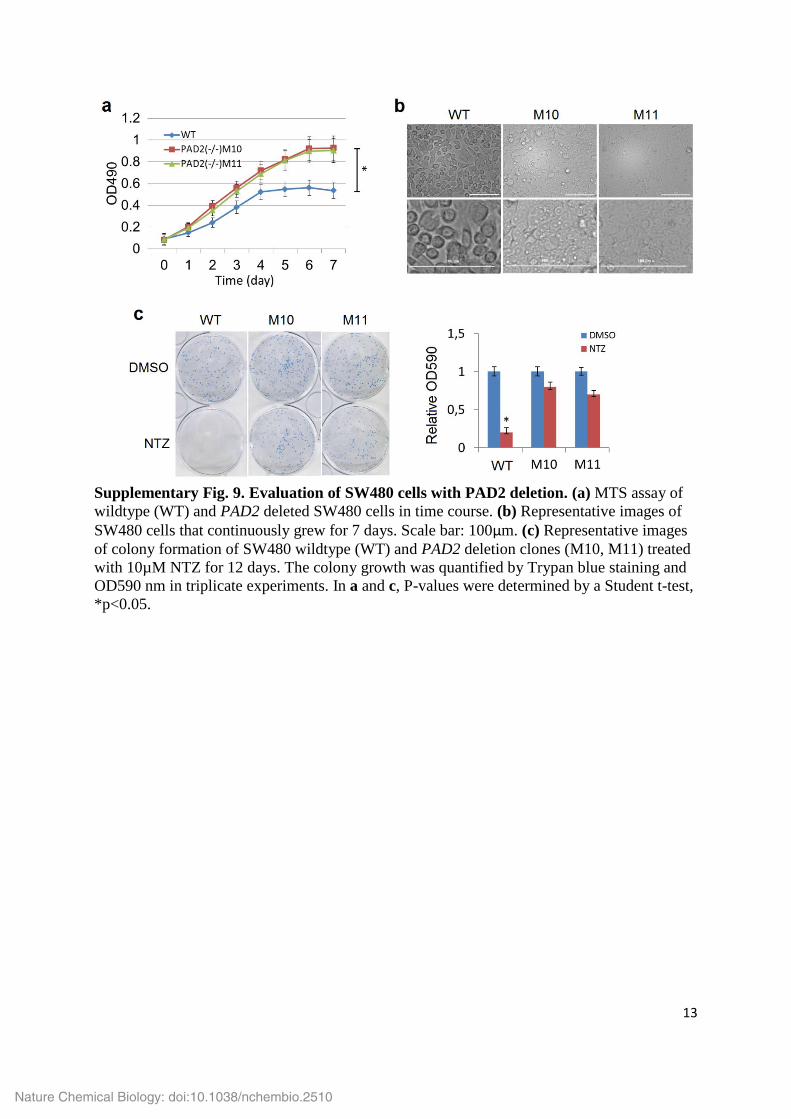
Supplementary Fig. 9. Evaluation of SW480 cells with PAD2 deletion. (a) MTS assay of
wildtype (WT) and PAD2 deleted SW480 cells in time course. (b) Representative images of
SW480 cells that continuously grew for 7 days. Scale bar: 100μm. (c) Representative images
of colony formation of SW480 wildtype (WT) and PAD2 deletion clones (M10, M11) treated
with 10µM NTZ for 12 days. The colony growth was quantified by Trypan blue staining and
OD590 nm in triplicate experiments. In a and c, P-values were determined by a Student t-test,
*p<0.05.
Nature Chemical Biology: doi:10.1038/nchembio.2510
14
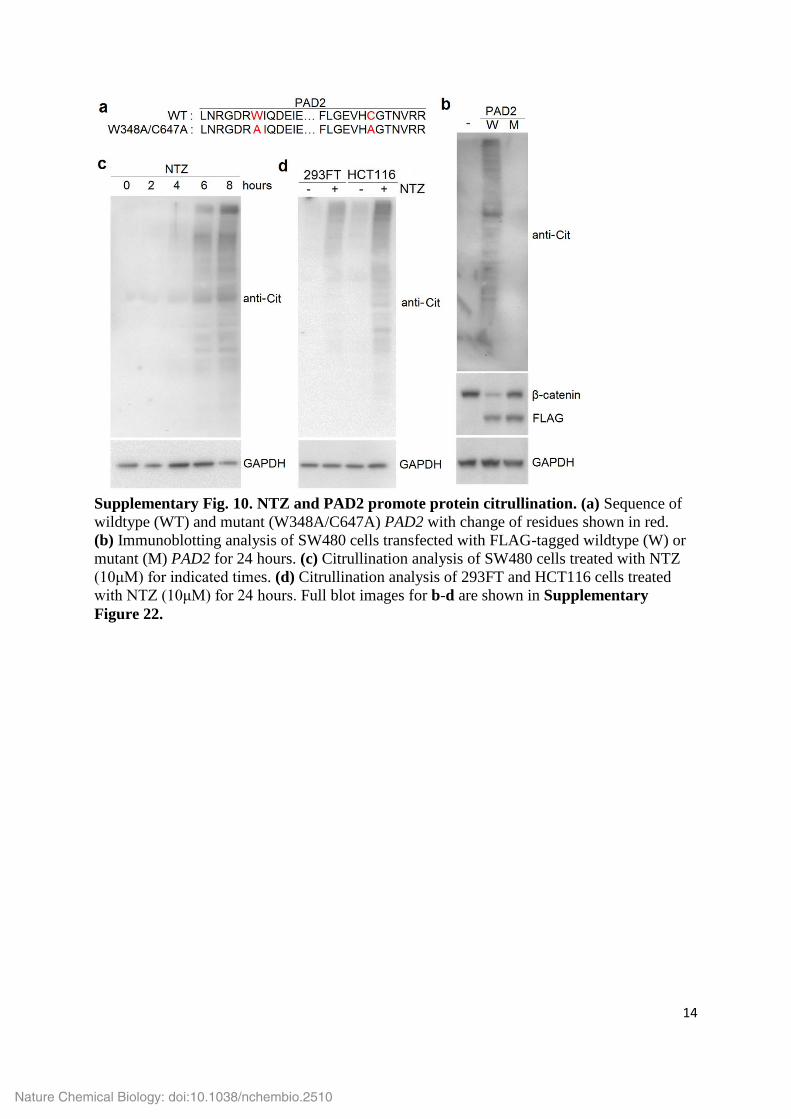
Supplementary Fig. 10. NTZ and PAD2 promote protein citrullination. (a) Sequence of
wildtype (WT) and mutant (W348A/C647A) PAD2 with change of residues shown in red.
(b) Immunoblotting analysis of SW480 cells transfected with FLAG-tagged wildtype (W) or
mutant (M) PAD2 for 24 hours. (c) Citrullination analysis of SW480 cells treated with NTZ
(10μM) for indicated times. (d) Citrullination analysis of 293FT and HCT116 cells treated
with NTZ (10μM) for 24 hours. Full blot images for b-d are shown in Supplementary
Figure 22.
Nature Chemical Biology: doi:10.1038/nchembio.2510

15
Supplementary Fig. 11. Prediction of the interaction between NTZ and PAD2. (a) Sequence and counts of detected PAD2 peptides in the spot enriched in NTZ-treated SW480
lysates. (b) Mapping the detected peptides to the protein sequences and domains of PAD2.
The region (aa138-175) with higher frequencies of detected peptides is highlighted with red.
(c) Visualization of the potential NTZ binding region (aa138-175) of the PAD2 holoenzyme
(PDB: 4N2C)(http://www.pymol.org/). Calcium was marked by number 1-6. (d) PAD2
citrullination of β-catenin in the presence of calcium and NTZ at indicated concentrations.
Full blot image for d is shown in Supplementary Figure 22.
Nature Chemical Biology: doi:10.1038/nchembio.2510
16
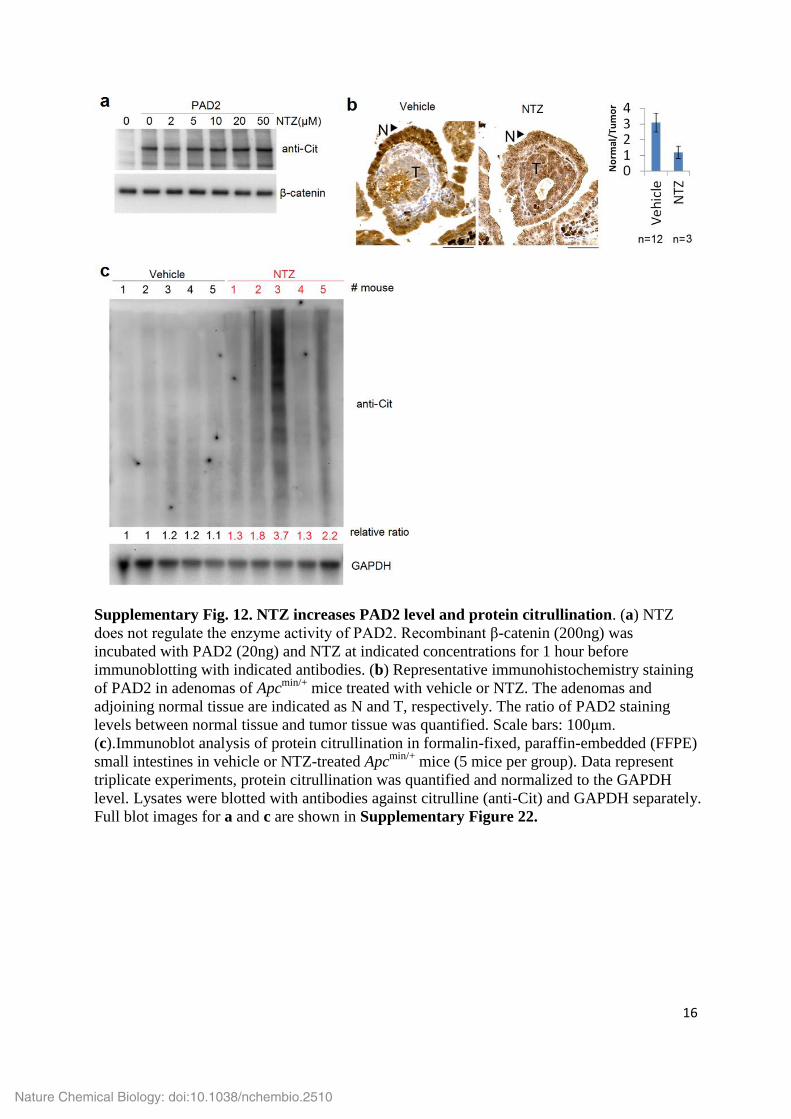
Supplementary Fig. 12. NTZ increases PAD2 level and protein citrullination. (a) NTZ
does not regulate the enzyme activity of PAD2. Recombinant β-catenin (200ng) was
incubated with PAD2 (20ng) and NTZ at indicated concentrations for 1 hour before
immunoblotting with indicated antibodies. (b) Representative immunohistochemistry staining
of PAD2 in adenomas of Apcmin/+
mice treated with vehicle or NTZ. The adenomas and
adjoining normal tissue are indicated as N and T, respectively. The ratio of PAD2 staining
levels between normal tissue and tumor tissue was quantified. Scale bars: 100μm.
(c).Immunoblot analysis of protein citrullination in formalin-fixed, paraffin-embedded (FFPE)
small intestines in vehicle or NTZ-treated Apcmin/+
mice (5 mice per group). Data represent
triplicate experiments, protein citrullination was quantified and normalized to the GAPDH
level. Lysates were blotted with antibodies against citrulline (anti-Cit) and GAPDH separately.
Full blot images for a and c are shown in Supplementary Figure 22.
Nature Chemical Biology: doi:10.1038/nchembio.2510
17
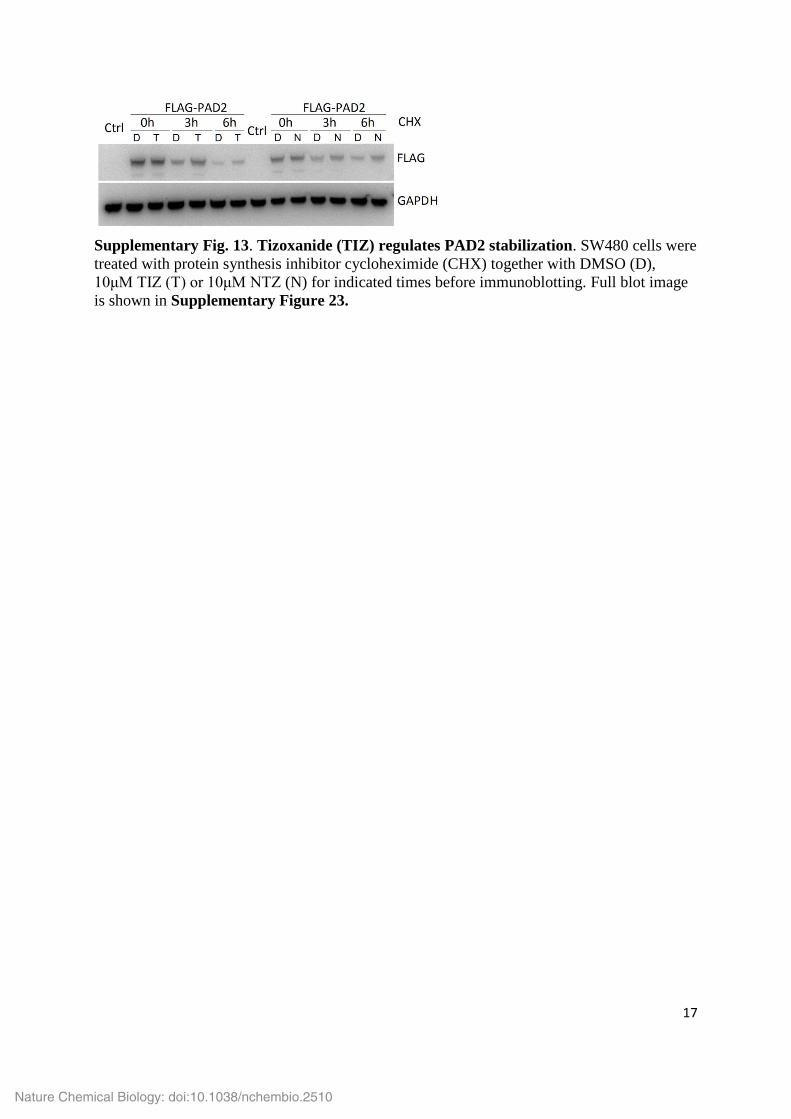
Supplementary Fig. 13. Tizoxanide (TIZ) regulates PAD2 stabilization. SW480 cells were
treated with protein synthesis inhibitor cycloheximide (CHX) together with DMSO (D),
10μM TIZ (T) or 10μM NTZ (N) for indicated times before immunoblotting. Full blot image
is shown in Supplementary Figure 23.
Nature Chemical Biology: doi:10.1038/nchembio.2510

18
Supplementary Fig. 14. NTZ hydrolyzes and metabolizes to tizoxanide. (a) Total ion
chromatographies (TICs) of NTZ samples dissolved in DMSO (10μM, 0 minute) or water
(10μM) for indicated times. Graphs are representative of 3 independent experiments. (b) Mass
spectrum of the peaks in a with retention times of 6.851 and 7.133 minutes indicates NTZ
(molecular weight 306 Da) and its metabolite TIZ (molecular weight 264 Da), respectively. (c)
NTZ and TIZ percentages in NTZ samples dissolved in DMSO (10μM, 0 minute) or water
(10μM) for indicated times. Data are representative of 3 independent experiments. *p<0.05.
(d) TICs of SW480 cells treated with DMSO or NTZ (10μM) for 30 minutes. (e) Mass
spectrum of the peak in d with retention time of 5.894 minutes indicates that only TIZ
(molecule weight 264 Da) was detected in SW480 cell lysate.
Nature Chemical Biology: doi:10.1038/nchembio.2510

19
Supplementary Fig. 15. Examination of intracellular calcium and protein citrullination
in NTZ-treated SW480 cells. (a) SW480 cells loaded with Fluo-3 AM were incubated with
DMSO, ionomycin, CaCl2, NTZ or TIZ at indicated concentrations for 10 minutes before
flow cytometry. Fluo-3 emission was measured and normalized to the mean value of baseline
emission (DMSO sample) to determine intracellular Ca2+
levels following indicated treatment.
Data represent results in triplicate experiments (b) SW480 cells were treated with DMSO,
ionomycin, CaCl2, NTZ or TIZ at indicated concentrations for 24 hours before examination of
protein citrullination. (c) SW480 cells overexpressing PAD2 were treated with protein
synthesis inhibitor cycloheximide (CHX) and 1µM ionomycin plus 200µM CaCl2 at the
indicated times before immunoblotting. Full blot images for b and c are shown in
Supplementary Figure 23.
Nature Chemical Biology: doi:10.1038/nchembio.2510
20
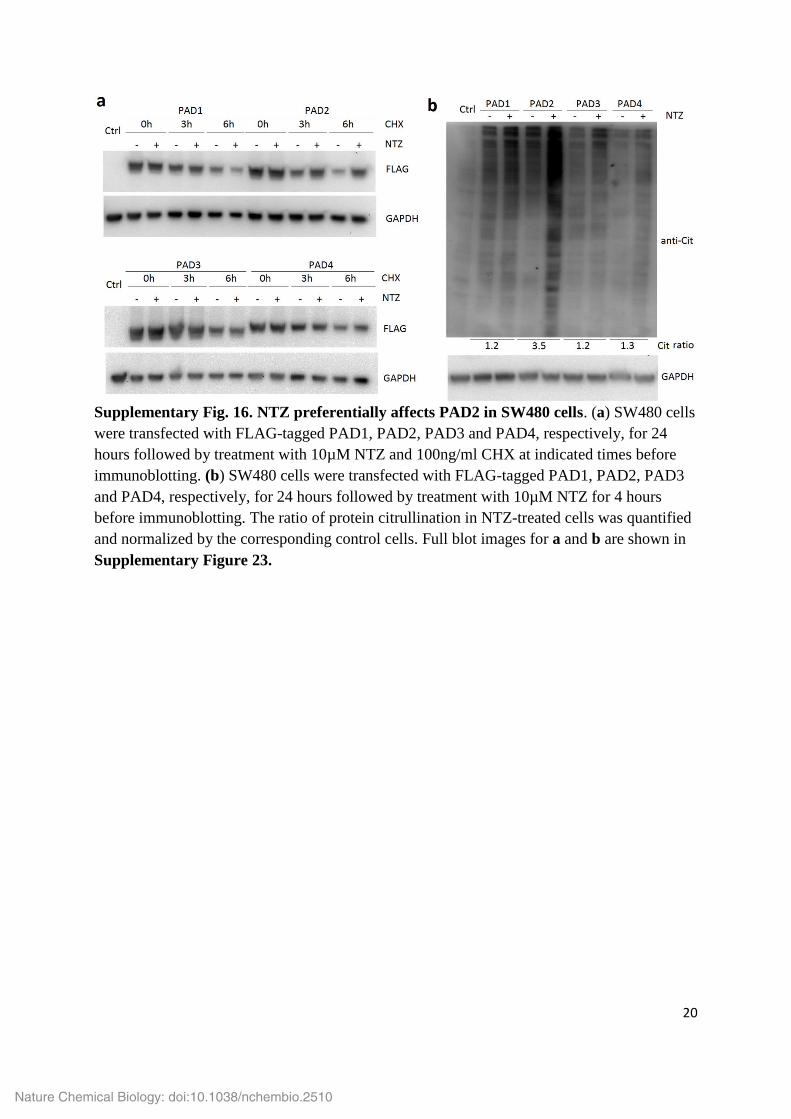
Supplementary Fig. 16. NTZ preferentially affects PAD2 in SW480 cells. (a) SW480 cells
were transfected with FLAG-tagged PAD1, PAD2, PAD3 and PAD4, respectively, for 24
hours followed by treatment with 10µM NTZ and 100ng/ml CHX at indicated times before
immunoblotting. (b) SW480 cells were transfected with FLAG-tagged PAD1, PAD2, PAD3
and PAD4, respectively, for 24 hours followed by treatment with 10µM NTZ for 4 hours
before immunoblotting. The ratio of protein citrullination in NTZ-treated cells was quantified
and normalized by the corresponding control cells. Full blot images for a and b are shown in
Supplementary Figure 23.
Nature Chemical Biology: doi:10.1038/nchembio.2510
21
Nature Chemical Biology: doi:10.1038/nchembio.2510
22
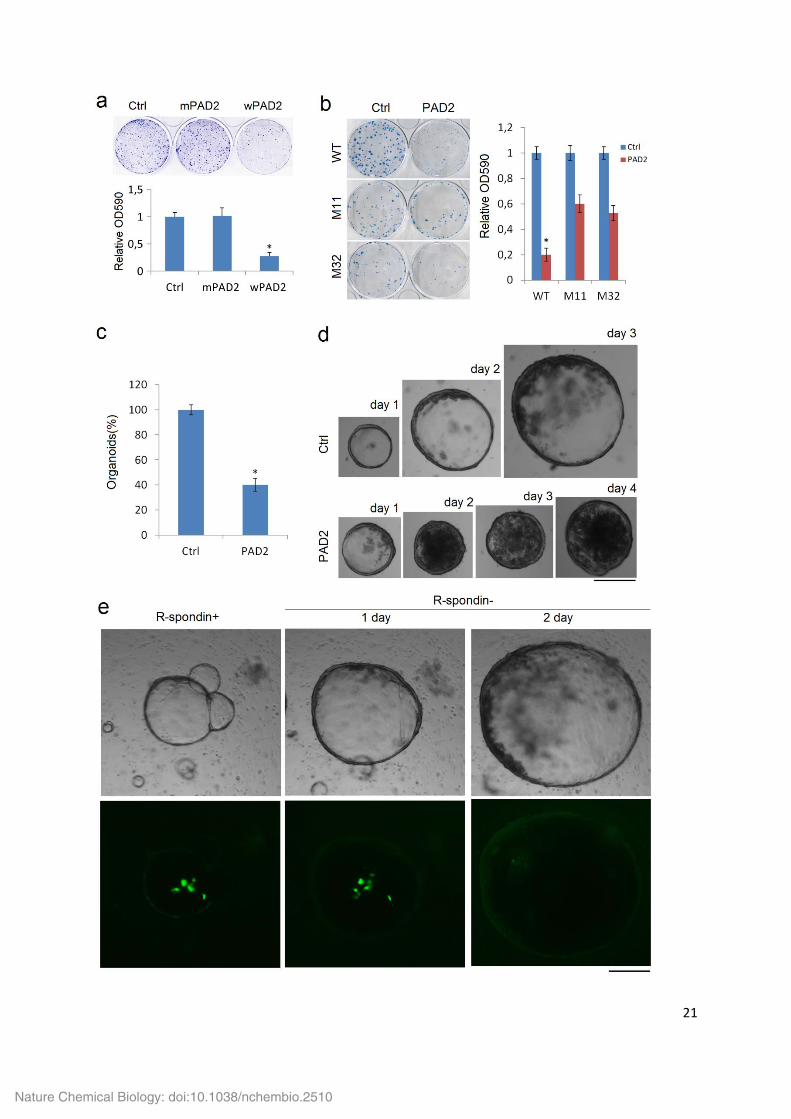
Supplementary Fig. 17. PAD2 inhibits the growth of Wnt activated cells. (a) Representative images of colony formation of SW480 cells with overexpression of wildtype
and mutant PAD2 for 2 weeks. The colony growth was quantified by crystal violet staining
and OD590 nm in 3 independent experiments. *p<0.05. (b) Representative images of colony
formation of HCT116 CTNNB1 deletion clones (M11, M32) overxpressing PAD2 or control
vector for 12 days. The colony growth was quantified by Trypan blue staining and OD590 nm
in 3 independent experiments. (c) Quantitation of sphere formation. Ctnnb1lox(ex3)/lox(ex3)
organoids with overexpression of PAD2 or control vector were dissociated to single cells and
seeded at equal densities, organoids with diameter more than 100 µm were counted 3 days
later. Data show percentage of spheres overexpressing PAD2compared to control in triplicate
experiments. (d) Representative images of the growth of Ctnnb1lox(ex3)/lox(ex3)
organoids with
overexpression of PAD2 or control vector. Scan bar: 200µm. (e) Representative images of
Ctnnb1lox(ex3)/lox(ex3)
organoids with a subpopulation of cells overexpressing GFP-tagged PAD2.
Organoids were grown in complete medium (left) and changed to medium without R-spondin
for one and two days (right). Scale bar: 200µm.
Nature Chemical Biology: doi:10.1038/nchembio.2510
23
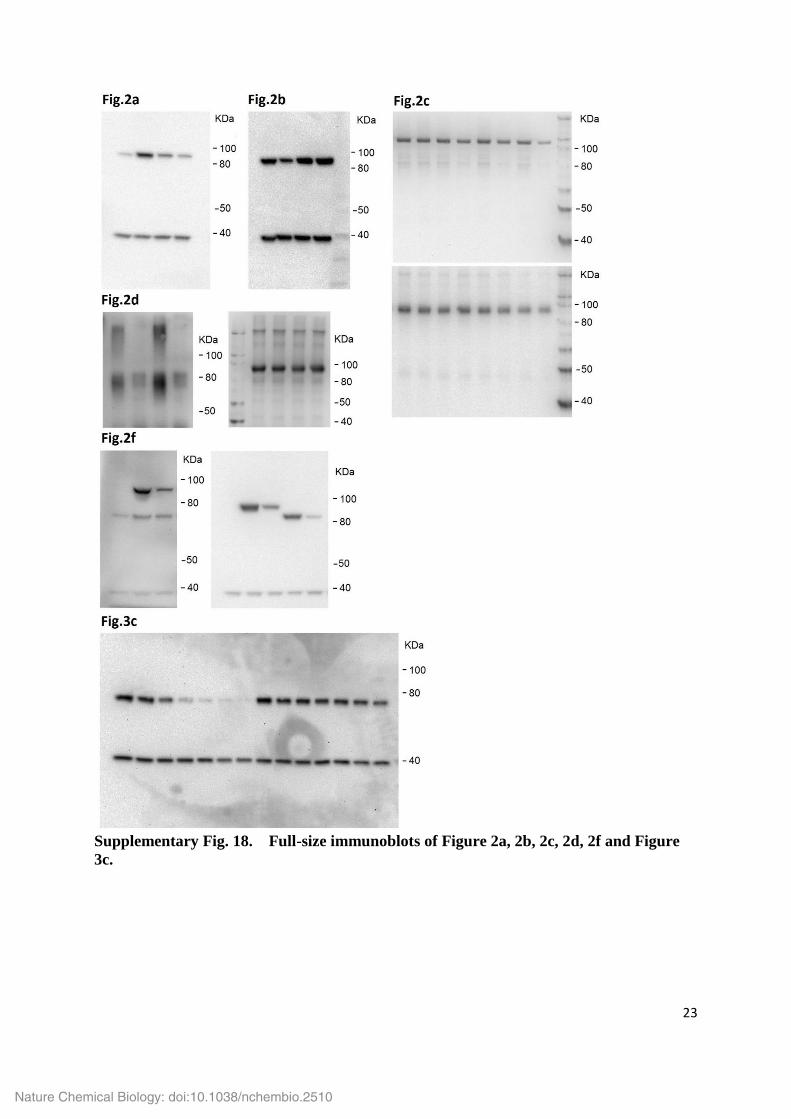
Supplementary Fig. 18. Full-size immunoblots of Figure 2a, 2b, 2c, 2d, 2f and Figure
3c.
Nature Chemical Biology: doi:10.1038/nchembio.2510
24
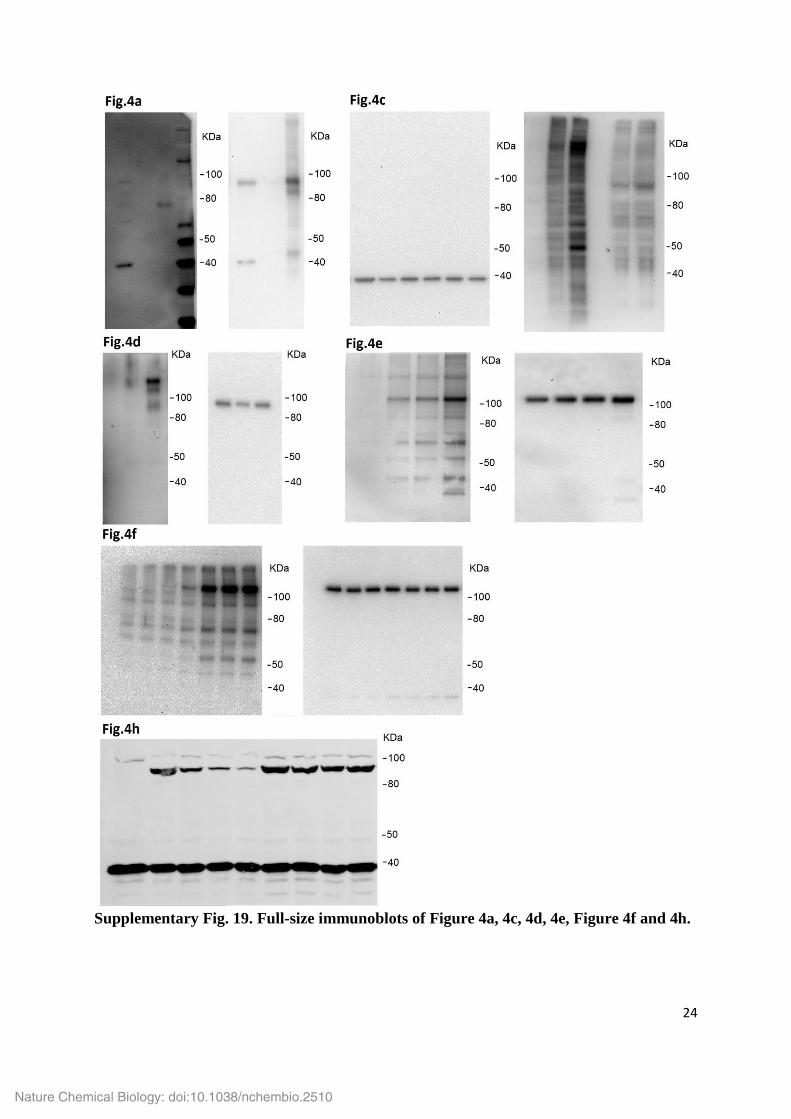
Supplementary Fig. 19. Full-size immunoblots of Figure 4a, 4c, 4d, 4e, Figure 4f and 4h.
Nature Chemical Biology: doi:10.1038/nchembio.2510

25
Supplementary Fig. 20. Full-size immunoblots of Figure 5a, 5b, 5c and 5d.
Nature Chemical Biology: doi:10.1038/nchembio.2510
26
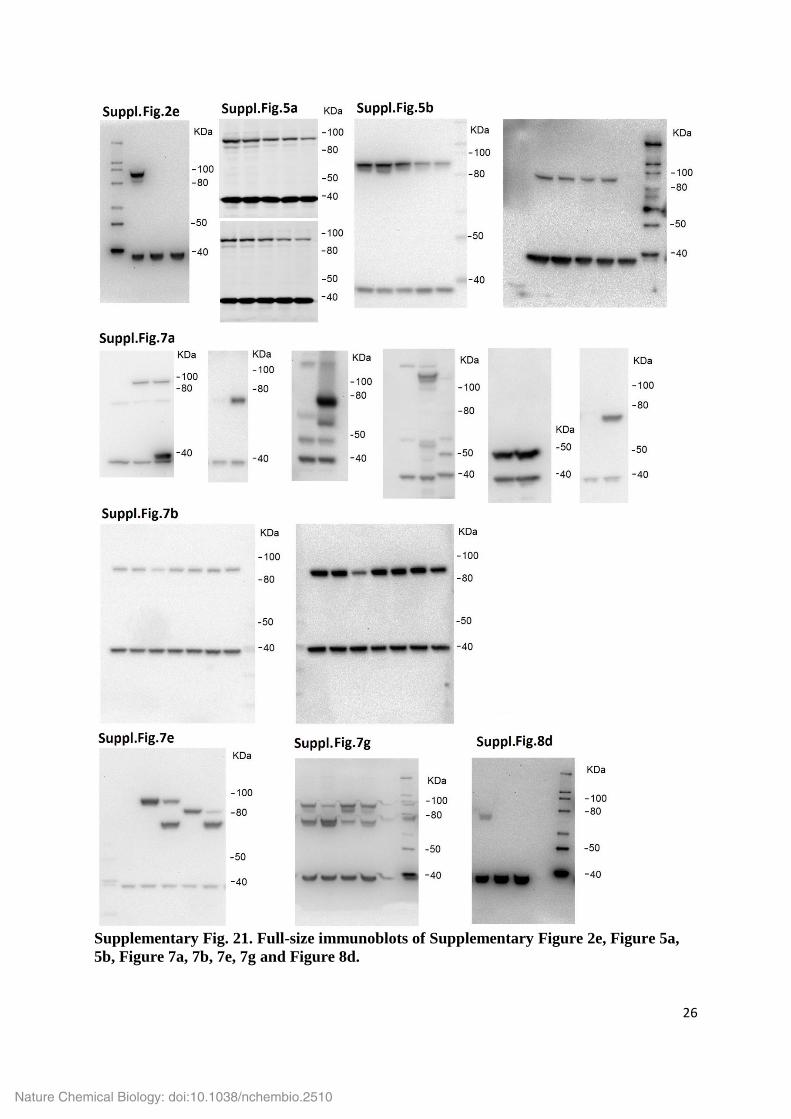
Supplementary Fig. 21. Full-size immunoblots of Supplementary Figure 2e, Figure 5a,
5b, Figure 7a, 7b, 7e, 7g and Figure 8d.
Nature Chemical Biology: doi:10.1038/nchembio.2510

27
Supplementary Fig. 22. Full-size immunoblots of Supplementary Figure 10b, 10c, 10d,
Figure 11d, Figure 12a and 12c.
Nature Chemical Biology: doi:10.1038/nchembio.2510
28
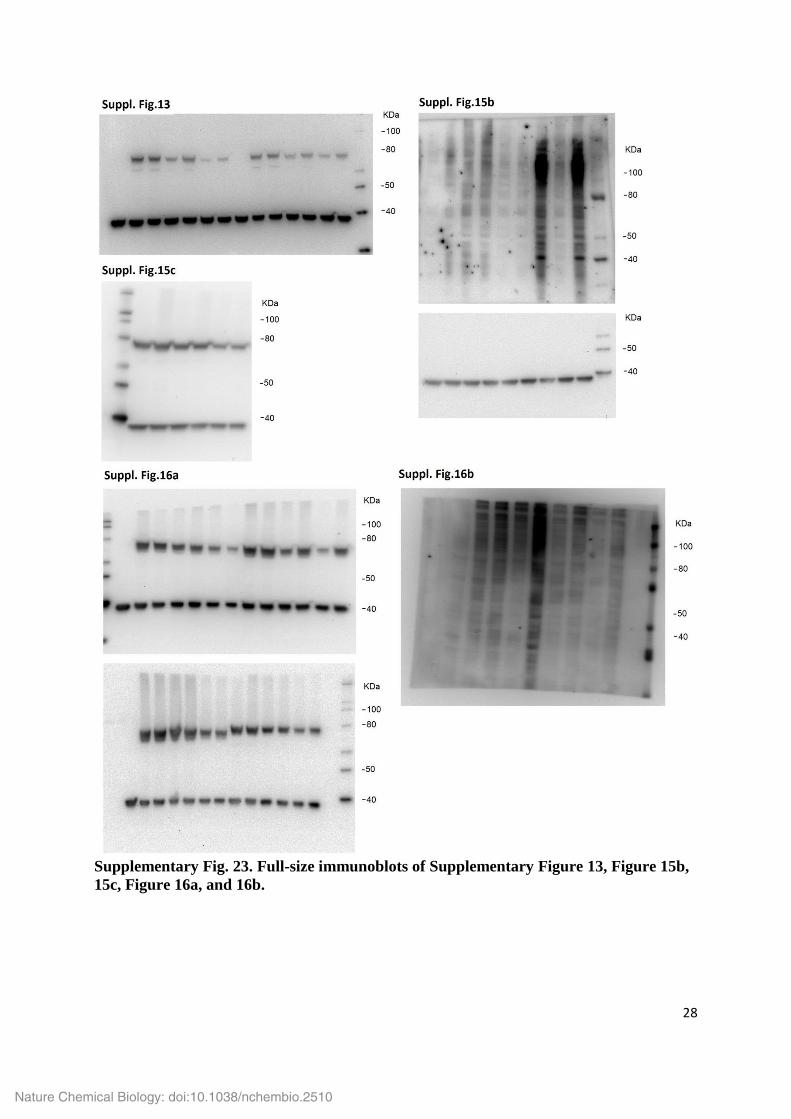
Supplementary Fig. 23. Full-size immunoblots of Supplementary Figure 13, Figure 15b,
15c, Figure 16a, and 16b.
Nature Chemical Biology: doi:10.1038/nchembio.2510
![Electronic Supplementary Information Magnesium β ... · 1 Electronic Supplementary Information Magnesium β-Ketoiminates as CVD Precursors for MgO Formation Elaheh Pousaneh[a], Tobias](https://static.fdocument.org/doc/165x107/60651f68f5d4f347af3c4c60/electronic-supplementary-information-magnesium-1-electronic-supplementary.jpg)