
Supplementary Information - Nature · Supplementary Information Supplementary Figure 1 ... N 1s...
37
1 Supplementary Information Supplementary Figure 1│SEM images of the final mixture after reaction without washing with deionized water (DI) water. The mixture contains the two-dimensional (2D) material (Na 0.55 Mn 2 O 4 ·1.5H 2 O), recrystallized salt (NaNO 3 ) and the byproduct (Na 2 SO 4 ). Scale bar, 3 μm.
Transcript of Supplementary Information - Nature · Supplementary Information Supplementary Figure 1 ... N 1s...

1
Supplementary Information
Supplementary Figure 1│SEM images of the final mixture after reaction without
washing with deionized water (DI) water. The mixture contains the
two-dimensional (2D) material (Na0.55Mn2O4·1.5H2O), recrystallized salt (NaNO3)
and the byproduct (Na2SO4). Scale bar, 3 μm.
2
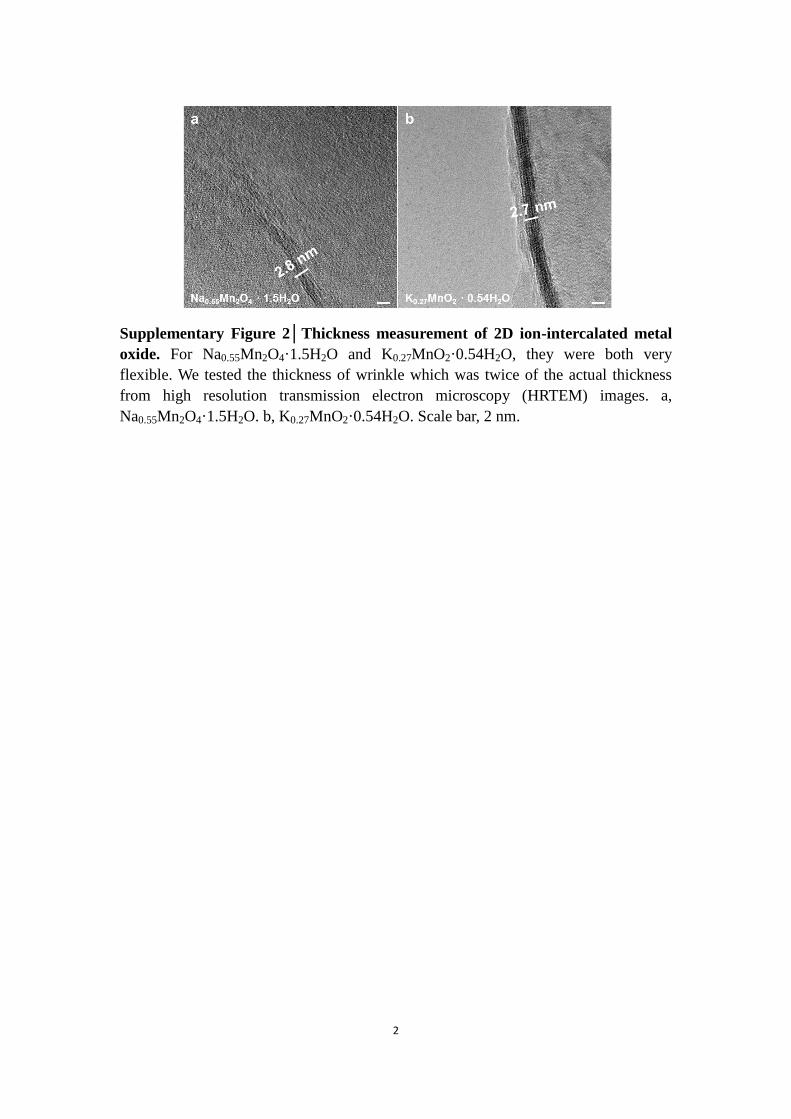
Supplementary Figure 2│Thickness measurement of 2D ion-intercalated metal
oxide. For Na0.55Mn2O4·1.5H2O and K0.27MnO2·0.54H2O, they were both very
flexible. We tested the thickness of wrinkle which was twice of the actual thickness
from high resolution transmission electron microscopy (HRTEM) images. a,
Na0.55Mn2O4·1.5H2O. b, K0.27MnO2·0.54H2O. Scale bar, 2 nm.
3
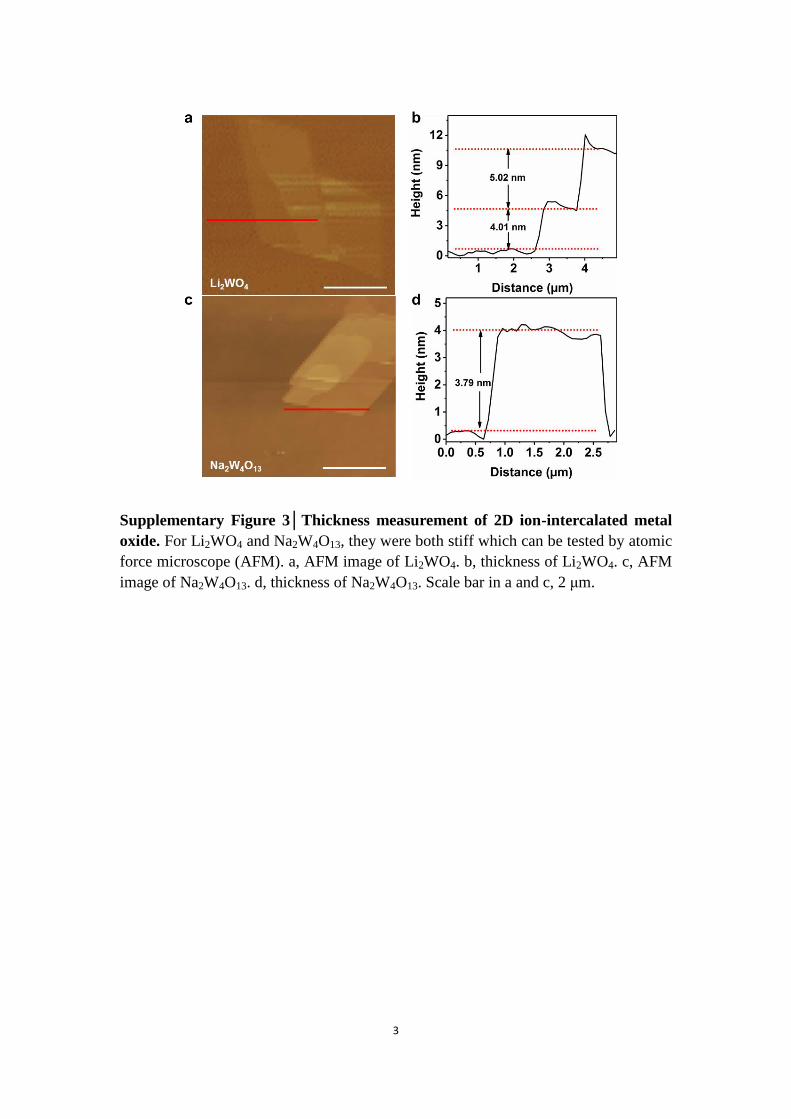
Supplementary Figure 3│Thickness measurement of 2D ion-intercalated metal
oxide. For Li2WO4 and Na2W4O13, they were both stiff which can be tested by atomic
force microscope (AFM). a, AFM image of Li2WO4. b, thickness of Li2WO4. c, AFM
image of Na2W4O13. d, thickness of Na2W4O13. Scale bar in a and c, 2 μm.
4
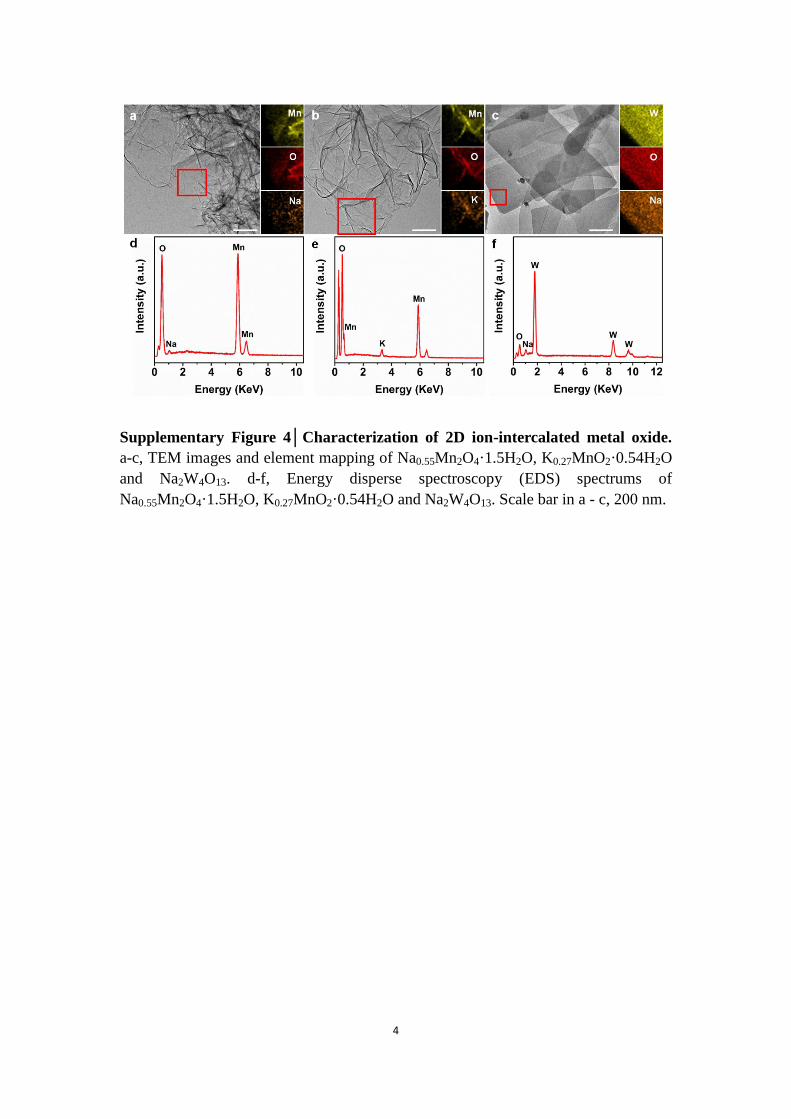
Supplementary Figure 4│Characterization of 2D ion-intercalated metal oxide.
a-c, TEM images and element mapping of Na0.55Mn2O4·1.5H2O, K0.27MnO2·0.54H2O
and Na2W4O13. d-f, Energy disperse spectroscopy (EDS) spectrums of
Na0.55Mn2O4·1.5H2O, K0.27MnO2·0.54H2O and Na2W4O13. Scale bar in a - c, 200 nm.
5
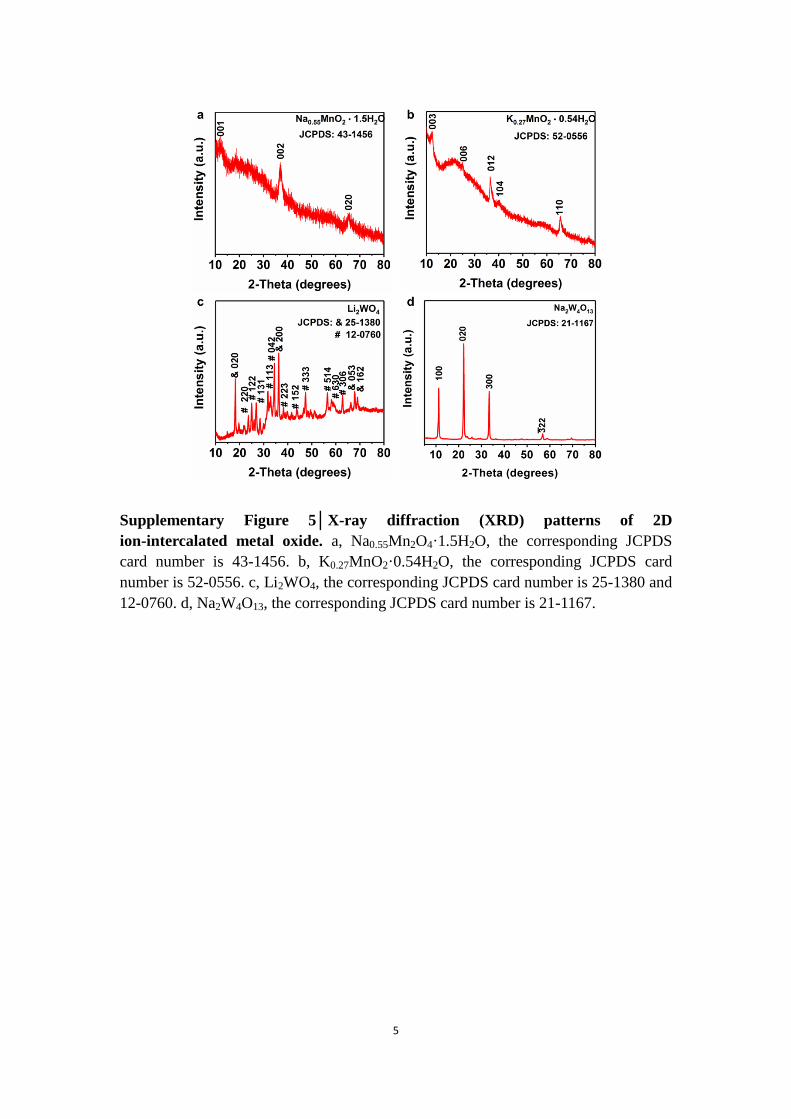
Supplementary Figure 5│X-ray diffraction (XRD) patterns of 2D
ion-intercalated metal oxide. a, Na0.55Mn2O4·1.5H2O, the corresponding JCPDS
card number is 43-1456. b, K0.27MnO2·0.54H2O, the corresponding JCPDS card
number is 52-0556. c, Li2WO4, the corresponding JCPDS card number is 25-1380 and
12-0760. d, Na2W4O13, the corresponding JCPDS card number is 21-1167.
6
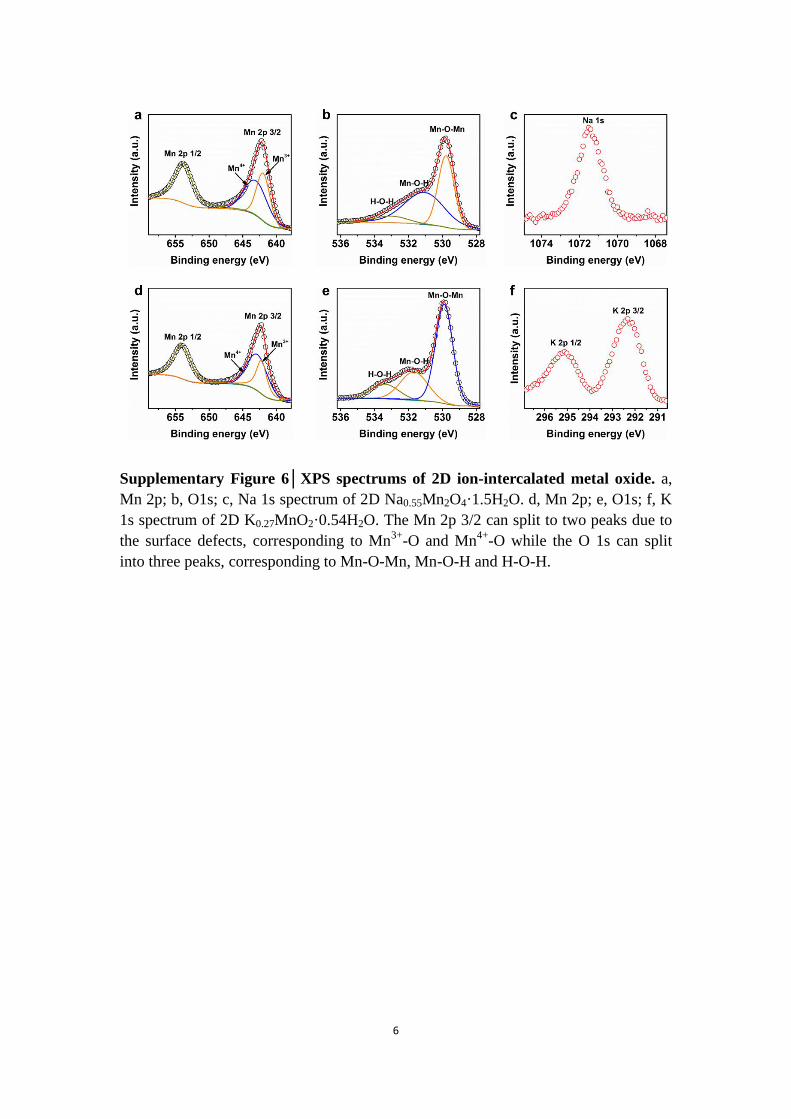
Supplementary Figure 6│XPS spectrums of 2D ion-intercalated metal oxide. a,
Mn 2p; b, O1s; c, Na 1s spectrum of 2D Na0.55Mn2O4·1.5H2O. d, Mn 2p; e, O1s; f, K
1s spectrum of 2D K0.27MnO2·0.54H2O. The Mn 2p 3/2 can split to two peaks due to
the surface defects, corresponding to Mn3+
-O and Mn4+
-O while the O 1s can split
into three peaks, corresponding to Mn-O-Mn, Mn-O-H and H-O-H.
7
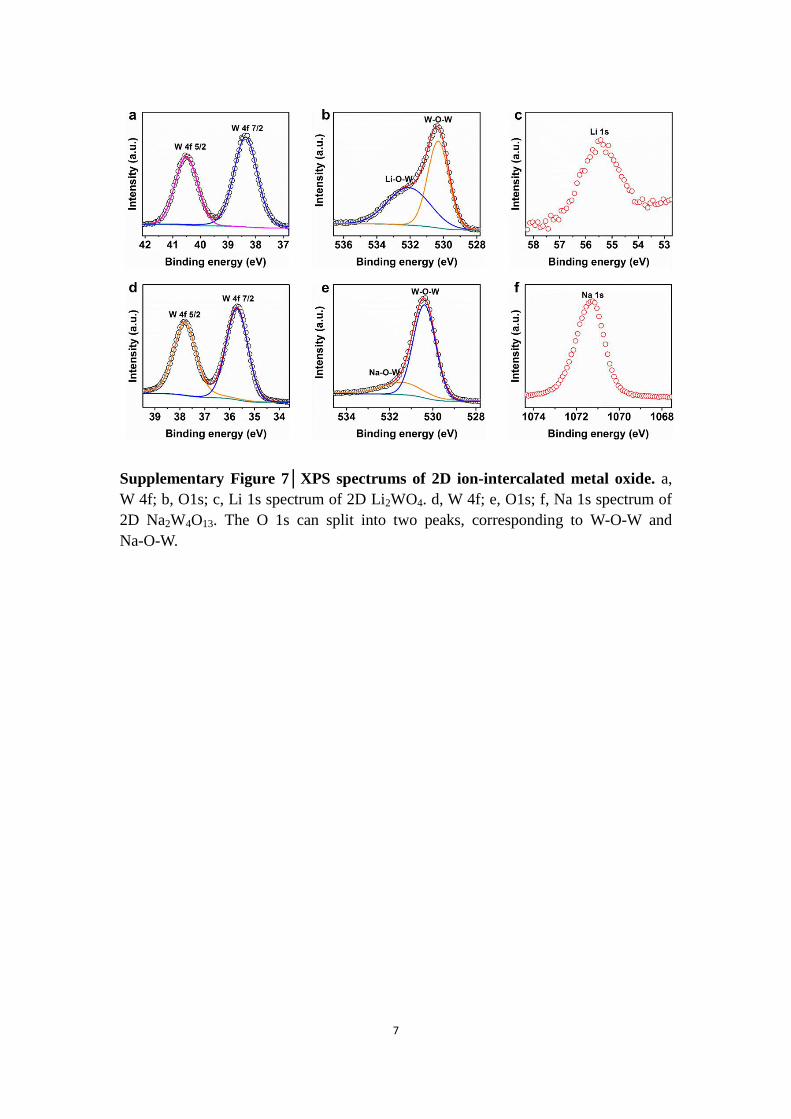
Supplementary Figure 7│XPS spectrums of 2D ion-intercalated metal oxide. a,
W 4f; b, O1s; c, Li 1s spectrum of 2D Li2WO4. d, W 4f; e, O1s; f, Na 1s spectrum of
2D Na2W4O13. The O 1s can split into two peaks, corresponding to W-O-W and
Na-O-W.
8
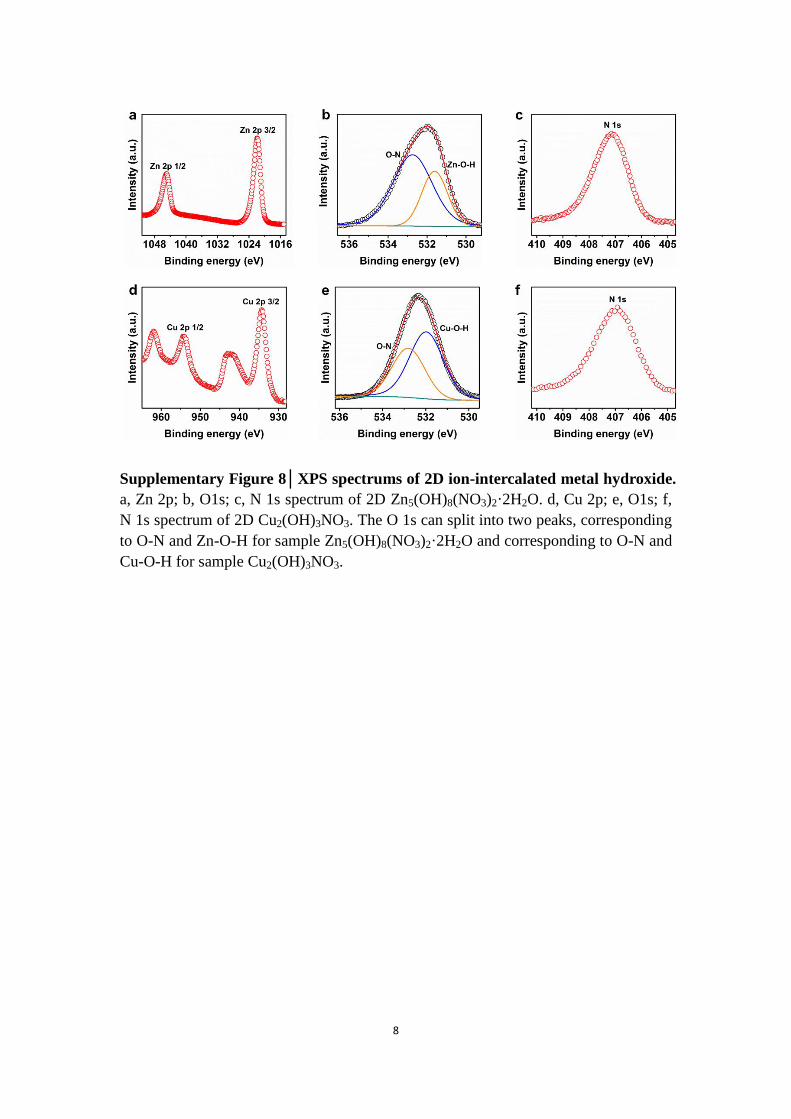
Supplementary Figure 8│XPS spectrums of 2D ion-intercalated metal hydroxide.
a, Zn 2p; b, O1s; c, N 1s spectrum of 2D Zn5(OH)8(NO3)2·2H2O. d, Cu 2p; e, O1s; f,
N 1s spectrum of 2D Cu2(OH)3NO3. The O 1s can split into two peaks, corresponding
to O-N and Zn-O-H for sample Zn5(OH)8(NO3)2·2H2O and corresponding to O-N and
Cu-O-H for sample Cu2(OH)3NO3.
9
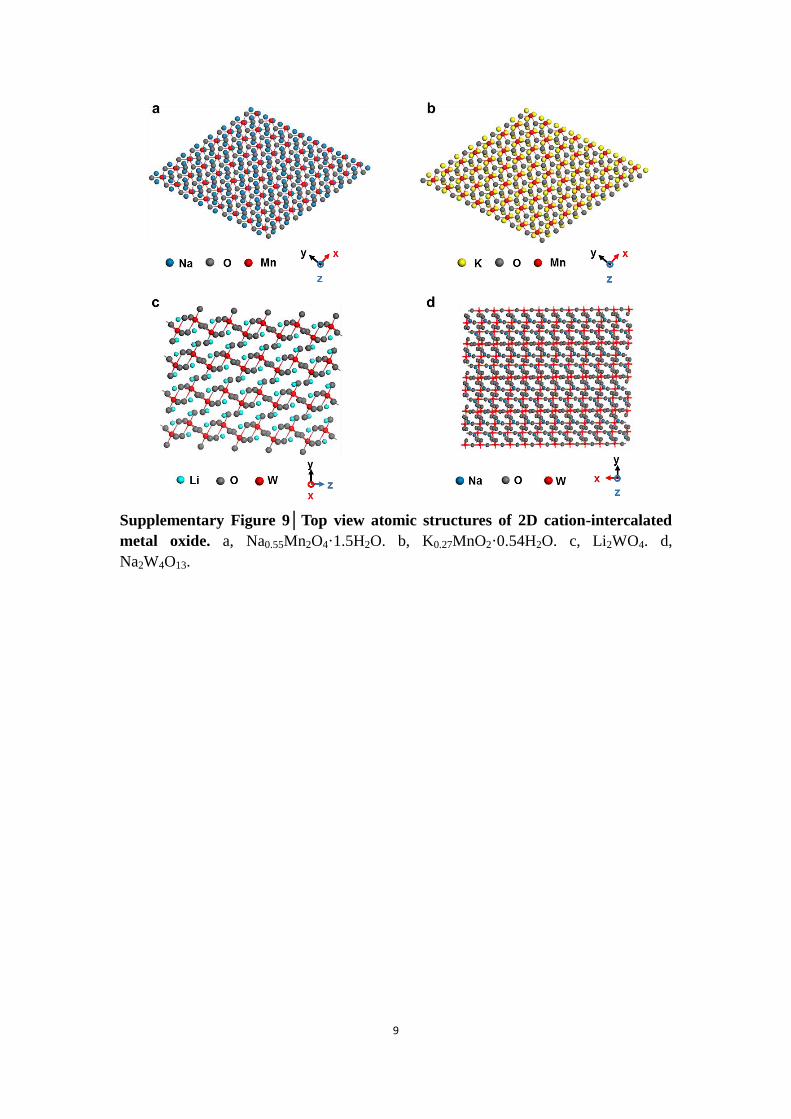
Supplementary Figure 9│Top view atomic structures of 2D cation-intercalated
metal oxide. a, Na0.55Mn2O4·1.5H2O. b, K0.27MnO2·0.54H2O. c, Li2WO4. d,
Na2W4O13.
10
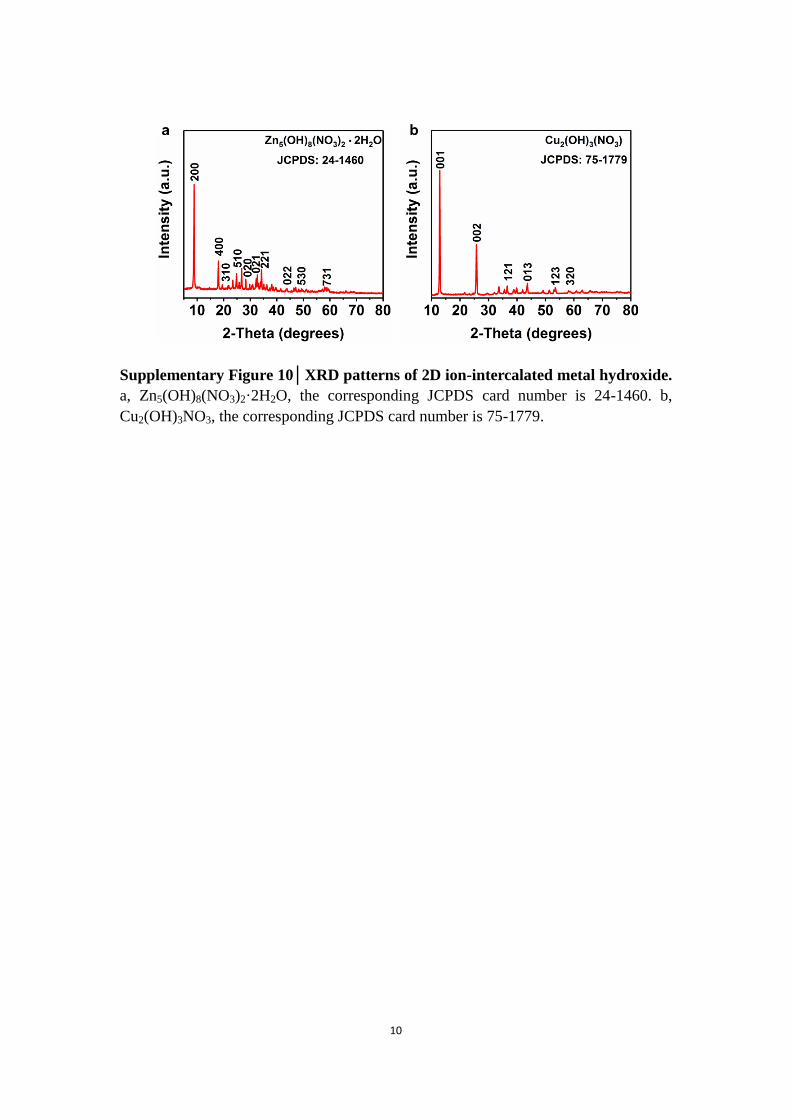
Supplementary Figure 10│XRD patterns of 2D ion-intercalated metal hydroxide.
a, Zn5(OH)8(NO3)2·2H2O, the corresponding JCPDS card number is 24-1460. b,
Cu2(OH)3NO3, the corresponding JCPDS card number is 75-1779.
11
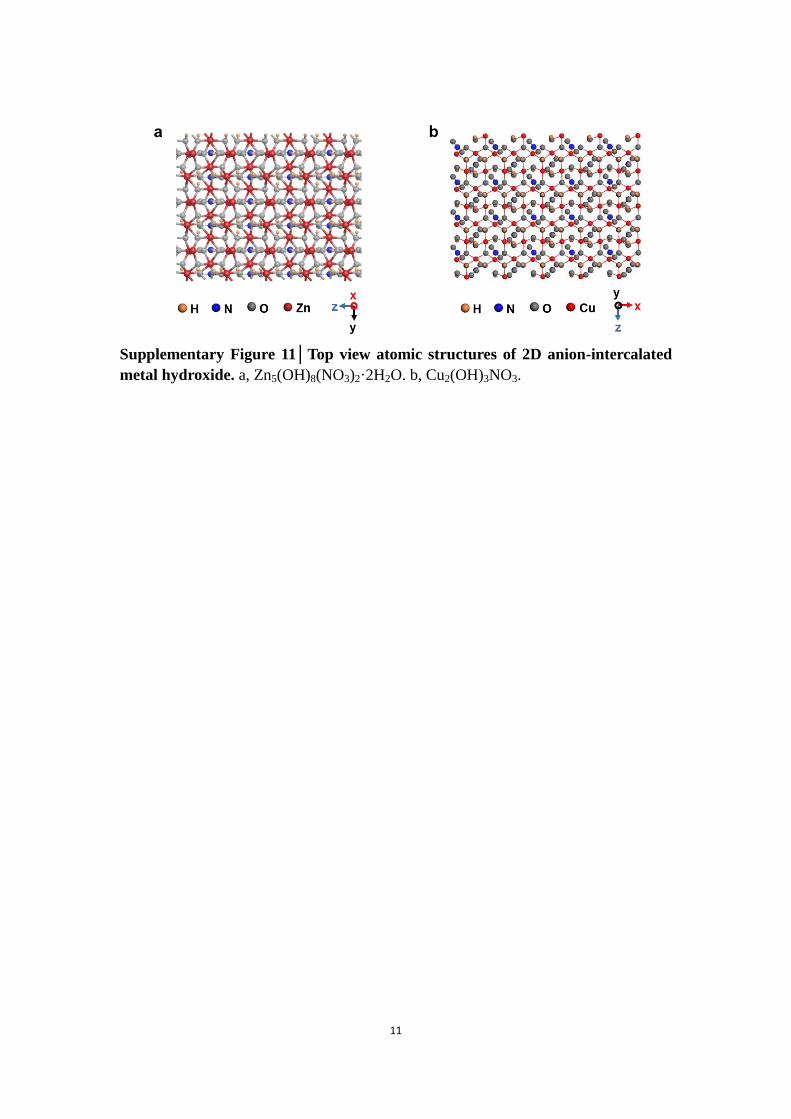
Supplementary Figure 11│Top view atomic structures of 2D anion-intercalated
metal hydroxide. a, Zn5(OH)8(NO3)2·2H2O. b, Cu2(OH)3NO3.
12
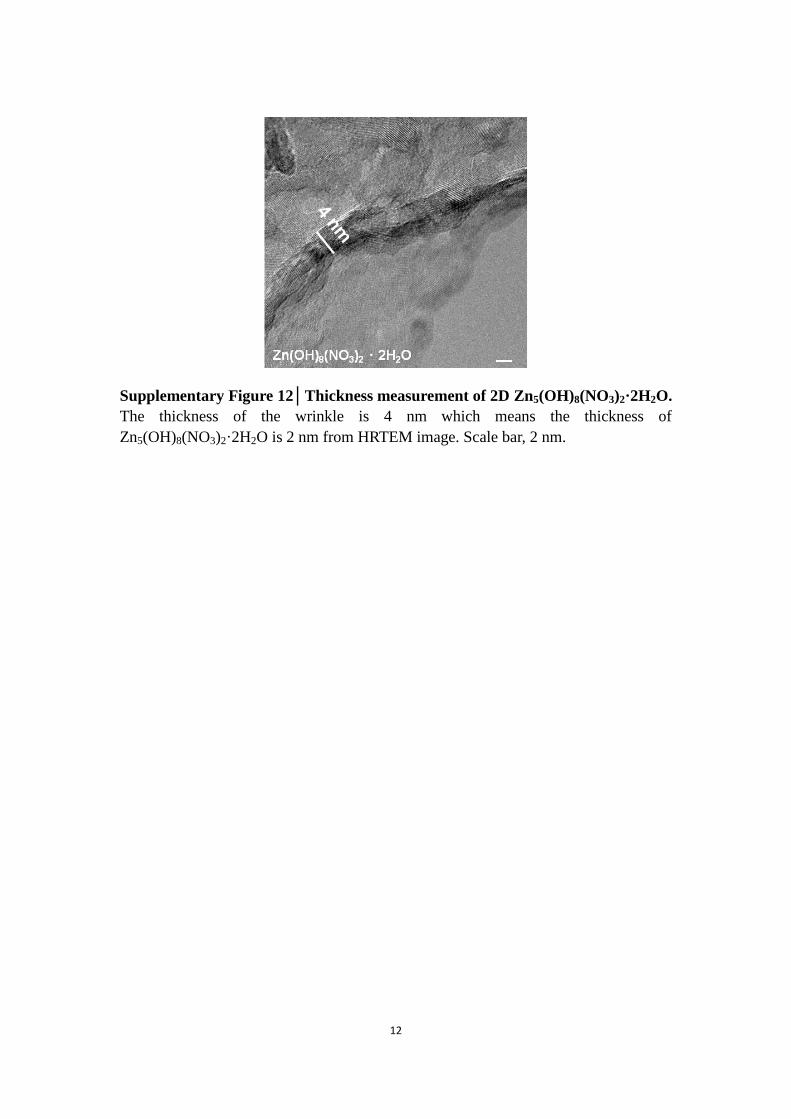
Supplementary Figure 12│Thickness measurement of 2D Zn5(OH)8(NO3)2·2H2O.
The thickness of the wrinkle is 4 nm which means the thickness of
Zn5(OH)8(NO3)2·2H2O is 2 nm from HRTEM image. Scale bar, 2 nm.

13
Supplementary Figure 13│Thickness measurement of 2D Cu2(OH)3NO3 by AFM.
a, AFM image of Cu2(OH)3NO3. b, thickness of Cu2(OH)3NO3. Scale bar in a, 2 μm.
14
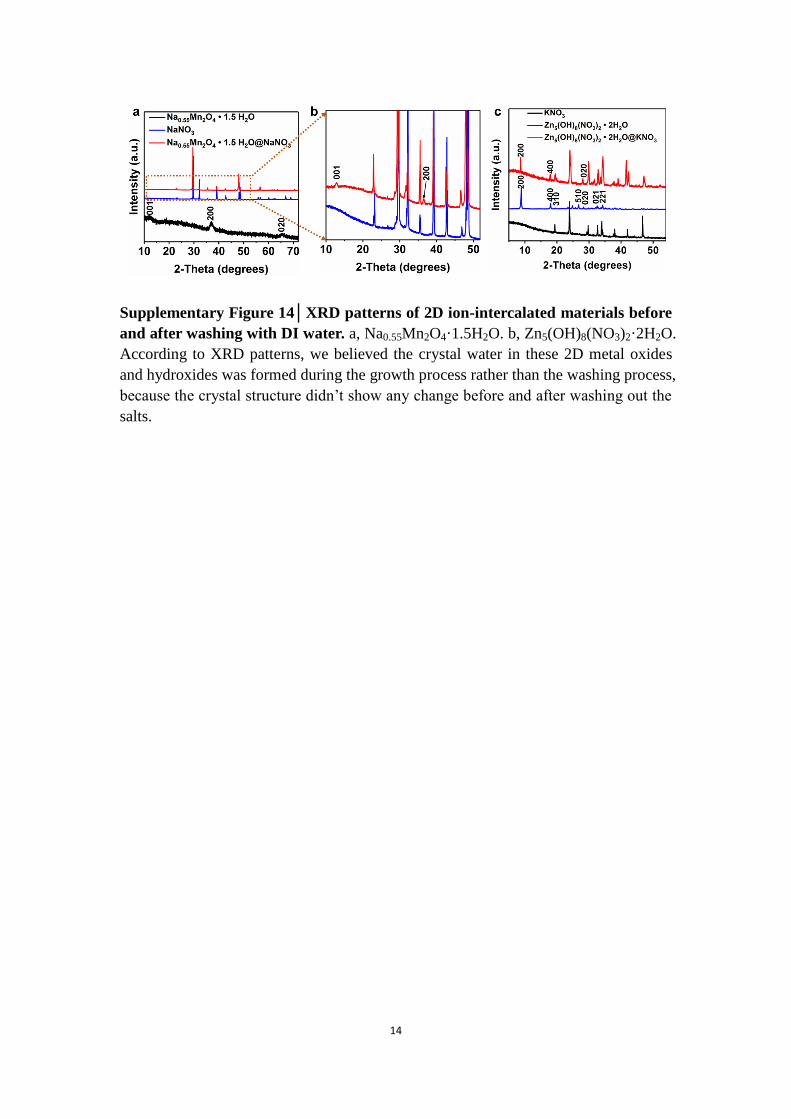
Supplementary Figure 14│XRD patterns of 2D ion-intercalated materials before
and after washing with DI water. a, Na0.55Mn2O4·1.5H2O. b, Zn5(OH)8(NO3)2·2H2O.
According to XRD patterns, we believed the crystal water in these 2D metal oxides
and hydroxides was formed during the growth process rather than the washing process,
because the crystal structure didn’t show any change before and after washing out the
salts.
15
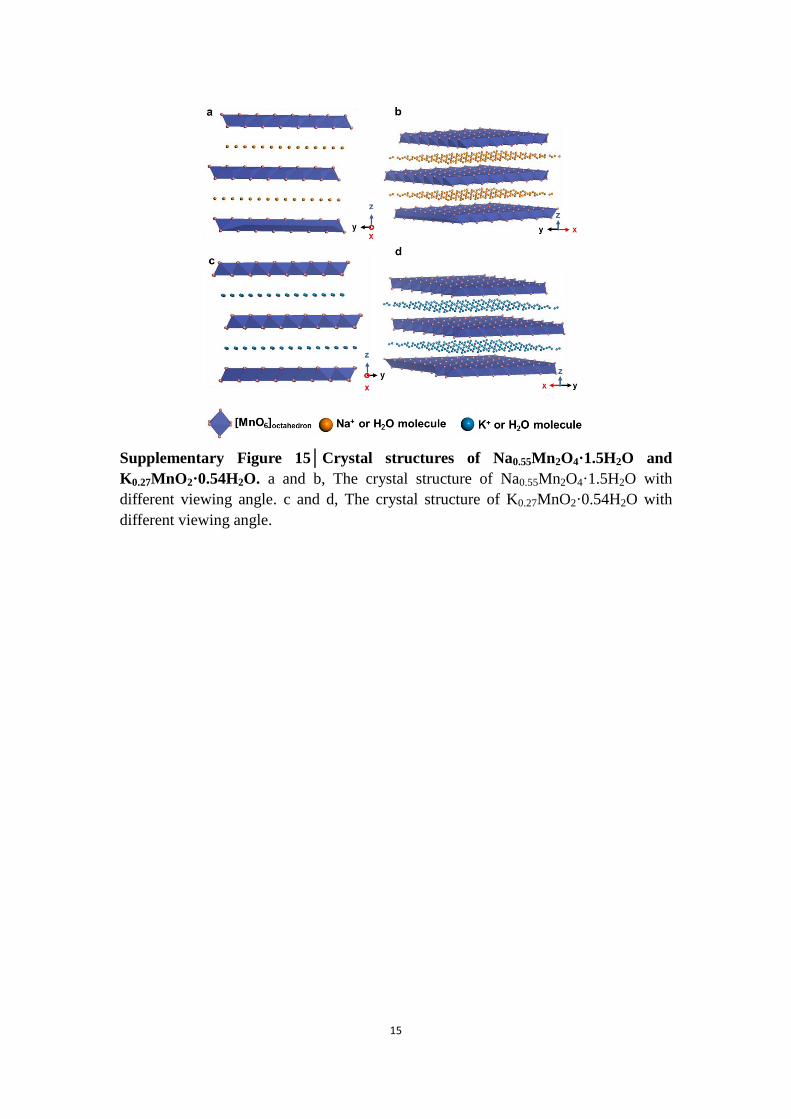
Supplementary Figure 15│Crystal structures of Na0.55Mn2O4·1.5H2O and
K0.27MnO2·0.54H2O. a and b, The crystal structure of Na0.55Mn2O4·1.5H2O with
different viewing angle. c and d, The crystal structure of K0.27MnO2·0.54H2O with
different viewing angle.
16
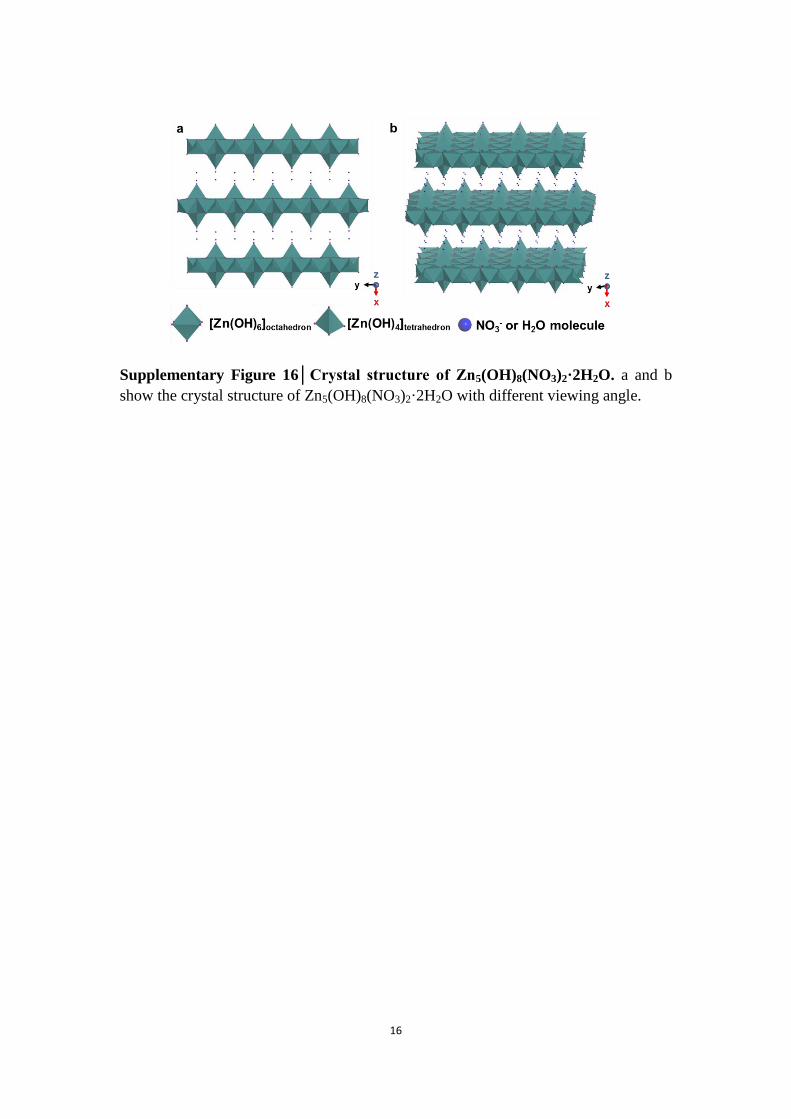
Supplementary Figure 16│Crystal structure of Zn5(OH)8(NO3)2·2H2O. a and b
show the crystal structure of Zn5(OH)8(NO3)2·2H2O with different viewing angle.
17
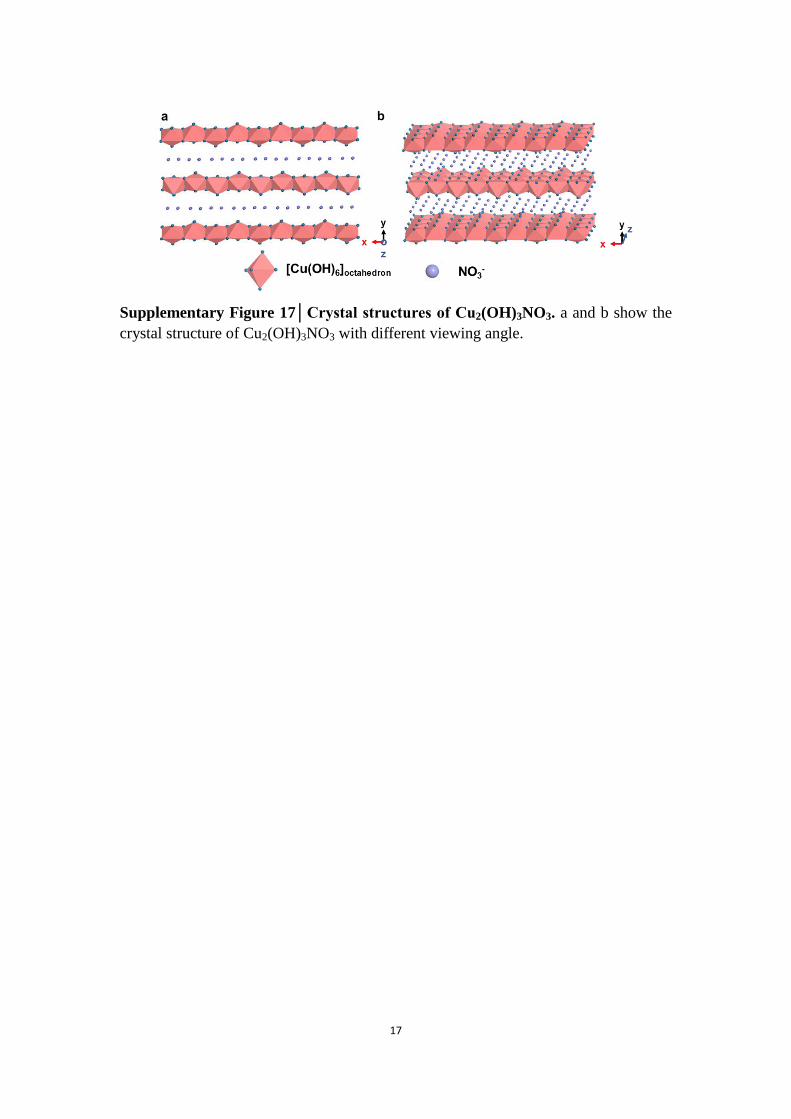
Supplementary Figure 17│Crystal structures of Cu2(OH)3NO3. a and b show the
crystal structure of Cu2(OH)3NO3 with different viewing angle.

18
Supplementary Figure 18│Morphology and structure information of manganese
oxides. a, TEM image of δ-MnO2 as the reaction time prolonging to 10 minutes. b,
XRD pattern of δ-MnO2 as the reaction time prolonging to 10 minutes, the
corresponding JCPDS card number is 52-0556. Scale bar, 200 nm.
19
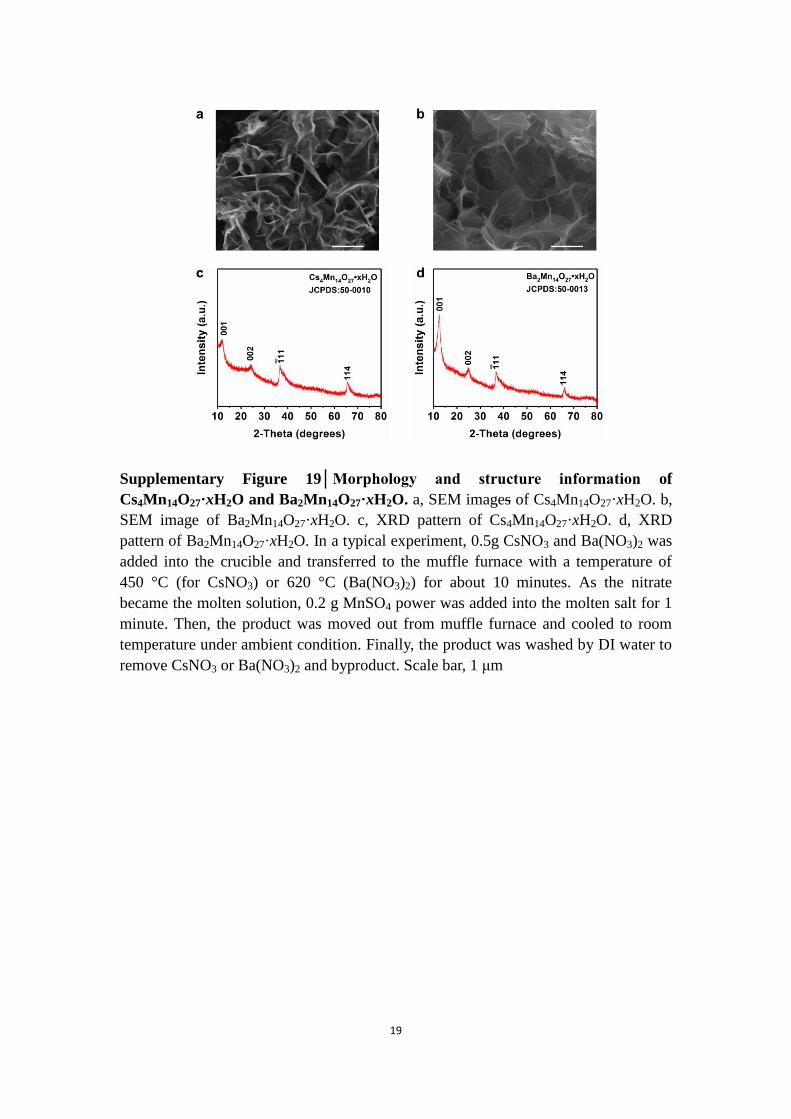
Supplementary Figure 19│Morphology and structure information of
Cs4Mn14O27·xH2O and Ba2Mn14O27·xH2O. a, SEM images of Cs4Mn14O27·xH2O. b,
SEM image of Ba2Mn14O27·xH2O. c, XRD pattern of Cs4Mn14O27·xH2O. d, XRD
pattern of Ba2Mn14O27·xH2O. In a typical experiment, 0.5g CsNO3 and Ba(NO3)2 was
added into the crucible and transferred to the muffle furnace with a temperature of
450 °C (for CsNO3) or 620 °C (Ba(NO3)2) for about 10 minutes. As the nitrate
became the molten solution, 0.2 g MnSO4 power was added into the molten salt for 1
minute. Then, the product was moved out from muffle furnace and cooled to room
temperature under ambient condition. Finally, the product was washed by DI water to
remove CsNO3 or Ba(NO3)2 and byproduct. Scale bar, 1 μm
20
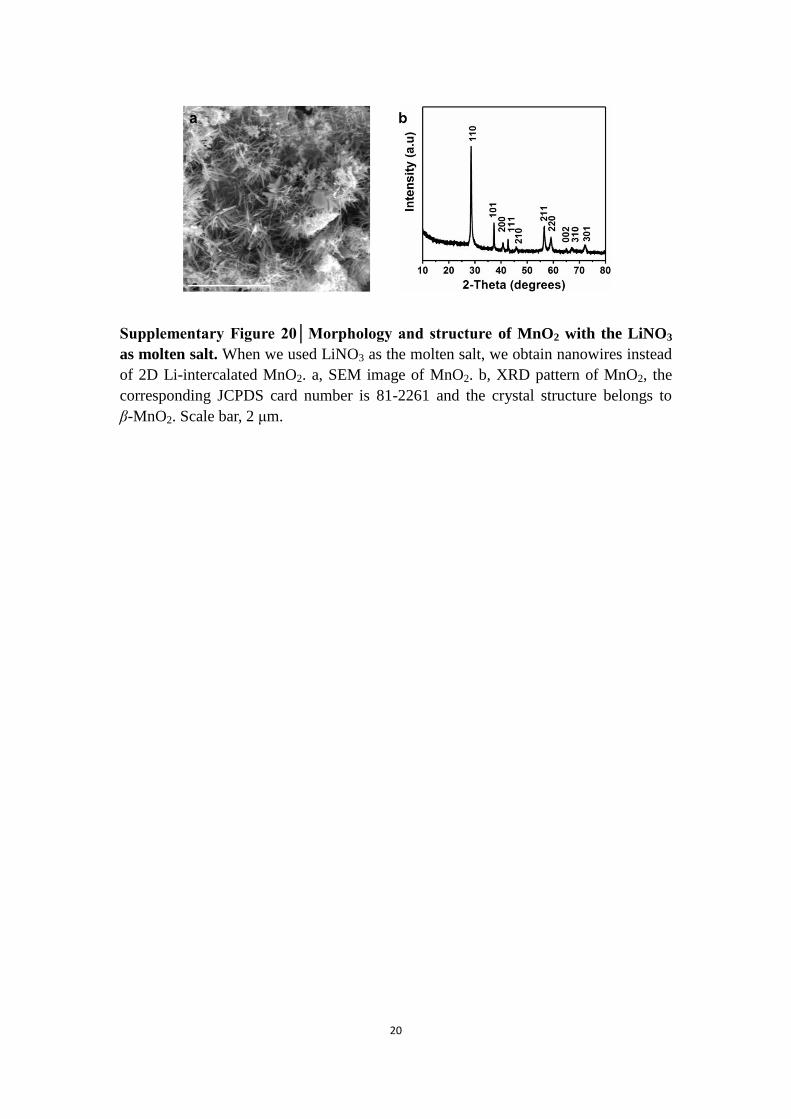
Supplementary Figure 20│Morphology and structure of MnO2 with the LiNO3
as molten salt. When we used LiNO3 as the molten salt, we obtain nanowires instead
of 2D Li-intercalated MnO2. a, SEM image of MnO2. b, XRD pattern of MnO2, the
corresponding JCPDS card number is 81-2261 and the crystal structure belongs to
β-MnO2. Scale bar, 2 μm.
21
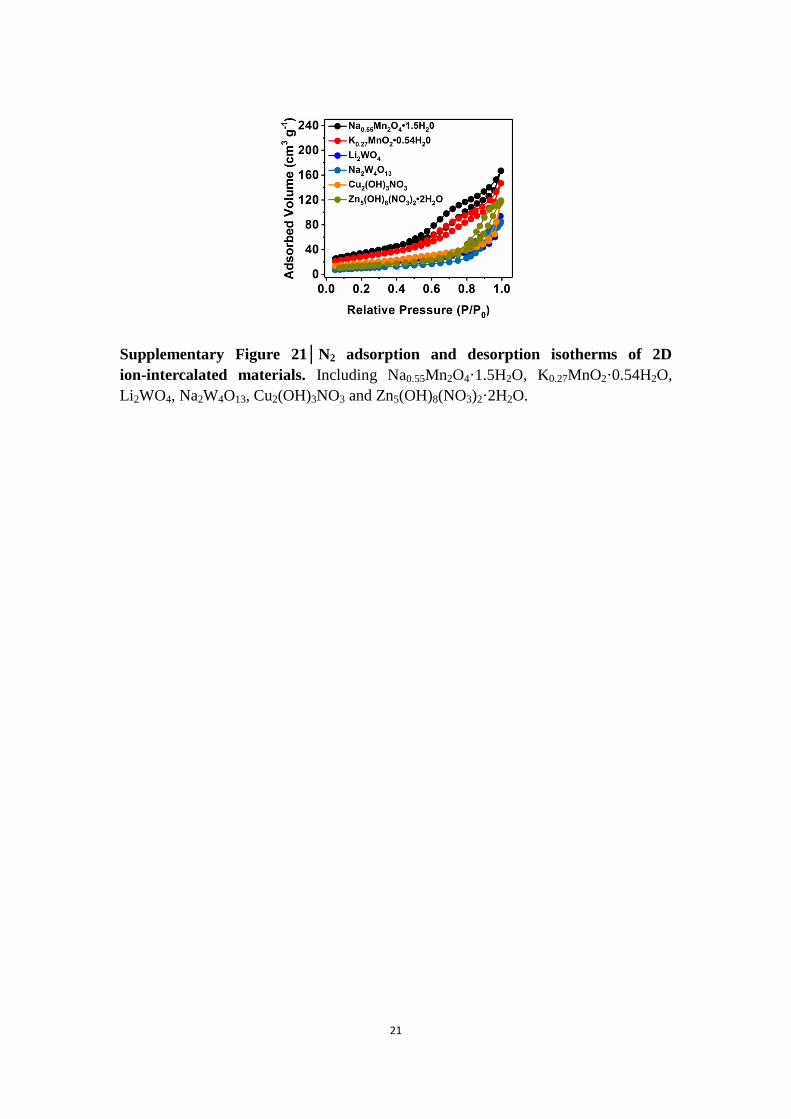
Supplementary Figure 21│N2 adsorption and desorption isotherms of 2D
ion-intercalated materials. Including Na0.55Mn2O4·1.5H2O, K0.27MnO2·0.54H2O,
Li2WO4, Na2W4O13, Cu2(OH)3NO3 and Zn5(OH)8(NO3)2·2H2O.
22
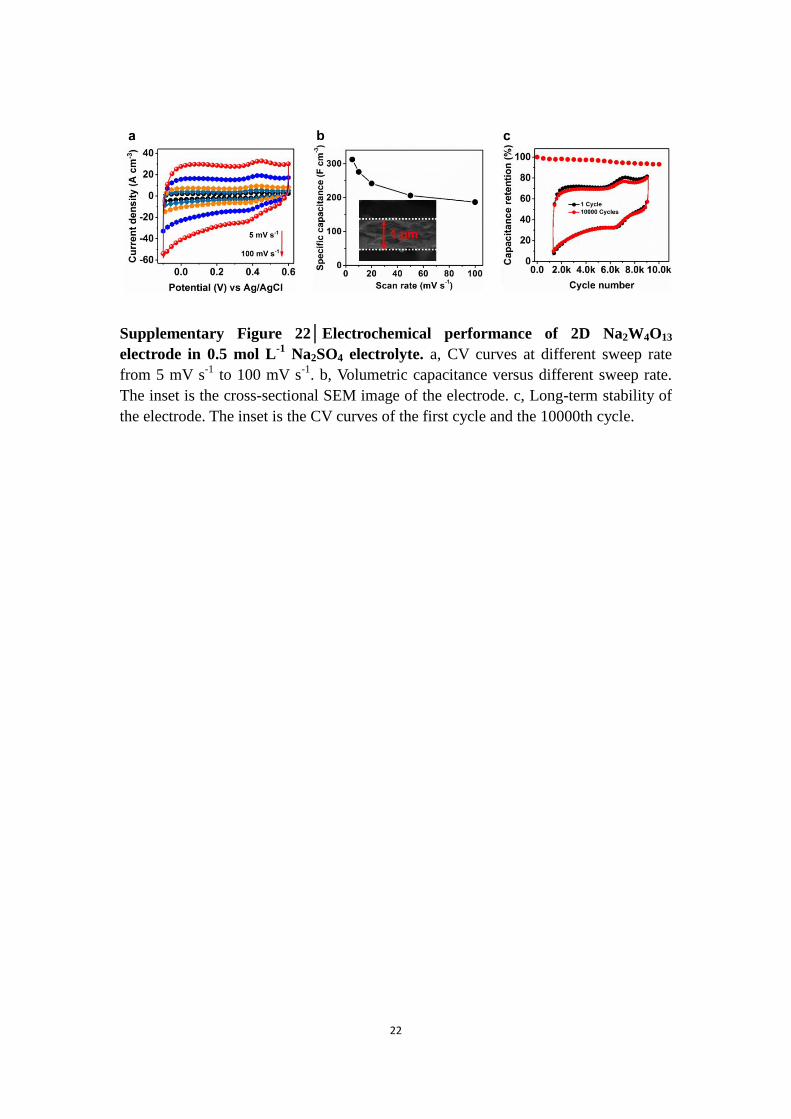
Supplementary Figure 22│Electrochemical performance of 2D Na2W4O13
electrode in 0.5 mol L-1
Na2SO4 electrolyte. a, CV curves at different sweep rate
from 5 mV s-1
to 100 mV s-1
. b, Volumetric capacitance versus different sweep rate.
The inset is the cross-sectional SEM image of the electrode. c, Long-term stability of
the electrode. The inset is the CV curves of the first cycle and the 10000th cycle.
23
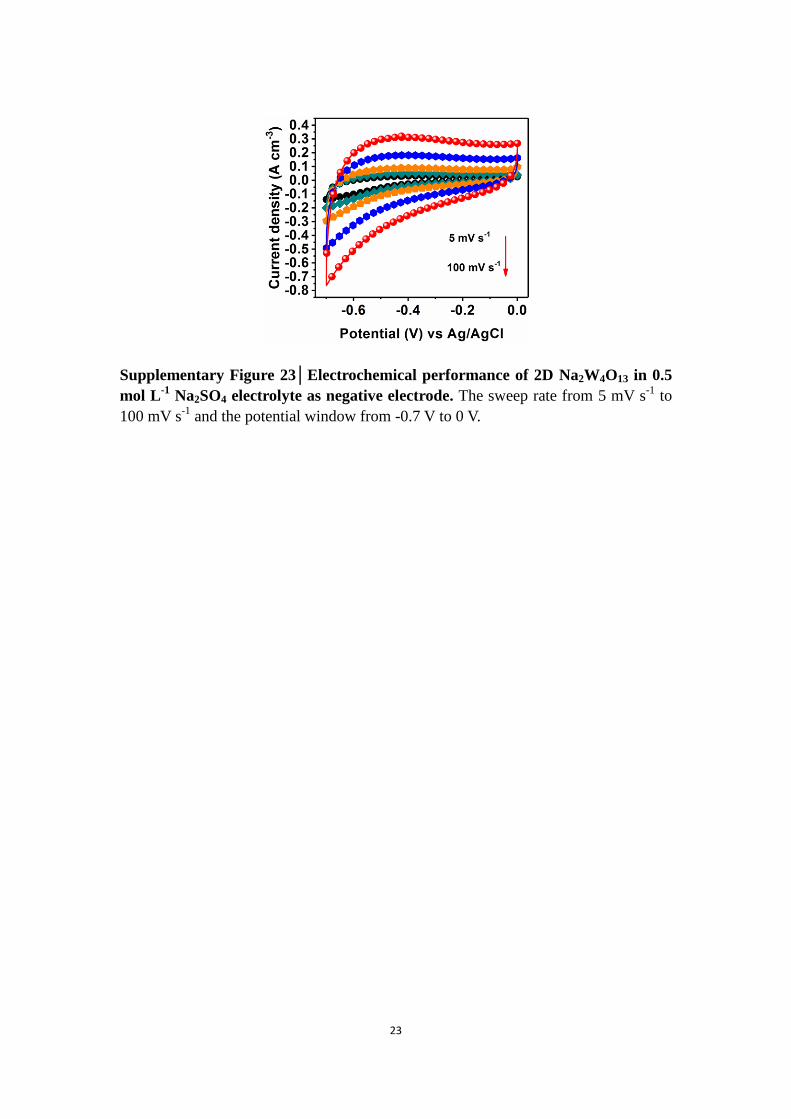
Supplementary Figure 23│Electrochemical performance of 2D Na2W4O13 in 0.5
mol L-1
Na2SO4 electrolyte as negative electrode. The sweep rate from 5 mV s-1
to
100 mV s-1
and the potential window from -0.7 V to 0 V.
24
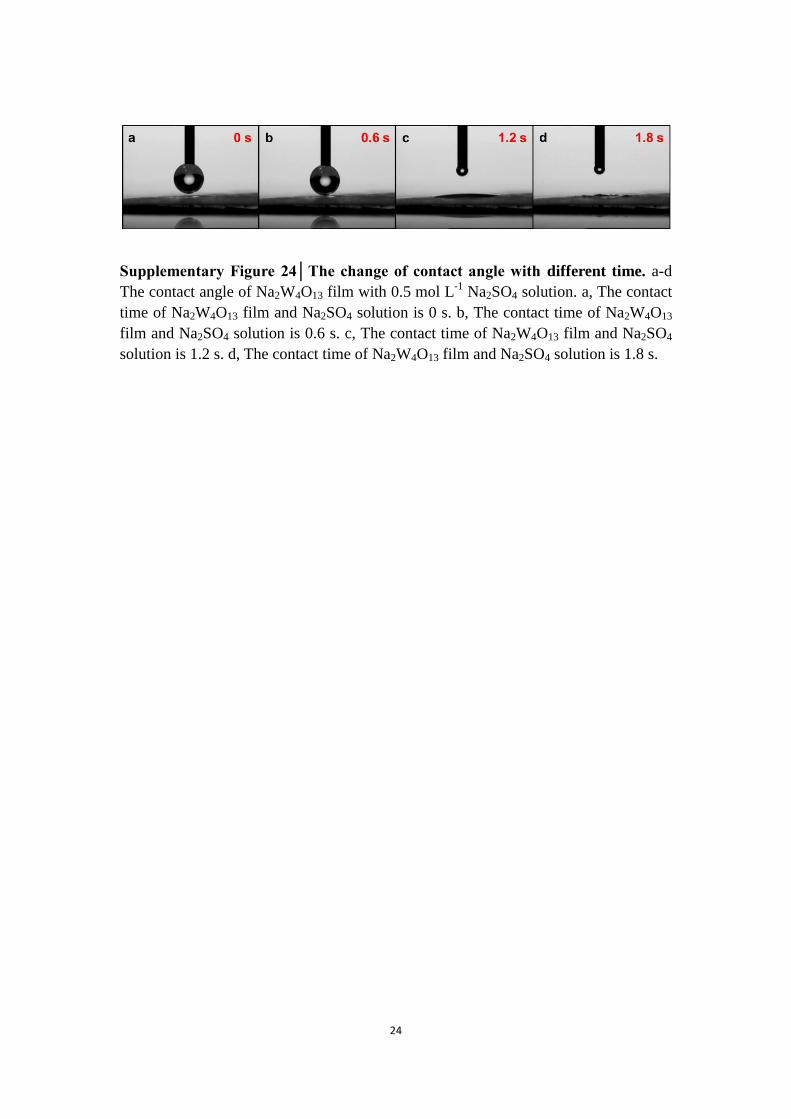
Supplementary Figure 24│The change of contact angle with different time. a-d
The contact angle of Na2W4O13 film with 0.5 mol L-1
Na2SO4 solution. a, The contact
time of Na2W4O13 film and Na2SO4 solution is 0 s. b, The contact time of Na2W4O13
film and Na2SO4 solution is 0.6 s. c, The contact time of Na2W4O13 film and Na2SO4
solution is 1.2 s. d, The contact time of Na2W4O13 film and Na2SO4 solution is 1.8 s.
25
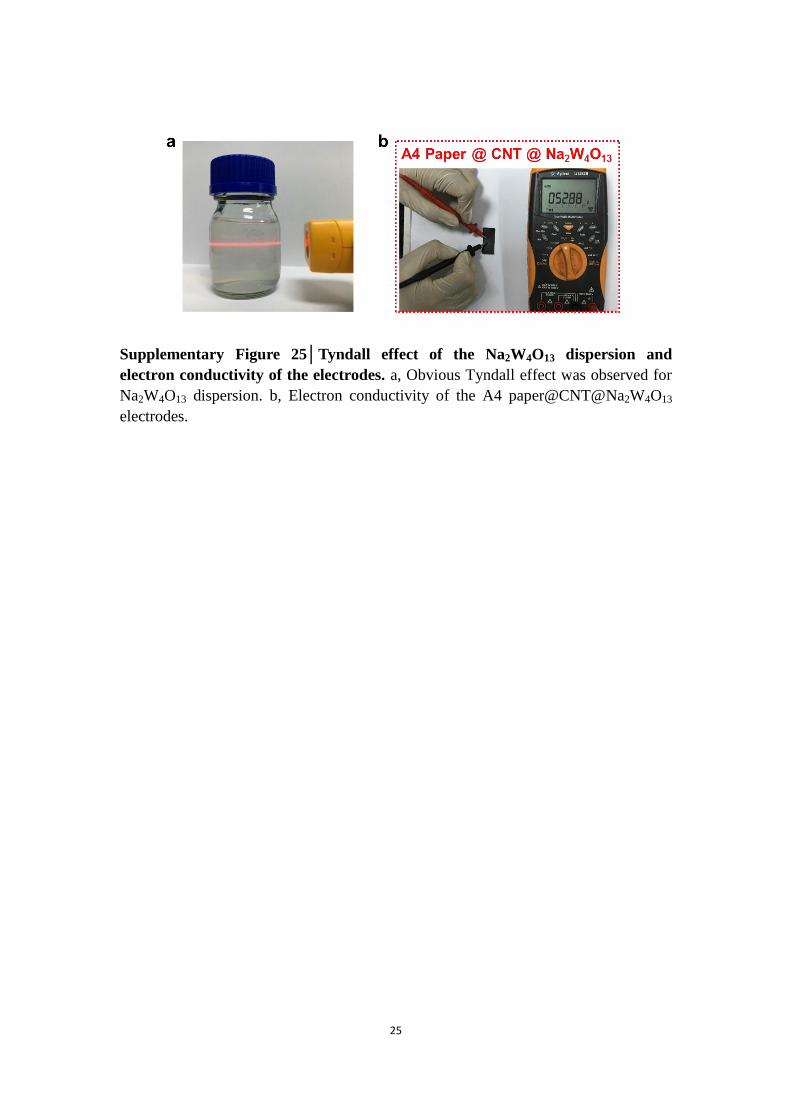
Supplementary Figure 25│Tyndall effect of the Na2W4O13 dispersion and
electron conductivity of the electrodes. a, Obvious Tyndall effect was observed for
Na2W4O13 dispersion. b, Electron conductivity of the A4 paper@CNT@Na2W4O13
electrodes.
26
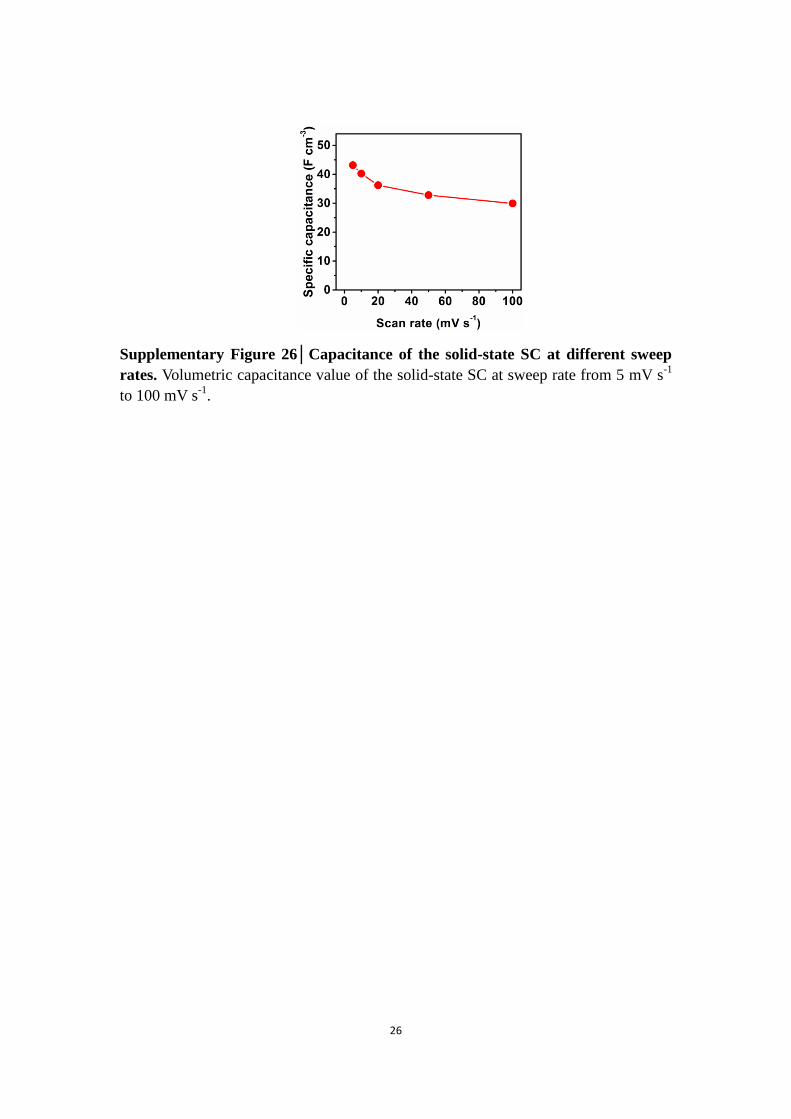
Supplementary Figure 26│Capacitance of the solid-state SC at different sweep
rates. Volumetric capacitance value of the solid-state SC at sweep rate from 5 mV s-1
to 100 mV s-1
.
27
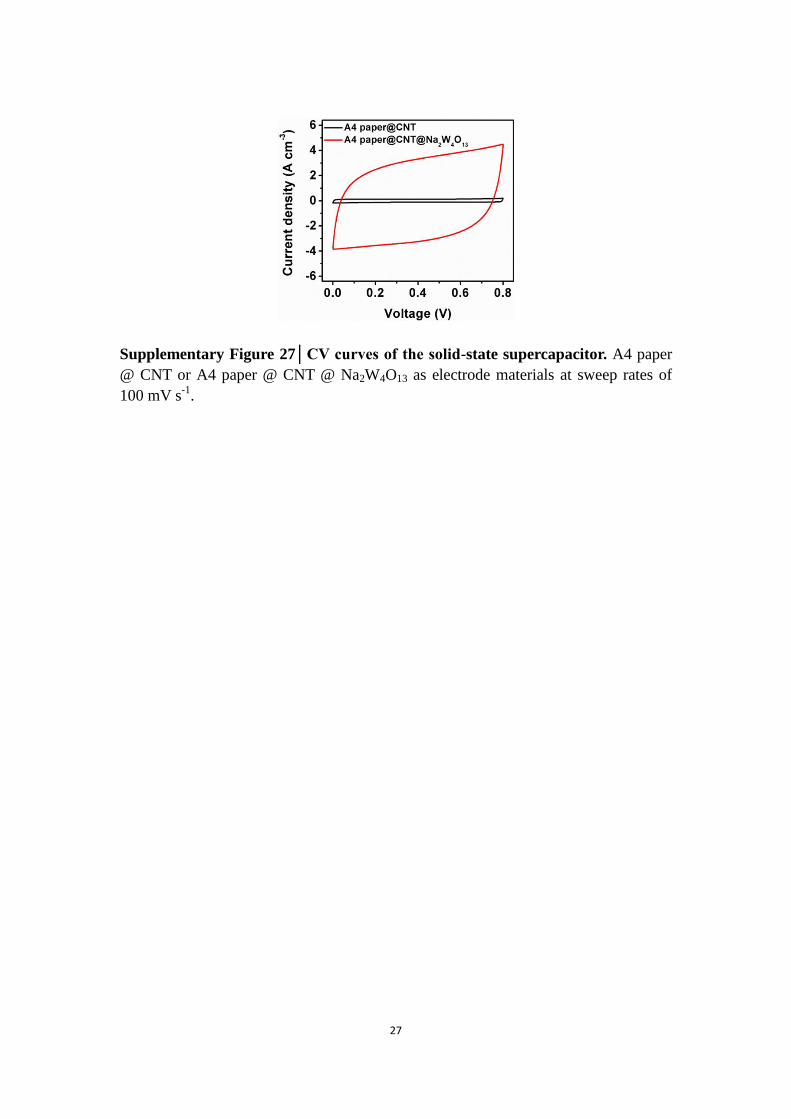
Supplementary Figure 27│CV curves of the solid-state supercapacitor. A4 paper
@ CNT or A4 paper @ CNT @ Na2W4O13 as electrode materials at sweep rates of
100 mV s-1
.
28
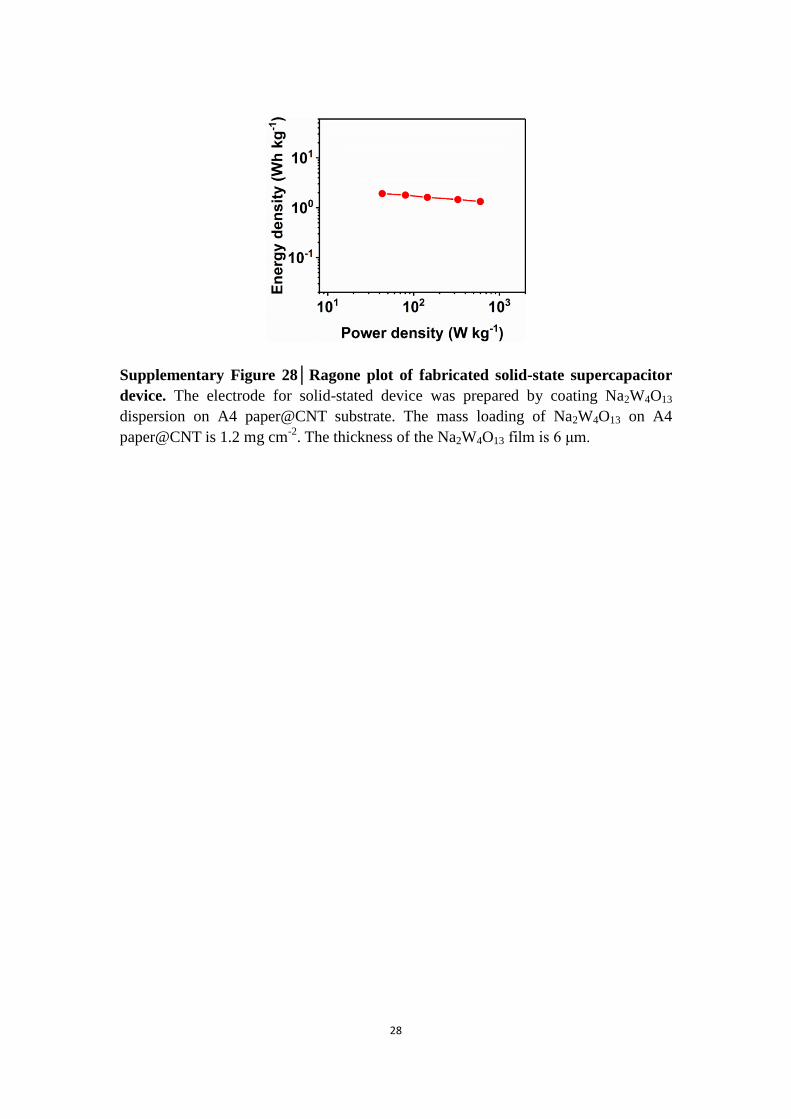
Supplementary Figure 28│Ragone plot of fabricated solid-state supercapacitor
device. The electrode for solid-stated device was prepared by coating Na2W4O13
dispersion on A4 paper@CNT substrate. The mass loading of Na2W4O13 on A4
paper@CNT is 1.2 mg cm-2
. The thickness of the Na2W4O13 film is 6 μm.
29
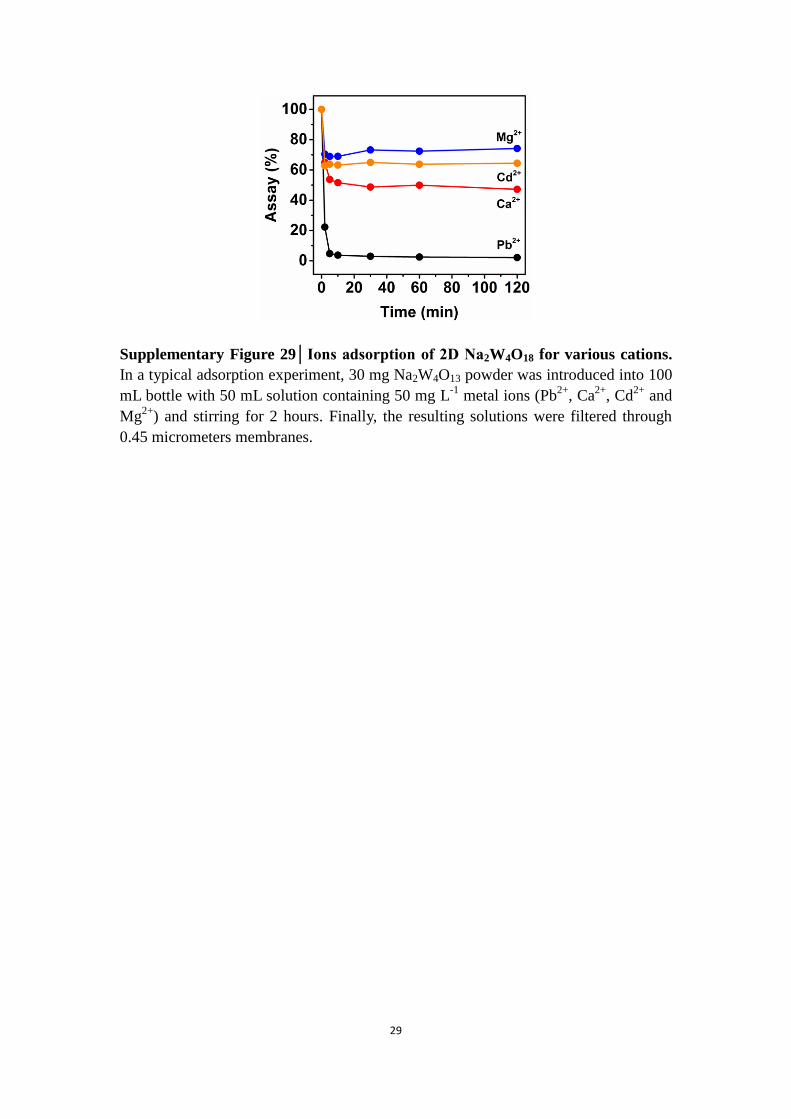
Supplementary Figure 29│Ions adsorption of 2D Na2W4O18 for various cations.
In a typical adsorption experiment, 30 mg Na2W4O13 powder was introduced into 100
mL bottle with 50 mL solution containing 50 mg L-1
metal ions (Pb2+
, Ca2+
, Cd2+
and
Mg2+
) and stirring for 2 hours. Finally, the resulting solutions were filtered through
0.45 micrometers membranes.
30
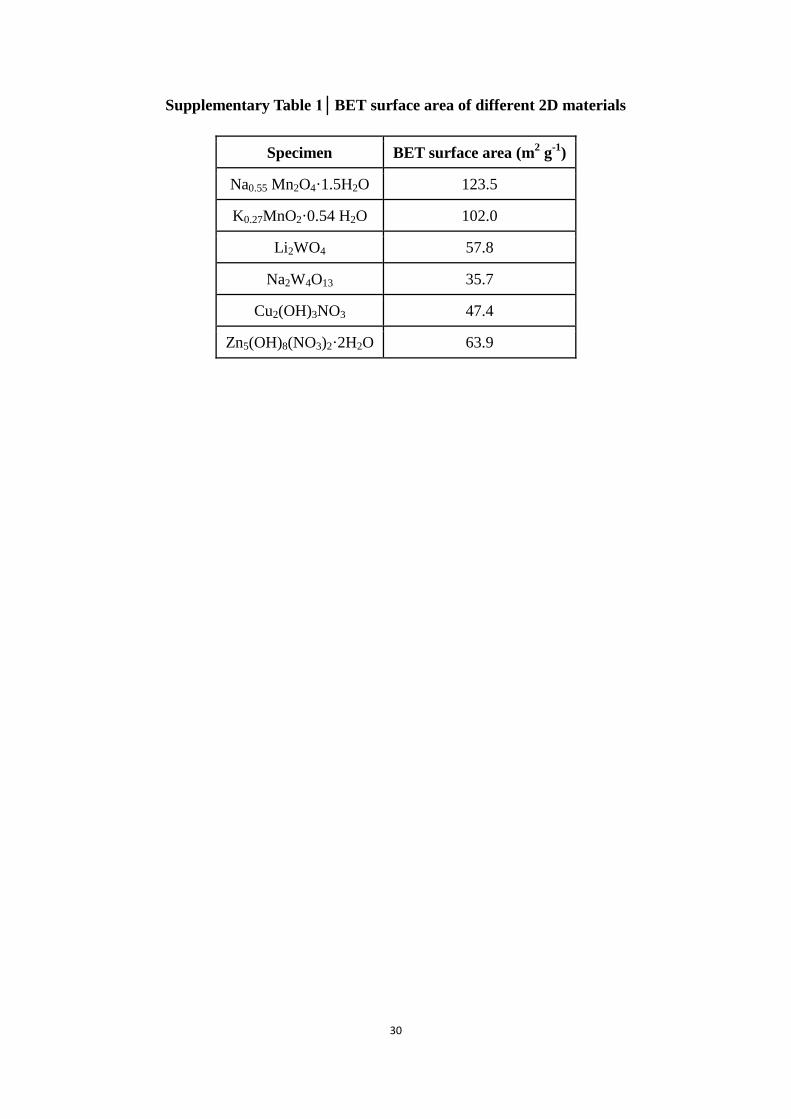
Supplementary Table 1│BET surface area of different 2D materials
Specimen BET surface area (m2 g
-1)
Na0.55 Mn2O4·1.5H2O 123.5
K0.27MnO2·0.54 H2O 102.0
Li2WO4 57.8
Na2W4O13 35.7
Cu2(OH)3NO3 47.4
Zn5(OH)8(NO3)2·2H2O 63.9
31
Supplementary Note 1. Calculation process of productivity of sample
Na0.55Mn2O4·1.5H2O.
The calculation formula of production yield is shown as following:
Production yield=the actual weight
the theoretical weight (1)
The actual weight of Na0.55Mn2O4·1.5H2O was measured by a microbalance with
an accuracy of 0.1 mg. The theoretical weight of Na0.55Mn2O4·1.5H2O was calculated
based on the weight of MnSO4 precursor. In this work, we used 0.2 g MnSO4 as
precursor, thus the theoretical weight of Na0.55Mn2O4·1.5H2O should be 0.1415 g, and
the actual weight is 0.0877 g. The production yield of Na0.55Mn2O4·1.5H2O is about
62 %.
Supplementary Note 2. The source of crystal water.
According to the structural model of birnessite type manganese oxide calculated
by Post and Veblen, Mn(IV) and Mn(III) atoms distributed uniformly in the
manganese oxide sheet. Hence, the charge density of manganese oxide sheet can be
calculated on the basis of this model1. In order to balance the charge density, the
cations should occupy the interlayer. Besides, a certain amount of water molecules is
needed to support the interlayer spacing and then stabilize the layered structure. Since
the actual content of water molecules will increase as the temperature rising, it means
that when the reaction temperature exceeds 300 °C, the absolute humidity in the
muffle furnace is increasing compared to starting temperature (25 °C). So the water
molecules can enter into the interlayer with cations to support the layered structure
even at 300 °C.
To discuss the source of the crystal water, we have measured the XRD to
illustrate the change of the crystal structure before and after the washing step
(Supplementary Fig. 14). Without washing by deionized water (DI water), the XRD
pattern of the sample Na0.55Mn2O4·1.5H2O@ NaNO3 already shows the phase of
Na0.55Mn2O4·1.5H2O and NaNO3 which means the crystal water came from the
reaction process but not the washing step. Similar results can be also concluded from
the sample of Zn5(OH)8(NO3)2·2H2O @ KNO3, as shown in Supplementary Fig. 14b.
32
Supplementary Note 3. Arrhenius equation.
The relationship between reaction temperature (T) and reaction rate constant (𝑘𝑠)
can be expressed as below from the Arrhenius equation:
𝑘𝑠 = 𝐴𝑒−𝐸𝑠𝑅𝑇 (2)
where 𝑘𝑠 is the reaction rate constant (s-1
), 𝐴 is the frequency factor (s-1
), 𝐸𝑠 is the
activation energy (J mol-1
), R is the molar gas constant (8.314 J mol-1
K-1
) and T is the
reaction temperature. To a typical 2D structure material, 𝑘𝑠 of different growth
direction decide the thickness and lateral size. 𝑘𝑎 and 𝑘𝑏 represent the reaction rate
constant of growth dire ction [001] and [100], respectively; The thickness and lateral
size depend on 𝑘𝑎 and 𝑘𝑏; 𝐴 is the same constant for different lattice direction and
reaction systems.
The activation energy 𝐸𝑠 should be unchanged in different reaction systems
under the same temperature.
According to equation (2), we can obtain the relationship of 𝑘𝑏 and 𝑘𝑎:
𝑘𝑏
𝑘𝑎= 𝑒
𝐸𝑎−𝐸𝑏𝑅𝑇 (3)
Supplementary Note 4. The influence of reaction temperature.
In Sun’s work (ref 2), they have synthesized ultrathin 2D δ-MnO2 (birnessite)
nanosheets via a hydrothermal method. The thickness is around 2 - 10 nm and the
plane size is about 1 - 2 μm, the temperature is 150 ºC (423 K).
The ratio of 𝑘𝑏 and 𝑘𝑎 and the difference value between 𝐸𝑎 and 𝐸𝑏 through
the values of thickness and lateral size are calculated via equation (3).
𝑘𝑏
𝑘𝑎= 100 - 1000 (4)
𝐸𝑎 − 𝐸𝑏 = 16.2 - 24.3 kJ mol-1
(5)
We supposed that 𝐸𝑎 − 𝐸𝑏 remain unchanged as the temperature raised to 653 K
(the same temperature in our method), hence the ratio of 𝑘𝑏 and 𝑘𝑎 was calculated
as 19.8 - 87.7. If the thickness was maintained at 2 nm, the lateral size of birnessite
should be 39.6 - 175.5 nm. However, in our work under the same temperature, the
thickness is about 1.4 nm and the lateral size is more than 10 μm, the ratio of 𝑘𝑏 and
33
𝑘𝑎 is 7142.8 which is much larger than 87.7:
𝑘𝑏′
𝑘𝑎′= 𝑒
𝐸𝑎′−𝐸𝑏′𝑅𝑇 =
10 μm
1.4 nm=7142.8 (6)
Thus the lateral size cannot be enlarged through improving the reaction
temperature.
Supplementary Note 5. The influence of the ion state.
Then we would discuss the influence of hydrated ion and naked ion on the lateral
size of birnessite. From equation 6,
𝐸𝑎′ − 𝐸𝑏′ =48.2 kJ mol-1
(7)
𝐸𝑎′ can be considered the same as 𝐸𝑎 due to the similar thickness and the same
temperature in the two reaction systems.
𝐸𝑏 − 𝐸𝑏′= (𝐸𝑎′ − 𝐸𝑏′) − (𝐸𝑎 − 𝐸𝑏) = 23.9 - 32.0 kJ mol-1
(8)
The difference value of 𝐸𝑏′ and 𝐸𝑏 represents the extra energy along the [100]
direction in hydrothermal method compared to molten salt system. As the total
hydration energy of K+ is -312.2 kJ mol
-1, in our work, the K
+ number is 0.27, thus the
dehydration energy is about 84.3 kJ mol-1
to the sample of K0.27MnO2·0.54H2O. This
value has the same order of magnitude to the value of (𝐸𝑏 − 𝐸𝑏′) (23.9 - 32.0 kJ
mol-1
), considering that the dehydration process cannot be incomplete in the
hydrothermal system, the actual dehydration energy would be lower than 84.3 kJ
mol-1
. Thus we can infer that the ionized ions in our method have a decisive effect on
the size of the 2D materials by accelerating the reaction rate efficiently.
Supplementary Note 6. The molecular dynamics simulation of aqueous KCl
solution.
The molecular dynamics (MD) simulation of aqueous KCl solution was
performed in the NPT ensemble with the MD package Gromacs 4.63. The SPC/E
model (ref 4) was used to mimic the water molecule, which is a rigid, three-point
charge model that accurately predicts the thermodynamic and structural properties of
water. The K+/Cl
- ions were modeled as charged Lennard-Jones (LJ) atoms with unit
34
charge and the LJ parameters for the K+ and Cl
- were taken from ref 5. The simulation
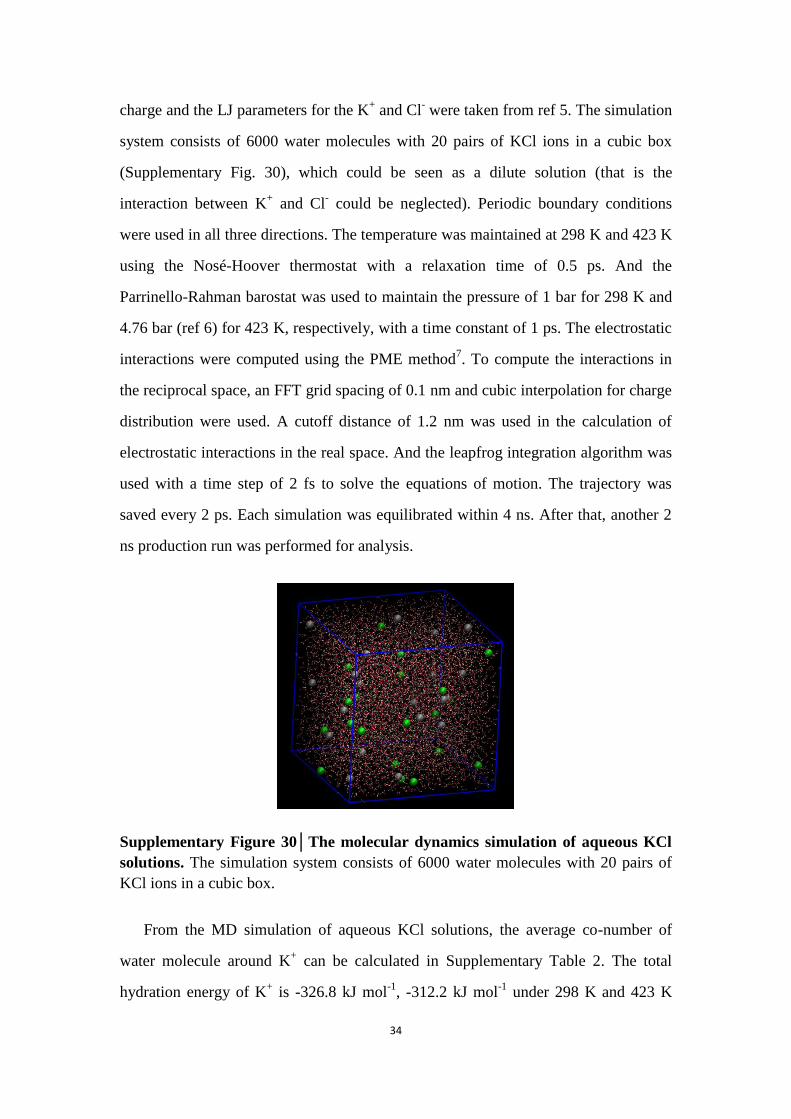
system consists of 6000 water molecules with 20 pairs of KCl ions in a cubic box
(Supplementary Fig. 30), which could be seen as a dilute solution (that is the
interaction between K+ and Cl
- could be neglected). Periodic boundary conditions
were used in all three directions. The temperature was maintained at 298 K and 423 K
using the Nosé-Hoover thermostat with a relaxation time of 0.5 ps. And the
Parrinello-Rahman barostat was used to maintain the pressure of 1 bar for 298 K and
4.76 bar (ref 6) for 423 K, respectively, with a time constant of 1 ps. The electrostatic
interactions were computed using the PME method7. To compute the interactions in
the reciprocal space, an FFT grid spacing of 0.1 nm and cubic interpolation for charge
distribution were used. A cutoff distance of 1.2 nm was used in the calculation of
electrostatic interactions in the real space. And the leapfrog integration algorithm was
used with a time step of 2 fs to solve the equations of motion. The trajectory was
saved every 2 ps. Each simulation was equilibrated within 4 ns. After that, another 2
ns production run was performed for analysis.
Supplementary Figure 30│The molecular dynamics simulation of aqueous KCl
solutions. The simulation system consists of 6000 water molecules with 20 pairs of
KCl ions in a cubic box.
From the MD simulation of aqueous KCl solutions, the average co-number of
water molecule around K+ can be calculated in Supplementary Table 2. The total
hydration energy of K+ is -326.8 kJ mol
-1, -312.2 kJ mol
-1 under 298 K and 423 K
35
(Supplementary Table 3) respectively.
Supplementary Table 2│The number of water molecule around K+ ion under
different temperature
T Co-number
298 K 8.3488
423 K 7.6948
Supplementary Table 3│The hydration energy (Etot) of K+ with one water
molecule under different temperature
T EvdW(kJ mol-1
) Ecoul(kJ mol-1
) Etot(kJ mol-1
)
298 K 3.9095 -43.054 -39.144
423 K 4.1295 -44.704 -40.574
Supplementary Note 7. Electrode reaction for both positive and negative
electrodes.
The probable electrode reaction for positive and negative electrode is shown as
following:
Na2W4O13+xNa++xe- ↔ Na2+xW4O13 (-2≤ x ≤4) (9)
The equation express the reaction of negative electrode as -2 ≤ x < 0 while
represents the reaction of positive electrode as 0 < x ≤ 4.
Supplementary Note 8. Calculation of specific energy/power density.
The specific energy and power density based on following equations (10-13).
𝐸𝑣 = 0.5𝐶𝑣𝑈2 (10)
𝑃𝑣 = 3600𝐸𝑣/𝑡 (11)
Where 𝐶𝑣 (F cm-3
) is the volumetric capacitance of the device. 𝐸𝑣 (Wh cm-3
)
36
and 𝑃𝑣 (W cm-3
) is the volumetric energy density and volumetric power density,
respectively. 𝑈 (V) is the operating voltage of the device and 𝑡 (h) is the
discharging time.
𝐸𝑔 = 0.5𝐶𝑔𝑈2 (12)
𝑃𝑔 = 3600𝐸𝑔/𝑡 (13)
Where 𝐶𝑔 (F g-1
) is the gravimetric capacitance of the device. 𝐸𝑔 (Wh kg-1
)
and 𝑃𝑔 (W kg-1
) is the gravimetric energy density and gravimetric power density,
respectively. 𝑈 (V) is the operating voltage of the device and 𝑡 (h) is the
discharging time. The gravimetric specific energy/power densities are shown in
Supplementary Fig. 25. The gravimetric specific energy density reaches 1.33 Wh kg-1
while the specific power density is 598.4 W kg-1
.
Supplementary References
1. Liu, Z. H. et al. Swelling and delamination behaviors of birnessite-type
manganese oxide by intercalation of tetraalkylammonium ions. Langmuir 16,
4154-4164 (2000).
2. Sun, Y. G. et al. Birnessite-type MnO2 nanosheets with layered structure under
high pressure: Elimination of crystalline stacking faults and oriented laminar
assembly. Small 11, 300-305 (2015).
3. Van der Spoel, D. et al. GROMACS User Manual version (2013).
4. Berendsen, H. J. C. et al. The missing term in effective pair potentials. J. Phys.
Chem. 91, 6269-6271 (1987).
5. Dang, L. X., Free Energy of association of the K+:18-crown-6 complex in water:
A new molecular dynamics study. J. Phys. Chem. 99, 55-58 (1995).
6. Sonntag, R. E. et al. Van Wyk, Fundamentals of thermodynamics. 6, Wiley New
York (1998).
7. Yeh, I. C. et al. Ewald summation for systems with slab geometry. J. Chem. Phys.
111, 3155-3162 (1999).
8. Sun, Y. et al. Graphene based new energy materials. Energy Environ. Sci. 4,

37
1113-1132 (2011).
9. Choi, H. J. et al. Graphene for energy conversion and storage in fuel cells and
supercapacitors. Nano Energy 1, 534-551 (2012).


![Electronic Supplementary Information Magnesium β ... · 1 Electronic Supplementary Information Magnesium β-Ketoiminates as CVD Precursors for MgO Formation Elaheh Pousaneh[a], Tobias](https://static.fdocument.org/doc/165x107/60651f68f5d4f347af3c4c60/electronic-supplementary-information-magnesium-1-electronic-supplementary.jpg)