SuPPLementarY InFormatIon - media.nature.com · human Met19 (pdb code 1SHY) with Indonesia ( and on...
15
WWW.NATURE.COM/NATURE | 1 SUPPLEMENTARY INFORMATION doi:10.1038/nature09468 Supplementary Table Janssen et al. Table Data collection and refinement statistics Sema4D-PlxnB1 Sema6A-PlxnA2 Sema6A PlxnA2 Data collection Data collection Space group F222 C222 1 P3 1 C2 Cell dimensions Cell dimensions a, b, c (Å) α β γ (°) 83.1, 173.4, 482.1 90 90 90 155.5, 159.6, 139.3 90 90 90 97.0, 97.0, 153.1 90 90 120 158.0, 93.1, 62.9 90 102 9 90 α, β, γ (°) 90, 90, 90 90, 90, 90 90, 90, 120 90, 102.9, 90 Resolution (Å) 50-3.0 (3.10- 3 00)* 55-2.2 (2.32- 2 20)* 37-2.3 (2.42- 2 30)* 50-2.3 (2.42- 2 30)* 3.00)* 2.20)* 2.30)* 2.30)* R merge (%) 11.9 (88.1) 9.9 (66.2) 6.8 (59.8) 12.2 (67.7) I/ I 14 2 (4 5) 7 8 (1 9) 11 1 (1 9) 6 6 (1 6) I/I 14.2 (4.5) 7.8 (1.9) 11.1 (1.9) 6.6 (1.6) Completeness (%) 99.6 (99.3) 94.4 (96.4) 99.6 (99.4) 97.9 (98.8) Rd d 4 8(4 5) 3 8 (3 6) 3 1 (2 9) 2 8 (2 8) Redundancy 4.8 (4.5) 3.8 (3.6) 3.1 (2.9) 2.8 (2.8) Refinement Resolution (Å) 50-3.0 40-2.2 33-2.3 45-2.3 No. reflections 35192 82680 71390 38559 R work/ R free (%) 20.3 / 24.5 19.0 / 23.0 18.5 / 21.9 20.3 / 25.4 No. atoms 8744 9608 9002 5417 Protein 8744 9189 8651 5208 Ligand/ion 0 30 73 27 Water 0 389 278 182 B-factors (Å 2 ) Protein 765 50 9 57 8 41 3 Protein 76.5 50.9 57.8 41.3 Ligand/ion 64.5 66.2 56.3 Water 41 1 41 7 34 0 Water 41.1 41.7 34.0 R.m.s deviations Bond lengths (Å) 0 008 0 005 0 009 0 003 Bond lengths (Å) 0.008 0.005 0.009 0.003 Bond angles (º) 1.33 0.92 1.18 0.79 *Hi h l i h ll i h i h i *Highest resolution shell is shown in parenthesis.
Transcript of SuPPLementarY InFormatIon - media.nature.com · human Met19 (pdb code 1SHY) with Indonesia ( and on...
w w w. n a t u r e . c o m / n a t u r e | 1
SuPPLementarY InFormatIondoi:10.1038/nature09468
Supplementary Table Janssen et al. pp yTable Data collection and refinement statistics Sema4D-PlxnB1 Sema6A-PlxnA2 Sema6A PlxnA2 Data collectionData collection Space group F222 C2221 P31 C2 Cell dimensionsCell dimensions a, b, c (Å) α β γ (°)
83.1, 173.4, 482.1 90 90 90
155.5, 159.6, 139.390 90 90
97.0, 97.0, 153.1 90 90 120
158.0, 93.1, 62.9 90 102 9 90 α, β, γ (°) 90, 90, 90 90, 90, 90 90, 90, 120 90, 102.9, 90
Resolution (Å) 50-3.0 (3.10-3 00)*
55-2.2 (2.32-2 20)*
37-2.3 (2.42-2 30)*
50-2.3 (2.42-2 30)*3.00)* 2.20)* 2.30)* 2.30)*
Rmerge (%) 11.9 (88.1) 9.9 (66.2) 6.8 (59.8) 12.2 (67.7) I/ I 14 2 (4 5) 7 8 (1 9) 11 1 (1 9) 6 6 (1 6)I/I 14.2 (4.5) 7.8 (1.9) 11.1 (1.9) 6.6 (1.6)Completeness (%) 99.6 (99.3) 94.4 (96.4) 99.6 (99.4) 97.9 (98.8) R d d 4 8 (4 5) 3 8 (3 6) 3 1 (2 9) 2 8 (2 8)Redundancy 4.8 (4.5) 3.8 (3.6) 3.1 (2.9) 2.8 (2.8) Refinement Resolution (Å) 50-3.0 40-2.2 33-2.3 45-2.3 No. reflections 35192 82680 71390 38559 Rwork/ Rfree (%) 20.3 / 24.5 19.0 / 23.0 18.5 / 21.9 20.3 / 25.4 No. atoms 8744 9608 9002 5417 Protein 8744 9189 8651 5208 Ligand/ion 0 30 73 27 Water 0 389 278 182 B-factors (Å2)
Protein 76 5 50 9 57 8 41 3 Protein 76.5 50.9 57.8 41.3 Ligand/ion 64.5 66.2 56.3
Water 41 1 41 7 34 0 Water 41.1 41.7 34.0 R.m.s deviations
Bond lengths (Å) 0 008 0 005 0 009 0 003 Bond lengths (Å) 0.008 0.005 0.009 0.003 Bond angles (º) 1.33 0.92 1.18 0.79 *Hi h l i h ll i h i h i*Highest resolution shell is shown in parenthesis.
SUPPLEMENTARY INFORMATION
2 | w w w. n a t u r e . c o m / n a t u r e
RESEARCH
Supplementary Figure 1 Janssen et al. pp y g
PlxnA2PlxnB1 28%Å1.64Å
B1-A222%
1 92Å22% 1.92ÅA2-MET
22%1.81Å
B1-MET
Sema4D METSema4D MET
32%
39%1.50Å4D 3A
Sema3A
32%1.73Å4D-6A
4D-3A
Sema3A
Sema6A 34%1.66Å6A-3A
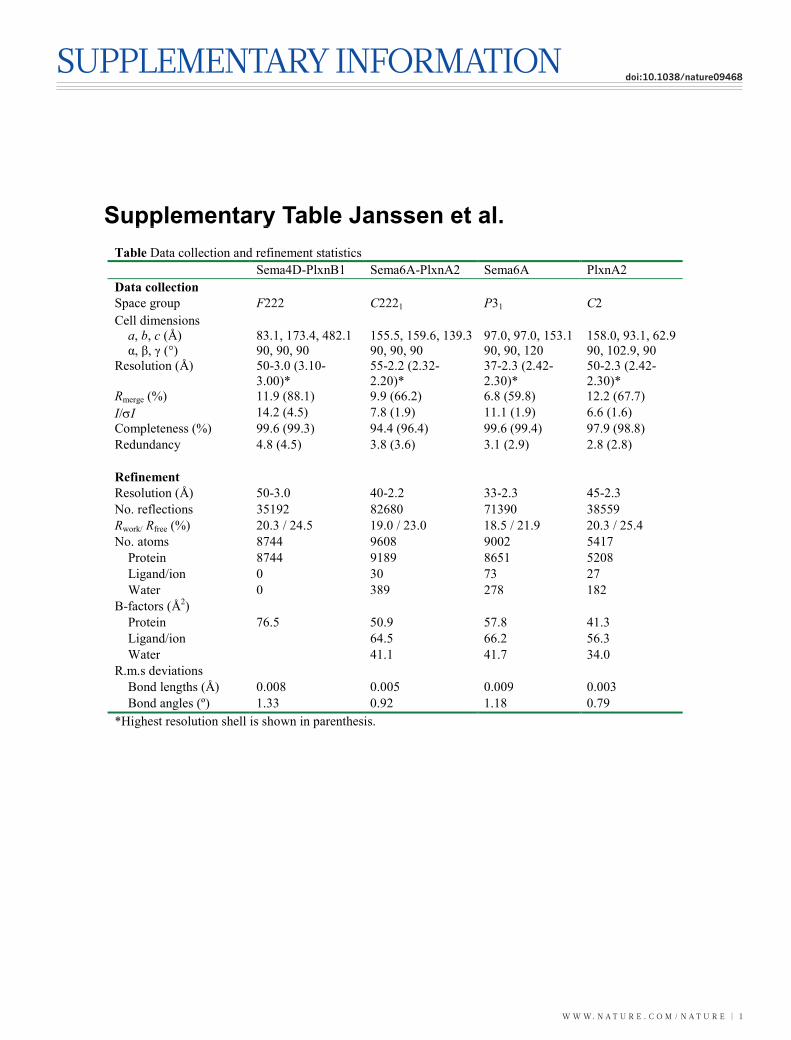
Supplementary figure 1. Structure-based phylogenetic analysis of the sema domain. pp y g p y g ya, All available structures of sema domains (Sema4D5 pdb code 1OLZ, Sema3A6 pdb code 1Q47, Met receptor19
pdb code 1SHY and Sema6A, PlxnB1 and PlxnA2 described here) were superposed, a pairwise distance matrix p , ) p p , pwas constructed based on structural similarity with the program SHP46 and converted into a tree representation with the PHYLIP package (http://evolution.genetics.washington.edu/phylip.html). Structure based sequence w e p c ge ( p://evo u o .ge e cs.w s g o .edu/p y p. ). S uc u e b sed seque ceidentity (%) calculated with the program Indonesia (http://xray.bmc.uu.se/dennis) and Cα atoms rmsds (Å) calculated with SHP are shown for indicated sema domain comparisons. Ribbon representations are “rainbow”calculated with SHP are shown for indicated sema domain comparisons. Ribbon representations are rainbow colour ramped from blue (N-terminus) to red (C-terminus). The Met receptor sema domain is most homologous to that of plexinsto that of plexins.
w w w. n a t u r e . c o m / n a t u r e | 3
SUPPLEMENTARY INFORMATION RESEARCH
Supplementary Figure 2 Janssen et al. pp y g
SemaSignal Peptide
Sema
Sema
Sema
Sema PSI-1
βA βB βC βD βE αPSI1βF βG αPSI2
IPT-1 PSI-2
βPSI1 βPSI2 αPSI3
PSI-2 Mucin-like
SUPPLEMENTARY INFORMATION
4 | w w w. n a t u r e . c o m / n a t u r e
RESEARCH
Supplementary Figure 2 Janssen et al. pp y g
Mucin-like
αPSI4 αPSI5
PSI-2
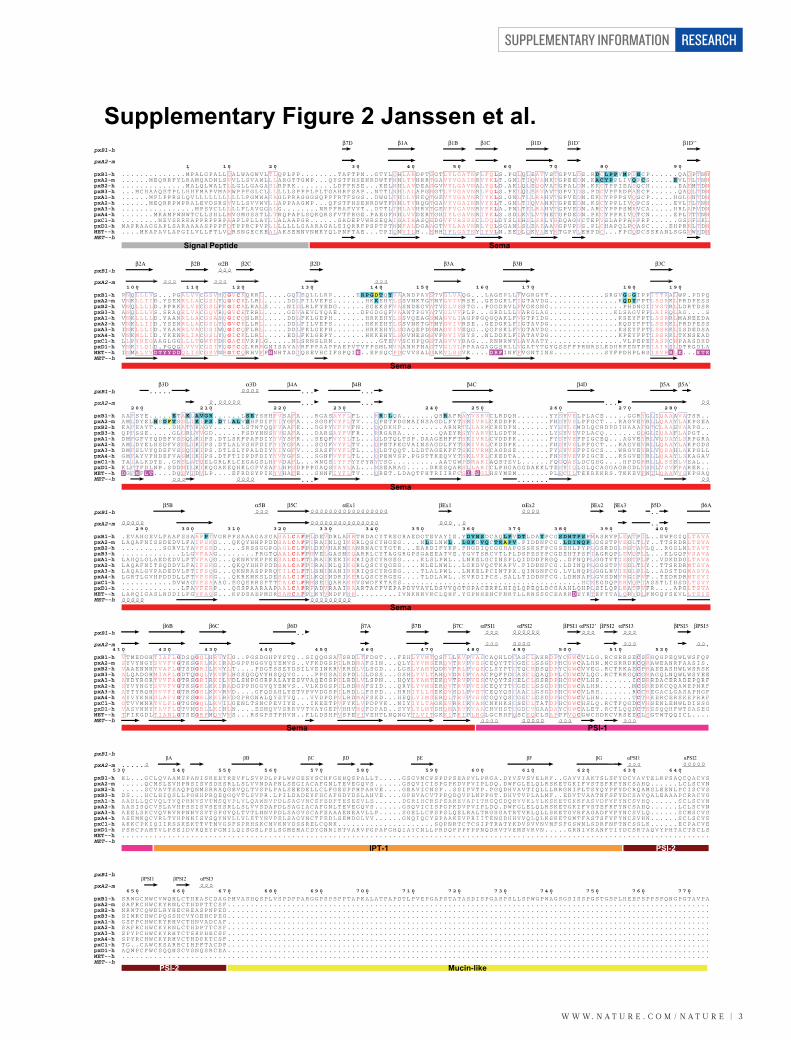
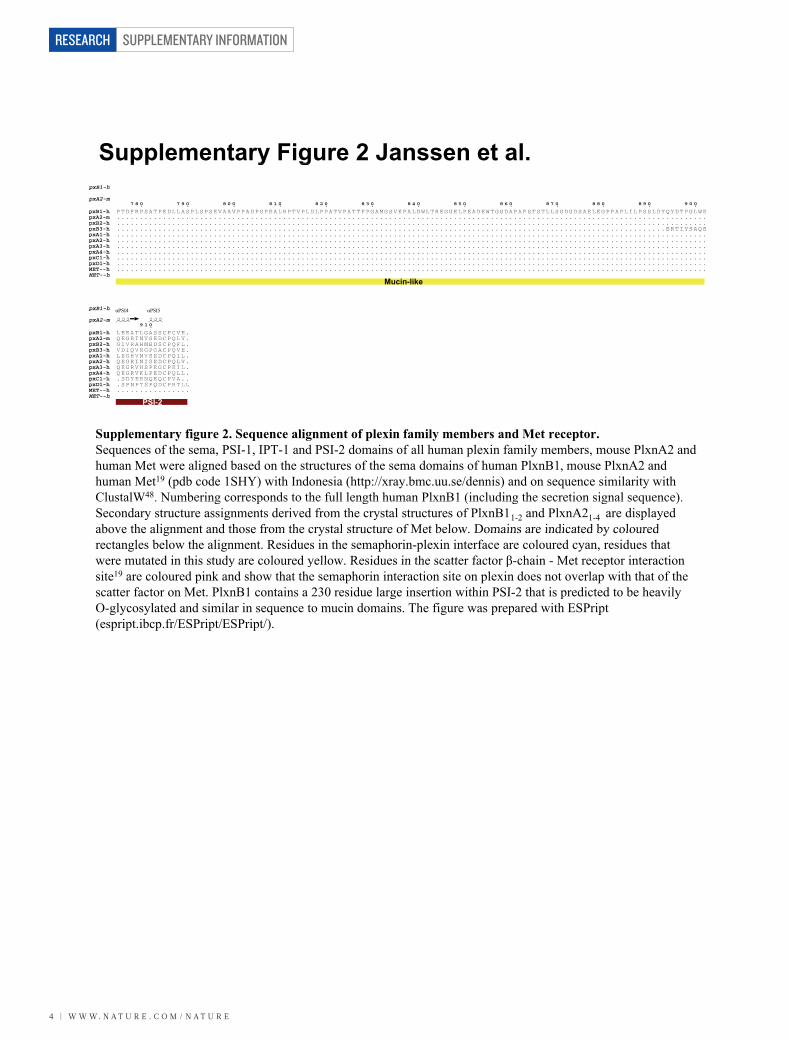
Supplementary figure 2. Sequence alignment of plexin family members and Met receptor. pp y g q g p y pSequences of the sema, PSI-1, IPT-1 and PSI-2 domains of all human plexin family members, mouse PlxnA2 and human Met were aligned based on the structures of the sema domains of human PlxnB1, mouse PlxnA2 and g ,human Met19 (pdb code 1SHY) with Indonesia (http://xray.bmc.uu.se/dennis) and on sequence similarity with ClustalW48. Numbering corresponds to the full length human PlxnB1 (including the secretion signal sequence).ClustalW . Numbering corresponds to the full length human PlxnB1 (including the secretion signal sequence). Secondary structure assignments derived from the crystal structures of PlxnB11-2 and PlxnA21-4 are displayed above the alignment and those from the crystal structure of Met below Domains are indicated by colouredabove the alignment and those from the crystal structure of Met below. Domains are indicated by coloured rectangles below the alignment. Residues in the semaphorin-plexin interface are coloured cyan, residues that were mutated in this study are coloured yellow Residues in the scatter factor β-chain - Met receptor interactionwere mutated in this study are coloured yellow. Residues in the scatter factor β-chain - Met receptor interaction site19 are coloured pink and show that the semaphorin interaction site on plexin does not overlap with that of the scatter factor on Met PlxnB1 contains a 230 residue large insertion within PSI 2 that is predicted to be heavilyscatter factor on Met. PlxnB1 contains a 230 residue large insertion within PSI-2 that is predicted to be heavily O-glycosylated and similar in sequence to mucin domains. The figure was prepared with ESPript (espript ibcp fr/ESPript/ESPript/)(espript.ibcp.fr/ESPript/ESPript/).
w w w. n a t u r e . c o m / n a t u r e | 5
SUPPLEMENTARY INFORMATION RESEARCH
Supplementary Figure 3 Janssen et al. pp y g
a c9
10Sema6Aecto AUC
7
8 PlxnA21-4 AUC
678
2.7 mg/ml
Total concentration
5
6
) 2.5 mg/ml
Total protein conc.
3456
C(S
)
0.6 mg/ml3
4
C(S
) g
1.4 mg/ml
0.5 mg/ml
0123
0
1
2
0
1 3 5 7 9
Sed. coefficient (S)
0
1 3 5 7 9Sed. coefficient (S)
Sema6A MALS (TSK column)Sema4D MALS (S200 column)b d Sema6Aecto MALS (TSK column)Sema4Decto MALS (S200 column)5
Peak concentration200 200
b d
5 0.14 mg/ml
0.012 mg/ml
ea co ce a o
0.11 mg/ml
0 011 mg/ml
Peak concentration150
(kD
a) 150(k
Da)
5 0.003 mg/ml0.011 mg/ml
0.003 mg/ml100
r mas
s (
100
r mas
s (
450
Mol
ar
50
Mol
ar
7.0 8.0 9.0 10.0 11.0 12.0 13.10.0 11.0 12.0 13.0 14.0 15.00
Volume (ml)
0
Volume (ml)
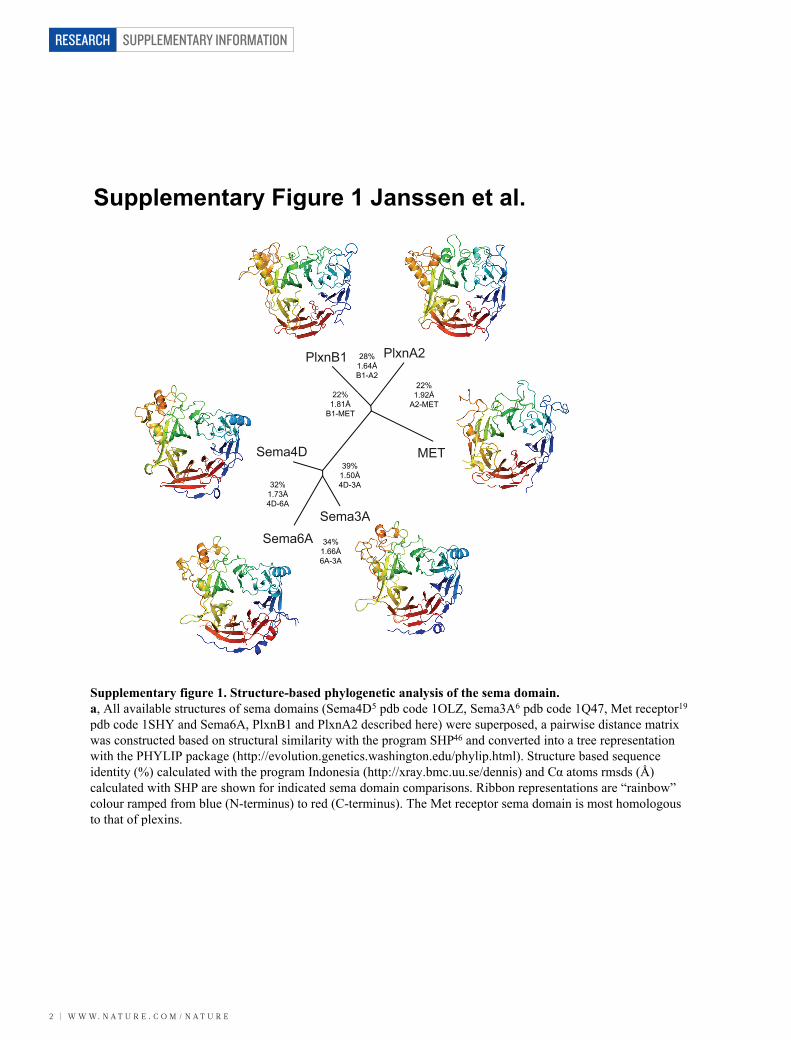
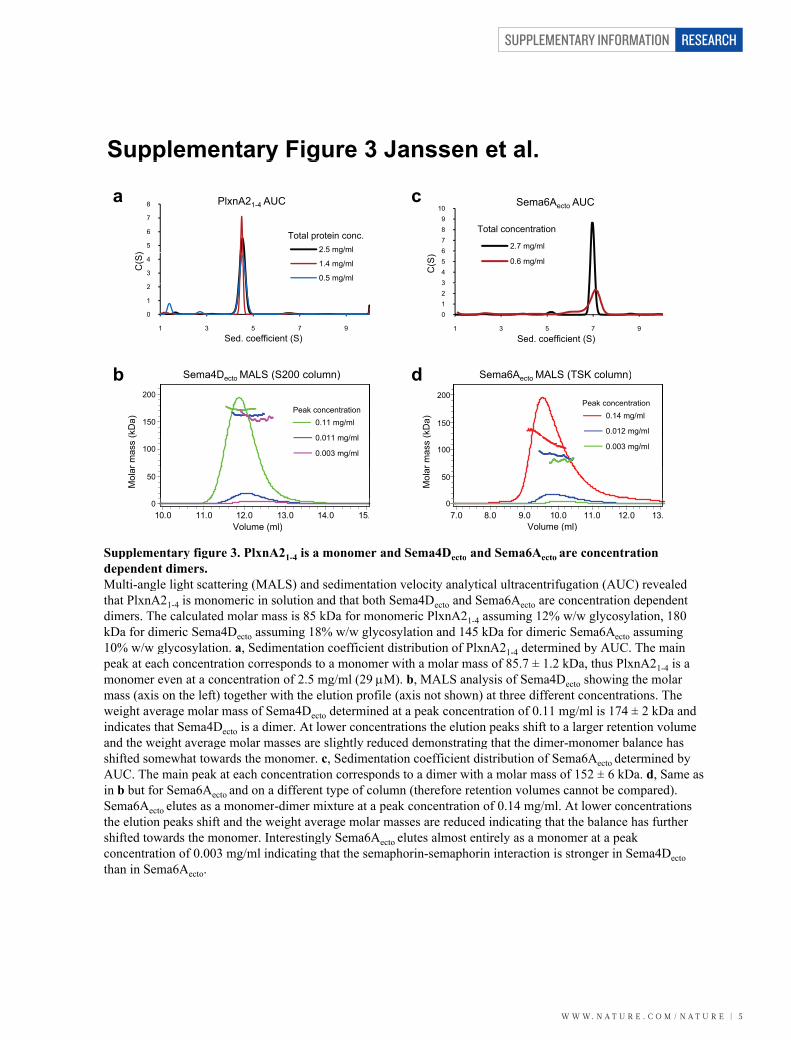
Supplementary figure 3. PlxnA21-4 is a monomer and Sema4Decto and Sema6Aecto are concentration
Volume (ml) Volume (ml)
pp y g 1 4 ecto ecto dependent dimers.Multi-angle light scattering (MALS) and sedimentation velocity analytical ultracentrifugation (AUC) revealed g g g ( ) y y g ( )that PlxnA21-4 is monomeric in solution and that both Sema4Decto and Sema6Aecto are concentration dependent dimers. The calculated molar mass is 85 kDa for monomeric PlxnA21 4 assuming 12% w/w glycosylation, 180 d e s. e ca cu a ed o a ass s 85 a o o o e c 1-4 assu g % w/w g ycosy a o , 80kDa for dimeric Sema4Decto assuming 18% w/w glycosylation and 145 kDa for dimeric Sema6Aecto assuming 10% w/w glycosylation. a, Sedimentation coefficient distribution of PlxnA21 4 determined by AUC. The main10% w/w glycosylation. a, Sedimentation coefficient distribution of PlxnA21-4 determined by AUC. The main peak at each concentration corresponds to a monomer with a molar mass of 85.7 ± 1.2 kDa, thus PlxnA21-4 is a monomer even at a concentration of 2 5 mg/ml (29 M) b MALS analysis of Sema4D showing the molarmonomer even at a concentration of 2.5 mg/ml (29 M). b, MALS analysis of Sema4Decto showing the molar mass (axis on the left) together with the elution profile (axis not shown) at three different concentrations. The weight average molar mass of Sema4D determined at a peak concentration of 0 11 mg/ml is 174 ± 2 kDa andweight average molar mass of Sema4Decto determined at a peak concentration of 0.11 mg/ml is 174 ± 2 kDa and indicates that Sema4Decto is a dimer. At lower concentrations the elution peaks shift to a larger retention volume and the weight average molar masses are slightly reduced demonstrating that the dimer monomer balance hasand the weight average molar masses are slightly reduced demonstrating that the dimer-monomer balance has shifted somewhat towards the monomer. c, Sedimentation coefficient distribution of Sema6Aecto determined by AUC The main peak at each concentration corresponds to a dimer with a molar mass of 152 ± 6 kDa d Same asAUC. The main peak at each concentration corresponds to a dimer with a molar mass of 152 ± 6 kDa. d, Same as in b but for Sema6Aecto and on a different type of column (therefore retention volumes cannot be compared). Sema6A el tes as a monomer dimer mi t re at a peak concentration of 0 14 mg/ml At lo er concentrationsSema6Aecto elutes as a monomer-dimer mixture at a peak concentration of 0.14 mg/ml. At lower concentrations the elution peaks shift and the weight average molar masses are reduced indicating that the balance has further hift d t d th I t ti l S 6A l t l t ti l t kshifted towards the monomer. Interestingly Sema6Aecto elutes almost entirely as a monomer at a peak
concentration of 0.003 mg/ml indicating that the semaphorin-semaphorin interaction is stronger in Sema4Dectoh i S 6Athan in Sema6Aecto.
SUPPLEMENTARY INFORMATION
6 | w w w. n a t u r e . c o m / n a t u r e
RESEARCH
Supplementary Figure 4 Janssen et al. pp y g
SemaSignal Peptide
Sema
Sema
Sema
Sema
w w w. n a t u r e . c o m / n a t u r e | 7
SUPPLEMENTARY INFORMATION RESEARCH
Supplementary Figure 4 Janssen et al. pp y gαPSI5
PSI
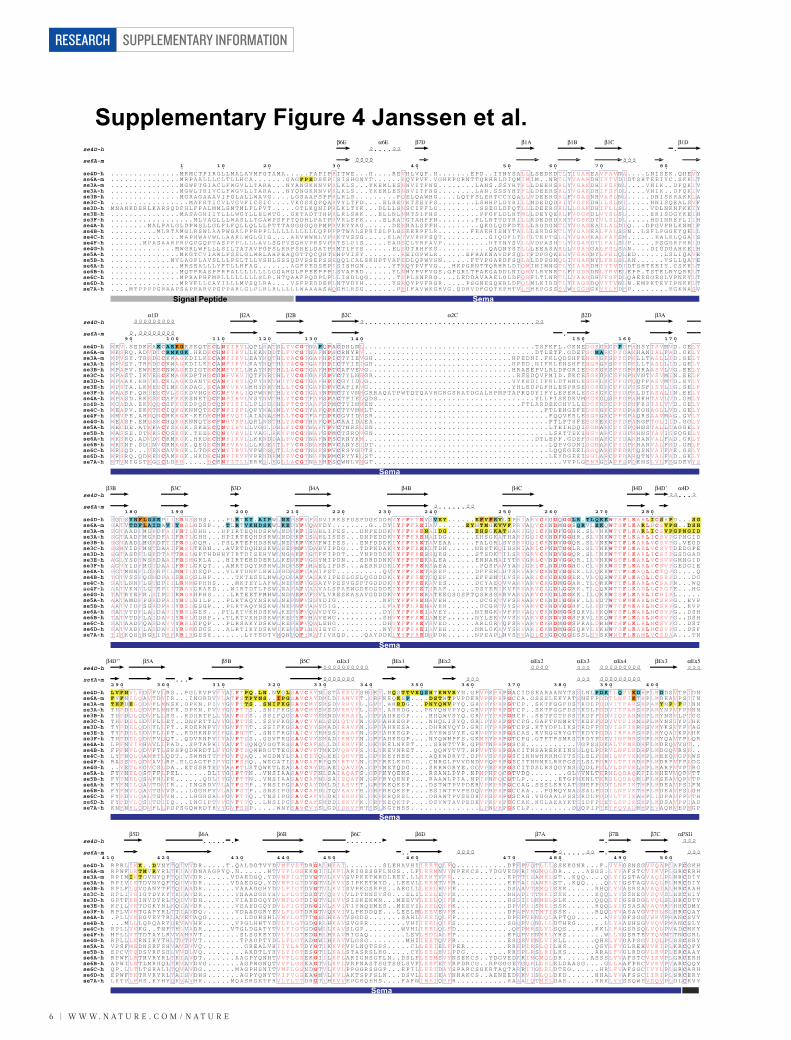
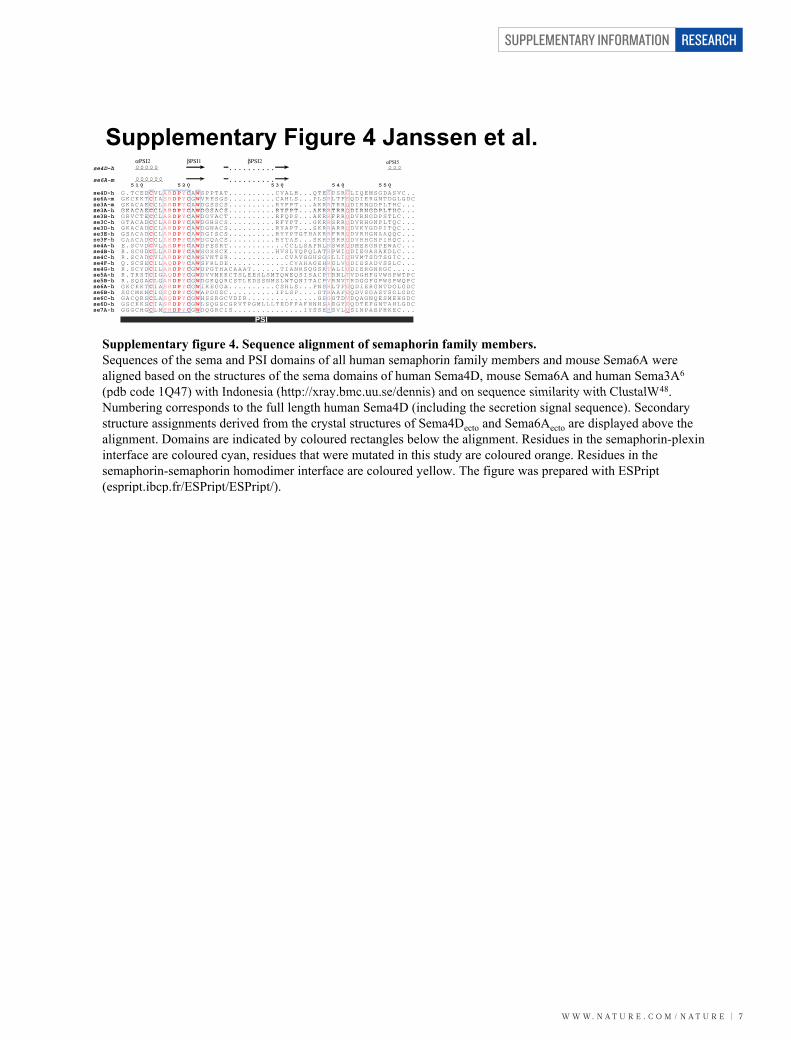
Supplementary figure 4. Sequence alignment of semaphorin family members. Sequences of the sema and PSI domains of all human semaphorin family members and mouse Sema6A wereSequences of the sema and PSI domains of all human semaphorin family members and mouse Sema6A were aligned based on the structures of the sema domains of human Sema4D, mouse Sema6A and human Sema3A6
(pdb code 1Q47) with Indonesia (http://xray bmc uu se/dennis) and on sequence similarity with ClustalW48(pdb code 1Q47) with Indonesia (http://xray.bmc.uu.se/dennis) and on sequence similarity with ClustalW . Numbering corresponds to the full length human Sema4D (including the secretion signal sequence). Secondary structure assignments derived from the crystal structures of Sema4D and Sema6A are displayed above thestructure assignments derived from the crystal structures of Sema4Decto and Sema6Aecto are displayed above the alignment. Domains are indicated by coloured rectangles below the alignment. Residues in the semaphorin-plexin interface are coloured cyan residues that were mutated in this study are coloured orange Residues in theinterface are coloured cyan, residues that were mutated in this study are coloured orange. Residues in the semaphorin-semaphorin homodimer interface are coloured yellow. The figure was prepared with ESPript (espript ibcp fr/ESPript/ESPript/)(espript.ibcp.fr/ESPript/ESPript/).
SUPPLEMENTARY INFORMATION
8 | w w w. n a t u r e . c o m / n a t u r e
RESEARCH
Supplementary Figure 5 Janssen et al. pp y ga Sema4D Sema6Aa Sema4D Sema6A
PlxnB1 PlxnA2
b cIgb cPSI
PSI
SemaSema
Sema Sema
PSI 1PSI-1
Sema4D Sema6Ad
IPT-1
Sema4D sema PSI Ig
Rmsd (Å) Transl. (Å) Rot. (°) Rmsd (Å) Transl. (Å) Rot. (°) Rmsd (Å) Transl. (Å) Rot. (°) PSI-2Unlig. chain A -complexed
0.85 - - 0.63 0.66 2.3 0.83 1.5 7.5
Unlig. chain B - 0.63 1.7 5.5 0.72 0.96 3.3 0.68 2.1 6.0
PSI 2
Stalk
PlxnA2complexed
Unlig. chain A -Unlig. chain B
0.78 - - 0.66 0.57 1.8 1.1 0.87 8.0
Sema6A sema PSI
Rmsd (Å) Transl. (Å) Rot. (°) Rmsd (Å) Transl. (Å) Rot. (°)
PlxnA2 sema PSI-1 IPT-1
Rmsd (Å) Rmsd (Å) Transl. (Å) Rot. (°) Rmsd (Å) Transl. (Å) Rot. (°)
Unlig. chain A -complexed
0.54 - - 0.84 0.62 10
Unlig. chain B - 0.71 2.5 9.1 0.78 0.43 12.4
Unliganded -complexed
0.59 0.27 1.7 8.3 0.31 6.0 10.8
gcomplexed
Unlig. chain A -Unlig. chain B
0.59 - - 0.51 0.24 4.3
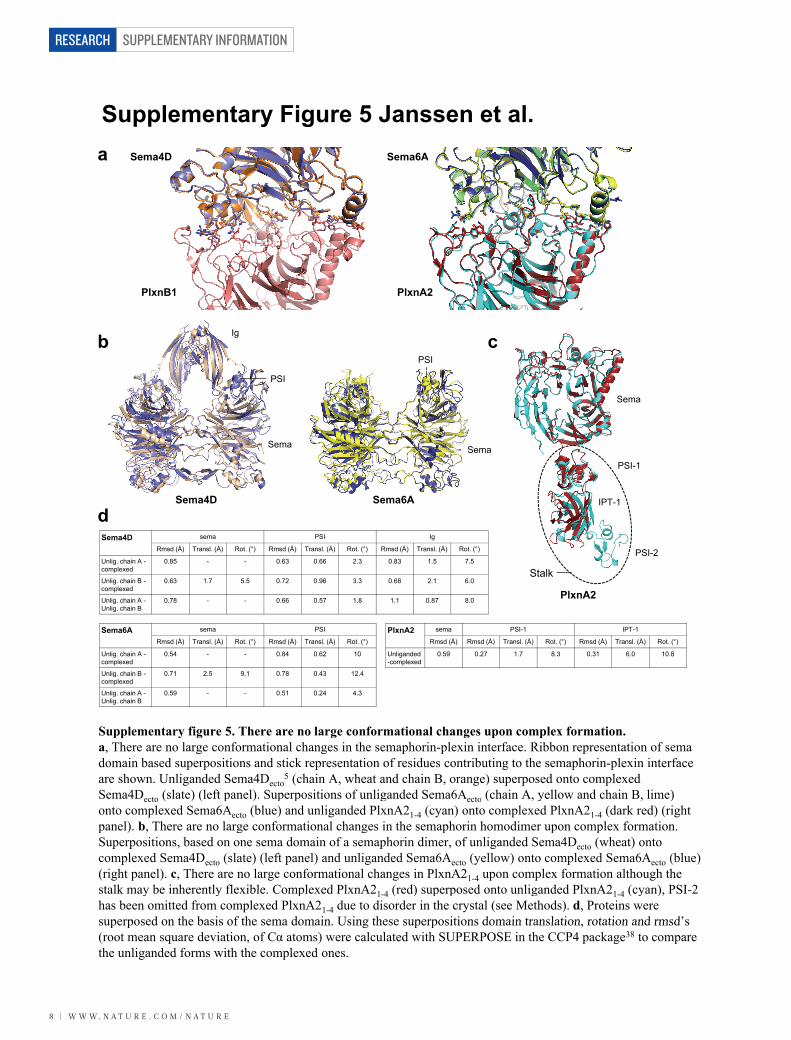
Supplementary figure 5. There are no large conformational changes upon complex formation.a, There are no large conformational changes in the semaphorin-plexin interface. Ribbon representation of sema domain based superpositions and stick representation of residues contributing to the semaphorin-plexin interface p p p g p pare shown. Unliganded Sema4Decto
5 (chain A, wheat and chain B, orange) superposed onto complexed Sema4Decto (slate) (left panel). Superpositions of unliganded Sema6Aecto (chain A, yellow and chain B, lime) ecto ( ) ( p ) p p g ecto ( , y , )onto complexed Sema6Aecto (blue) and unliganded PlxnA21-4 (cyan) onto complexed PlxnA21-4 (dark red) (right panel). b, There are no large conformational changes in the semaphorin homodimer upon complex formation.panel). b, There are no large conformational changes in the semaphorin homodimer upon complex formation. Superpositions, based on one sema domain of a semaphorin dimer, of unliganded Sema4Decto (wheat) onto complexed Sema4D t (slate) (left panel) and unliganded Sema6A t (yellow) onto complexed Sema6A t (blue)complexed Sema4Decto (slate) (left panel) and unliganded Sema6Aecto (yellow) onto complexed Sema6Aecto (blue) (right panel). c, There are no large conformational changes in PlxnA21-4 upon complex formation although the stalk may be inherently flexible Complexed PlxnA21 4 (red) superposed onto unliganded PlxnA21 4 (cyan) PSI-2stalk may be inherently flexible. Complexed PlxnA21-4 (red) superposed onto unliganded PlxnA21-4 (cyan), PSI 2 has been omitted from complexed PlxnA21-4 due to disorder in the crystal (see Methods). d, Proteins were superposed on the basis of the sema domain Using these superpositions domain translation rotation and rmsd’ssuperposed on the basis of the sema domain. Using these superpositions domain translation, rotation and rmsd s (root mean square deviation, of Cα atoms) were calculated with SUPERPOSE in the CCP4 package38 to compare the unliganded forms with the complexed onesthe unliganded forms with the complexed ones.
w w w. n a t u r e . c o m / n a t u r e | 9
SUPPLEMENTARY INFORMATION RESEARCH
Supplementary Figure 6 Janssen et al. pp y ga ca
Sema4D/Sema6A
c β1D-β2A β3B-β3C β1D-β2A β3B-β3C
Sema6ASema4D Sema6A
PlxnB1 PlxnA2
Extrusion Extrusion
Extrusion
Extrusion
PlxnB1/PlxnB1/PlxnA2
β4B-β4C β3D-β4A β3D-β4Aβ4B-β4C
5.0 Å / 9.7° Extrusion β4C-β4D β4C-β4D
bSema4D/
bSema4D/Sema6A
β1D-β2A β2D-β3A β1D-β2A β2D-β3A
PlxnB1/PlxnA2PlxnA2
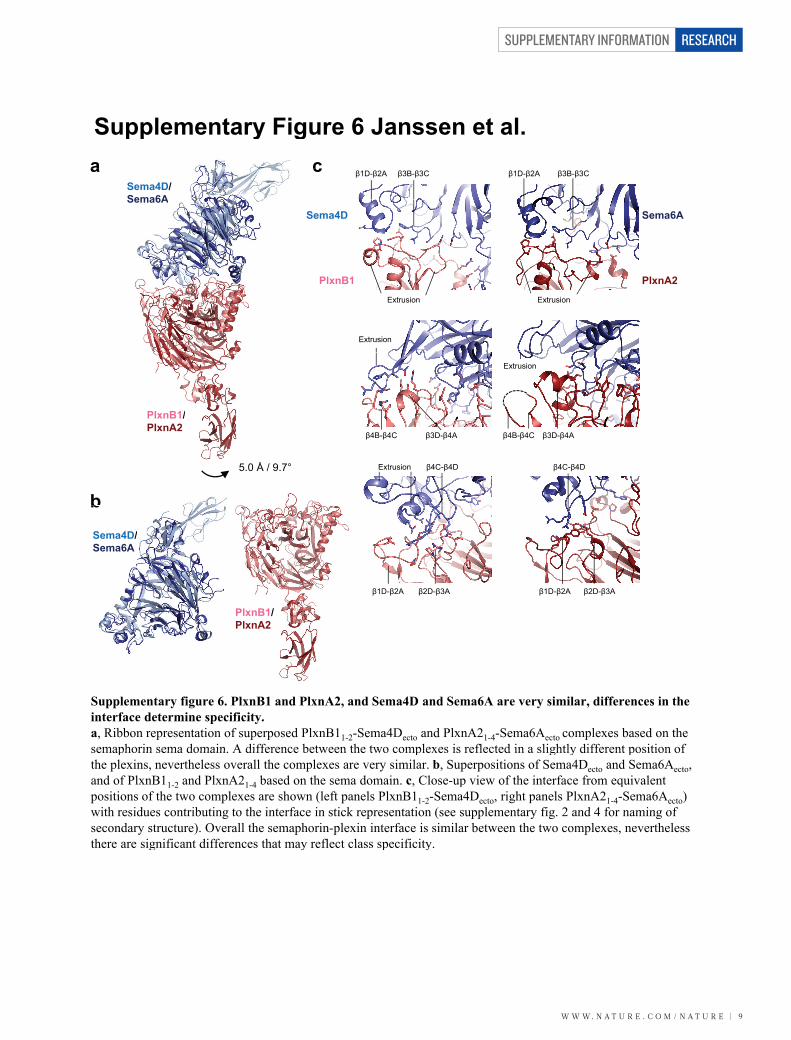
Supplementary figure 6. PlxnB1 and PlxnA2, and Sema4D and Sema6A are very similar, differences in the interface determine specificity.interface determine specificity.a, Ribbon representation of superposed PlxnB11-2-Sema4Decto and PlxnA21-4-Sema6Aecto complexes based on the semaphorin sema domain A difference between the two complexes is reflected in a slightly different position ofsemaphorin sema domain. A difference between the two complexes is reflected in a slightly different position of the plexins, nevertheless overall the complexes are very similar. b, Superpositions of Sema4Decto and Sema6Aecto, and of PlxnB1 and PlxnA2 based on the sema domain c Close-up view of the interface from equivalentand of PlxnB11-2 and PlxnA21-4 based on the sema domain. c, Close-up view of the interface from equivalent positions of the two complexes are shown (left panels PlxnB11-2-Sema4Decto, right panels PlxnA21-4-Sema6Aecto) with residues contributing to the interface in stick representation (see supplementary fig 2 and 4 for naming ofwith residues contributing to the interface in stick representation (see supplementary fig. 2 and 4 for naming of secondary structure). Overall the semaphorin-plexin interface is similar between the two complexes, nevertheless there are significant differences that may reflect class specificitythere are significant differences that may reflect class specificity.
SUPPLEMENTARY INFORMATION
1 0 | w w w. n a t u r e . c o m / n a t u r e
RESEARCH
Supplementary Figure 7 Janssen et al. pp y g
a Sema4Decto over PlxnB11-2
Low surface density Medium surface density High surface density
Res
pons
e[surface] 187 RUBmax 458 RU
[surface] 535 RUBmax 1041 RU
[surface] 4915 RUBmax 6592 RU
Sema4DR
Kd 0.73 ± 0.14 µM Kd 0.34 ± 0.06 µM Kd 0.103 ± 0.007 µMPlxnB1
[Sema4Decto] (M) [Sema4Decto] (M) [Sema4Decto] (M)
Sema4Dectomonomer over Pl nB1
bTime (s)
spon
se
[surface] 187 RUB 28 RU
PlxnB11-2
[surface] 535 RUB 719 RU
[surface] 4915 RUB 627 RU
Sema4D monomer
Res
Kd 6.0 ± 0.2 µM
Bmax 285 RU
Kd 5.3 ± 0.2 µM
Bmax 719 RU
Kd 5.5 ± 0.3 µM
Bmax 5627 RUmonomer
PlxnB1
[Sema4DectoF244N/F246S] (M) [Sema4DectoF244N/F246S] (M) [Sema4DectoF244N/F246S] (M)
cTime (s)
nse
Sema6Aecto over PlxnA21-4
Res
pon
Kd 0.28 ± 0.03 µM
[surface] 168 RUBmax 138 RU
Kd 0.101 ± 0.008 µM
[surface] 680 RUBmax 555 RU
Kd 0.048 ± 0.003 µM
[surface] 2650 RUBmax 2116 RU
Sema6A
PlxnA2
[Sema6Aecto] (M)
d 0 8 0 03 µ
[Sema6Aecto] (M)
d 0 0 0 008 µ
[Sema6Aecto] (M)
d 0 0 8 0 003 µ
dTime (s)
e
PlxnA21-4 over Sema6Aecto
d
Res
pons
e
[surface] 126 RUBmax 110 RU
[surface] 625 RUBmax 486 RU
[surface] 2400 RUBmax 1758 RU
Sema6A
PlxnA2
[PlxnA21-4] (M)
Kd 2.5 ± 0.1 µM
[PlxnA21-4] (M)
Kd 2.3 ± 0.1 µM
[PlxnA21-4] (M)
Kd 2.5 ± 0.1 µM
Time (s)
Sema6Aectomonomer over PlxnA2
e
espo
nse
[surface] 168 RUBmax 97 RU
PlxnA21-4
[surface] 680 RUBmax 428 RU
[surface] 2650 RUBmax 1769 RU
Sema6Amonomer
R
Kd 1.16 ± 0.03 µM Kd 1.43 ± 0.07 µM Kd 1.41 ± 0.05 µMPlxnA2
[Sema6AectoI322E] (M) [Sema6AectoI322E] (M) [Sema6AectoI322E] (M)
f
Time (s)
PlxnA21-4 over Sema6Aectomonomer
nse
f
Kd 2.2 ± 0.1 µM
[surface med.] 515 RUBmax 464 RUR
espo
n
Sema6Amonomer
PlxnA2
[PlxnA21-4] (M)
d µ
Time (s)
Sema6AectoFc over PlxnA21-4
e220
g
[surface high] 2750 RUBmax 3590 RUR
espo
nse
7080
100120160220
Sema6A-Fc
Kd 0.015 ± 0.001 µM
40
5060PlxnA2
[Sema6AectoFc] (M) Time (s)
w w w. n a t u r e . c o m / n a t u r e | 1 1
SUPPLEMENTARY INFORMATION RESEARCH
Supplementary Figure 7 Janssen et al. pp y g
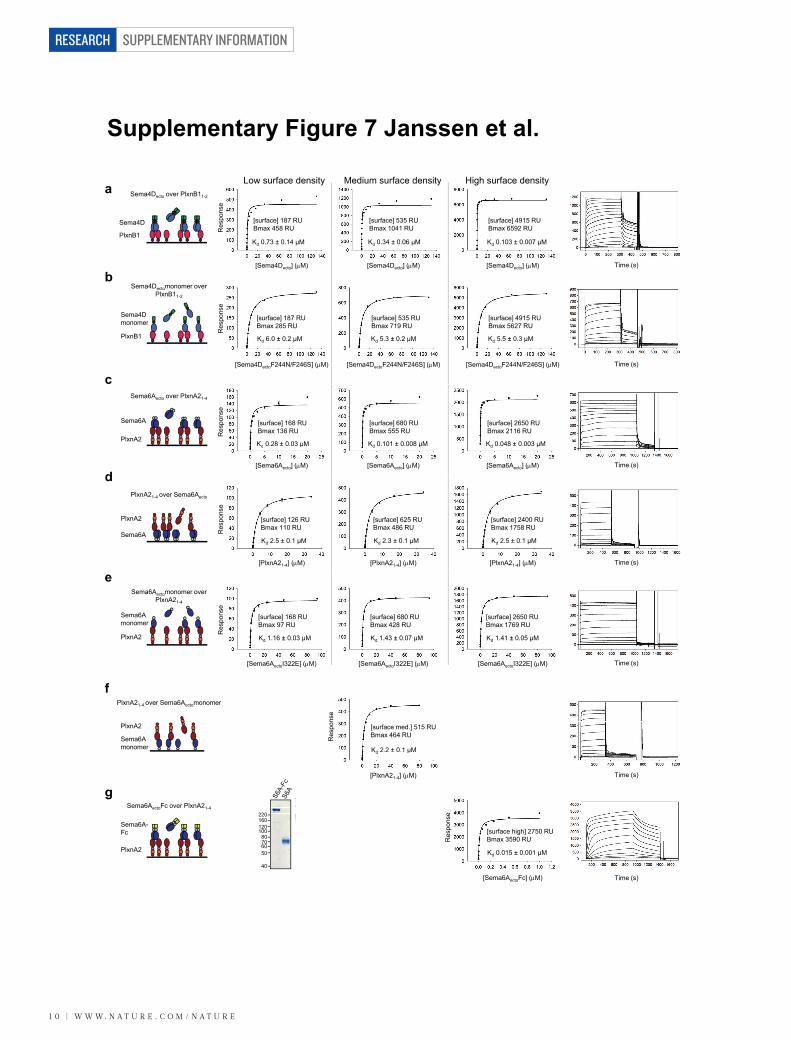
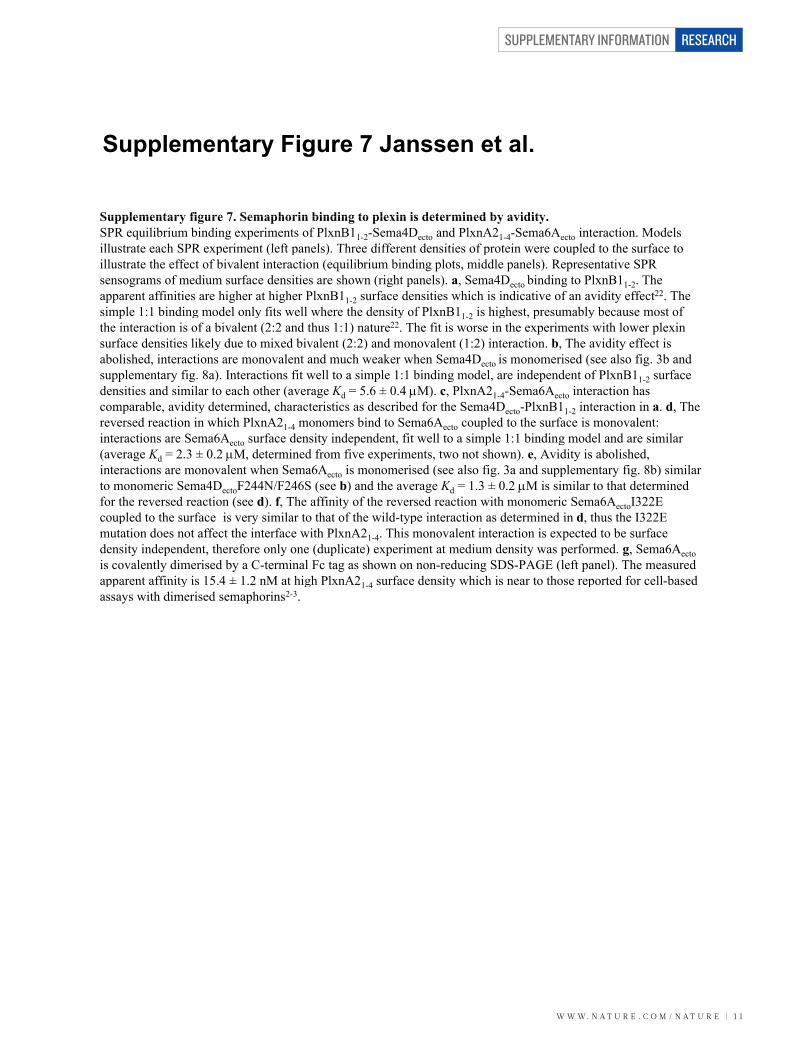
Supplementary figure 7 Semaphorin binding to plexin is determined by aviditySupplementary figure 7. Semaphorin binding to plexin is determined by avidity. SPR equilibrium binding experiments of PlxnB11-2-Sema4Decto and PlxnA21-4-Sema6Aecto interaction. Models illustrate each SPR experiment (left panels) Three different densities of protein were coupled to the surface toillustrate each SPR experiment (left panels). Three different densities of protein were coupled to the surface to illustrate the effect of bivalent interaction (equilibrium binding plots, middle panels). Representative SPR
f di f d iti h ( i ht l ) a S 4D bi di t Pl B1 Thsensograms of medium surface densities are shown (right panels). a, Sema4Decto binding to PlxnB11-2. The apparent affinities are higher at higher PlxnB11-2 surface densities which is indicative of an avidity effect22. The i l 1 1 bi di d l l fit ll h th d it f Pl B1 i hi h t bl b t fsimple 1:1 binding model only fits well where the density of PlxnB11-2 is highest, presumably because most of
the interaction is of a bivalent (2:2 and thus 1:1) nature22. The fit is worse in the experiments with lower plexin f d i i lik l d i d bi l (2 2) d l (1 2) i i b Th idi ff isurface densities likely due to mixed bivalent (2:2) and monovalent (1:2) interaction. b, The avidity effect is
abolished, interactions are monovalent and much weaker when Sema4Decto is monomerised (see also fig. 3b and supplementary fig. 8a). Interactions fit well to a simple 1:1 binding model, are independent of PlxnB11-2 surface densities and similar to each other (average Kd = 5.6 ± 0.4 M). c, PlxnA21-4-Sema6Aecto interaction has comparable, avidity determined, characteristics as described for the Sema4Decto-PlxnB11-2 interaction in a. d, The reversed reaction in which PlxnA21-4 monomers bind to Sema6Aecto coupled to the surface is monovalent: interactions are Sema6Aecto surface density independent, fit well to a simple 1:1 binding model and are similar (average Kd = 2.3 ± 0.2 M, determined from five experiments, two not shown). e, Avidity is abolished, interactions are monovalent when Sema6Aecto is monomerised (see also fig. 3a and supplementary fig. 8b) similar to monomeric Sema4DectoF244N/F246S (see b) and the average Kd = 1.3 ± 0.2 M is similar to that determined ecto ( ) g d for the reversed reaction (see d). f, The affinity of the reversed reaction with monomeric Sema6AectoI322E coupled to the surface is very similar to that of the wild-type interaction as determined in d, thus the I322E p y yp ,mutation does not affect the interface with PlxnA21-4. This monovalent interaction is expected to be surface density independent, therefore only one (duplicate) experiment at medium density was performed. g, Sema6Aectoy p , y ( p ) p y p g, ecto is covalently dimerised by a C-terminal Fc tag as shown on non-reducing SDS-PAGE (left panel). The measured apparent affinity is 15.4 ± 1.2 nM at high PlxnA21 4 surface density which is near to those reported for cell-basedapparent affinity is 15.4 1.2 nM at high PlxnA21-4 surface density which is near to those reported for cell based assays with dimerised semaphorins2-3.
SUPPLEMENTARY INFORMATION
1 2 | w w w. n a t u r e . c o m / n a t u r e
RESEARCH
Supplementary Figure 8 Janssen et al. pp y g
ba b89
10
12
14Sema6AectoI322E AUCSema4DectoF244N/F246S AUC
5678
S)8
10
S)
345C
(
4
6C(S
012
0
2
1 3 5 7 9Sed. coefficient (S)
1 3 5 7 9Sed. coefficient (S)
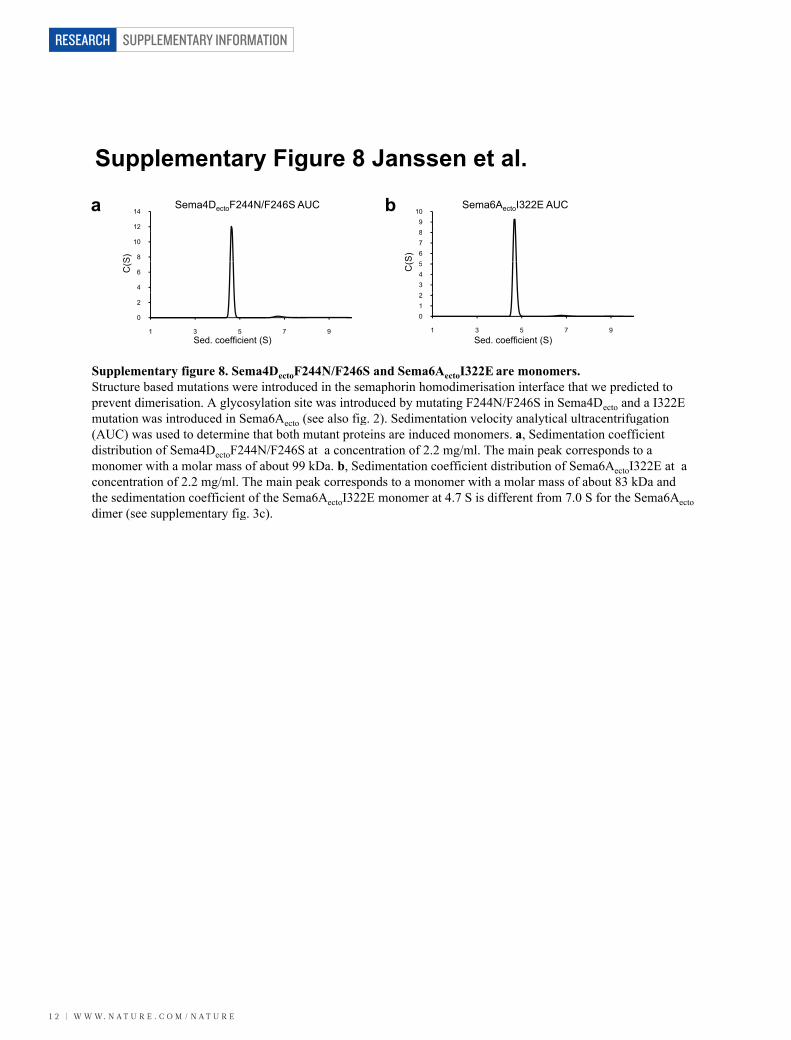
Supplementary figure 8. Sema4DectoF244N/F246S and Sema6AectoI322E are monomers.St t b d t ti i t d d i th h i h di i ti i t f th t di t d tStructure based mutations were introduced in the semaphorin homodimerisation interface that we predicted to prevent dimerisation. A glycosylation site was introduced by mutating F244N/F246S in Sema4Decto and a I322E
t ti i t d d i S 6A ( l fi 2) S di t ti l it l ti l lt t if timutation was introduced in Sema6Aecto (see also fig. 2). Sedimentation velocity analytical ultracentrifugation (AUC) was used to determine that both mutant proteins are induced monomers. a, Sedimentation coefficient di ib i f S 4 244 / 246S i f 2 2 / l h i k ddistribution of Sema4DectoF244N/F246S at a concentration of 2.2 mg/ml. The main peak corresponds to a monomer with a molar mass of about 99 kDa. b, Sedimentation coefficient distribution of Sema6AectoI322E at a concentration of 2.2 mg/ml. The main peak corresponds to a monomer with a molar mass of about 83 kDa and the sedimentation coefficient of the Sema6AectoI322E monomer at 4.7 S is different from 7.0 S for the Sema6Aecto dimer (see supplementary fig. 3c).
w w w. n a t u r e . c o m / n a t u r e | 1 3
SUPPLEMENTARY INFORMATION RESEARCH
Supplementary Figure 9 Janssen et al. pp y g
a[surface] 187 RU [surface] 535 RU [surface] 4915 RU
Low surface density Medium surface density High surface density
Res
pons
eKd ND
[surface] 187 RUBmax ND
Kd ND
[surface] 535 RUBmax ND
Kd ND
[surface] 4915 RUBmax NDSema4DectoK100D/
G101T over PlxnB11-2
[Sema4D K100D/G101T] (M) [Sema4D K100D/G101T] (M) [Sema4D K100D/G101T] (M) Time (s)[Sema4DectoK100D/G101T] (M) [Sema4DectoK100D/G101T] (M) [Sema4DectoK100D/G101T] (M)
b
Time (s)
Res
pons
e
Kd ND
[surface] 187 RUBmax ND
Kd ND
[surface] 535 RUBmax ND
Kd ND
[surface] 4915 RUBmax NDSema4DectoF181E/
L182R over PlxnB11-2
R Kd ND Kd ND Kd ND
[Sema4DectoF181E/L182R] (M) [Sema4DectoF181E/L182R] (M) [Sema4DectoF181E/L182R] (M) Time (s)
c
espo
nse
[surface] 187 RUBmax 301 RU
[surface] 535 RUBmax 749 RU
[surface] 4915 RUBmax 5392 RU
Sema4DectoK395Dover PlxnB11-2
Re
Kd 6.9 ± 0.7 µM Kd 3.0 ± 0.4 µM Kd 1.1 ± 0.1 µM
[Sema4DectoK395D] (M) [Sema4DectoK395D] (M) [Sema4DectoK395D] (M) Time (s)
d
spon
se
Kd 123 ± 70 µM
[surface] 188 RUBmax 206 RU
Kd 53 ± 7 µM
[surface] 570 RUBmax 365 RU
Kd 43 ± 3 µM
[surface] 4165 RUBmax 1002 RUSema4Decto over
PlxnB11-2D139K
d
Res
Kd 53 ± 7 µM Kd 43 ± 3 µM1-2
[Sema4Decto] (M) [Sema4Decto] (M) [Sema4Decto] (M) Time (s)
e
pons
e
[surface] 188 RU [surface] 570 RU [surface] 4165 RUSema4DectoK395D
over PlxnB1 D139K
e
Res
p
Kd 1.7 ± 0.3 µM
[ ]Bmax 349 RU
Kd 0.63 ± 0.08 µM
[ ]Bmax 1017 RU
Kd 0.40 ± 0.04 µM
[ ]Bmax 4823 RUover PlxnB11-2D139K
[Sema4DectoK395D] (M) [Sema4DectoK395D] (M) [Sema4DectoK395D] (M) Time (s)
f
onse
[surface] 178 RUBmax ND
[surface] 678 RUBmax ND
[surface] 2660 RUBmax NDSema6Aecto over
f
Res
po Kd ND Kd ND Kd NDPlxnA21-4F221R
[Sema6Aecto] (M) [Sema6Aecto] (M) [Sema6Aecto] (M) Time (s)
nse [surface] 179 RU [surface] 672 RU [surface] 2630 RUSema6Aecto over
g
Res
po
Kd ND
Bmax ND
Kd ND
Bmax ND
Kd ND
Bmax NDectoPlxnA21-4A396E
[Sema6Aecto] (M) [Sema6Aecto] (M) [Sema6Aecto] (M) Time (s)
h
Res
pons
e
[surface] 499 RUBmax 365 RU
PlxnA21-4 over Sema6AectoL191R
[PlxnA21-4] (M)
Kd 12.6 ± 0.4 µM
Time (s)
SUPPLEMENTARY INFORMATION
1 4 | w w w. n a t u r e . c o m / n a t u r e
RESEARCH
Supplementary Figure 9 Janssen et al. pp y g
i
e [surface] 168 RU
Low surface density Medium surface density High surface densityR
espo
nse
Kd 2.4 ± 0.2 µM
Bmax 99 RU
[surface] 680 RUBmax 457 RU
[surface] 2650 RUBmax 1941 RU
Sema6AectoK393Dover PlxnA21-4
[S 6A K393D] ( M) [S 6A K393D] ( M)
Kd 0.90 ± 0.06 µM
[S 6A K393D] ( M)
Kd 0.47 ± 0.03 µM
Ti ( )[Sema6AectoK393D] (M) [Sema6AectoK393D] (M) [Sema6AectoK393D] (M)
jTime (s)
[surface] 160 RU [surface] 678 RUB 462 RU
[surface] 2605 RUB 1471 RU
Res
pons
e
Kd 113 ± 4 µMBmax 164 RU
Kd 53 ± 1 µMBmax 462 RU
Kd 36 ± 1 µMBmax 1471 RU
Sema6Aecto over PlxnA21-4D193K
R
[Sema6Aecto] (M) [Sema6Aecto] (M) [Sema6Aecto] (M) Time (s)
k
spon
se [surface] 160 RUBmax 113 RU
[surface] 678 RUBmax 500 RU
[surface] 2605 RUBmax 1916 RU
Sema6AectoK393Dover PlxnA21 4D193K
Res
Kd 0.14 ± 0.01 µM Kd 0.050 ± 0.004 µM Kd 0.025 ± 0.002 µM
over PlxnA21-4D193K
[Sema6AectoK393D] (M) [Sema6AectoK393D] (M) [Sema6AectoK393D] (M) Time (s)
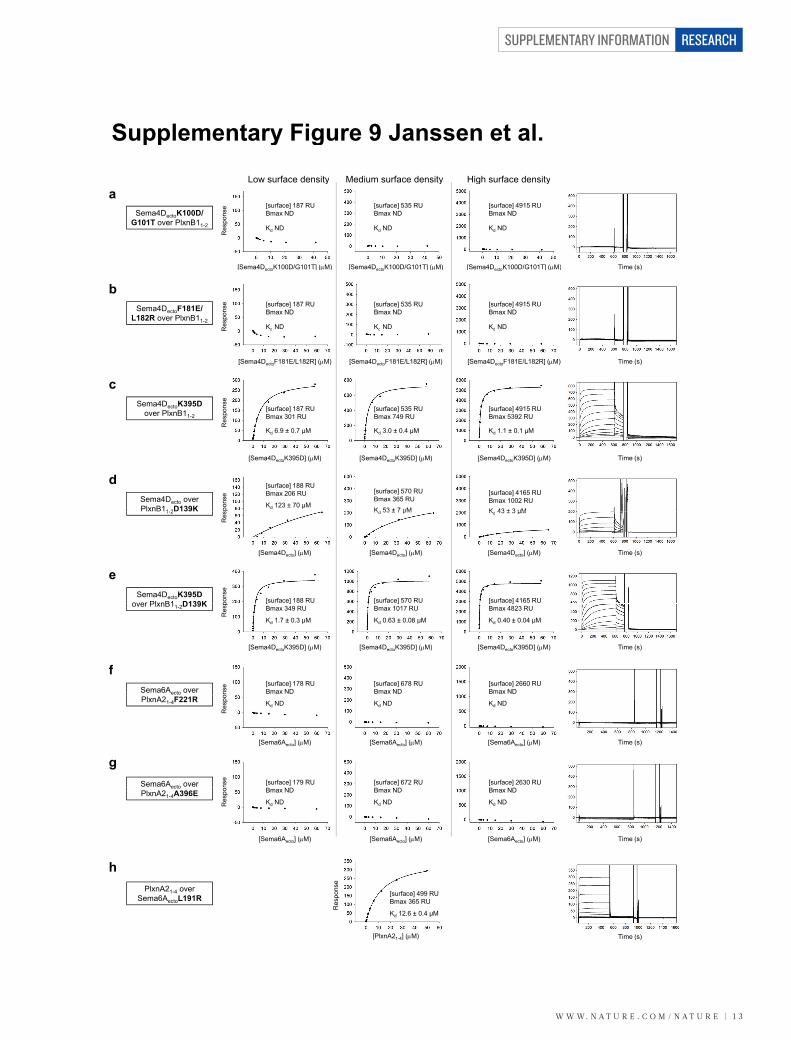
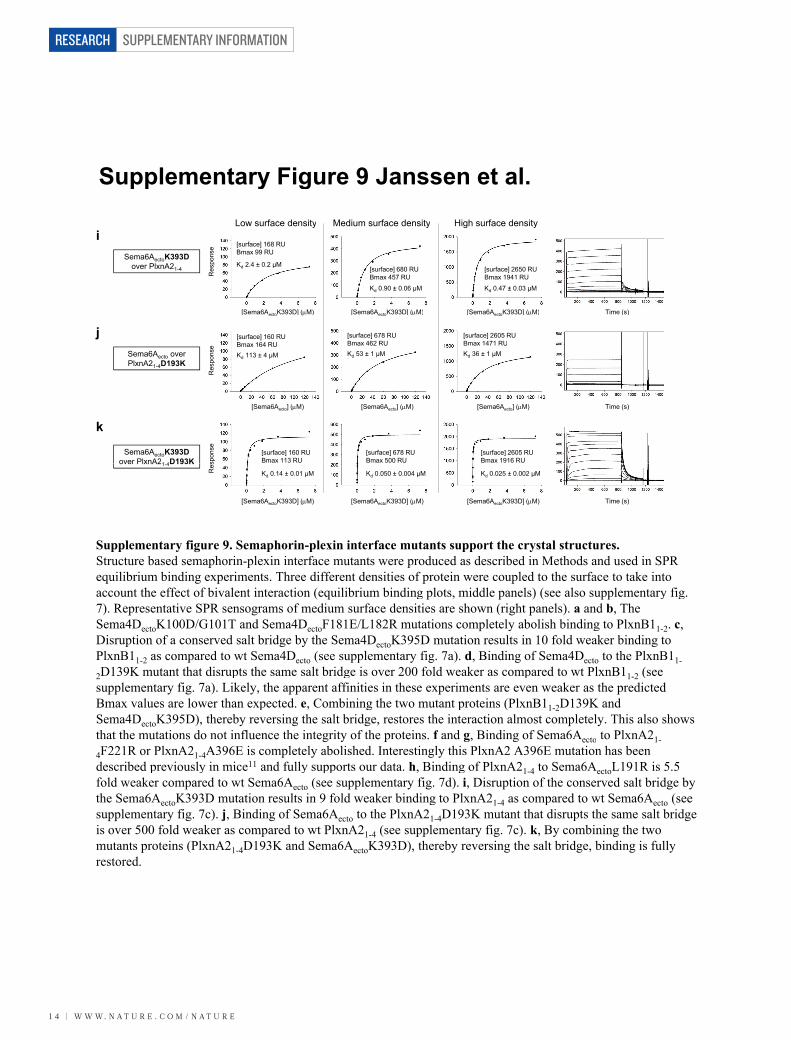
Supplementary figure 9. Semaphorin-plexin interface mutants support the crystal structures. Structure based semaphorin-plexin interface mutants were produced as described in Methods and used in SPR equilibrium binding experiments. Three different densities of protein were coupled to the surface to take into account the effect of bivalent interaction (equilibrium binding plots, middle panels) (see also supplementary fig. 7). Representative SPR sensograms of medium surface densities are shown (right panels). a and b, The Sema4DectoK100D/G101T and Sema4DectoF181E/L182R mutations completely abolish binding to PlxnB11-2. c, Disruption of a conserved salt bridge by the Sema4DectoK395D mutation results in 10 fold weaker binding to ectoPlxnB11-2 as compared to wt Sema4Decto (see supplementary fig. 7a). d, Binding of Sema4Decto to the PlxnB11-
2D139K mutant that disrupts the same salt bridge is over 200 fold weaker as compared to wt PlxnB11-2 (see 2 p g p 1 2 (supplementary fig. 7a). Likely, the apparent affinities in these experiments are even weaker as the predicted Bmax values are lower than expected. e, Combining the two mutant proteins (PlxnB11-2D139K and p , g p ( 1-2Sema4DectoK395D), thereby reversing the salt bridge, restores the interaction almost completely. This also shows that the mutations do not influence the integrity of the proteins. f and g, Binding of Sema6Aecto to PlxnA21e u o s do o ue ce e eg y o e p o e s. d g, d g o Se ecto o 1-
4F221R or PlxnA21-4A396E is completely abolished. Interestingly this PlxnA2 A396E mutation has been described previously in mice11 and fully supports our data. h, Binding of PlxnA21 4 to Sema6A t L191R is 5.5described previously in mice and fully supports our data. h, Binding of PlxnA21-4 to Sema6AectoL191R is 5.5 fold weaker compared to wt Sema6Aecto (see supplementary fig. 7d). i, Disruption of the conserved salt bridge by the Sema6A t K393D mutation results in 9 fold weaker binding to PlxnA21 4 as compared to wt Sema6A t (seethe Sema6AectoK393D mutation results in 9 fold weaker binding to PlxnA21-4 as compared to wt Sema6Aecto (see supplementary fig. 7c). j, Binding of Sema6Aecto to the PlxnA21-4D193K mutant that disrupts the same salt bridge is over 500 fold weaker as compared to wt PlxnA2 (see supplementary fig 7c) k By combining the twois over 500 fold weaker as compared to wt PlxnA21-4 (see supplementary fig. 7c). k, By combining the two mutants proteins (PlxnA21-4D193K and Sema6AectoK393D), thereby reversing the salt bridge, binding is fully restoredrestored.
w w w. n a t u r e . c o m / n a t u r e | 1 5
SUPPLEMENTARY INFORMATION RESEARCH
Supplementary Figure 10 Janssen et al. pp y g
ba bPlxnA21-10 MALS (S200 column)250 600
PlxnA21-8 SEC
0.24 mg/mlPeak concentration
200
kDa)
250
PlxnA21-10120160220kDa
PlxnA2
205kDa
400
500 0.52 mg/ml
0 044 / l
Peak concentration
u)0.078 mg/ml
0.020 mg/ml150
100mas
s (k
7080
100120 PlxnA21-8
66
97116
300
400 0.044 mg/ml
D. (
mA
u
100
50Mol
ar
50
6070
4555
66
100
200O.D
10.0 11.0 12.0 13.0 14.0 15.00
V l ( l)
40360
53 58 63 68
c PlxnB1 AUC70
Volume (ml) Volume (ml)
c PlxnB1cyto AUC60
70
Total protein conc.40
50
(S) 25 mg/ml
20
30C(
0
10
1 3 5 7 9Sed. coefficient (S)
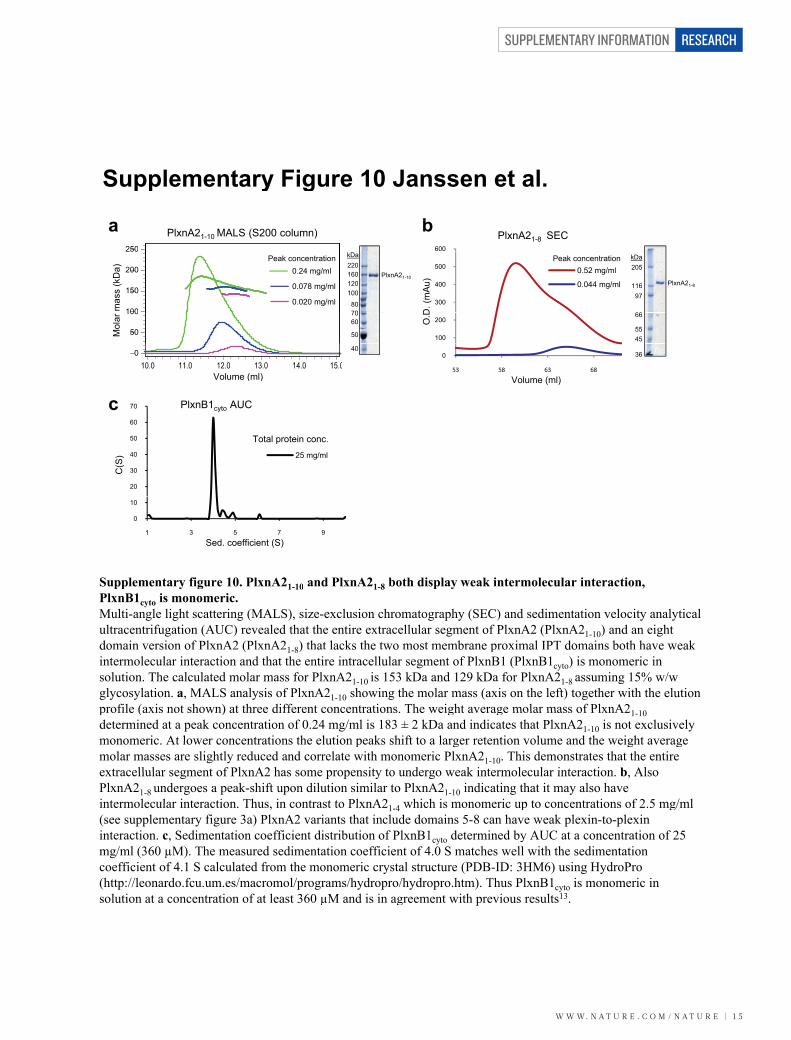
Supplementary figure 10. PlxnA21-10 and PlxnA21-8 both display weak intermolecular interaction, pp y g 1 10 1 8 p y ,PlxnB1cyto is monomeric.Multi-angle light scattering (MALS), size-exclusion chromatography (SEC) and sedimentation velocity analytical g g g ( ), g p y ( ) y yultracentrifugation (AUC) revealed that the entire extracellular segment of PlxnA2 (PlxnA21-10) and an eight domain version of PlxnA2 (PlxnA21 8) that lacks the two most membrane proximal IPT domains both have weak do a ve s o o ( 1-8) a ac s e wo os e b a e p o a do a s bo ave weaintermolecular interaction and that the entire intracellular segment of PlxnB1 (PlxnB1cyto) is monomeric in solution. The calculated molar mass for PlxnA21 10 is 153 kDa and 129 kDa for PlxnA21 8 assuming 15% w/wsolution. The calculated molar mass for PlxnA21-10 is 153 kDa and 129 kDa for PlxnA21-8 assuming 15% w/w glycosylation. a, MALS analysis of PlxnA21-10 showing the molar mass (axis on the left) together with the elution profile (axis not shown) at three different concentrations The weight average molar mass of PlxnA21 10profile (axis not shown) at three different concentrations. The weight average molar mass of PlxnA21-10determined at a peak concentration of 0.24 mg/ml is 183 ± 2 kDa and indicates that PlxnA21-10 is not exclusively monomeric At lower concentrations the elution peaks shift to a larger retention volume and the weight averagemonomeric. At lower concentrations the elution peaks shift to a larger retention volume and the weight average molar masses are slightly reduced and correlate with monomeric PlxnA21-10. This demonstrates that the entire extracellular segment of PlxnA2 has some propensity to undergo weak intermolecular interaction b Alsoextracellular segment of PlxnA2 has some propensity to undergo weak intermolecular interaction. b, Also PlxnA21-8 undergoes a peak-shift upon dilution similar to PlxnA21-10 indicating that it may also have intermolecular interaction Thus in contrast to PlxnA2 which is monomeric up to concentrations of 2 5 mg/mlintermolecular interaction. Thus, in contrast to PlxnA21-4 which is monomeric up to concentrations of 2.5 mg/ml (see supplementary figure 3a) PlxnA2 variants that include domains 5-8 can have weak plexin-to-plexin interaction c Sedimentation coefficient distrib tion of Pl nB1 determined b AUC at a concentration of 25interaction. c, Sedimentation coefficient distribution of PlxnB1cyto determined by AUC at a concentration of 25 mg/ml (360 µM). The measured sedimentation coefficient of 4.0 S matches well with the sedimentation
ffi i t f 4 1 S l l t d f th i t l t t (PDB ID 3HM6) i H d Pcoefficient of 4.1 S calculated from the monomeric crystal structure (PDB-ID: 3HM6) using HydroPro (http://leonardo.fcu.um.es/macromol/programs/hydropro/hydropro.htm). Thus PlxnB1cyto is monomeric in
l i i f l 360 M d i i i h i l 13solution at a concentration of at least 360 µM and is in agreement with previous results13.