Electronic Supplementary Information of -amyloid peptide ...S1 Electronic Supplementary Information...
16
S1 Electronic Supplementary Information Spiropyran-based fluorescent probe for specific detection of β-amyloid peptide oligomers in Alzheimer’s disease Guanglei Lv, a Anyang Sun* b , Peng Wei, a Ning Zhang, b Haichuang Lan, a and Tao Yi* a a Department of Chemistry and Collaborative Innovation Center of Chemistry for Energy Materials, Fudan University, Shanghai 200433, P. R. China b Laboratory of Neurodegenerative Diseases and and Molecular Imaging, Shanghai University of Medicine & Health Sciences, Shanghai 201318, P. R. China. Contents 1. Materials and general methods 2. Synthesis details of AN-SP 3. The measurement of K d 4. Preparation of Aβ aggregates and oligomers 5. AD transgenic mouse model 6. Colocalization of probe labeling and AD pathology in the transgenic mouse brain 7. Correlation of probe labeling and immunoblotting on blots 8. In vivo probe labeling and ex vivo imaging 9. Cytotoxicity assay 10. Computational methods 11. HPLC spectrum of AN-SP 12. Additional absorption and fluorescent spectra 13. Calculated binding model of the probes with Aβ oligomer 14. Toxicity of AN-SP and additional brain section images 15. Characteristics of the compounds Electronic Supplementary Material (ESI) for Chemical Communications. This journal is © The Royal Society of Chemistry 2016
Transcript of Electronic Supplementary Information of -amyloid peptide ...S1 Electronic Supplementary Information...
S1
Electronic Supplementary Information
Spiropyran-based fluorescent probe for specific detection of β-amyloid peptide oligomers in Alzheimer’s disease
Guanglei Lv,a Anyang Sun*b, Peng Wei,a Ning Zhang,b Haichuang Lan,a and Tao Yi*a
a Department of Chemistry and Collaborative Innovation Center of Chemistry for Energy Materials, Fudan University, Shanghai 200433, P. R. Chinab Laboratory of Neurodegenerative Diseases and and Molecular Imaging, Shanghai University of Medicine & Health Sciences, Shanghai 201318, P. R. China.
Contents1. Materials and general methods
2. Synthesis details of AN-SP
3. The measurement of Kd
4. Preparation of Aβ aggregates and oligomers
5. AD transgenic mouse model
6. Colocalization of probe labeling and AD pathology in the transgenic mouse brain
7. Correlation of probe labeling and immunoblotting on blots
8. In vivo probe labeling and ex vivo imaging
9. Cytotoxicity assay
10. Computational methods
11. HPLC spectrum of AN-SP
12. Additional absorption and fluorescent spectra
13. Calculated binding model of the probes with Aβ oligomer
14. Toxicity of AN-SP and additional brain section images
15. Characteristics of the compounds
Electronic Supplementary Material (ESI) for Chemical Communications.This journal is © The Royal Society of Chemistry 2016
S2
1. Materials and general methods
All of the starting materials were obtained from commercial suppliers and used as
received. Moisture sensitive reactions were performed under an atmosphere of dry
argon. Palladium acetate and (±)-2,2'-bis(diphenylphosphino)-1,1'-binaphthalene were
provided by Acros. Methyl 6-bromo-2-naphthoate and other chemicals were supplied
from J&K Scientific Ltd. Aβ (1-42) monomer was purchased from GL Biochem
(Shanghai) Ltd. Column chromatography was carried out on silica gel (200–300
mesh). 1H NMR (400 MHz) and 13C NMR (100 MHz) spectra were recorded on a
Mercury plus-Varian instrument. Proton chemical shifts are reported in parts per
million downfield from tetramethylsilane (TMS). HR-MS was obtained on an LTQ-
Orbitrap mass spectrometer (ThermoFIsher, San Jose, CA). UV-visible spectra were
recorded on a Shimadzu UV-2550 spectrometer. Steady-state emission experiments at
room temperature were measured on an Edinburgh instruments spectrometer (FS-920).
All the in vivo experiments were performed in compliance with the relevant laws and
institutional guidelines, and the institutional committees of both Fudan University and
Shanghai University of Medicine & Health Sciences have approved the experiments.
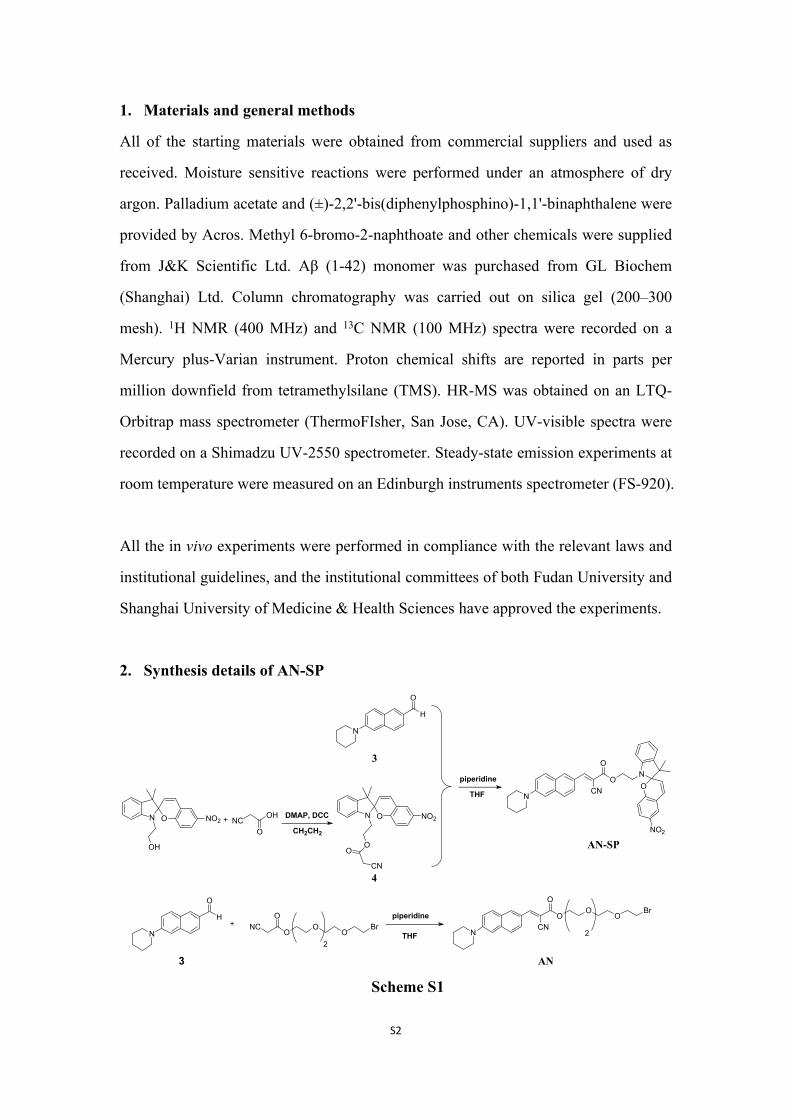
2. Synthesis details of AN-SP
N
O
H
3
piperidine
N
AN
OO
OCN
O
2
Br
NCO
OO
OBr
2
+THF
N O NO2
OH
NCOH
O
DMAP, DCC
CH2CH2
piperidine
N
OCN
O
N O NO2
OO
CN
NO
NO2
N
O
H
+
AN-SP
3
4
THF
Scheme S1
S3
Compound 3 was synthesized according to our previous report. 1
Synthesis of compound 4. To a mixture of 2-cyanoacetic acid (382.6 mg, 4.0 mmol)
and 1-(2-Hydroxyethyl)-3,3-dimethylindolino-6'-nitrobenzopyrylospiran (1.4 g, 4.0
mmol) in CH2Cl2 (2.5 mL), DMAP (4.9 mg, 0.04 mmol) was added dropwise at 0 °C.
Finally, DCC (206.3 mg, 4.5 mmol) was added and the reaction mixture was stirred at
0 °C for 6 hours. The reaction slurry was diluted with CH2Cl2 and was filtered. The
filtrate was dried over MgSO4 and concentrated under reduced pressure. The residue
was purified by silica gel flash chromatography (dichloromethane: acetone = 20: 1) to
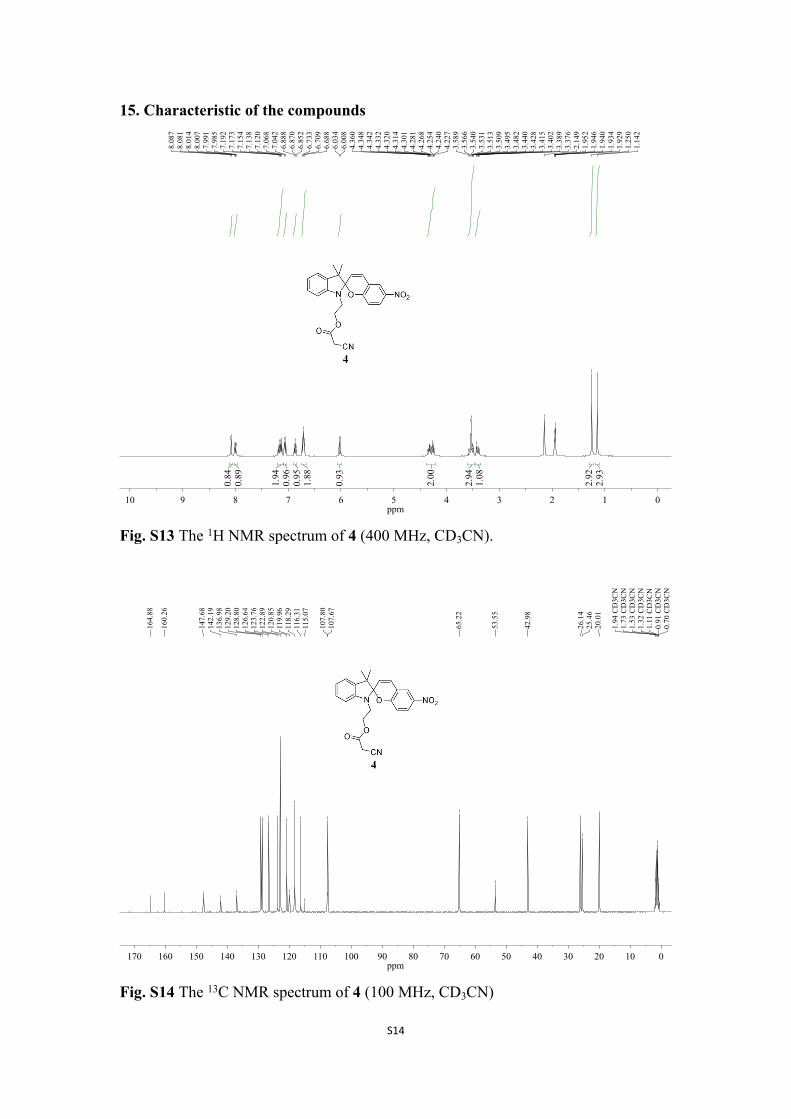
yield 4 as a red solid, 86% yield. 1H NMR (400 MHz, CD3CN) δ 8.08 (d, J = 2.4 Hz,
1H), 8.01 – 7.99 (m, 1H), 7.17 – 7.12 (m, 2H), 7.06 (d, J = 10.4 Hz, 1H), 6.87 (t, J =
7.2 Hz, 1H), 6.71 (t, J = 9.0 Hz, 2H), 6.02 (d, J = 10.4 Hz, 1H), 4.36 – 4.23 (m, 2H),
3.59 – 3.48 (m, 3H), 3.44 – 3.38 (m, 1H), 1.25 (s, 3H), 1.14 (s, 3H). 13C NMR (100
MHz, CD3CN) δ 164.88, 160.26, 147.68, 142.19, 136.98, 129.20, 128.80, 126.64,
123.76, 122.89, 120.85, 119.96, 116.31, 115.07, 107.80, 107.67, 65.22, 53.55, 42.98,
26.14, 25.46, 20.01.
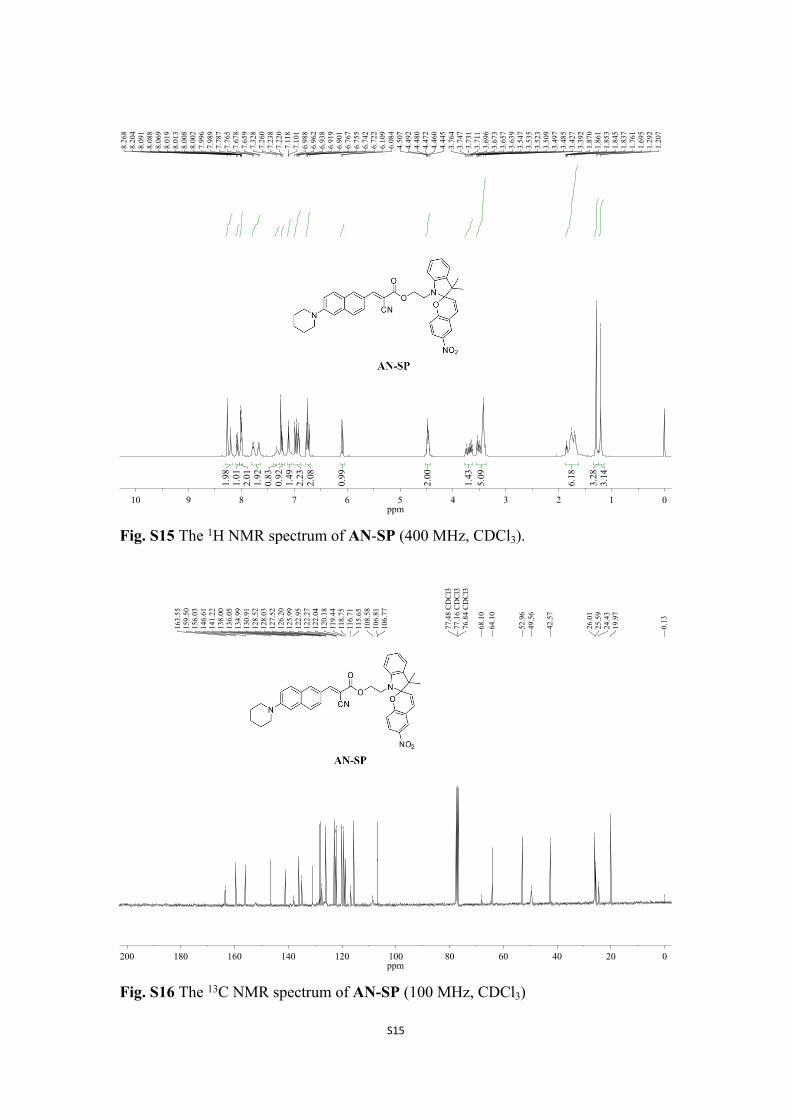
Synthesis of compound AN-SP. To the mixture of compound 3 (50.2 mg, 0.21 mmol)
and compound 4 (96.4 mg, 0.23 mmol) in THF, piperidine (2.0 μL, 0.02 mmol) was
added and the mixture was stirred at 50 oC for 6 hours. After completion, the crude
mixture was concentrated under reduced pressure and the product was obtained via
flash column chromatography (EtOAc: petroleum ether = 1: 5) as a red solid (83%
yield). 1H NMR (400 MHz, CDCl3) δ 8.26 (s, 1H),8.20 (s, 1H), 8.10 – 8.07 (m, 1H),
8.02 – 7.99 (m, 2H), 7.79 – 7.66 (m, 2H), 7.33 (s, 1H), 7.23 (d, J = 7.2 Hz, 1H), 7.11
(d, J = 6.8 Hz, 1H), 7.00 – 6.90 (m, 2H), 6.77 – 6.72 (m, 2H), 6.10 (d, J = 10.0 Hz,
1H), 3.76 – 3.64 (m, 2H), 3.78 – 3.62 (m, 1H), 3.55 – 3.49 (m, 5H), 1.87 – 1.70 (m,
6H), 1.29 (s, 3H), 1.21 (s, 3H).
13C NMR (100MHz, CDCl3) δ 163.55, 159.50, 156.03, 146.61, 141.22, 138.00,
136.05, 134.99, 130.91, 128.52, 128.03, 127.52, 126.20, 125.99, 122.95, 122.27,
122.04, 120.18, 119.44, 118.75, 116.71, 115.65, 108.58, 106.81, 106.77, 68.10, 64.10,
52.96, 49.56, 42.57, 26.01, 25.59, 24.43, 19.97.
S4
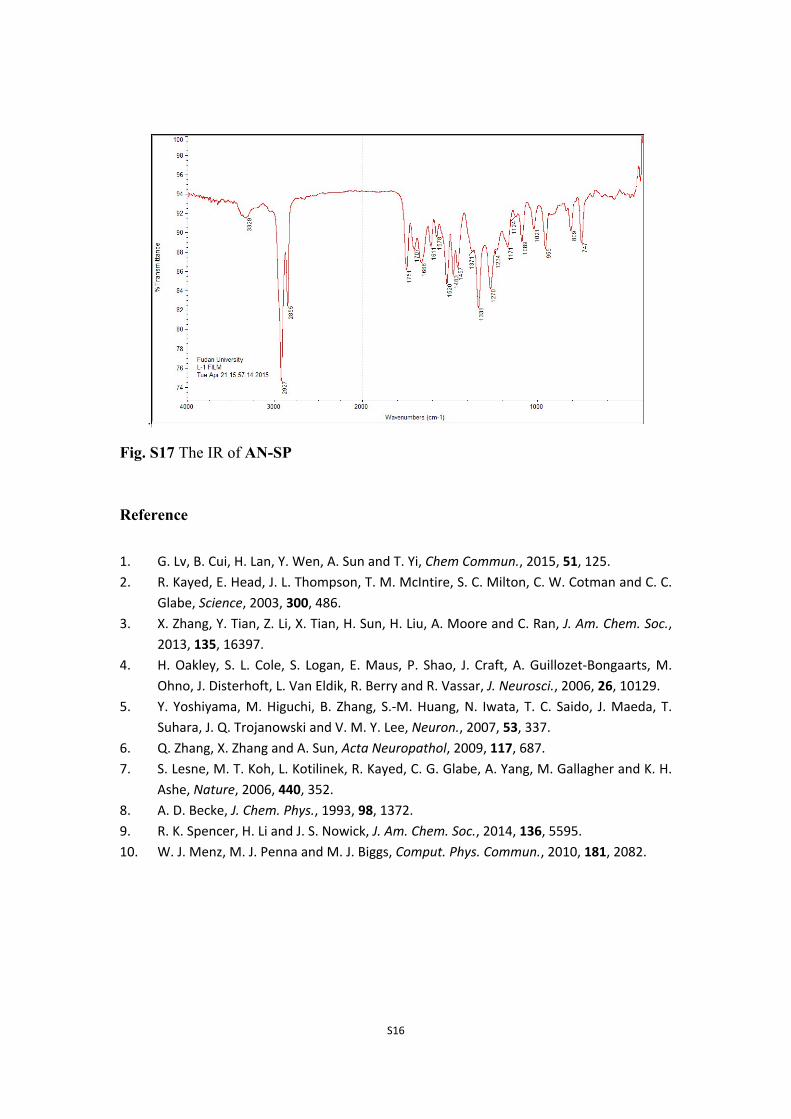
HRMS (ESI, m/z): calcd for C39H37N4O5 [M+H]+, 641.2764, found 641.2759.
IR (cm-1): 2925, 2854, 2217, 1723, 1578, 1483.
Synthesis of compound AN was depicted in our precious report.1
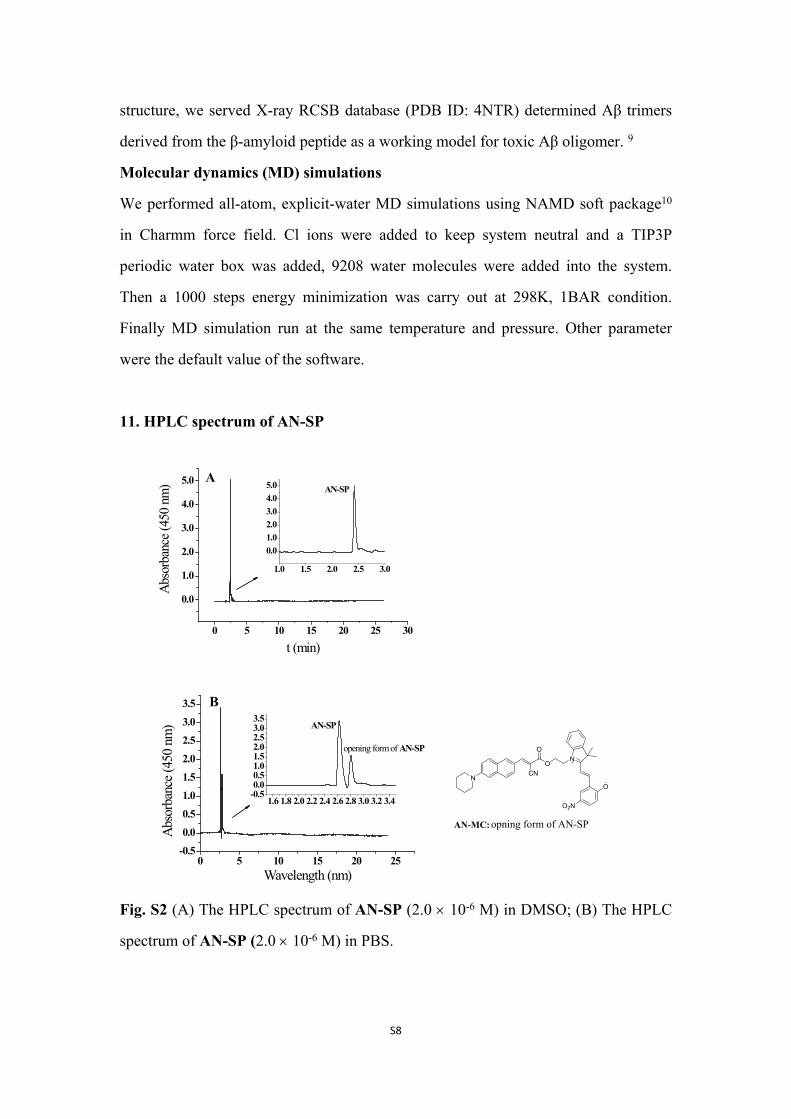
3. The measurement of Kd
The apparent binding constant (Kd) of AN-SP to Aβ oligomer (5 μM) was measured
from the double reciprocal of the fluorescence intensity maximum (Fmax) and the
concentration of the probe. The plot is shown in Fig. S3. The Kd corresponds to the -
1/(x-intercept) of the linear regression.
4. Preparation of Aβ aggregates, oligomer and monomer
Aβ aggregates and oligomer: Aβ (1-42) monomer was dissolved in PBS (pH = 7.31).
This solution was magnetically stirred at 1200 rpm for three days at room temperature.
Then pre- aggregated Aβ solution was obtained. The preparation of Aβ oligomer was
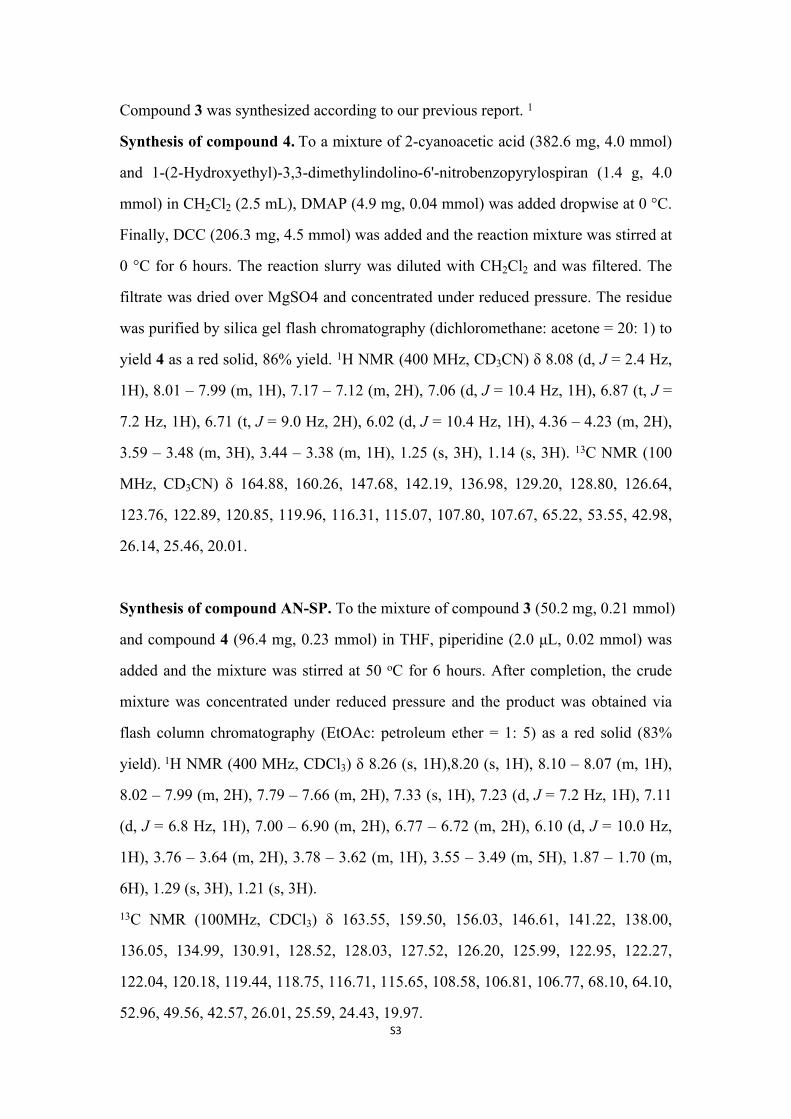
performed according to Kayed’s reported procedure 2 and confirmed by TEM (Fig.
S1).
Fig. S1 TEM (negative staining with PTA) of Aβ42 aggregates (A), Aβ42 oligomers
(B).
Aβ monomer: Aβ monomer was purchased from GL Biochem (Shanghai) Ltd and
further purified using HPLC. Purified monomer was stored in hexafluoroisopropanol.
10 μL of Aβ monomer in HFIP were dried with argon gas and then reconstituted in
1.0 mL of distilled water.3 This procedure is important for the following
measurements.
S5
5. AD transgenic mouse model
A triple transgenic model for Alzheimer's disease was used to examine the possible
co-localization of ANSP probe staining and Aβ or tau immunoreactivity. The triple
transgenic mice were generated by crossing 5XFAD transgenic mice with the tau
P301S single transgenic mice. The 5XFAD transgenic mice 4 and P301S tau
transgenic mice 5 were obtained from the Jackson Laboratory (Bar Harbor, Maine,
USA). To maintain on a C57BL/6J background, the original 5XFAD mice were
backcrossed to C57BL/6J mice for eight generations. These 5XFAD transgenic mice
overexpress both mutant human APP (695) with the Swedish (K670N, M671L),
Florida (I716V), and London (V717I) familial Alzheimer's disease (FAD) mutations
and human PS1 harboring two FAD mutations, M146L and L286V. Expression of
two transgenes is regulated by neural-specific elements of the mouse Thy1 promoter.
Mutant tau transgenic mice express the P301S mutant form of human microtubule-
associated protein tau with one N-terminal insert and four microtubule binding repeats,
under control of the mouse prion promoter. Mice were genotyped by PCR as
described previously Male or female mice at age of 9-10 months old were used in this
study. 6 Animals were handled in accordance with the NIH Guidelines for the Care
and Use of Laboratory Animals.
6. Colocalization of probe labeling and AD pathology in the transgenic mouse
brain
The brain tissue and immunofuorescent labeling were performed as previously
described.1 Mice were deeply anesthetized and transcardially perfused with PBS,
followed by 8% formadehyde (Sigma-Aldrich) in PBS (pH 7.4). The brains were
post-fixed and frozen-sectioned (14 μm thickness) with a microtome (Leica
Microsystems, GmbH, Wetzlar, Germany) for further analyses. Briefly, free-floating
sections were blocked in a blocking solution containing 10% goat serum, 1% BSA
and 0.4% Triton X-100. Incubation with primary antibodies took place overnight at
4°C. Then, one of following antibodies was employed each for colocalization studies:
S6
β-Amyloid oligomer-specific monoclonal antibody (Agirisera, Sweden), β-Amyloid
monoclonal antibody (Sigma-Aldrich), Aβ40 and Aβ42 polyclonal antibodies (Cell
Signaling), or conformation-dependent tau antibody MC1 (Peter Davies), at dilutions
from 1:400 to 1:100. After rinsing, sections were incubated in the solution of goat
anti-mouse or goat anti-rabbit secondary antibody conjugated with Alexa 488
(Molecular Probes, Carlsbad, CA, USA) for 2 h at room temperature. The images for
Aβ or tau immunofuorescent reactivity followed by AN-SP probe (40 μM) for Aβ
oligomers were taken sequentially using a microscope (BX51, Olympus, Japan)
equipped with a DP72 digital camera.
7. Correlation of probe labeling and immunoblotting on blotsFrozen cortical tissues of transgenic mice were homogenized (20 strokes with Dounce
tissue grinder) in 10× vol (w/v) of ice-cold extraction buffer (50 mM Tris-HCl, 150
mM NaCl, 0.3% Triton X-100, protease inhibitor cocktail, pH 7.6). Samples were
then centrifuged at 14,000 rpm for 15 min at 4°C, and the supernatants were
quantified for the protein concentration by bicinchoninic acid (BCA) method (Pierce,
Rockford, IL, USA). Protein samples were then portioned into aliquots and stored at
−80°C until used. 7
Extracted protein samples in a buffer without β-mercaptoethanol were separated on 12%
SDS-PAGE gels, and transferred to nitrocellulose membranes (Bio-Rad). The
membranes were firstly imaged with EC3 Imaging System (UVP BioImaging System,
USA) before and after probing with AN-SP at 10 μM for 5 min. Then membranes
were blocked for 1 h at room temperature in TBST buffer containing 5% skim milk,
and subsequently probed with 6E10 monoclonal antibody (1:3,000, Covance
Princeton, NJ, USA) or -amyloid polyclonal antibodies (1:5,000, Cell Signaling,
Danvers, MA, USA). The Aβ immunoreactivity was detected with horseradish
peroxidase conjugated secondary antibody, and visualized with the enhanced
chemiluminescence method.
S7
8. In vivo probe labeling and ex vivo imaging
In vivo probe labeling was performed using both 5XFAD transgenic mice and the
triple transgenic mice at ages 8-10 months. Mice were injected intraperitoneally with
AN-SP probe (20 μmol/kg) 12 hours and/or 2 hours before brain tissues were
collected. At the specific time points following SP injection, the mice were deeply
anesthetized and brain tissues were processed and imaged as described above.
9. Cytotoxicity Assay MTT assay
The cytotoxicity was performed by 3-(4,5-dimethylthiazol-2-yl) -2,5-
diphenyltetrazolium bromide (MTT) assay with Hela and RAW cell lines. Cells
growing in log phase were planted into a 96-well cell culture plate at 1 × 10⁵/ well.
The cells were incubated for 12 h at 37oC under 5% CO2 in an incubator. A solution
of ANSP (100.0 μL/well) at concentrations of 1.0, 2.5, 5.0, 10.0, 25.0, 50.0, 100.0 μM
in nutrient with 10‰ DMSO was added to the wells of the treatment group,
respectively. The cells were subsequently incubated for 6 h and 12 h at 37 oC under 5%
CO2. Thereafter, MTT (0.5 mg/mL) was added to each well and the plate was
incubated for an additional 4 h at 37 oC under 5% CO2. The optical density OD490
value (Abs.) of each well was measured by means of a Tecan Infinite M200
monochromator-based multifunction microplate reader, which was used as cell
viability.
10. Computational Methods
Quantum mechanical calculations
The geometry optimization for AN-SP compound was performed by using density
functional theory at the B3LYP/6-31G* level 8 at the gas phase using Gaussian 09
program3.
Molecular docking search
AN-SP docking search with Aβ oligomer were executed by using Autodock vina1.1.2
software package. The docking simulations were carried out with a box centered on
the Aβ oligomer and employing 50 × 50 × 50 grid points. For the Aβ oligomer
S8
structure, we served X-ray RCSB database (PDB ID: 4NTR) determined Aβ trimers
derived from the β-amyloid peptide as a working model for toxic Aβ oligomer. 9
Molecular dynamics (MD) simulations
We performed all-atom, explicit-water MD simulations using NAMD soft package10
in Charmm force field. Cl ions were added to keep system neutral and a TIP3P
periodic water box was added, 9208 water molecules were added into the system.
Then a 1000 steps energy minimization was carry out at 298K, 1BAR condition.
Finally MD simulation run at the same temperature and pressure. Other parameter
were the default value of the software.
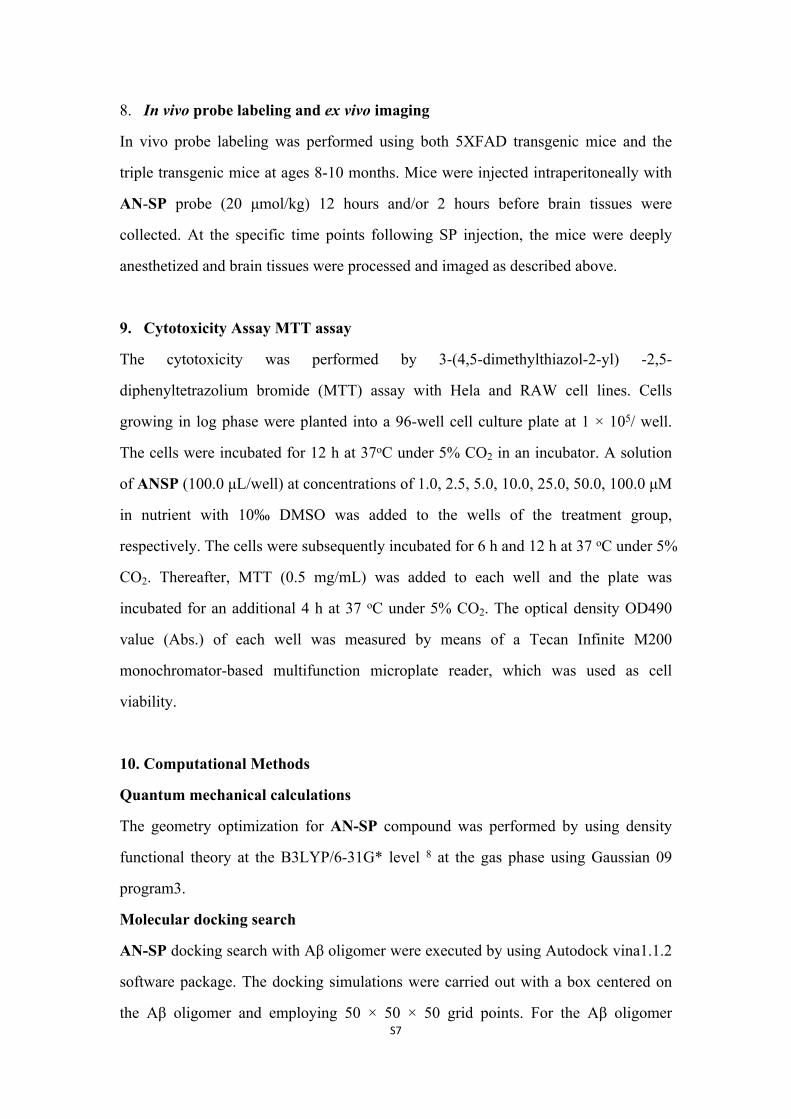
11. HPLC spectrum of AN-SP
0 5 10 15 20 25 30
0.0
1.0
2.0
3.0
4.0
5.0
1.0 1.5 2.0 2.5 3.0
0.01.02.03.04.05.0
Abso
rban
ce (4
50 n
m)
t (min)
AAN-SP
0 5 10 15 20 25-0.5
0.0
0.5
1.0
1.5
2.0
2.5
3.0
3.5
1.6 1.8 2.0 2.2 2.4 2.6 2.8 3.0 3.2 3.4-0.50.00.51.01.52.02.53.03.5
Abso
rban
ce (4
50 n
m)
Wavelength (nm)
BAN-SP
opening form of AN-SP
Fig. S2 (A) The HPLC spectrum of AN-SP (2.0 10-6 M) in DMSO; (B) The HPLC
spectrum of AN-SP (2.0 10-6 M) in PBS.
N
OCN
ON
AN-MC:
O
O2N
opning form of AN-SP
S9
12. Additional absorption and fluorescent spectra
450 500 550 600 650 700 750 8000.0
0.2
0.4
0.6
0.8
1.0
Fl In
tens
ity (a
. u.)
Wavelength (nm)
AN-SP AN-SP+aggregated Amylin AN-SP+aggregated Prion AN-SP+A oligomer
a
450 500 550 600 650 700 750 8000.0
0.2
0.4
0.6
0.8
1.0
FL In
tens
ity (a
. u.)
Wavelength (nm)
AN-SP+prion+oligomer AN-SP+AB-aggregate AN-SP AN-SP+aggregate+oligomer AN-SP+amylin AN-SP+amylin+oligomer AN-SP+prion
b
Fig. S3 (a) Fluorescence spectra of AN-SP (2.0 10-6 M, 5% DMSO in PBS) and with Aβ-oligomer (5.0 10-6 M) and other aggregated peptides (aggregated amylin and aggregated prion, 5.0 10-
6 M). (b) Fluorescence spectral change of AN-SP (2.0 10-6 M, 5% DMSO in PBS) when Aβ oligomers were added to the solution of prion and amylin with AN-SP.
0.08 0.12 0.16 0.20 0.24
1.00
1.05
1.10
1.15
1.20
1/Fm
ax(a
.u)
Equation y = a + b*xAdj. R-Square 0.95339
Value Standard ErrorB Intercept 0.84431 0.03099B Slope 1.43063 0.18116
CAN-SP-1/M-1
Fig. S4 Determination of the apparent binding constant (Kd) of probe (R2=0.95) to Aβ
oligomer.
450 500 550 600 650 700 750 8000.0
0.2
0.4
0.6
0.8
1.0
Fluo
resc
ence
Inte
nsity
(a.u
.)
Wavelength (nm)
0 h 6 h 12 h 48 h 72 h
A
450 500 550 600 650 700 7500.0
0.2
0.4
0.6
0.8
1.0
Fluo
resc
ence
Inte
nsity
(a.u
.)
Wavelength (nm)
AN AN- A aggregate AN- A oligomer AN- A monomer
B
Fig. S5 Fluorescence spectral change of (A) AN-SP (2.0 10-6 M, 5% DMSO in PBS) with different incubation time of Aβ oligomer (5.0 10-6 M) and (B) AN (2.0 10-6 M, 5% DMSO in PBS) with Aβ aggregate, monomer, and oligomer (5.0 10-6 M). λex=430 nm.
S10
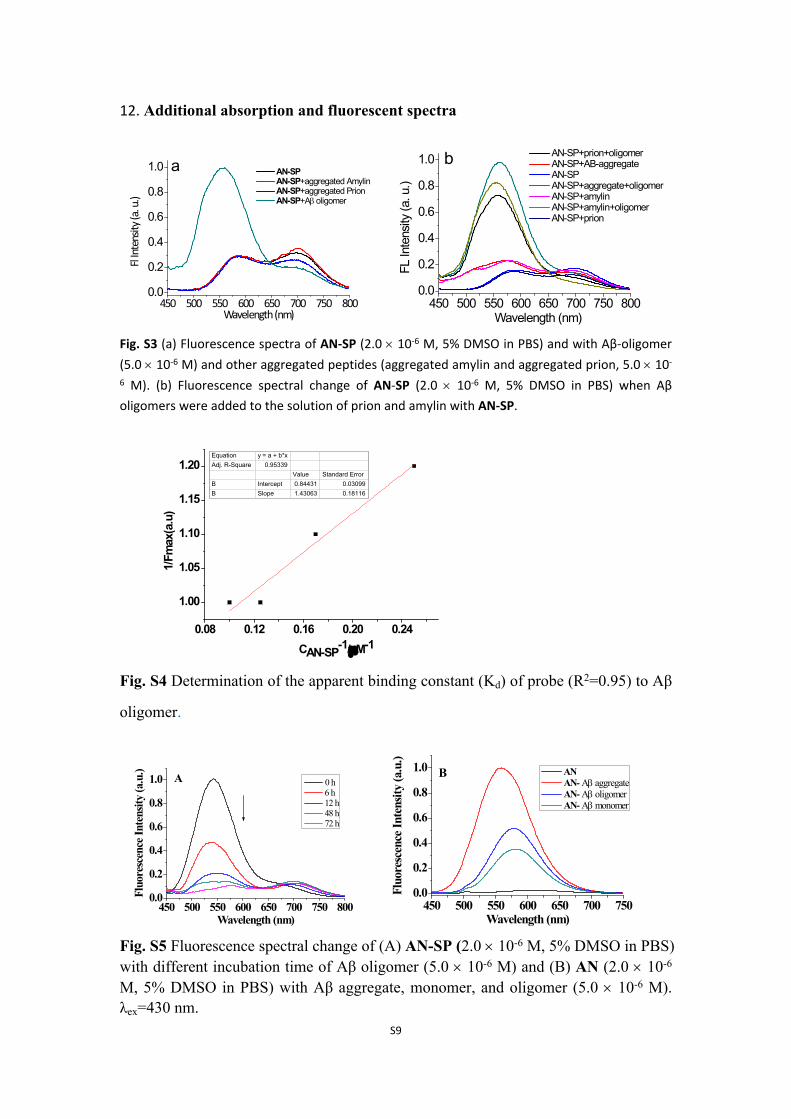
13. Calculated binding model of the probes with Aβ oligomer
A B
C DFig. S6 The HOMO (A) and LUMO (B) level of AN-SP
BA
Fig. S7 Hydrophobic domain of the Aβ trimer
S11
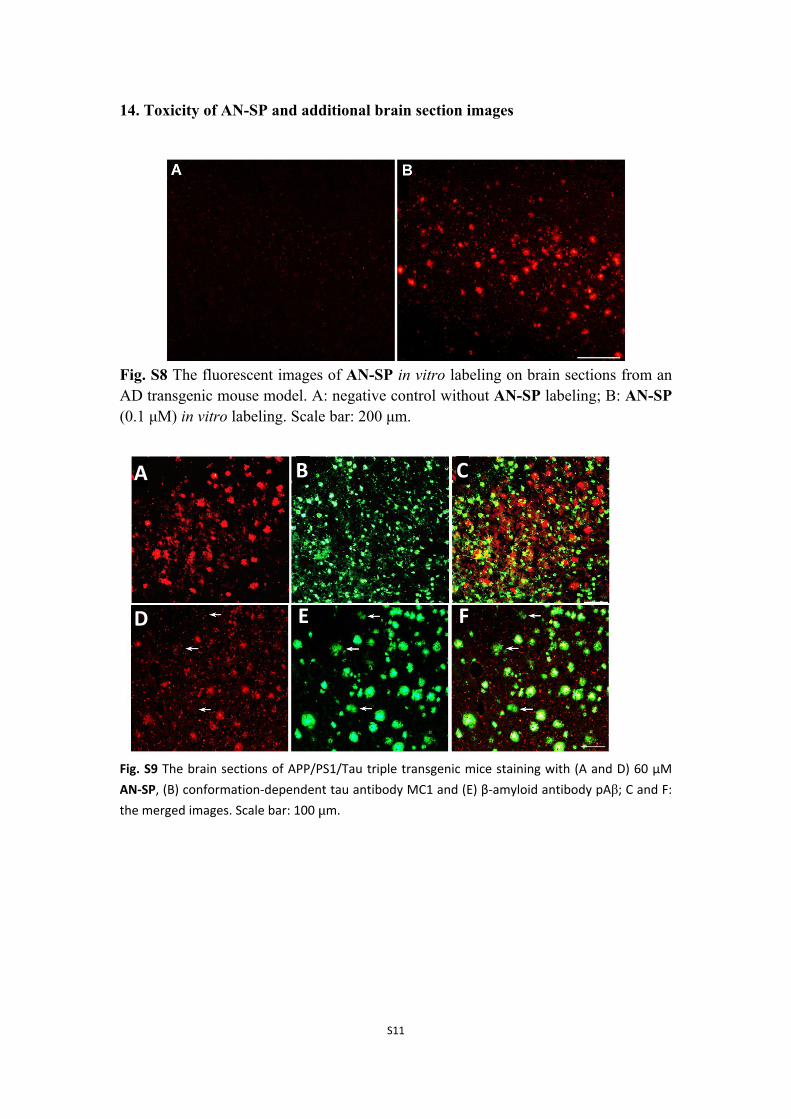
14. Toxicity of AN-SP and additional brain section images
Fig. S8 The fluorescent images of AN-SP in vitro labeling on brain sections from an AD transgenic mouse model. A: negative control without AN-SP labeling; B: AN-SP (0.1 μM) in vitro labeling. Scale bar: 200 μm.
A B C
D E F
Fig. S9 The brain sections of APP/PS1/Tau triple transgenic mice staining with (A and D) 60 μM AN-SP, (B) conformation-dependent tau antibody MC1 and (E) β-amyloid antibody pAβ; C and F: the merged images. Scale bar: 100 μm.
S12
0
20
40
60
80
100
120
Cell
Viab
ility
(%)
Hela-6h RAW-6h Hela-12h RAW-12h
Concentration (M)0 1 5 10 252.5 50 100
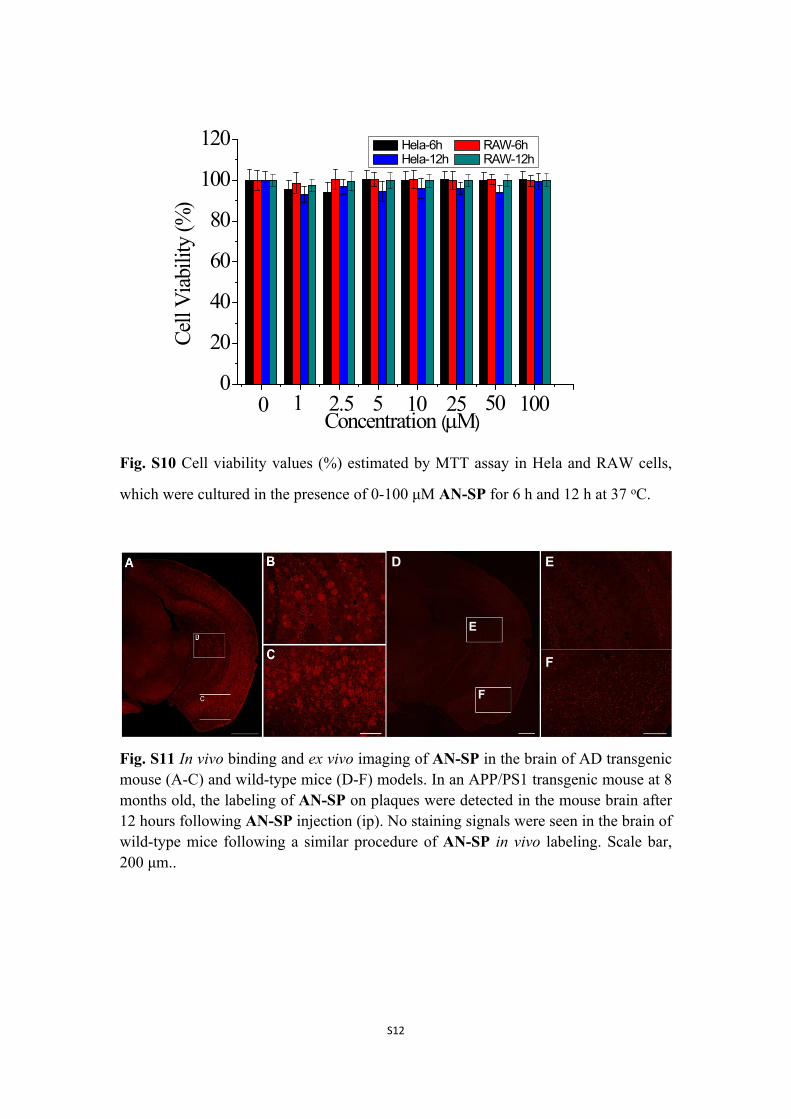
Fig. S10 Cell viability values (%) estimated by MTT assay in Hela and RAW cells,
which were cultured in the presence of 0-100 μM AN-SP for 6 h and 12 h at 37 oC.
D E
F
E
F
Fig. S11 In vivo binding and ex vivo imaging of AN-SP in the brain of AD transgenic mouse (A-C) and wild-type mice (D-F) models. In an APP/PS1 transgenic mouse at 8 months old, the labeling of AN-SP on plaques were detected in the mouse brain after 12 hours following AN-SP injection (ip). No staining signals were seen in the brain of wild-type mice following a similar procedure of AN-SP in vivo labeling. Scale bar, 200 μm..
S13
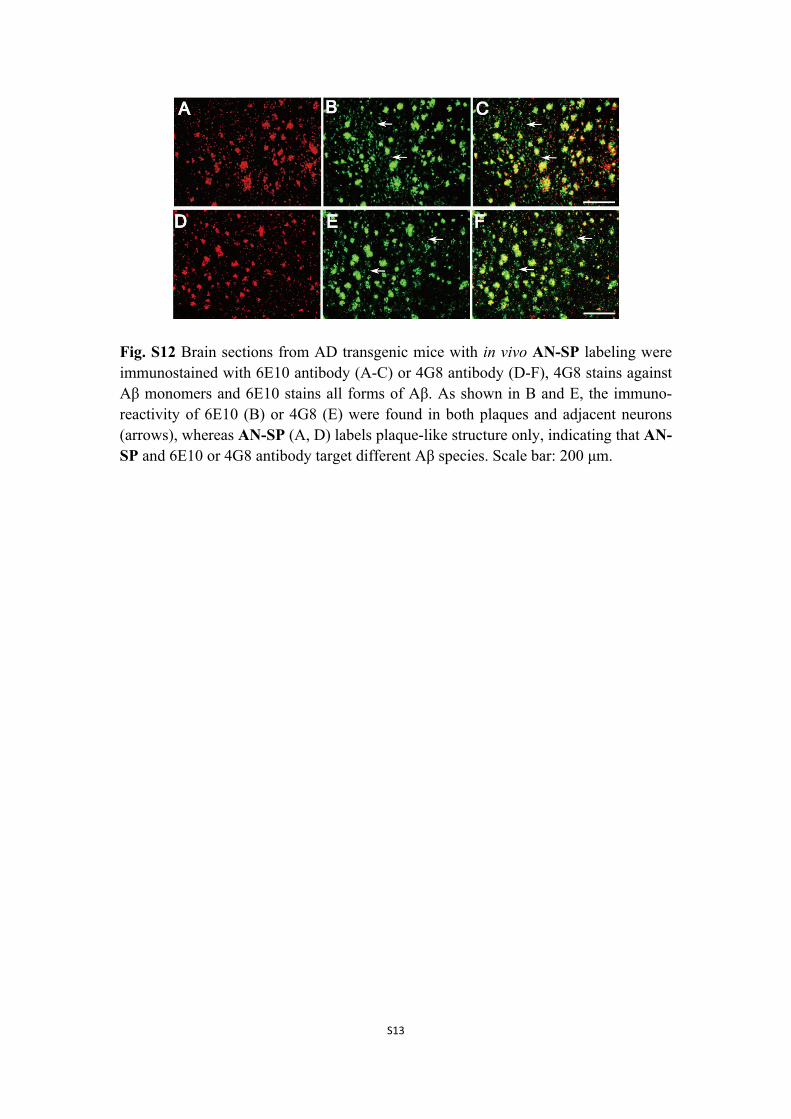
Fig. S12 Brain sections from AD transgenic mice with in vivo AN-SP labeling were immunostained with 6E10 antibody (A-C) or 4G8 antibody (D-F), 4G8 stains against Aβ monomers and 6E10 stains all forms of Aβ. As shown in B and E, the immuno-reactivity of 6E10 (B) or 4G8 (E) were found in both plaques and adjacent neurons (arrows), whereas AN-SP (A, D) labels plaque-like structure only, indicating that AN-SP and 6E10 or 4G8 antibody target different Aβ species. Scale bar: 200 μm.
S14
15. Characteristic of the compounds
Fig. S13 The 1H NMR spectrum of 4 (400 MHz, CD3CN).
Fig. S14 The 13C NMR spectrum of 4 (100 MHz, CD3CN)
S15
Fig. S15 The 1H NMR spectrum of AN-SP (400 MHz, CDCl3).
Fig. S16 The 13C NMR spectrum of AN-SP (100 MHz, CDCl3)
S16
.
Fig. S17 The IR of AN-SP
Reference
1. G. Lv, B. Cui, H. Lan, Y. Wen, A. Sun and T. Yi, Chem Commun., 2015, 51, 125.2. R. Kayed, E. Head, J. L. Thompson, T. M. McIntire, S. C. Milton, C. W. Cotman and C. C.
Glabe, Science, 2003, 300, 486.3. X. Zhang, Y. Tian, Z. Li, X. Tian, H. Sun, H. Liu, A. Moore and C. Ran, J. Am. Chem. Soc.,
2013, 135, 16397.4. H. Oakley, S. L. Cole, S. Logan, E. Maus, P. Shao, J. Craft, A. Guillozet-Bongaarts, M.
Ohno, J. Disterhoft, L. Van Eldik, R. Berry and R. Vassar, J. Neurosci., 2006, 26, 10129.5. Y. Yoshiyama, M. Higuchi, B. Zhang, S.-M. Huang, N. Iwata, T. C. Saido, J. Maeda, T.
Suhara, J. Q. Trojanowski and V. M. Y. Lee, Neuron., 2007, 53, 337.6. Q. Zhang, X. Zhang and A. Sun, Acta Neuropathol, 2009, 117, 687.7. S. Lesne, M. T. Koh, L. Kotilinek, R. Kayed, C. G. Glabe, A. Yang, M. Gallagher and K. H.
Ashe, Nature, 2006, 440, 352.8. A. D. Becke, J. Chem. Phys., 1993, 98, 1372.9. R. K. Spencer, H. Li and J. S. Nowick, J. Am. Chem. Soc., 2014, 136, 5595.10. W. J. Menz, M. J. Penna and M. J. Biggs, Comput. Phys. Commun., 2010, 181, 2082.


![5 Amyloid β-Peptide(1-42), Oxidative Stress, and Alzheimer ... · by vitamin E [16]. ... To test this hypothesis, we ... Amyloid β-Peptide(1-42), Oxidative Stress, and Alzheimer’s](https://static.fdocument.org/doc/165x107/5ad2ff3f7f8b9a05208d5d78/5-amyloid-peptide1-42-oxidative-stress-and-alzheimer-vitamin-e-16.jpg)