SS433’s accretion disc, wind and jets: before, during and after … · The “moving” H α jet...
11
arXiv:1104.2917v1 [astro-ph.GA] 14 Apr 2011 Mon. Not. R. Astron. Soc. 000, 000–000 (0000) Printed 20 June 2018 (MN L A T E X style file v2.2) SS433’s accretion disc, wind and jets: before, during and after a major flare Katherine M. Blundell 1 , Linda Schmidtobreick 2 and Sergei Trushkin 3 1 University of Oxford, Astrophysics, Keble Road, Oxford OX1 3RH 2 European Southern Observatory, Vitacura, Alonso de Cordova, Santiago, Chile 3 Special Astrophysical Observatory RAS, Karachaevo-Cherkassian Republic, Nizhnij Arkhyz 36916, Russia 20 June 2018 ABSTRACT The Galactic microquasar SS433 occasionally exhibits a major flare when the intensity of its emission increases significantly and rapidly. We present an analysis of high-resolution, almost-nightly optical spectra obtained before, during and after a major flare, whose complex emission lines are deconstructed into single gaussians and demonstrate the different modes of mass loss in the SS433 system. During our monitoring, an initial period of quiescence was followed by increased activity which culminated in a radio flare. In the transition period the accretion disc of SS433 became visible in Hα and He I emission lines and remained so until the observations were terminated; the line-of-sight velocity of the centre of the disc lines during this time behaved as though the binary orbit has significant eccentricity rather than being circular, consistent with three recent lines of evidence. After the accretion disc appeared its rotation speed, as measured by the separation of the Hα disc emission lines, increased steadily from 500 km/s to 700 km/s. The launch speed of the jets first decreased then suddenly increased. At the same time as the jet launch speed increased, the wind from the accretion disc doubled in speed. Two days afterwards, the radio flux exhibited a flare. These data suggest that a massive ejection of material from the companion star loaded the accretion disc and the system responded with mass loss via different modes that together comprise the flare phenomena. We find that archival data reveal similar behaviour, in that when the measured jet launch speed exceeds 0.29 c this is invariably simultaneous with, or a few days before, a radio flare. Thus we surmise that a major flare consists of the overloading of the accretion disc, resulting in the speeding up of the H-alpha rotation disc lines, followed by enhanced mass loss not just via its famous jets at higher-than-usual speeds but also directly from its accretion disc’s wind. Key words: stars: individual: SS433 — stars: winds, outflows — accretion, accretion discs 1 INTRODUCTION The Galactic microquasar SS433 is famous for its continual ejection of plasma collimated in two oppositely-directed jets launched at speeds that average over time to one quarter of the speed of light. The system is a binary with a period of 13.08 days (Crampton, Cowley & Hutchings 1980) that eclipses at both oppositions (e.g. Goranskii et al. 1998). There is evidence that He II 4486 ˚ A emission has been observed from the base of the jets (Crampton & Hutchings 1981; Fabrika & Bychkova 1990) and C II lines orbiting with the compact object have been de- tected (Gies et al 2002). The accretion disc is not always re- vealed by optical observations (although see Falomo et al. 1987; Perez & Blundell 2010) but the signature of the accretion disc, namely a widely-separated pair of emission lines, appears to be prominent in the near infra-red (Perez & Blundell 2009). The sys- tem is rather massive with the compact object and disc having a mass of ∼16 M⊙ and the companion star having ∼24 M⊙. See Blundell, Bowler & Schmidtobreick (2008); Fabrika (2004) for a historic review. In August 2004 a campaign of nightly observations of SS433 was initiated with the NTT 3.5-m telescope on La Silla, Chile 1 . The observations continued until early November. There were few gaps in the coverage and this sequence of nightly observations reveal very rich behaviour in this microquasar. The results obtained on the relativistic jets (Blundell, Bowler & Schmidtobreick 2007) and on the properties of the stationary emission lines during the first half of the series of observations (Blundell, Bowler & Schmidtobreick 2008) have already been published. This paper is concerned with 1 Based on observations collected at the European Organisation for Astro- nomical Research in the Southern Hemisphere, Chile (Program ID: 273.C- 5050) c 0000 RAS
Transcript of SS433’s accretion disc, wind and jets: before, during and after … · The “moving” H α jet...
arX
iv:1
104.
2917
v1 [
astr
o-ph
.GA
] 14
Apr
201
1Mon. Not. R. Astron. Soc.000, 000–000 (0000) Printed 20 June 2018 (MN LATEX style file v2.2)
SS433’s accretion disc, wind and jets: before, during and after amajor flare
Katherine M. Blundell1, Linda Schmidtobreick2 and Sergei Trushkin3
1University of Oxford, Astrophysics, Keble Road, Oxford OX13RH2European Southern Observatory, Vitacura, Alonso de Cordova, Santiago, Chile3Special Astrophysical Observatory RAS, Karachaevo-Cherkassian Republic, Nizhnij Arkhyz 36916, Russia
20 June 2018
ABSTRACTThe Galactic microquasar SS433 occasionally exhibits a major flare when the intensity ofits emission increases significantly and rapidly. We present an analysis of high-resolution,almost-nightly optical spectra obtained before, during and after a major flare, whose complexemission lines are deconstructed into single gaussians anddemonstrate the different modesof mass loss in the SS433 system. During our monitoring, an initial period of quiescencewas followed by increased activity which culminated in a radio flare. In the transition periodthe accretion disc of SS433 became visible in Hα and He I emission lines and remained sountil the observations were terminated; the line-of-sightvelocity of the centre of the disclines during this time behaved as though the binary orbit hassignificant eccentricity ratherthan being circular, consistent with three recent lines of evidence. After the accretion discappeared its rotation speed, as measured by the separation of the Hα disc emission lines,increased steadily from 500 km/s to 700 km/s. The launch speed of the jets first decreasedthen suddenly increased. At the same time as the jet launch speed increased, the wind fromthe accretion disc doubled in speed. Two days afterwards, the radio flux exhibited a flare.These data suggest that a massive ejection of material from the companion star loaded theaccretion disc and the system responded with mass loss via different modes that togethercomprise the flare phenomena. We find that archival data reveal similar behaviour, in thatwhen the measured jet launch speed exceeds 0.29c this is invariably simultaneous with, or afew days before, a radio flare. Thus we surmise that a major flare consists of the overloadingof the accretion disc, resulting in the speeding up of the H-alpha rotation disc lines, followedby enhanced mass loss not just via its famous jets at higher-than-usual speeds but also directlyfrom its accretion disc’s wind.
Key words: stars: individual: SS433 — stars: winds, outflows — accretion, accretion discs
1 INTRODUCTION
The Galactic microquasar SS433 is famous for its continualejection of plasma collimated in two oppositely-directed jetslaunched at speeds that average over time to one quarter of thespeed of light. The system is a binary with a period of 13.08days (Crampton, Cowley & Hutchings 1980) that eclipses at bothoppositions (e.g. Goranskii et al. 1998). There is evidencethatHe II 4486 A emission has been observed from the base ofthe jets (Crampton & Hutchings 1981; Fabrika & Bychkova 1990)and C II lines orbiting with the compact object have been de-tected (Gies et al 2002). The accretion disc is not always re-vealed by optical observations (although see Falomo et al. 1987;Perez & Blundell 2010) but the signature of the accretion disc,namely a widely-separated pair of emission lines, appears to beprominent in the near infra-red (Perez & Blundell 2009). Thesys-tem is rather massive with the compact object and disc havinga
mass of∼16 M⊙ and the companion star having∼24 M⊙. SeeBlundell, Bowler & Schmidtobreick (2008); Fabrika (2004) for ahistoric review.
In August 2004 a campaign of nightly observations of SS433was initiated with the NTT 3.5-m telescope on La Silla, Chile1. Theobservations continued until early November. There were few gapsin the coverage and this sequence of nightly observations revealvery rich behaviour in this microquasar. The results obtained on therelativistic jets (Blundell, Bowler & Schmidtobreick 2007) and onthe properties of the stationary emission lines during the first halfof the series of observations (Blundell, Bowler & Schmidtobreick2008) have already been published. This paper is concerned with
1 Based on observations collected at the European Organisation for Astro-nomical Research in the Southern Hemisphere, Chile (Program ID: 273.C-5050)
c© 0000 RAS
2 Blundell, Schmidtobreick & Trushkin
the observations during the second half of the series, when SS433was switching from a quiescent state to a period of activity culmi-nating in a major flare.
1.1 On the physical interpretation of the two types of flare
A number of authors (for example, Seaquist et al. 1982; Fabrika2004) have suggested that SS433 exhibits two types of radio flare:(1) those where the flux density at all frequencies rises and main-tains a constant, although fairly flat spectrum (Sν ∝ ν−0.2) and(2) those where a peak is seen at frequencies of several GHzwhich then gradually moves to lower frequencies over a timescaleof a few days. Time-resolved radio studies (Fiedler et al. 1987;Bonsignori-Facondi et al. 1986) have revealed clusters of flaresseparated by periods of quiescent emission, without any indicationof significant stable periodicity (see discussion in Sec 5.4).
In observations of the Galactic microquasar Cygnus X-3, amajor flaring event in September 2001 was resolved into two dis-tinct peaks in intensity, separated by a couple of days. The firstof these(a type-1 flare)has a fairly flat spectrum and, by milli-arcsecond resolution observations with the Very Long Baseline Ar-ray (VLBA), is seen to correspond to emission from the nucleus(i.e. core) of this microquasar. The second peak(a type-2 flare)is likely to correspond to the appearance of jet ejecta, specificallytheir brightening as the bolides expand and transition frombeingoptically thick to optically thin and subsequent fading as expan-sion of the bolides continues (Miller-Jones et al. 2004). Similarly,Vermeulen et al. (1993b), in their combined radio and optical studyof SS433 in 1987, found two types of flare: one with a peak fluxthat is similar over the entire observed range of radio wavelengthscoinciding with a brightening of the core component of the system(Vermeulen et al. 1993a) and the second type of flare where a lowerpeak flux density at high frequency evolves into a higher peakfluxat low frequency and in which the same campaign of Very LongBaseline Interferometry (VLBI) imaging revealed that the flaringtakes place some distance away from the nucleus.
Separate flaring of the radio emission from the nucleus (per-haps arising from a disc wind (e.g. Blundell & Kuncic 2007))and from intense jet ejecta we believe correspond to there be-ing two distinct modes of energy and angular momentum out-put at work, as explored by Nipoti et al. (2005). We remarkthat Blundell, Bowler & Schmidtobreick (2008) found a persis-tent fast wind to be rooted in SS433’s accretion disc and thatPerez & Blundell (2009) found from infra-red spectroscopy thatthis wind is the dominant mode of mass-loss in this object.
We emphasize that not all radio emission in microquasarsshould be interpreted as arising from jets, and that radio emissiondue to disc winds should be considered especially when therearedifferent spectral characteristics that could be clues to alternativeorigins (c.f. Fender et al. 2004). A model for nuclear emissionin radio-quiet quasars arising from optically-thin bremsstrahlungfrom (scale-free) accretion disc winds has been presented byBlundell & Kuncic (2007).
2 DATA
Our nightly spectra were taken from Julian Date 2453000 +245.5to +321.5, after which SS433 was not observable from La Silla.Up to Day +274.5 only one observation was missed and during thisperiod SS433 was quiescent (Blundell, Bowler & Schmidtobreick2007, 2008). Between Days +274.5 and +287.5 there were only
two observations (+281.5, +282.5) and there was a gap of twonights after +291.5. After Day +310.5 there is only one observation,Day +321.5. All spectra were taken with the ESO 3.6-m New Tech-nology Telescope with the EMMI instrument (Dekker et al 1986),using grating 6 and a 0.5-arcsec slit. The resolution was 2.2A at6000A and the wavelength range was 5800 to 8700A.
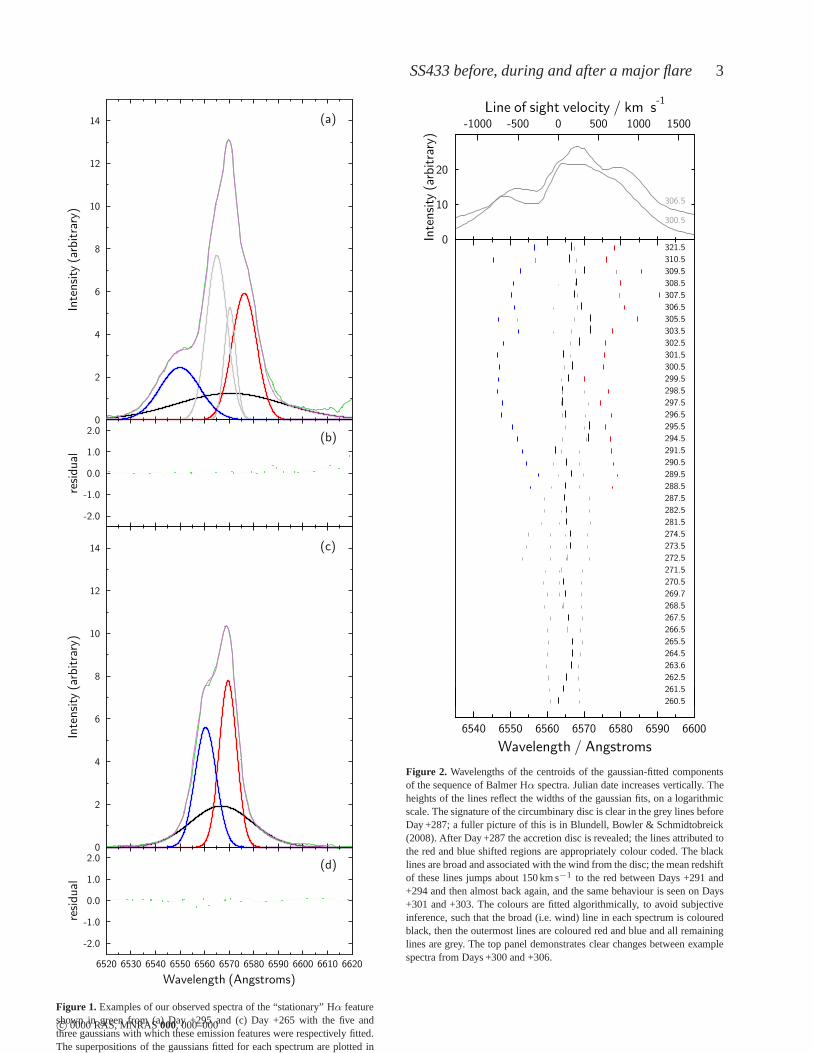
IRAF was used for the basic data reduction including overscansubtraction, flat-fielding, and wavelength calibration. Noflux cali-bration was performed. Instead, the spectra have been normalisedfor the continuum using the program SPLOT written and kindlyprovided by Jochen Liske. The “moving” Hα jet lines were indi-vidually fitted with gaussians for all spectra and subtracted to ob-tain a clean data set of “stationary” Hα lines. Fig 1 indicates thehigh signal-to-noise of the gaussians we fitted to the stationary Hαcomplexes.
We do not refer in this paper to the flux of the spectra becausewe do not have absolute flux calibration for these data (althoughthe instrumental setup and exposure time were identical foreachobservation, and the weather conditions were fairly similar). Weinstead use the term intensity to mean the “area” of an emissionline in the spectrum, which is calculated as the height of thefittedgaussian multiplied by its FWHM; for our normalised spectrathisvalue is the same as the equivalent width of the line.
In Fig. 2 we show the wavelengths of the centres of the com-ponents fitted to the stationary Hα complex. The data displayedstart at Day +260.5 and until Day +287.5 most spectra are fittedwith a single broad line attributed to the wind (on the basis of ouranalysis in Blundell, Bowler & Schmidtobreick 2008) (thus,lineswith FWHM greater than 10A are shown in black) and a pair oflines showing negligible change in redshift as a function oftime(shown in grey) inferred to be the inner rim of the circumbinarydisc (Blundell, Bowler & Schmidtobreick 2008, see fig. 1). A strik-ing change occurs at or around Day +288.5 when the Hα complex isbroadened by the addition of components at comparatively extremeexcursions in velocity. These spectra usually comprised a singlebroad line (FWHM 10 to 20A) and two or four lines which arenarrow (FWHMs of a fewA only). The same behaviour is seen forthe He I lines at 6678A and 7065A (Schmidtobreick & Blundell2006). After Day +296 the He I lines and the hydrogen Paschen se-ries develop pronounced P Cygni features and an O I line at 7772Aexhibits absorption to the blue cutting deep into the continuum. TheO I line at 8446A does not show any such features. The behaviourof these lines will be described in a forthcoming paper.
3 THE APPEARANCE OF SS433’S ACCRETION DISC INTHE OPTICAL
The data shown in Fig. 2 on the extreme blue and red featuresof SS433’s stationary Hα complex are simply explained as be-ing radiated from a ring or disc orbiting the compact object itself,with a speed in excess of 500 km s−1, consistent with the pictureseen in infra-red spectroscopy (Perez & Blundell 2009); Bowler(2010) has published a subset of our data showing the behaviourpresented here. If the Hα-emitting region of the accretion disc isperpendicular to the jet axis, then the disc is close to edge-on toEarth during these observations. Fig. 3 shows the timing of “cross-over” of the jet lines: the epoch when the jets are launched inthe plane of the sky. This figure shows that variations inthe sep-aration of the red and blue jet linesdiffers from the predictionof the kinematic model. This is a manifestation of the phenom-ena analysed and published in Blundell & Bowler (2005) and in
c© 0000 RAS, MNRAS000, 000–000
SS433 before, during and after a major flare3
Figure 1. Examples of our observed spectra of the “stationary” Hα featureshown in green from (a) Day +295 and (c) Day +265 with the five andthree gaussians with which these emission features were respectively fitted.The superpositions of the gaussians fitted for each spectrumare plotted inpurple; the difference between the green and purple curves —the residualsto the fits — are shown in panels (b) and (d) respectively.
Figure 2. Wavelengths of the centroids of the gaussian-fitted componentsof the sequence of Balmer Hα spectra. Julian date increases vertically. Theheights of the lines reflect the widths of the gaussian fits, ona logarithmicscale. The signature of the circumbinary disc is clear in thegrey lines beforeDay +287; a fuller picture of this is in Blundell, Bowler & Schmidtobreick(2008). After Day +287 the accretion disc is revealed; the lines attributed tothe red and blue shifted regions are appropriately colour coded. The blacklines are broad and associated with the wind from the disc; the mean redshiftof these lines jumps about 150 km s−1 to the red between Days +291 and+294 and then almost back again, and the same behaviour is seen on Days+301 and +303. The colours are fitted algorithmically, to avoid subjectiveinference, such that the broad (i.e. wind) line in each spectrum is colouredblack, then the outermost lines are coloured red and blue andall remaininglines are grey. The top panel demonstrates clear changes between examplespectra from Days +300 and +306.
c© 0000 RAS, MNRAS000, 000–000
4 Blundell, Schmidtobreick & Trushkin
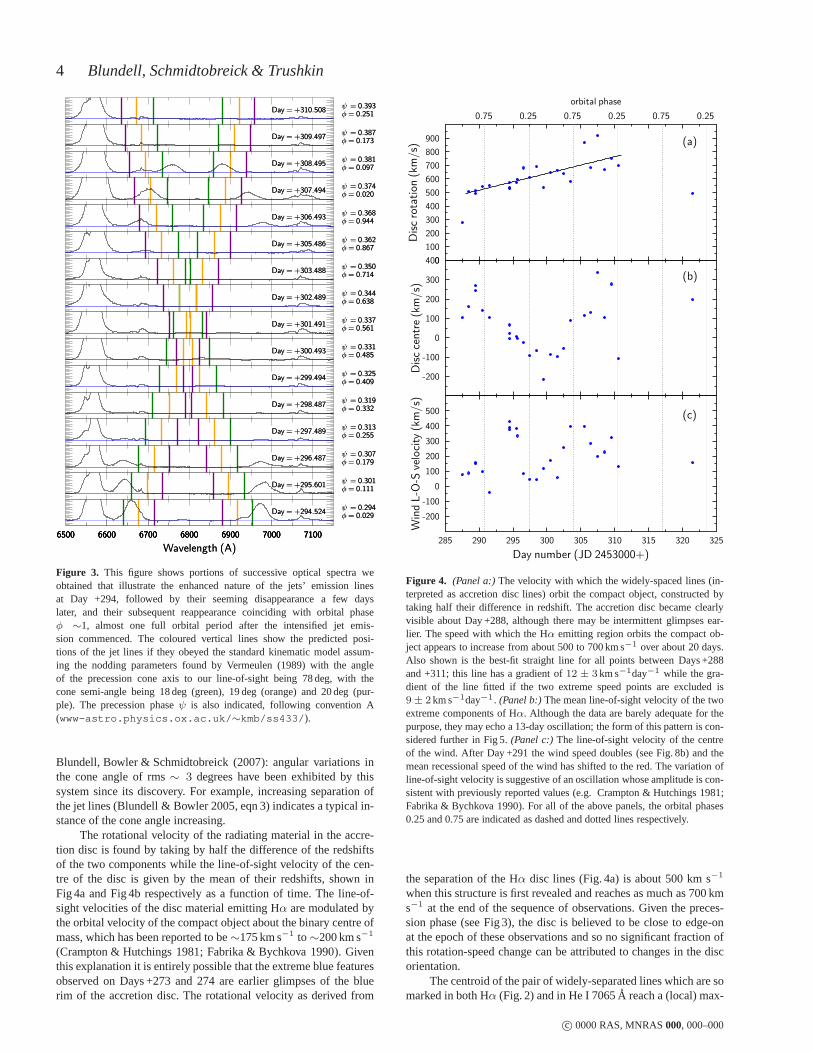
Figure 3. This figure shows portions of successive optical spectra weobtained that illustrate the enhanced nature of the jets’ emission linesat Day +294, followed by their seeming disappearance a few dayslater, and their subsequent reappearance coinciding with orbital phaseφ ∼1, almost one full orbital period after the intensified jet emis-sion commenced. The coloured vertical lines show the predicted posi-tions of the jet lines if they obeyed the standard kinematic model assum-ing the nodding parameters found by Vermeulen (1989) with the angleof the precession cone axis to our line-of-sight being 78 deg, with thecone semi-angle being 18 deg (green), 19 deg (orange) and 20 deg (pur-ple). The precession phaseψ is also indicated, following convention A(www-astro.physics.ox.ac.uk/∼kmb/ss433/).
Blundell, Bowler & Schmidtobreick (2007): angular variations inthe cone angle of rms∼ 3 degrees have been exhibited by thissystem since its discovery. For example, increasing separation ofthe jet lines (Blundell & Bowler 2005, eqn 3) indicates a typical in-stance of the cone angle increasing.
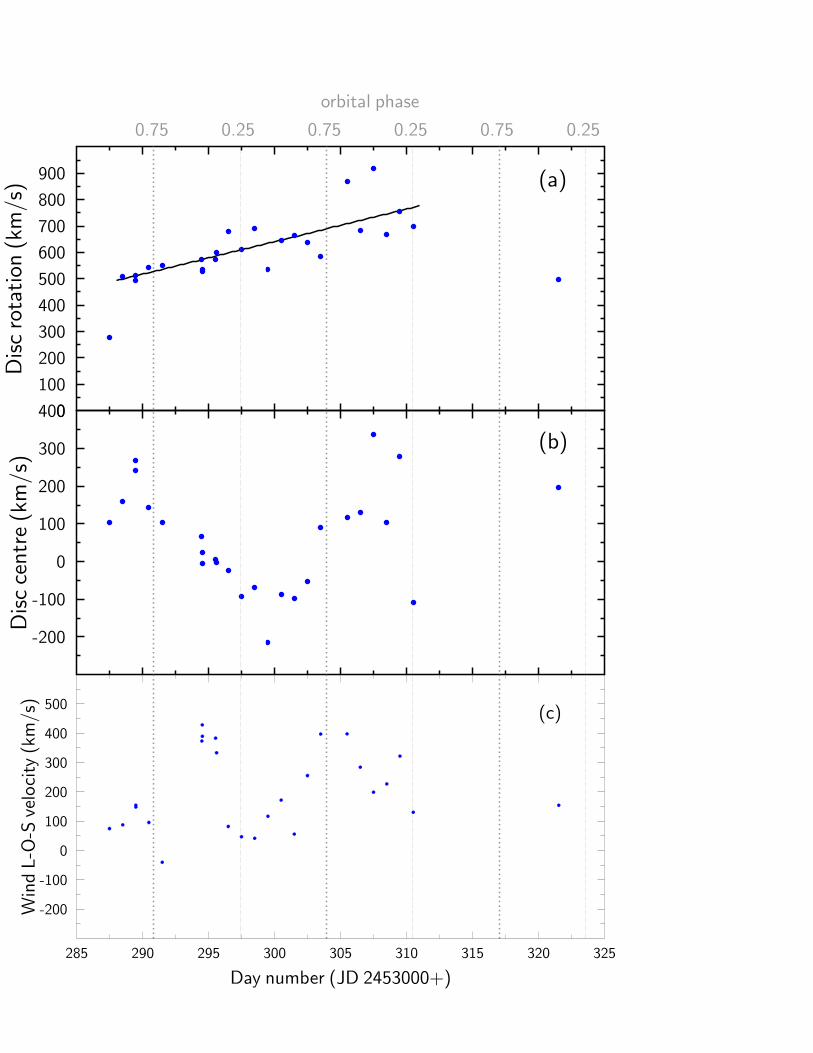
The rotational velocity of the radiating material in the accre-tion disc is found by taking by half the difference of the redshiftsof the two components while the line-of-sight velocity of the cen-tre of the disc is given by the mean of their redshifts, shown inFig 4a and Fig 4b respectively as a function of time. The line-of-sight velocities of the disc material emitting Hα are modulated bythe orbital velocity of the compact object about the binary centre ofmass, which has been reported to be∼175 km s−1 to∼200 km s−1
(Crampton & Hutchings 1981; Fabrika & Bychkova 1990). Giventhis explanation it is entirely possible that the extreme blue featuresobserved on Days +273 and 274 are earlier glimpses of the bluerim of the accretion disc. The rotational velocity as derived from
Figure 4. (Panel a:)The velocity with which the widely-spaced lines (in-terpreted as accretion disc lines) orbit the compact object, constructed bytaking half their difference in redshift. The accretion disc became clearlyvisible about Day +288, although there may be intermittent glimpses ear-lier. The speed with which the Hα emitting region orbits the compact ob-ject appears to increase from about 500 to 700 km s−1 over about 20 days.Also shown is the best-fit straight line for all points between Days +288and +311; this line has a gradient of12 ± 3 km s−1day−1 while the gra-dient of the line fitted if the two extreme speed points are excluded is9± 2 km s−1day−1 . (Panel b:)The mean line-of-sight velocity of the twoextreme components of Hα. Although the data are barely adequate for thepurpose, they may echo a 13-day oscillation; the form of thispattern is con-sidered further in Fig 5.(Panel c:)The line-of-sight velocity of the centreof the wind. After Day +291 the wind speed doubles (see Fig. 8b) and themean recessional speed of the wind has shifted to the red. Thevariation ofline-of-sight velocity is suggestive of an oscillation whose amplitude is con-sistent with previously reported values (e.g. Crampton & Hutchings 1981;Fabrika & Bychkova 1990). For all of the above panels, the orbital phases0.25 and 0.75 are indicated as dashed and dotted lines respectively.
the separation of the Hα disc lines (Fig. 4a) is about 500 km s−1
when this structure is first revealed and reaches as much as 700 kms−1 at the end of the sequence of observations. Given the preces-sion phase (see Fig 3), the disc is believed to be close to edge-onat the epoch of these observations and so no significant fraction ofthis rotation-speed change can be attributed to changes in the discorientation.
The centroid of the pair of widely-separated lines which aresomarked in both Hα (Fig. 2) and in He I 7065A reach a (local) max-
c© 0000 RAS, MNRAS000, 000–000
SS433 before, during and after a major flare5
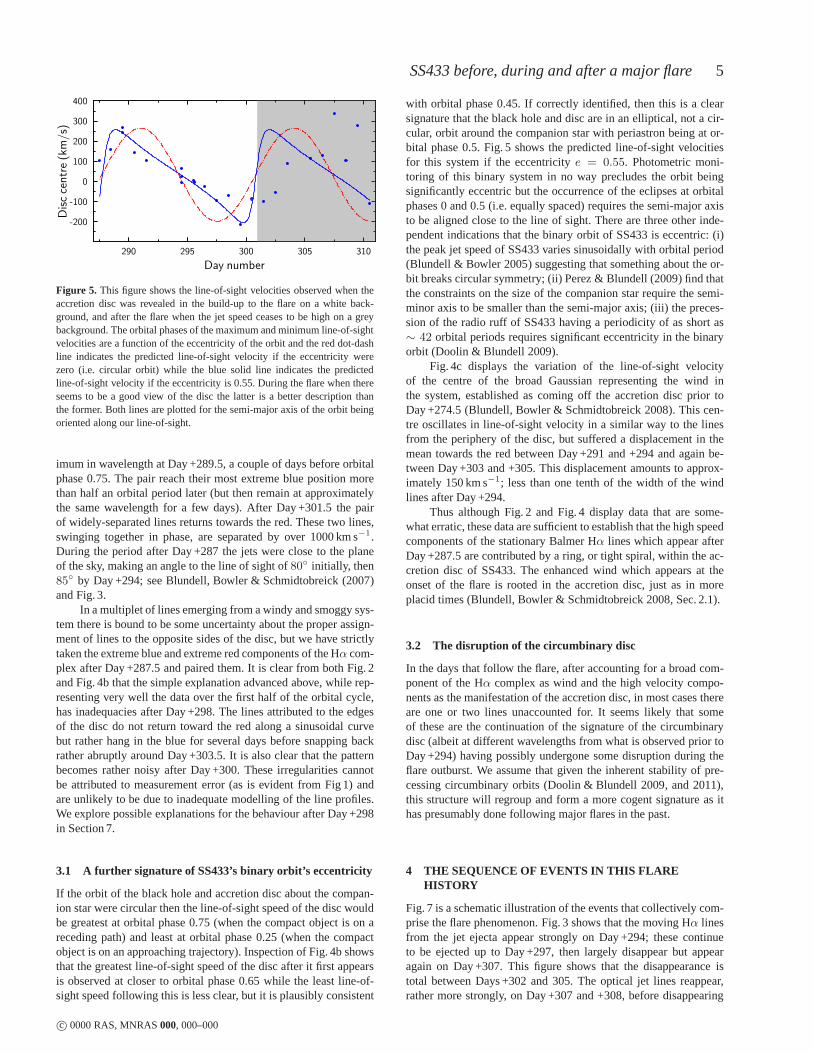
Figure 5. This figure shows the line-of-sight velocities observed when theaccretion disc was revealed in the build-up to the flare on a white back-ground, and after the flare when the jet speed ceases to be highon a greybackground. The orbital phases of the maximum and minimum line-of-sightvelocities are a function of the eccentricity of the orbit and the red dot-dashline indicates the predicted line-of-sight velocity if theeccentricity werezero (i.e. circular orbit) while the blue solid line indicates the predictedline-of-sight velocity if the eccentricity is 0.55. Duringthe flare when thereseems to be a good view of the disc the latter is a better description thanthe former. Both lines are plotted for the semi-major axis ofthe orbit beingoriented along our line-of-sight.
imum in wavelength at Day +289.5, a couple of days before orbitalphase 0.75. The pair reach their most extreme blue position morethan half an orbital period later (but then remain at approximatelythe same wavelength for a few days). After Day +301.5 the pairof widely-separated lines returns towards the red. These two lines,swinging together in phase, are separated by over 1000 km s−1.During the period after Day +287 the jets were close to the planeof the sky, making an angle to the line of sight of80
◦ initially, then85
◦ by Day +294; see Blundell, Bowler & Schmidtobreick (2007)and Fig. 3.
In a multiplet of lines emerging from a windy and smoggy sys-tem there is bound to be some uncertainty about the proper assign-ment of lines to the opposite sides of the disc, but we have strictlytaken the extreme blue and extreme red components of the Hα com-plex after Day +287.5 and paired them. It is clear from both Fig. 2and Fig. 4b that the simple explanation advanced above, while rep-resenting very well the data over the first half of the orbitalcycle,has inadequacies after Day +298. The lines attributed to theedgesof the disc do not return toward the red along a sinusoidal curvebut rather hang in the blue for several days before snapping backrather abruptly around Day +303.5. It is also clear that the patternbecomes rather noisy after Day +300. These irregularities cannotbe attributed to measurement error (as is evident from Fig 1)andare unlikely to be due to inadequate modelling of the line profiles.We explore possible explanations for the behaviour after Day +298in Section 7.
3.1 A further signature of SS433’s binary orbit’s eccentricity
If the orbit of the black hole and accretion disc about the compan-ion star were circular then the line-of-sight speed of the disc wouldbe greatest at orbital phase 0.75 (when the compact object ison areceding path) and least at orbital phase 0.25 (when the compactobject is on an approaching trajectory). Inspection of Fig.4b showsthat the greatest line-of-sight speed of the disc after it first appearsis observed at closer to orbital phase 0.65 while the least line-of-sight speed following this is less clear, but it is plausiblyconsistent
with orbital phase 0.45. If correctly identified, then this is a clearsignature that the black hole and disc are in an elliptical, not a cir-cular, orbit around the companion star with periastron being at or-bital phase 0.5. Fig. 5 shows the predicted line-of-sight velocitiesfor this system if the eccentricitye = 0.55. Photometric moni-toring of this binary system in no way precludes the orbit beingsignificantly eccentric but the occurrence of the eclipses at orbitalphases 0 and 0.5 (i.e. equally spaced) requires the semi-major axisto be aligned close to the line of sight. There are three otherinde-pendent indications that the binary orbit of SS433 is eccentric: (i)the peak jet speed of SS433 varies sinusoidally with orbitalperiod(Blundell & Bowler 2005) suggesting that something about the or-bit breaks circular symmetry; (ii) Perez & Blundell (2009) find thatthe constraints on the size of the companion star require thesemi-minor axis to be smaller than the semi-major axis; (iii) the preces-sion of the radio ruff of SS433 having a periodicity of as short as∼ 42 orbital periods requires significant eccentricity in the binaryorbit (Doolin & Blundell 2009).
Fig. 4c displays the variation of the line-of-sight velocityof the centre of the broad Gaussian representing the wind inthe system, established as coming off the accretion disc prior toDay +274.5 (Blundell, Bowler & Schmidtobreick 2008). This cen-tre oscillates in line-of-sight velocity in a similar way tothe linesfrom the periphery of the disc, but suffered a displacement in themean towards the red between Day +291 and +294 and again be-tween Day +303 and +305. This displacement amounts to approx-imately 150 km s−1; less than one tenth of the width of the windlines after Day +294.
Thus although Fig. 2 and Fig. 4 display data that are some-what erratic, these data are sufficient to establish that thehigh speedcomponents of the stationary Balmer Hα lines which appear afterDay +287.5 are contributed by a ring, or tight spiral, withinthe ac-cretion disc of SS433. The enhanced wind which appears at theonset of the flare is rooted in the accretion disc, just as in moreplacid times (Blundell, Bowler & Schmidtobreick 2008, Sec.2.1).
3.2 The disruption of the circumbinary disc
In the days that follow the flare, after accounting for a broadcom-ponent of the Hα complex as wind and the high velocity compo-nents as the manifestation of the accretion disc, in most cases thereare one or two lines unaccounted for. It seems likely that someof these are the continuation of the signature of the circumbinarydisc (albeit at different wavelengths from what is observedprior toDay +294) having possibly undergone some disruption duringtheflare outburst. We assume that given the inherent stability of pre-cessing circumbinary orbits (Doolin & Blundell 2009, and 2011),this structure will regroup and form a more cogent signatureas ithas presumably done following major flares in the past.
4 THE SEQUENCE OF EVENTS IN THIS FLAREHISTORY
Fig. 7 is a schematic illustration of the events that collectively com-prise the flare phenomenon. Fig. 3 shows that the moving Hα linesfrom the jet ejecta appear strongly on Day +294; these continueto be ejected up to Day +297, then largely disappear but appearagain on Day +307. This figure shows that the disappearance istotal between Days +302 and 305. The optical jet lines reappear,rather more strongly, on Day +307 and +308, before disappearing
c© 0000 RAS, MNRAS000, 000–000
6 Blundell, Schmidtobreick & Trushkin
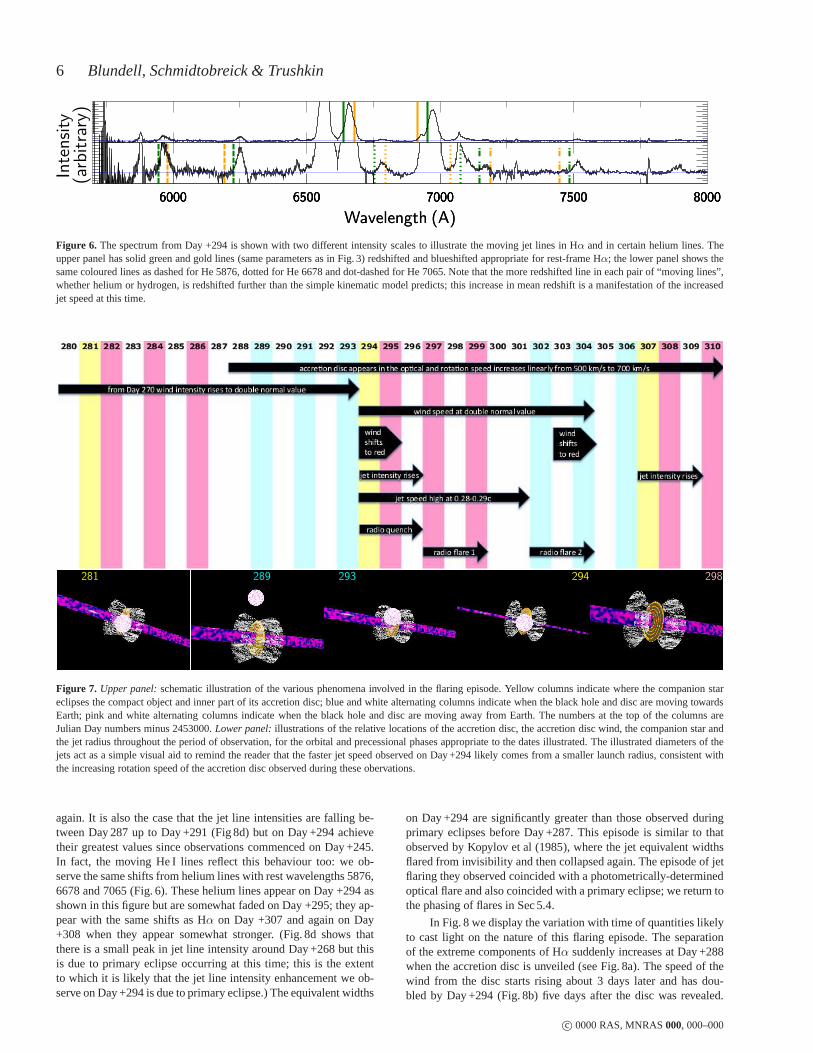
Figure 6. The spectrum from Day +294 is shown with two different intensity scales to illustrate the moving jet lines in Hα and in certain helium lines. Theupper panel has solid green and gold lines (same parameters as in Fig. 3) redshifted and blueshifted appropriate for rest-frame Hα; the lower panel shows thesame coloured lines as dashed for He 5876, dotted for He 6678 and dot-dashed for He 7065. Note that the more redshifted linein each pair of “moving lines”,whether helium or hydrogen, is redshifted further than the simple kinematic model predicts; this increase in mean redshift is a manifestation of the increasedjet speed at this time.
Figure 7. Upper panel:schematic illustration of the various phenomena involved in the flaring episode. Yellow columns indicate where the companion stareclipses the compact object and inner part of its accretion disc; blue and white alternating columns indicate when the black hole and disc are moving towardsEarth; pink and white alternating columns indicate when theblack hole and disc are moving away from Earth. The numbers atthe top of the columns areJulian Day numbers minus 2453000.Lower panel:illustrations of the relative locations of the accretion disc, the accretion disc wind, the companion star andthe jet radius throughout the period of observation, for theorbital and precessional phases appropriate to the dates illustrated. The illustrated diameters of thejets act as a simple visual aid to remind the reader that the faster jet speed observed on Day +294 likely comes from a smaller launch radius, consistent withthe increasing rotation speed of the accretion disc observed during these obervations.
again. It is also the case that the jet line intensities are falling be-tween Day 287 up to Day +291 (Fig 8d) but on Day +294 achievetheir greatest values since observations commenced on Day +245.In fact, the moving He I lines reflect this behaviour too: we ob-serve the same shifts from helium lines with rest wavelengths 5876,6678 and 7065 (Fig. 6). These helium lines appear on Day +294 asshown in this figure but are somewhat faded on Day +295; they ap-pear with the same shifts as Hα on Day +307 and again on Day+308 when they appear somewhat stronger. (Fig. 8d shows thatthere is a small peak in jet line intensity around Day +268 butthisis due to primary eclipse occurring at this time; this is the extentto which it is likely that the jet line intensity enhancementwe ob-serve on Day +294 is due to primary eclipse.) The equivalent widths
on Day +294 are significantly greater than those observed duringprimary eclipses before Day +287. This episode is similar tothatobserved by Kopylov et al (1985), where the jet equivalent widthsflared from invisibility and then collapsed again. The episode of jetflaring they observed coincided with a photometrically-determinedoptical flare and also coincided with a primary eclipse; we return tothe phasing of flares in Sec 5.4.
In Fig. 8 we display the variation with time of quantities likelyto cast light on the nature of this flaring episode. The separationof the extreme components of Hα suddenly increases at Day +288when the accretion disc is unveiled (see Fig. 8a). The speed of thewind from the disc starts rising about 3 days later and has dou-bled by Day +294 (Fig. 8b) five days after the disc was revealed.
c© 0000 RAS, MNRAS000, 000–000
SS433 before, during and after a major flare7
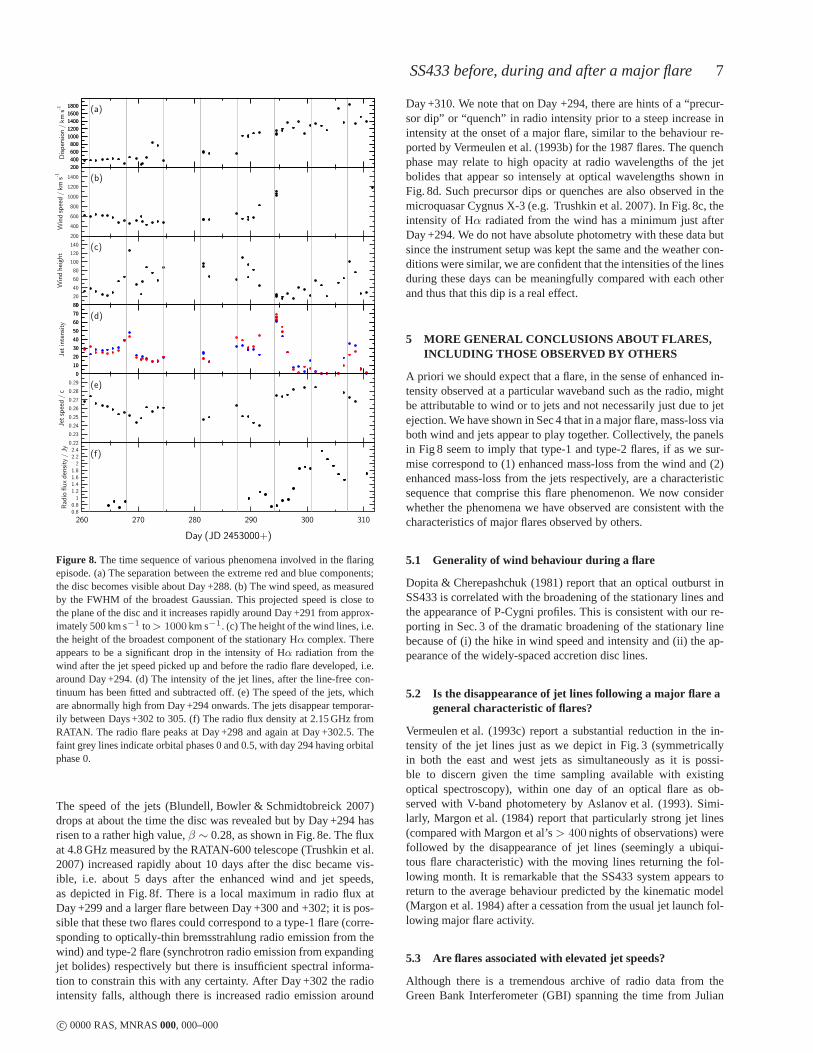
Figure 8. The time sequence of various phenomena involved in the flaringepisode. (a) The separation between the extreme red and bluecomponents;the disc becomes visible about Day +288. (b) The wind speed, as measuredby the FWHM of the broadest Gaussian. This projected speed isclose tothe plane of the disc and it increases rapidly around Day +291from approx-imately 500 km s−1 to> 1000 km s−1. (c) The height of the wind lines, i.e.the height of the broadest component of the stationary Hα complex. Thereappears to be a significant drop in the intensity of Hα radiation from thewind after the jet speed picked up and before the radio flare developed, i.e.around Day +294. (d) The intensity of the jet lines, after theline-free con-tinuum has been fitted and subtracted off. (e) The speed of thejets, whichare abnormally high from Day +294 onwards. The jets disappear temporar-ily between Days +302 to 305. (f) The radio flux density at 2.15GHz fromRATAN. The radio flare peaks at Day +298 and again at Day +302.5. Thefaint grey lines indicate orbital phases 0 and 0.5, with day 294 having orbitalphase 0.
The speed of the jets (Blundell, Bowler & Schmidtobreick 2007)drops at about the time the disc was revealed but by Day +294 hasrisen to a rather high value,β ∼ 0.28, as shown in Fig. 8e. The fluxat 4.8 GHz measured by the RATAN-600 telescope (Trushkin et al.2007) increased rapidly about 10 days after the disc became vis-ible, i.e. about 5 days after the enhanced wind and jet speeds,as depicted in Fig. 8f. There is a local maximum in radio flux atDay +299 and a larger flare between Day +300 and +302; it is pos-sible that these two flares could correspond to a type-1 flare (corre-sponding to optically-thin bremsstrahlung radio emissionfrom thewind) and type-2 flare (synchrotron radio emission from expandingjet bolides) respectively but there is insufficient spectral informa-tion to constrain this with any certainty. After Day +302 theradiointensity falls, although there is increased radio emission around
Day +310. We note that on Day +294, there are hints of a “precur-sor dip” or “quench” in radio intensity prior to a steep increase inintensity at the onset of a major flare, similar to the behaviour re-ported by Vermeulen et al. (1993b) for the 1987 flares. The quenchphase may relate to high opacity at radio wavelengths of the jetbolides that appear so intensely at optical wavelengths shown inFig. 8d. Such precursor dips or quenches are also observed inthemicroquasar Cygnus X-3 (e.g. Trushkin et al. 2007). In Fig. 8c, theintensity of Hα radiated from the wind has a minimum just afterDay +294. We do not have absolute photometry with these data butsince the instrument setup was kept the same and the weather con-ditions were similar, we are confident that the intensities of the linesduring these days can be meaningfully compared with each otherand thus that this dip is a real effect.
5 MORE GENERAL CONCLUSIONS ABOUT FLARES,INCLUDING THOSE OBSERVED BY OTHERS
A priori we should expect that a flare, in the sense of enhancedin-tensity observed at a particular waveband such as the radio,mightbe attributable to wind or to jets and not necessarily just due to jetejection. We have shown in Sec 4 that in a major flare, mass-loss viaboth wind and jets appear to play together. Collectively, the panelsin Fig 8 seem to imply that type-1 and type-2 flares, if as we sur-mise correspond to (1) enhanced mass-loss from the wind and (2)enhanced mass-loss from the jets respectively, are a characteristicsequence that comprise this flare phenomenon. We now considerwhether the phenomena we have observed are consistent with thecharacteristics of major flares observed by others.
5.1 Generality of wind behaviour during a flare
Dopita & Cherepashchuk (1981) report that an optical outburst inSS433 is correlated with the broadening of the stationary lines andthe appearance of P-Cygni profiles. This is consistent with our re-porting in Sec. 3 of the dramatic broadening of the stationary linebecause of (i) the hike in wind speed and intensity and (ii) the ap-pearance of the widely-spaced accretion disc lines.
5.2 Is the disappearance of jet lines following a major flare ageneral characteristic of flares?
Vermeulen et al. (1993c) report a substantial reduction in the in-tensity of the jet lines just as we depict in Fig. 3 (symmetricallyin both the east and west jets as simultaneously as it is possi-ble to discern given the time sampling available with existingoptical spectroscopy), within one day of an optical flare as ob-served with V-band photometery by Aslanov et al. (1993). Simi-larly, Margon et al. (1984) report that particularly strongjet lines(compared with Margon et al’s> 400 nights of observations) werefollowed by the disappearance of jet lines (seemingly a ubiqui-tous flare characteristic) with the moving lines returning the fol-lowing month. It is remarkable that the SS433 system appearstoreturn to the average behaviour predicted by the kinematic model(Margon et al. 1984) after a cessation from the usual jet launch fol-lowing major flare activity.
5.3 Are flares associated with elevated jet speeds?
Although there is a tremendous archive of radio data from theGreen Bank Interferometer (GBI) spanning the time from Julian
c© 0000 RAS, MNRAS000, 000–000
8 Blundell, Schmidtobreick & Trushkin
Days 2445463 to 2445509, the overlap of these data with thedensely sampled spectroscopic archive recorded by Eikenberry andCollins, as used by Blundell & Bowler (2005) to construct a his-torical record of jet launch speeds, is unfortunately rather sparse.However, the following may be discerned from these two sets ofarchival data: whenever the measured jet-speed exceeds0.29c, thiscoincides with, or is within a day or two of, a radio flare; there areno exceptions to this in the data currently available. For example,on Julian Day 2444437 the jet speed reached 0.32c and there is aclear flare recorded by the GBI where the flux density at 2.3 GHzexceeded 1.5 Jy (over a factor of two in excess of the quiescent fluxdensity at this frequency).
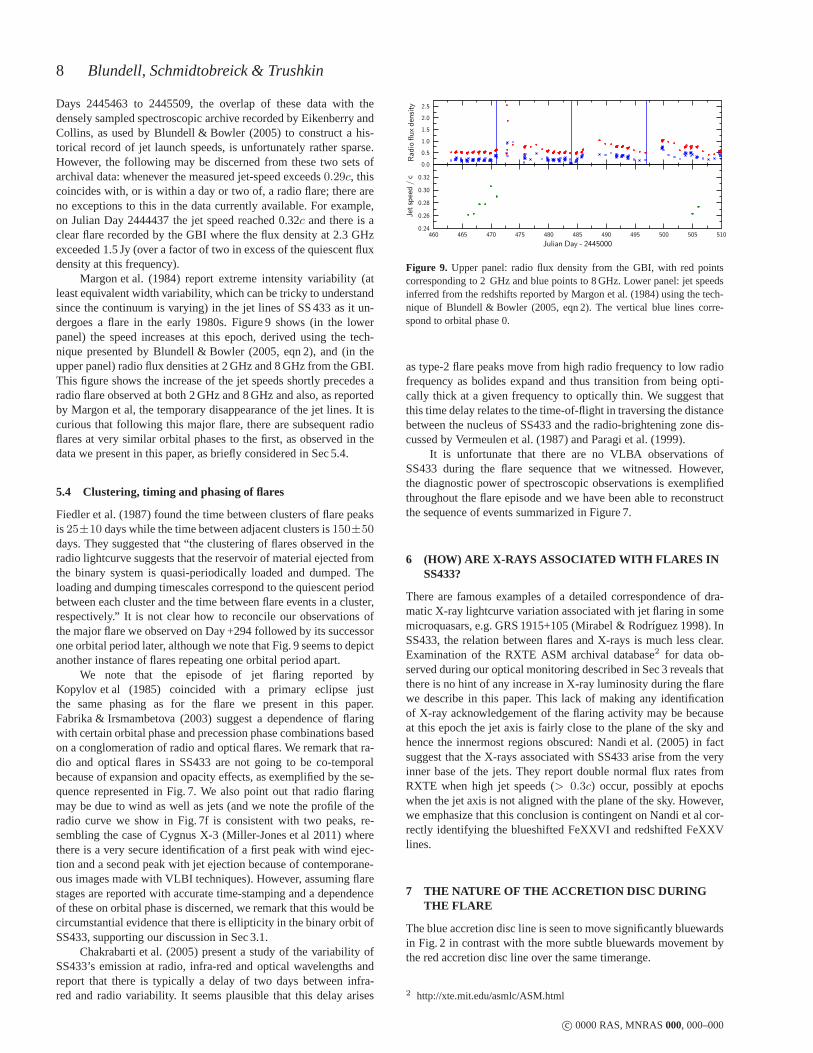
Margon et al. (1984) report extreme intensity variability (atleast equivalent width variability, which can be tricky to understandsince the continuum is varying) in the jet lines of SS 433 as itun-dergoes a flare in the early 1980s. Figure 9 shows (in the lowerpanel) the speed increases at this epoch, derived using the tech-nique presented by Blundell & Bowler (2005, eqn 2), and (in theupper panel) radio flux densities at 2 GHz and 8 GHz from the GBI.This figure shows the increase of the jet speeds shortly precedes aradio flare observed at both 2 GHz and 8 GHz and also, as reportedby Margon et al, the temporary disappearance of the jet lines. It iscurious that following this major flare, there are subsequent radioflares at very similar orbital phases to the first, as observedin thedata we present in this paper, as briefly considered in Sec 5.4.
5.4 Clustering, timing and phasing of flares
Fiedler et al. (1987) found the time between clusters of flarepeaksis25±10 days while the time between adjacent clusters is150±50
days. They suggested that “the clustering of flares observedin theradio lightcurve suggests that the reservoir of material ejected fromthe binary system is quasi-periodically loaded and dumped.Theloading and dumping timescales correspond to the quiescentperiodbetween each cluster and the time between flare events in a cluster,respectively.” It is not clear how to reconcile our observations ofthe major flare we observed on Day +294 followed by its successorone orbital period later, although we note that Fig. 9 seems to depictanother instance of flares repeating one orbital period apart.
We note that the episode of jet flaring reported byKopylov et al (1985) coincided with a primary eclipse justthe same phasing as for the flare we present in this paper.Fabrika & Irsmambetova (2003) suggest a dependence of flaringwith certain orbital phase and precession phase combinations basedon a conglomeration of radio and optical flares. We remark that ra-dio and optical flares in SS433 are not going to be co-temporalbecause of expansion and opacity effects, as exemplified by the se-quence represented in Fig. 7. We also point out that radio flaringmay be due to wind as well as jets (and we note the profile of theradio curve we show in Fig. 7f is consistent with two peaks, re-sembling the case of Cygnus X-3 (Miller-Jones et al 2011) wherethere is a very secure identification of a first peak with wind ejec-tion and a second peak with jet ejection because of contemporane-ous images made with VLBI techniques). However, assuming flarestages are reported with accurate time-stamping and a dependenceof these on orbital phase is discerned, we remark that this would becircumstantial evidence that there is ellipticity in the binary orbit ofSS433, supporting our discussion in Sec 3.1.
Chakrabarti et al. (2005) present a study of the variabilityofSS433’s emission at radio, infra-red and optical wavelengths andreport that there is typically a delay of two days between infra-red and radio variability. It seems plausible that this delay arises
Figure 9. Upper panel: radio flux density from the GBI, with red pointscorresponding to 2 GHz and blue points to 8 GHz. Lower panel: jet speedsinferred from the redshifts reported by Margon et al. (1984)using the tech-nique of Blundell & Bowler (2005, eqn 2). The vertical blue lines corre-spond to orbital phase 0.
as type-2 flare peaks move from high radio frequency to low radiofrequency as bolides expand and thus transition from being opti-cally thick at a given frequency to optically thin. We suggest thatthis time delay relates to the time-of-flight in traversing the distancebetween the nucleus of SS433 and the radio-brightening zonedis-cussed by Vermeulen et al. (1987) and Paragi et al. (1999).
It is unfortunate that there are no VLBA observations ofSS433 during the flare sequence that we witnessed. However,the diagnostic power of spectroscopic observations is exemplifiedthroughout the flare episode and we have been able to reconstructthe sequence of events summarized in Figure 7.
6 (HOW) ARE X-RAYS ASSOCIATED WITH FLARES INSS433?
There are famous examples of a detailed correspondence of dra-matic X-ray lightcurve variation associated with jet flaring in somemicroquasars, e.g. GRS 1915+105 (Mirabel & Rodrıguez 1998). InSS433, the relation between flares and X-rays is much less clear.Examination of the RXTE ASM archival database2 for data ob-served during our optical monitoring described in Sec 3 reveals thatthere is no hint of any increase in X-ray luminosity during the flarewe describe in this paper. This lack of making any identificationof X-ray acknowledgement of the flaring activity may be becauseat this epoch the jet axis is fairly close to the plane of the sky andhence the innermost regions obscured: Nandi et al. (2005) infactsuggest that the X-rays associated with SS433 arise from theveryinner base of the jets. They report double normal flux rates fromRXTE when high jet speeds (> 0.3c) occur, possibly at epochswhen the jet axis is not aligned with the plane of the sky. However,we emphasize that this conclusion is contingent on Nandi et al cor-rectly identifying the blueshifted FeXXVI and redshifted FeXXVlines.
7 THE NATURE OF THE ACCRETION DISC DURINGTHE FLARE
The blue accretion disc line is seen to move significantly bluewardsin Fig. 2 in contrast with the more subtle bluewards movementbythe red accretion disc line over the same timerange.
2 http://xte.mit.edu/asmlc/ASM.html
c© 0000 RAS, MNRAS000, 000–000
SS433 before, during and after a major flare9
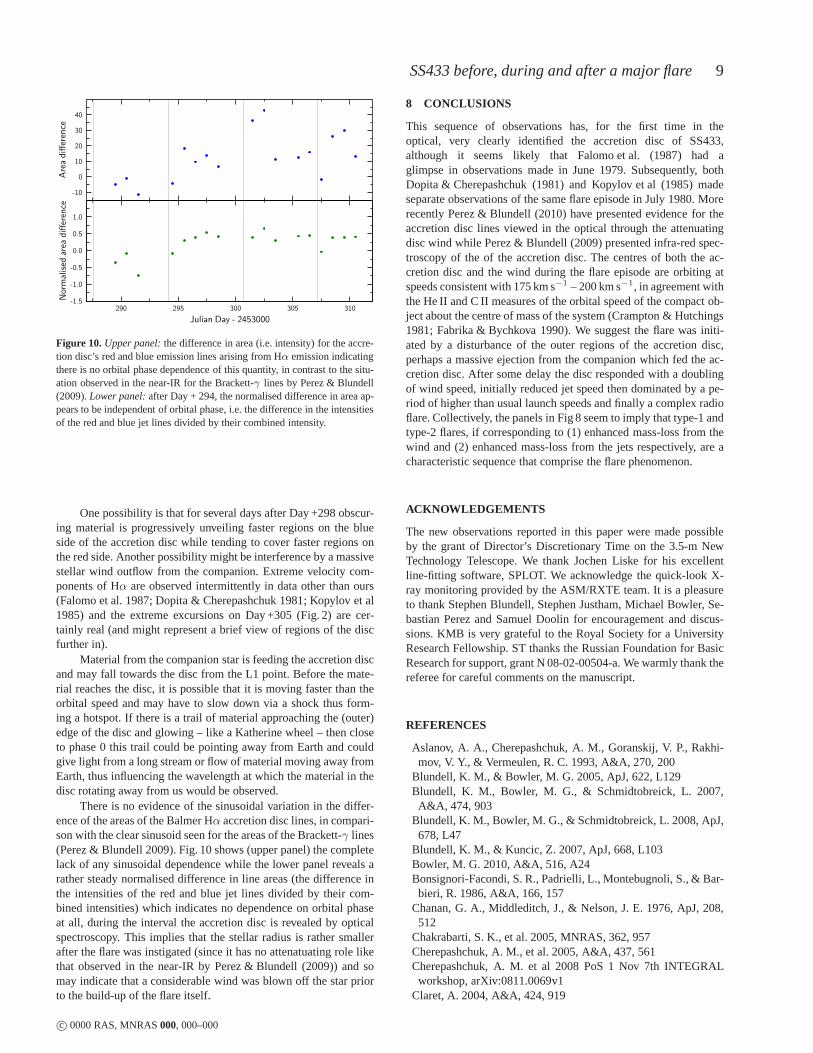
Figure 10.Upper panel:the difference in area (i.e. intensity) for the accre-tion disc’s red and blue emission lines arising from Hα emission indicatingthere is no orbital phase dependence of this quantity, in contrast to the situ-ation observed in the near-IR for the Brackett-γ lines by Perez & Blundell(2009).Lower panel:after Day + 294, the normalised difference in area ap-pears to be independent of orbital phase, i.e. the difference in the intensitiesof the red and blue jet lines divided by their combined intensity.
One possibility is that for several days after Day +298 obscur-ing material is progressively unveiling faster regions on the blueside of the accretion disc while tending to cover faster regions onthe red side. Another possibility might be interference by amassivestellar wind outflow from the companion. Extreme velocity com-ponents of Hα are observed intermittently in data other than ours(Falomo et al. 1987; Dopita & Cherepashchuk 1981; Kopylov etal1985) and the extreme excursions on Day +305 (Fig. 2) are cer-tainly real (and might represent a brief view of regions of the discfurther in).
Material from the companion star is feeding the accretion discand may fall towards the disc from the L1 point. Before the mate-rial reaches the disc, it is possible that it is moving fasterthan theorbital speed and may have to slow down via a shock thus form-ing a hotspot. If there is a trail of material approaching the(outer)edge of the disc and glowing – like a Katherine wheel – then closeto phase 0 this trail could be pointing away from Earth and couldgive light from a long stream or flow of material moving away fromEarth, thus influencing the wavelength at which the materialin thedisc rotating away from us would be observed.
There is no evidence of the sinusoidal variation in the differ-ence of the areas of the Balmer Hα accretion disc lines, in compari-son with the clear sinusoid seen for the areas of the Brackett-γ lines(Perez & Blundell 2009). Fig. 10 shows (upper panel) the completelack of any sinusoidal dependence while the lower panel reveals arather steady normalised difference in line areas (the difference inthe intensities of the red and blue jet lines divided by theircom-bined intensities) which indicates no dependence on orbital phaseat all, during the interval the accretion disc is revealed byopticalspectroscopy. This implies that the stellar radius is rather smallerafter the flare was instigated (since it has no attenatuatingrole likethat observed in the near-IR by Perez & Blundell (2009)) and somay indicate that a considerable wind was blown off the star priorto the build-up of the flare itself.
8 CONCLUSIONS
This sequence of observations has, for the first time in theoptical, very clearly identified the accretion disc of SS433,although it seems likely that Falomo et al. (1987) had aglimpse in observations made in June 1979. Subsequently, bothDopita & Cherepashchuk (1981) and Kopylov et al (1985) madeseparate observations of the same flare episode in July 1980.Morerecently Perez & Blundell (2010) have presented evidence for theaccretion disc lines viewed in the optical through the attenuatingdisc wind while Perez & Blundell (2009) presented infra-redspec-troscopy of the of the accretion disc. The centres of both theac-cretion disc and the wind during the flare episode are orbiting atspeeds consistent with 175 km s−1 – 200 km s−1, in agreement withthe He II and C II measures of the orbital speed of the compact ob-ject about the centre of mass of the system (Crampton & Hutchings1981; Fabrika & Bychkova 1990). We suggest the flare was initi-ated by a disturbance of the outer regions of the accretion disc,perhaps a massive ejection from the companion which fed the ac-cretion disc. After some delay the disc responded with a doublingof wind speed, initially reduced jet speed then dominated bya pe-riod of higher than usual launch speeds and finally a complex radioflare. Collectively, the panels in Fig 8 seem to imply that type-1 andtype-2 flares, if corresponding to (1) enhanced mass-loss from thewind and (2) enhanced mass-loss from the jets respectively,are acharacteristic sequence that comprise the flare phenomenon.
ACKNOWLEDGEMENTS
The new observations reported in this paper were made possibleby the grant of Director’s Discretionary Time on the 3.5-m NewTechnology Telescope. We thank Jochen Liske for his excellentline-fitting software, SPLOT. We acknowledge the quick-look X-ray monitoring provided by the ASM/RXTE team. It is a pleasureto thank Stephen Blundell, Stephen Justham, Michael Bowler, Se-bastian Perez and Samuel Doolin for encouragement and discus-sions. KMB is very grateful to the Royal Society for a UniversityResearch Fellowship. ST thanks the Russian Foundation for BasicResearch for support, grant N 08-02-00504-a. We warmly thank thereferee for careful comments on the manuscript.
REFERENCES
Aslanov, A. A., Cherepashchuk, A. M., Goranskij, V. P., Rakhi-mov, V. Y., & Vermeulen, R. C. 1993, A&A, 270, 200
Blundell, K. M., & Bowler, M. G. 2005, ApJ, 622, L129Blundell, K. M., Bowler, M. G., & Schmidtobreick, L. 2007,A&A, 474, 903
Blundell, K. M., Bowler, M. G., & Schmidtobreick, L. 2008, ApJ,678, L47
Blundell, K. M., & Kuncic, Z. 2007, ApJ, 668, L103Bowler, M. G. 2010, A&A, 516, A24Bonsignori-Facondi, S. R., Padrielli, L., Montebugnoli, S., & Bar-bieri, R. 1986, A&A, 166, 157
Chanan, G. A., Middleditch, J., & Nelson, J. E. 1976, ApJ, 208,512
Chakrabarti, S. K., et al. 2005, MNRAS, 362, 957Cherepashchuk, A. M., et al. 2005, A&A, 437, 561Cherepashchuk, A. M. et al 2008 PoS 1 Nov 7th INTEGRALworkshop, arXiv:0811.0069v1
Claret, A. 2004, A&A, 424, 919
c© 0000 RAS, MNRAS000, 000–000

10 Blundell, Schmidtobreick & Trushkin
Claret, A., & Gimenez, A. 1992, A&AS, 96, 255Claret, A., & Gimenez, A. 1993, A&A, 277, 487Crampton, D., Cowley, A. P., & Hutchings, J. B. 1980, ApJ, 235,L131
Crampton, D., & Hutchings, J. B. 1981, ApJ, 251, 604Dekker, H., Delabre, B. & D’Odorico, S. , 1986, SPIE 627, 39Doolin, S., & Blundell, K. M. 2009, ApJ, 698, L23Dopita, M. A., & Cherepashchuk, A. M. 1981, Vistas in Astron-omy, 25, 51
Eggleton, P. P. 1983, ApJ, 268, 368Fabrika, S. N., & Bychkova, L. V. 1990, A&A, 240, L5Fabrika, S. 2004, Astrophysics and Space Physics Reviews, 12, 1Fabrika S. & Irsmambetova T., 2003, New Views on Micro-quasars, 276
Falomo, R., Boksenberg, A., Tanzi, E. G., Tarenghi, M., & Treves,A. 1987, MNRAS, 224, 323
Fiedler, R. L., et al. 1987, AJ, 94, 1244Fender, R. P., Belloni, T. M., & Gallo, E. 2004, MNRAS, 355,1105
Gies, D. R., McSwain, M. V., Riddle, R. L., Wang, Z., Wiita, P.J.,& Wingert, D. W. 2002, ApJ, 566, 1069
Goranskii, V. P., Esipov, V. F., & Cherepashchuk, A. M. 1998,Astronomy Reports, 42, 209
Kopylov, I. M. et al (1985) Sov. Astron. 29 186Kotani, T., et al. 2006, VI Microquasar Workshop: Microquasarsand Beyond,
Margon, B., Anderson, S. F., Aller, L. H., Downes, R. A., &Keyes, C. D. 1984, ApJ, 281, 313
Miller-Jones, J. C. A., Blundell, K. M., Rupen, M. P., Mio-duszewski, A. J., Duffy, P., & Beasley, A. J. 2004, ApJ, 600,368
Miller-Jones, J.C.A., Blundell, K.M., Duffy, P., Tammi, J., Podis-adlowski Ph., Mioduszewski A., Rupen M., & Trushkin S., inprep
Mioduszewski, A. J., Rupen, M. P., Walker, R. C., Schillemat,K. M., & Taylor, G. B. 2004, Bulletin of the American Astro-nomical Society, 36, 967
Mirabel, I. F., & Rodrıguez, L. F. 1998, Nat, 392, 673Nandi, A., Chakrabarti, S. K., Belloni, T., & Goldoni, P. 2005,MNRAS, 359, 629
Nipoti, C., Blundell, K. M., & Binney, J. 2005, MNRAS, 361, 633Paragi, Z., Vermeulen, R. C., Fejes, I., Schilizzi, R. T., Spencer,R. E., & Stirling, A. M. 1999, A&A, 348, 910
Perez M., S., & Blundell, K. M. 2009, MNRAS, 397, 849Perez M., S., & Blundell, K. M. 2010, MNRAS, 408, 2Seaquist, E. R., Gilmore, W. S., Johnston, K. J., & Grindlay,J. E.1982, ApJ, 260, 220
Schmidtobreick, L., & Blundell, K. 2006, VI Microquasar Work-shop: Microquasars and Beyond
Trushkin, S. A., Bursov, N. N., Kotani, T., Nizhelskij, N. A.,Namiki, M., Tsuboi, M., & Voitsik, P. A. 2007, ESA SpecialPublication, 622, 357
Vermeulen R.C., 1989, PhD Thesis, University of LeidenVermeulen, R. C., Icke, V., Schilizzi, R. T., Fejes, I., & Spencer,R. E. 1987, Nat, 328, 309
Vermeulen, R. C., Schilizzi, R. T., Spencer, R. E., Romney, J. D.,& Fejes, I. 1993a, A&A, 270, 177
Vermeulen, R. C., McAdam, W. B., Trushkin, S. A., Facondi,S. R., Fiedler, R. L., Hjellming, R. M., Johnston, K. J., & Corbin,J. 1993b, A&A, 270, 189
Vermeulen, R. C., et al. 1993c, A&A, 270, 204
c© 0000 RAS, MNRAS000, 000–000