ACCRETION SIMULATIONS OF CARINAE AND IMPLICATIONS FOR … · was identi ed by Davidson et al....
5
Stars and their variability observed from space C. Neiner, W. W. Weiss, D. Baade, R. E. Griffin, C. C. Lovekin, A. F. J. Moffat (eds) ACCRETION SIMULATIONS OF η CARINAE AND IMPLICATIONS FOR THE EVOLUTION OF MASSIVE BINARIES A. Kashi 1 Abstract. This contribution presented high-resolution numerical simulations of the colliding wind system η Carinae, showing accretion of the primary wind onto the secondary star close to periastron passage. We found that the stellar winds collide and develop instabilities, mainly the non-linear thin shell instability, and form filaments and clumps. We also found that a few days before periastron passage the dense filaments and clumps flow towards the secondary as a result of its gravitational attraction, and are then accreted onto the secondary. We ran our simulations for a conventional model of stellar masses, M1 = 120 M and M2 = 30 M, and for the high-mass model, M1 = 170 M and M2 = 80 M, that was proposed to fit better the history of giant eruptions in the 19 th Century, as well as radial-velocity variations of spectral lines during recent spectroscopic events. The results of the simulations show that the accretion process is more pronounced in the high-mass model, and that the amount of mass accreted, as well as the duration of the accretion, are also fitted much better. Our findings establish η Car as the most massive binary system in the Galaxy. As our simulations demonstrate, the presence of a binary companion can have a huge influence on the evolution of massive stars, especially at later stages where it may undergo giant episodes of mass loss. Keywords: Stars: massive, mass-loss, winds, outflows, accretion, accretion disks, binaries: general 1 Introduction Massive stars involve physical processes that are not often seen in low mass stars, such as rotation at almost critical speeds, strong winds and eruptive outbursts (e.g., Heger & Langer 2000; Heger et al. 2000; Kudritzki & Puls 2000; Puls et al. 2008; Meynet et al. 2009; Davidson & Humphreys 2012; Vink et al. 2015). Perhaps the most interesting phenomena observed in massive stars are related to ithe fact that most of them (≈ 70% according to Sana et al. 2012) share their lives with a companion star, which may influence their evolution considerably (e.g., De Marco & Izzard 2017; Eldridge 2017; van den Heuvel 2017). The massive binary system η Carinae is composed of a primary which is a very massive star at a late stage of its evolution, and a secondary which is a hotter and less luminous evolved main-sequence (MS) star (e.g., Davidson & Humphreys 1997, 2012). (e.g., Davidson & Humphreys 1997; Davidson et al. 2017), and strong winds (Pittard & Corcoran 2002; Akashi et al. 2006), resulting in a unique phase of strong interaction every 5.54 years during periastron passage known as the “spectroscopic event”. During the event many spectral lines and emission at practically all wavelengths show rapid variability (e.g., Nielsen et al. 2007; Damineli et al. 2008b,a; Davidson et al. 2015; Mehner et al. 2015, and many refs. therein). The X-ray intensity, which also serves as an indicator of the intensity of wind interaction, drops for a few weeks, changing from one spectroscopic event to the other (Corcoran et al. 2015). Soker (2005a) developed a model to interpret the line variations during the spectroscopic event as a result of accreting clumps of gas onto the secondary near periastron passages, disabling its wind. The suggestion was later developed into a detailed model accounting for various observations (Akashi et al. 2006; Kashi & Soker 2009b). An estimate of the amount of accreted mass during the spectroscopic event was first obtained by Kashi & Soker (2009a), who performed a detailed calculation, integrating over time and volume of the density within the Bondi–Hoyle–Lyttleton accretion radius around the secondary. Kashi & Soker (2009a) found that accretion should take place close to periastron, and that the secondary should accrete ∼ few × 10 -6 M each cycle. The last three spectroscopic events, 2003.5, 2009 and 2014.6, were different from each other, and reflected a trend in the intensities of various lines (Mehner et al. 2015). Observations of spectral lines during the 2014.6 event were interpreted as weaker accretion onto the secondary close to periastron passage compared to previous events, indicating a decrease in the mass loss rate from the primary star. This ‘change of state’ of the primary 1 Ariel University, 4070000 Ariel, Israel ; Email: [email protected] ; ORCID:0000-0002-7840-0181 c Stars from Space
Transcript of ACCRETION SIMULATIONS OF CARINAE AND IMPLICATIONS FOR … · was identi ed by Davidson et al....
Stars and their variability observed from spaceC. Neiner, W. W. Weiss, D. Baade, R. E. Griffin, C. C. Lovekin, A. F. J. Moffat (eds)
ACCRETION SIMULATIONS OF η CARINAEAND IMPLICATIONS FOR THE EVOLUTION OF MASSIVE BINARIES
A. Kashi1
Abstract. This contribution presented high-resolution numerical simulations of the colliding wind systemη Carinae, showing accretion of the primary wind onto the secondary star close to periastron passage. Wefound that the stellar winds collide and develop instabilities, mainly the non-linear thin shell instability, andform filaments and clumps. We also found that a few days before periastron passage the dense filamentsand clumps flow towards the secondary as a result of its gravitational attraction, and are then accretedonto the secondary. We ran our simulations for a conventional model of stellar masses, M1 = 120 M� andM2 = 30 M�, and for the high-mass model, M1 = 170 M� and M2 = 80 M�, that was proposed to fitbetter the history of giant eruptions in the 19th Century, as well as radial-velocity variations of spectral linesduring recent spectroscopic events. The results of the simulations show that the accretion process is morepronounced in the high-mass model, and that the amount of mass accreted, as well as the duration of theaccretion, are also fitted much better. Our findings establish ηCar as the most massive binary system in theGalaxy. As our simulations demonstrate, the presence of a binary companion can have a huge influence onthe evolution of massive stars, especially at later stages where it may undergo giant episodes of mass loss.
Keywords: Stars: massive, mass-loss, winds, outflows, accretion, accretion disks, binaries: general
1 Introduction
Massive stars involve physical processes that are not often seen in low mass stars, such as rotation at almostcritical speeds, strong winds and eruptive outbursts (e.g., Heger & Langer 2000; Heger et al. 2000; Kudritzki& Puls 2000; Puls et al. 2008; Meynet et al. 2009; Davidson & Humphreys 2012; Vink et al. 2015). Perhapsthe most interesting phenomena observed in massive stars are related to ithe fact that most of them (≈ 70%according to Sana et al. 2012) share their lives with a companion star, which may influence their evolutionconsiderably (e.g., De Marco & Izzard 2017; Eldridge 2017; van den Heuvel 2017).
The massive binary system η Carinae is composed of a primary which is a very massive star at a late stageof its evolution, and a secondary which is a hotter and less luminous evolved main-sequence (MS) star (e.g.,Davidson & Humphreys 1997, 2012). (e.g., Davidson & Humphreys 1997; Davidson et al. 2017), and strongwinds (Pittard & Corcoran 2002; Akashi et al. 2006), resulting in a unique phase of strong interaction every 5.54years during periastron passage known as the “spectroscopic event”. During the event many spectral lines andemission at practically all wavelengths show rapid variability (e.g., Nielsen et al. 2007; Damineli et al. 2008b,a;Davidson et al. 2015; Mehner et al. 2015, and many refs. therein). The X-ray intensity, which also serves as anindicator of the intensity of wind interaction, drops for a few weeks, changing from one spectroscopic event tothe other (Corcoran et al. 2015).
Soker (2005a) developed a model to interpret the line variations during the spectroscopic event as a resultof accreting clumps of gas onto the secondary near periastron passages, disabling its wind. The suggestion waslater developed into a detailed model accounting for various observations (Akashi et al. 2006; Kashi & Soker2009b). An estimate of the amount of accreted mass during the spectroscopic event was first obtained by Kashi& Soker (2009a), who performed a detailed calculation, integrating over time and volume of the density withinthe Bondi–Hoyle–Lyttleton accretion radius around the secondary. Kashi & Soker (2009a) found that accretionshould take place close to periastron, and that the secondary should accrete ∼ few × 10−6 M� each cycle.
The last three spectroscopic events, 2003.5, 2009 and 2014.6, were different from each other, and reflecteda trend in the intensities of various lines (Mehner et al. 2015). Observations of spectral lines during the 2014.6event were interpreted as weaker accretion onto the secondary close to periastron passage compared to previousevents, indicating a decrease in the mass loss rate from the primary star. This ‘change of state’ of the primary
1 Ariel University, 4070000 Ariel, Israel ; Email: [email protected] ; ORCID:0000-0002-7840-0181
c© Stars from Space
244 Stars and their variability observed from space
was identified by Davidson et al. (2005) and also predicted from numerical simulations by Kashi et al. (2016).Further indications of the change of state was found by comparing UV emission lines at similar orbital phasesseparated by two orbital revolutions, at positions far from periastron passage (Davidson et al. 2018).
Older grid-based simulations (Parkin et al. 2009, 2011) and Smoothed Particle Hydrodynamics (SPH) sim-ulations (Okazaki et al. 2008; Madura et al. 2013) of the colliding winds did not accretion onto the secondary.Teodoro et al. (2012) and Madura et al. (2013) argued against the need for accretion to explain the spectroscopicevent. But in spite of those claims, Parkin et al. (2011) simulated stationary colliding winds at the time ofperiastron and showed that unstable wind and clumps were formed and reached to distance that was very nearthe secondary. Since their simulations were unable to reach high resolution they could not obtain a clear pictureof accretion, but they postulated that high-resolution simulations with “switching off” the initiation of the windwill be able to reveal a wind “collapse”. These simulations did not include the gravity of the secondary either,but it was later found to be important for accretion to take place.
Akashi et al. (2013) also simulated the wind interaction, and found that clumps of gas were formed a fewdays before periastron passage owing to instabilities in the colliding winds structure, in agreement with X-rayflares observed at that time (Moffat & Corcoran 2009). Some of the clumps moved towards the secondary, andreached one grid cell from the secondary wind injection zone, implying accretion. However, the resolution ofthese simulations was not fine enough to see the accretion itself.
The simulations presented below extend those of Akashi et al. (2013) in the sense that they include (1) higherresolution that could trace the flow better, allow the development of instabilities, and reveal final details, and (2)more detailed physical treatment. The following discusses the results of our simulation and their implicationsfor massive-star research.
2 Simulations and Results
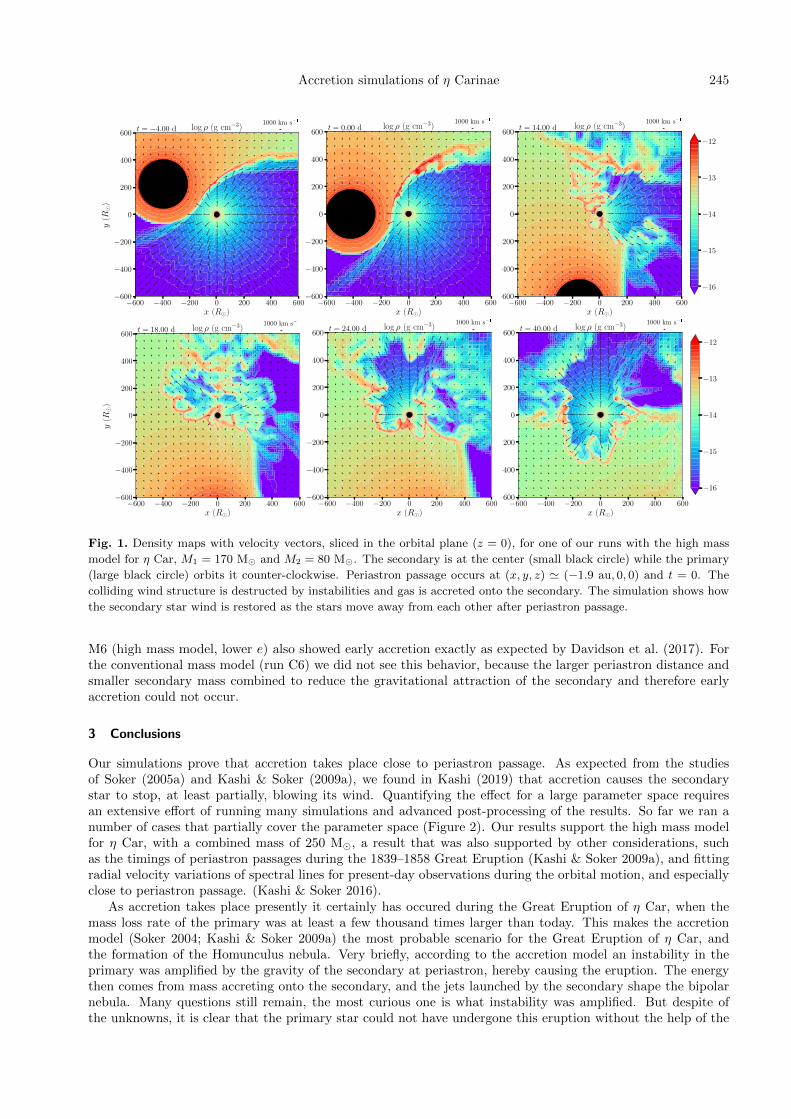
The simulations were described in detail by Kashi (2017) and Kashi (2019). The final evidence for accretioncame from the simulations of Kashi (2017) that included many more physical effects (e.g., gravity of the twostars, radiative cooling, radiation transfer, artificial viscosity), and showed the destruction of the colliding windsstructure into filaments and clumps that later were accreted onto the secondary. They demonstrated that denseclumps are crucial to the onset of the accretion process. The clumps were formed by the smooth colliding stellarwinds that developed instabilities, (mainly the non-linear thin shell instability, NLTI: Vishniac 1994)) that latergrew into clumps (no artificial clumps were seeded). This confirmed the preceding theoretical arguments bySoker (2005a,b) who suggested accretion of clumps. Furthermore, as the simulations in Kashi (2017) includeda radiation transfer unit which treats the photon-gas interaction, so the momentum of the accreted gas is beingchanged appropriately along its trajectory. It thus quantitatively showed that radiative braking cannot preventthe accretion, thereby confirming theoretical arguments given by Kashi & Soker (2009a). Kashi (2019) extendedthe simulations to treat the response of a wind blowing star to mass that arrives with strong momentum and isaccreted onto its surface. Figure 1 shows the results for one of our simulations.
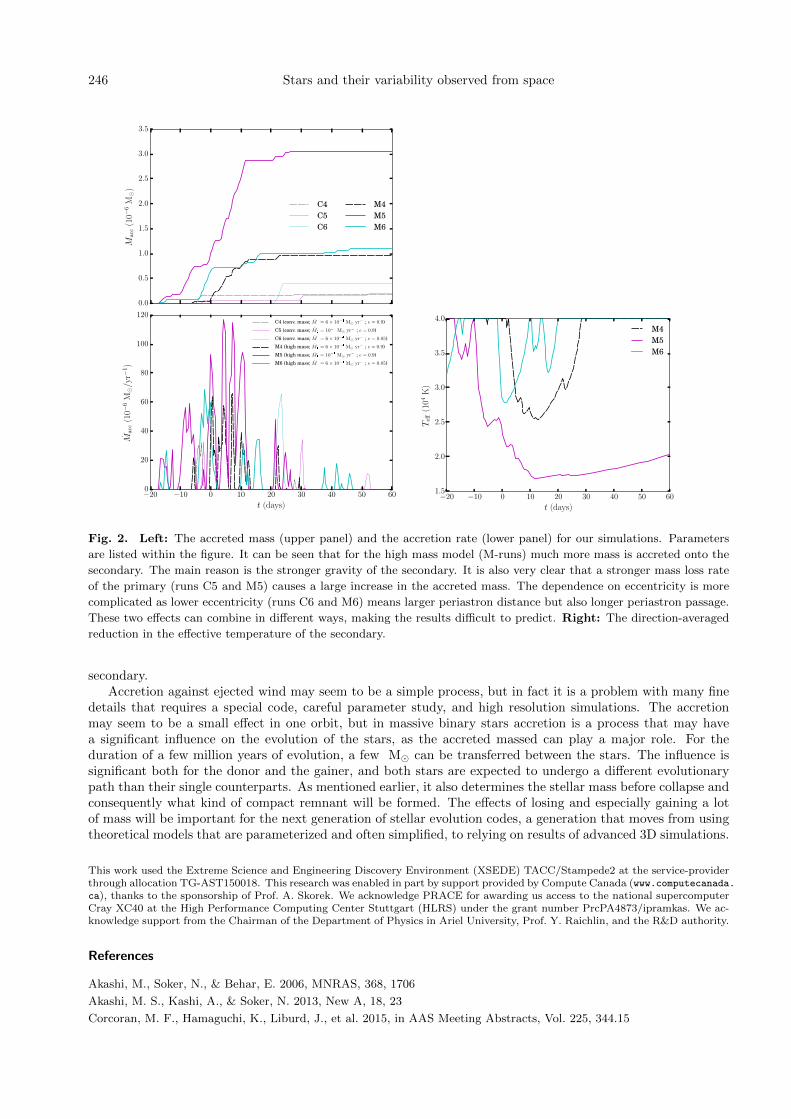
We found that accretion is obtained for both the conventional mass model (M1 = 120 M�, M2 = 30 M�)and the high mass model (M1 = 170 M�, M2 = 80 M�). For the high mass model the stronger secondarygravity attracts the clumps and we get higher accreted mass of Macc ' few×10−6 M� yr−1 and longer accretionperiods, in the order of a month, which more closely match the observed ones. We also calculated the increase inoptical depth in any line of sight and the reduction in the effective temperature (Teff) as a result. Observationsof lines during the spectroscopic event indicate ionizing radiation from the secondary equivalent to that of astar with Teff . 25 000 K. For reasonable and even high mass loss rates, only the high mass model we testedmatched the observed decline in Teff (Figure 2, right panel).
We ran a number of simulations with varying parameters (Figure 2, left panels). An important parameter westudied is the mass loss rate of the primary (see Kashi 2017). We found that the mass loss rate of the primaryaffects the accretion rate of the secondary in a non-linear way, and found a strong dependency between theaccreted mass and the mass loss rate of the primary. The simulations showed that if the mass loss rate of theprimary is lowered by a factor of a few the accretion can stop. Thwrefore, they supported the claim of Mehneret al. (2015), who suggested that, if the mass loss rate of the primary continues to decrease, future spectroscopicevents will be very weak or might not occur at all (though a recent paper argues differently; Mehner et al. 2019).
Another parameter we varied is the eccentricity, for which we also tested e = 0.85. This value was favoredby Davidson et al. (2017) because it gives the smallest possible separation distance at the beginning of thespectroscopic event. It was therefore expected that e = 0.85 would produce earlier accretion compared toe = 0.9, even though the periastron distance is 50% larger for the smaller eccentricity. Figure 2 shows ourresults, confirming that for e = 0.85 the accretion duration is indeed longer, and more mass was accreted. Run
Accretion simulations of η Carinae 245
Fig. 1. Density maps with velocity vectors, sliced in the orbital plane (z = 0), for one of our runs with the high mass
model for η Car, M1 = 170 M� and M2 = 80 M�. The secondary is at the center (small black circle) while the primary
(large black circle) orbits it counter-clockwise. Periastron passage occurs at (x, y, z) ' (−1.9 au, 0, 0) and t = 0. The
colliding wind structure is destructed by instabilities and gas is accreted onto the secondary. The simulation shows how
the secondary star wind is restored as the stars move away from each other after periastron passage.
M6 (high mass model, lower e) also showed early accretion exactly as expected by Davidson et al. (2017). Forthe conventional mass model (run C6) we did not see this behavior, because the larger periastron distance andsmaller secondary mass combined to reduce the gravitational attraction of the secondary and therefore earlyaccretion could not occur.
3 Conclusions
Our simulations prove that accretion takes place close to periastron passage. As expected from the studiesof Soker (2005a) and Kashi & Soker (2009a), we found in Kashi (2019) that accretion causes the secondarystar to stop, at least partially, blowing its wind. Quantifying the effect for a large parameter space requiresan extensive effort of running many simulations and advanced post-processing of the results. So far we ran anumber of cases that partially cover the parameter space (Figure 2). Our results support the high mass modelfor η Car, with a combined mass of 250 M�, a result that was also supported by other considerations, suchas the timings of periastron passages during the 1839–1858 Great Eruption (Kashi & Soker 2009a), and fittingradial velocity variations of spectral lines for present-day observations during the orbital motion, and especiallyclose to periastron passage. (Kashi & Soker 2016).
As accretion takes place presently it certainly has occured during the Great Eruption of η Car, when themass loss rate of the primary was at least a few thousand times larger than today. This makes the accretionmodel (Soker 2004; Kashi & Soker 2009a) the most probable scenario for the Great Eruption of η Car, andthe formation of the Homunculus nebula. Very briefly, according to the accretion model an instability in theprimary was amplified by the gravity of the secondary at periastron, hereby causing the eruption. The energythen comes from mass accreting onto the secondary, and the jets launched by the secondary shape the bipolarnebula. Many questions still remain, the most curious one is what instability was amplified. But despite ofthe unknowns, it is clear that the primary star could not have undergone this eruption without the help of the
246 Stars and their variability observed from space
Fig. 2. Left: The accreted mass (upper panel) and the accretion rate (lower panel) for our simulations. Parameters
are listed within the figure. It can be seen that for the high mass model (M-runs) much more mass is accreted onto the
secondary. The main reason is the stronger gravity of the secondary. It is also very clear that a stronger mass loss rate
of the primary (runs C5 and M5) causes a large increase in the accreted mass. The dependence on eccentricity is more
complicated as lower eccentricity (runs C6 and M6) means larger periastron distance but also longer periastron passage.
These two effects can combine in different ways, making the results difficult to predict. Right: The direction-averaged
reduction in the effective temperature of the secondary.
secondary.Accretion against ejected wind may seem to be a simple process, but in fact it is a problem with many fine
details that requires a special code, careful parameter study, and high resolution simulations. The accretionmay seem to be a small effect in one orbit, but in massive binary stars accretion is a process that may havea significant influence on the evolution of the stars, as the accreted massed can play a major role. For theduration of a few million years of evolution, a few M� can be transferred between the stars. The influence issignificant both for the donor and the gainer, and both stars are expected to undergo a different evolutionarypath than their single counterparts. As mentioned earlier, it also determines the stellar mass before collapse andconsequently what kind of compact remnant will be formed. The effects of losing and especially gaining a lotof mass will be important for the next generation of stellar evolution codes, a generation that moves from usingtheoretical models that are parameterized and often simplified, to relying on results of advanced 3D simulations.
This work used the Extreme Science and Engineering Discovery Environment (XSEDE) TACC/Stampede2 at the service-providerthrough allocation TG-AST150018. This research was enabled in part by support provided by Compute Canada (www.computecanada.ca), thanks to the sponsorship of Prof. A. Skorek. We acknowledge PRACE for awarding us access to the national supercomputerCray XC40 at the High Performance Computing Center Stuttgart (HLRS) under the grant number PrcPA4873/ipramkas. We ac-knowledge support from the Chairman of the Department of Physics in Ariel University, Prof. Y. Raichlin, and the R&D authority.
References
Akashi, M., Soker, N., & Behar, E. 2006, MNRAS, 368, 1706
Akashi, M. S., Kashi, A., & Soker, N. 2013, New A, 18, 23
Corcoran, M. F., Hamaguchi, K., Liburd, J., et al. 2015, in AAS Meeting Abstracts, Vol. 225, 344.15
Accretion simulations of η Carinae 247
Damineli, A., Hillier, D. J., Corcoran, M. F., et al. 2008a, MNRAS, 386, 2330
Damineli, A., Hillier, D. J., Corcoran, M. F., et al. 2008b, MNRAS, 384, 1649
Davidson, K. & Humphreys, R. 2012, ASSL, 384
Davidson, K. & Humphreys, R. M. 1997, ARA&A, 35, 1
Davidson, K., Ishibashi, K., & Martin, J. C. 2017, Research Notes of the AAS, 1, 6
Davidson, K., Ishibashi, K., Martin, J. C., & Humphreys, R. M. 2018, ApJ, 858, 109
Davidson, K., Martin, J., Humphreys, R. M., et al. 2005, AJ, 129, 900
Davidson, K., Mehner, A., Humphreys, R. M., Martin, J. C., & Ishibashi, K. 2015, ApJ, 801, L15
De Marco, O. & Izzard, R. G. 2017, PASA, 34, e001
Eldridge, J. J. 2017, Population Synthesis of Massive Close Binary Evolution, in Handbook of Supernovae (Springer),671
Heger, A. & Langer, N. 2000, ApJ, 544, 1016
Heger, A., Woosley, S. E., & Langer, N. 2000, New A Rev., 44, 297
Kashi, A. 2017, MNRAS, 464, 775
Kashi, A. 2019, MNRAS, 486, 926
Kashi, A., Davidson, K., & Humphreys, R. M. 2016, ApJ, 817, 66
Kashi, A. & Soker, N. 2009a, New A, 14, 11
Kashi, A. & Soker, N. 2009b, MNRAS, 397, 1426
Kashi, A. & Soker, N. 2016, ApJ, 825, 105
Kudritzki, R.-P. & Puls, J. 2000, ARA&A, 38, 613
Madura, T. I., Gull, T. R., Okazaki, A. T., et al. 2013, MNRAS, 436, 3820
Mehner, A., Davidson, K., Humphreys, R. M., et al. 2015, A&A, 578, A122
Mehner, A., de Wit, W. J., Asmus, D., et al. 2019, arXiv e-prints, arXiv:1908.09154
Meynet, G., Ekstrom, S., Georgy, C., Chiappini, C., & Maeder, A. 2009, Reviews in Modern Astronomy, 21, 97
Moffat, A. F. J. & Corcoran, M. F. 2009, ApJ, 707, 693
Nielsen, K. E., Corcoran, M. F., Gull, T. R., et al. 2007, ApJ, 660, 669
Okazaki, A. T., Owocki, S. P., Russell, C. M. P., & Corcoran, M. F. 2008, MNRAS, 388, L39
Parkin, E. R., Pittard, J. M., Corcoran, M. F., & Hamaguchi, K. 2011, ApJ, 726, 105
Parkin, E. R., Pittard, J. M., Corcoran, M. F., Hamaguchi, K., & Stevens, I. R. 2009, MNRAS, 394, 1758
Pittard, J. M. & Corcoran, M. F. 2002, A&A, 383, 636
Puls, J., Vink, J. S., & Najarro, F. 2008, A&A Rev., 16, 209
Sana, H., de Mink, S. E., de Koter, A., et al. 2012, Science, 337, 444
Soker, N. 2004, ApJ, 612, 1060
Soker, N. 2005a, ApJ, 635, 540
Soker, N. 2005b, ApJ, 619, 1064
Teodoro, M., Damineli, A., Arias, J. I., et al. 2012, ApJ, 746, 73
van den Heuvel, E. P. J. 2017, Supernovae and the Evolution of Close Binary Systems, in Handbook of Supernovae(Springer), 1527
Vink, J. S., Heger, A., Krumholz, M. R., et al. 2015, Highlights of Astronomy, 16, 51
Vishniac, E. T. 1994, ApJ, 428, 186