X-Shooter study of accretion in ˆ-Ophiucus: very low-mass ... · Manara et al.: X-Shooter study of...
28
Astronomy & Astrophysics manuscript no. oph˙acc c ESO 2018 September 27, 2018 X-Shooter study of accretion in ρ-Ophiucus: very low-mass stars and brown dwarfs ? C.F. Manara 1,?? , L. Testi 2,3,4 , A. Natta 3,5 , and J. M. Alcal´ a 6 1 Scientific Support Office, Directorate of Science and Robotic Exploration, European Space Research and Technology Centre (ESA/ESTEC), Keplerlaan 1, 2201 AZ Noordwijk, The Netherlands e-mail: [email protected] 2 European Southern Observatory, Karl Schwarzschild Str. 2, 85748 Garching bei M¨ unchen, Germany 3 INAF/Osservatorio Astrofisico of Arcetri, Largo E. Fermi, 5, 50125 Firenze, Italy 4 Excellence Cluster Universe, Boltzmannstr. 2, D-85748 Garching bei M¨ unchen, Germany 5 School of Cosmic Physics, Dublin Institute for Advanced Studies, 31 Fitzwilliams Place, 2 Dublin, Ireland 6 INAF/Osservatorio Astronomico di Capodimonte, Salita Moiariello, 16 80131 Napoli, Italy Received March, 24th 2015; accepted May, 4th 2015 ABSTRACT We present new VLT/X-Shooter optical and near-infrared spectra of a sample of 17 candidate young low-mass stars and brown dwarfs located in the ρ-Ophiucus cluster. We derived the spectral type and extinction for all the targets, and then we determined their physical parameters. All the objects but one have M ? .0.6 M , and eight have mass below or close to the hydrogen-burning limit. Using the intensity of various permitted emission lines present in their spectra, we determined the accretion luminosity and mass accretion rates ( ˙ M acc ) for all the objects. When compared with previous works targeting the same sample, we find that, in general, these objects are not as strongly accreting as previously reported, and we suggest that the reason is our more accurate estimate of the photospheric parameters. We also compare our findings with recent works in other slightly older star-forming regions, such as Lupus, to investigate possible differences in the accretion properties, but we find that the accretion properties for our targets have the same dependence on the stellar and substellar parameters as in the other regions. This leads us to conclude that we do not find evidence for a different dependence of ˙ M acc with M ? when comparing low-mass stars and brown dwarfs. Moreover, we find a similar small (.1 dex) scatter in the ˙ M acc - M ? relation as in some of our recent works in other star-forming regions, and no significant differences in ˙ M acc due to different ages or properties of the regions. The latter result suffers, however, from low statistics and sample selection biases in the current studies. The small scatter in the ˙ M acc - M ? correlation confirms that mass accretion rate measurements in the literature based on uncertain photospheric parameters and single accretion indicators, such as the Hα width, can lead to a scatter that is unphysically large. Our studies show that only broadband spectroscopic surveys coupled with a detailed analysis of the photospheric and accretion properties allows us to properly study the evolution of disk accretion rates in star-forming regions. Key words. Stars: pre-main sequence – stars: formation – brown dwarfs – protoplanetary disks – accretion, accretion disks – open clusters and associations: individual: ρ-Ophiucus 1. Introduction The evolution of protoplanetary disks surrounding forming stars has been a major subject of study in recent years. The interest in this topic is driven by the fact that disks are the birthplace of planets. A clear understanding of the physical mechanisms driving the formation, evolution, and dispersal of disks is thus needed to constrain planet formation theories, and to explain the observed properties of our own solar system and of the wealth of exoplanetary systems discovered so far. During their evolution, the central young stellar object (YSO) and the surrounding disk interact through multiple pro- cesses, such as photoevaporation, stellar winds, and accretion of matter. The latter is a result of viscous processes happening in the disk, which drive its secular evolution (e.g., Hartmann et al., 1998), while photoevaporation and winds/outflows are thought to play a major role in the final disk dispersal (e.g., Alexander et al., 2014, and references therein). A good understanding of these ? This work is based on observations made with ESO Telescopes at the Paranal Observatory under programme ID 085.C-0876. ?? ESA Research Fellow processes is needed to describe how disks evolve, and thus how planet formation takes place. Star-disk interaction processes can be studied observationally through the strong signatures they in- troduce in the spectra of YSOs. Accretion shocks give rise to continuum excess emission in the UV (e.g., Valenti et al., 1993; Gullbring et al., 1998, 2000; Calvet & Gullbring, 1998; Calvet et al., 2000) and the prominent emission of permitted lines across the whole spectrum (e.g., Muzerolle et al., 1998a,b,c, 2003; Natta et al., 2004), while winds are traced by various forbid- den emission lines (e.g., Hartigan et al., 1995; Rigliaco et al., 2013; Natta et al., 2014). In recent years, new instruments have provided the possibility of studying these processes simultane- ously in large samples of objects. In particular, the X-Shooter spectrograph mounted on the ESO/VLT telescope (Vernet et al., 2011) provides us the possibility of studying YSOs with un- precedented levels of detail, as it simultaneously takes spectra at medium resolution (R∼5000-20000) over the complete wave- length range from ∼300 nm to ∼2500 nm. We are thus able to study all the signatures of accretion and winds in the optical and near-infrared spectra of YSOs at the same time. 1 arXiv:1505.04046v1 [astro-ph.SR] 15 May 2015
Transcript of X-Shooter study of accretion in ˆ-Ophiucus: very low-mass ... · Manara et al.: X-Shooter study of...
Astronomy & Astrophysics manuscript no. oph˙acc c© ESO 2018September 27, 2018
X-Shooter study of accretion in ρ-Ophiucus:very low-mass stars and brown dwarfs ?
C.F. Manara1,??, L. Testi2,3,4, A. Natta3,5, and J. M. Alcala6
1 Scientific Support Office, Directorate of Science and Robotic Exploration, European Space Research and Technology Centre(ESA/ESTEC), Keplerlaan 1, 2201 AZ Noordwijk, The Netherlandse-mail: [email protected]
2 European Southern Observatory, Karl Schwarzschild Str. 2, 85748 Garching bei Munchen, Germany3 INAF/Osservatorio Astrofisico of Arcetri, Largo E. Fermi, 5, 50125 Firenze, Italy4 Excellence Cluster Universe, Boltzmannstr. 2, D-85748 Garching bei Munchen, Germany5 School of Cosmic Physics, Dublin Institute for Advanced Studies, 31 Fitzwilliams Place, 2 Dublin, Ireland6 INAF/Osservatorio Astronomico di Capodimonte, Salita Moiariello, 16 80131 Napoli, Italy
Received March, 24th 2015; accepted May, 4th 2015
ABSTRACT
We present new VLT/X-Shooter optical and near-infrared spectra of a sample of 17 candidate young low-mass stars and brown dwarfslocated in the ρ-Ophiucus cluster. We derived the spectral type and extinction for all the targets, and then we determined their physicalparameters. All the objects but one have M?.0.6 M�, and eight have mass below or close to the hydrogen-burning limit. Using theintensity of various permitted emission lines present in their spectra, we determined the accretion luminosity and mass accretion rates(Macc) for all the objects. When compared with previous works targeting the same sample, we find that, in general, these objects arenot as strongly accreting as previously reported, and we suggest that the reason is our more accurate estimate of the photosphericparameters. We also compare our findings with recent works in other slightly older star-forming regions, such as Lupus, to investigatepossible differences in the accretion properties, but we find that the accretion properties for our targets have the same dependenceon the stellar and substellar parameters as in the other regions. This leads us to conclude that we do not find evidence for a differentdependence of Macc with M? when comparing low-mass stars and brown dwarfs. Moreover, we find a similar small (.1 dex) scatterin the Macc-M? relation as in some of our recent works in other star-forming regions, and no significant differences in Macc due todifferent ages or properties of the regions. The latter result suffers, however, from low statistics and sample selection biases in thecurrent studies. The small scatter in the Macc-M? correlation confirms that mass accretion rate measurements in the literature basedon uncertain photospheric parameters and single accretion indicators, such as the Hα width, can lead to a scatter that is unphysicallylarge. Our studies show that only broadband spectroscopic surveys coupled with a detailed analysis of the photospheric and accretionproperties allows us to properly study the evolution of disk accretion rates in star-forming regions.
Key words. Stars: pre-main sequence – stars: formation – brown dwarfs – protoplanetary disks – accretion, accretion disks – openclusters and associations: individual: ρ-Ophiucus
1. Introduction
The evolution of protoplanetary disks surrounding forming starshas been a major subject of study in recent years. The interestin this topic is driven by the fact that disks are the birthplaceof planets. A clear understanding of the physical mechanismsdriving the formation, evolution, and dispersal of disks is thusneeded to constrain planet formation theories, and to explain theobserved properties of our own solar system and of the wealthof exoplanetary systems discovered so far.
During their evolution, the central young stellar object(YSO) and the surrounding disk interact through multiple pro-cesses, such as photoevaporation, stellar winds, and accretion ofmatter. The latter is a result of viscous processes happening inthe disk, which drive its secular evolution (e.g., Hartmann et al.,1998), while photoevaporation and winds/outflows are thoughtto play a major role in the final disk dispersal (e.g., Alexander etal., 2014, and references therein). A good understanding of these
? This work is based on observations made with ESO Telescopes atthe Paranal Observatory under programme ID 085.C-0876.?? ESA Research Fellow
processes is needed to describe how disks evolve, and thus howplanet formation takes place. Star-disk interaction processes canbe studied observationally through the strong signatures they in-troduce in the spectra of YSOs. Accretion shocks give rise tocontinuum excess emission in the UV (e.g., Valenti et al., 1993;Gullbring et al., 1998, 2000; Calvet & Gullbring, 1998; Calvet etal., 2000) and the prominent emission of permitted lines acrossthe whole spectrum (e.g., Muzerolle et al., 1998a,b,c, 2003;Natta et al., 2004), while winds are traced by various forbid-den emission lines (e.g., Hartigan et al., 1995; Rigliaco et al.,2013; Natta et al., 2014). In recent years, new instruments haveprovided the possibility of studying these processes simultane-ously in large samples of objects. In particular, the X-Shooterspectrograph mounted on the ESO/VLT telescope (Vernet et al.,2011) provides us the possibility of studying YSOs with un-precedented levels of detail, as it simultaneously takes spectraat medium resolution (R∼5000-20000) over the complete wave-length range from ∼300 nm to ∼2500 nm. We are thus able tostudy all the signatures of accretion and winds in the optical andnear-infrared spectra of YSOs at the same time.
1
arX
iv:1
505.
0404
6v1
[as
tro-
ph.S
R]
15
May
201
5
Manara et al.: X-Shooter study of accretion in ρ-Ophiucus
A significant effort has been made recently to study YSOswith X-Shooter. The accretion process has been studied forobjects located in various nearby star-forming regions (σ-Ori,Rigliaco et al. 2012; Lupus, Alcala et al. 2014; Chamaeleon,Manara et al. 2015) and at various phases of disk evolution (e.g.,transitional disks; Manara et al., 2014). These works, among var-ious results, showed that the mass accretion rates (Macc) depen-dence on the stellar mass (M?) has a significant smaller scat-ter (∼0.4 dex) than previously observed (Alcala et al., 2014),and that there are transitional disks with comparable accretionrates as less evolved disks (Manara et al., 2014). These worksfocused on very low-mass, pre-main-sequence (PMS) stars andup to solar mass YSOs, with only a few objects below the hy-drogen burning limit (e.g., Rigliaco et al., 2011b; Stelzer et al.,2013). These objects were located in regions with age ∼2-3 Myr,or more. However, to fully test models of disk evolution it is im-portant to derive accretion properties of YSOs for a large rangeof stellar masses and age. The work we present here aims toenlarge the sample of very low-mass stars (VLMS) and browndwarfs (BDs) studied with X-Shooter, focusing on objects lo-cated in the younger (age∼1 Myr) ρ-Oph embedded cluster.
The ρ-Oph cluster is located at a distance d ∼ 125 pc(Lombardi et al., 2008; Loinard et al., 2008), and it is still highlyembedded in the parental cloud, with values of AV up to 50 magin the densest core (Wilking & Lada, 1983), and with a ratherhigh value of total-to-selective extinction ratio RV ∼ 5.6 (e.g.,Kenyon et al., 1998; Chapman et al., 2009; McClure et al., 2010;Comeron et al., 2010). The total population of the surroundingOphiucus region is estimated to be of around 300 YSOs (Evanset al., 2009), with ∼200 YSOs located in ρ-Oph itself. Given thelarge quantity of YSOs present in this cluster and its proxim-ity, it has been extensively studied in the past at various wave-lengths from optical, near- and far-infrared, millimeter, radio, toX-ray (e.g., Greene & Meyer, 1995; Luhman & Rieke, 1999;Wilking et al., 2005; Alves de Oliveira et al., 2010, 2012, 2013;Bontemps et al., 2001; McClure et al., 2010; Gagne et al., 2004).
Various works aimed to understand the accretion propertiesof YSOs at early ages have targeted ρ-Oph. In particular, Nattaet al. (2006, hereafter N06) have studied the vast majority of theClass II YSOs in this cluster, selected from the ISO sample ofBontemps et al. (2001). They used near-infrared emission lines(Paβ and Brγ) to determine the accretion rates, and a statisticalapproach, based on the assumption that the whole population islocated on the Hertzprung-Russel diagram (HRD) on a singleisochrone at 0.5 Myr, to derive stellar parameters for most ofthe targets1. This work showed that accretion rates for BDs inρ-Oph are typically higher than for objects with the same massin Taurus, and that various strongly accreting BDs are found inthis region. However, this result strongly depends on the alreadymentioned assumptions, which can result in incorrect estimatesof the stellar parameters, extinction, or accretion for single ob-jects, and only more precise analyses can shed light on this issue.With the set of X-Shooter spectra we present here, we are able toderive stellar and accretion parameters with significantly higherprecision. With this in hand, we aim at addressing the still openquestions comparing accretion properties for BDs and VLMS inthis region and in other samples observed with X-Shooter.
1 Their results were obtained using an old distance estimate of 160pc, and have been corrected for the newly determined distance and re-calculated with the same method, but assuming a single isochrone at 1Myr for the whole population by Rigliaco et al. (2011a). Here we re-port in Tables D.1 all the values derived using the most recent distanceestimated for the cluster of 125 pc.
The paper is organized as follows. In Section 2 we describethe sample, observations, and data reduction; in Section 3 wethen discuss the method used to analyze the spectra and the de-rived properties of the objects, together with their main spectralfeatures. In Section 4 we determine the accretion properties ofthe targets, and discuss the differences with previous estimatesfor the same targets; the comparison of accretion propertieswith results from other regions is then carried out in Section 5.Finally, we discuss our findings and conclusions in Section 6.
2. Sample, observations, and data reduction
We report here about new data collected with the ESO/VLT X-Shooter spectrograph (Vernet et al., 2011) during Pr.Id.085.C-0876 (PI Testi). This instrument acquires spectra of the tar-gets from λ ∼300 nm to λ ∼2500 nm simultaneously, split-ting the spectrum in three parts, usually referred to as theUVB (λλ ∼300-550 nm), VIS (λλ ∼550-1050 nm), and NIR(λλ ∼1050-2500 nm) arms.
The sample was selected from the one of N06 to cover asmany of the objects with detected accretion and estimated stel-lar mass M?<0.1 M� as possible. It comprises 16 Class II YSOsand one Class I YSO that are analyzed here for the first time,one transitional disk (ISO−Oph196) that has been analyzed inManara et al. (2014), and three Class III YSOs. We focus on theanalysis of the 16 Class II YSOs and the Class I YSO. All thesetargets were included in the ISO sample compiled by Bontempset al. (2001) and most of them have previously been studiedspectroscopically (e.g., Natta et al., 2002, 2004, 2006; Wilkinget al., 1999, 2005, see also Table A.1 for literature data on thesetargets). Their ISO number, other names, and coordinates are re-ported in the first three columns of Table 1.
All the objects have been observed in service mode usingthe 1.0x11′′ slit in the UVB arm and the 0.9x11′′ slits in the VISand NIR arms, which lead to a nominal resolution R = λ/∆λ∼4350, 7450, and 5300 in the three arms, respectively. Differentexposure times have been adopted for each target depending ontheir estimated fluxes. The dates of the observations and expo-sure times are reported in the fourth and fifth columns of Table 1.The late spectral type (SpT) of most of the targets and the highextinction of the region explain the low SNR of most spectra, atleast in the UVB arm. The only spectra with any detected sig-nal in the continuum in the UVB arm are those of ISO-Oph032and ISO-Oph123, although with low SNR. Some objects havealso very low SNR in the VIS spectra at λ . 600-700 nm, oreven at longer wavelengths. The NIR spectra of all targets havea good SNR. We report the SNR for the various spectra at diffe-rent wavelengths in the last three columns of Table 1.The objectISO−Oph072 was reported by McClure et al. (2010) to be mem-ber of a binary system with a separation of 3.62′′. The X-Shooterspectrum analyzed here is the one of the primary component ofthe system, while the secondary was not included in the slit.
Data reduction has been carried out using the X-Shooterpipeline (Modigliani et al., 2010) version 1.3.7 and the sameprocedure as in Alcala et al. (2014). For the targets observed on2010-06-01, 2010-08-20, and 2010-08-28, the photometric stan-dard observed during the night of observation is not supportedanymore in the pipeline. The flux calibration of the spectra hasthus been obtained using the photometric standard star observedthe following night, which was always photometric. The flux ca-libration of the spectra reduced with the pipeline has been com-pared with available 2MASS photometry and rescaled to thisusing synthetic photometry on the spectra to match the photo-metric flux. The correction factors are larger than 1 and usually
2
Manara et al.: X-Shooter study of accretion in ρ-Ophiucus
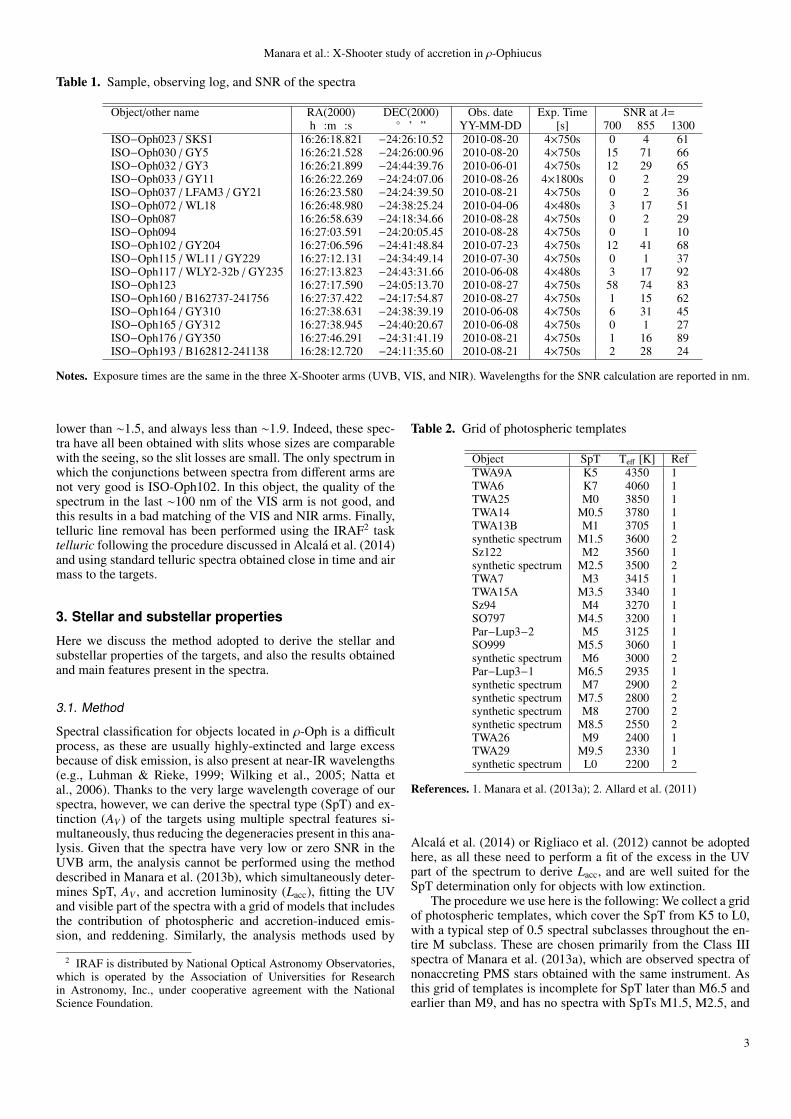
Table 1. Sample, observing log, and SNR of the spectra
Object/other name RA(2000) DEC(2000) Obs. date Exp. Time SNR at λ=h :m :s ◦ ’ ” YY-MM-DD [s] 700 855 1300
ISO−Oph023 / SKS1 16:26:18.821 −24:26:10.52 2010-08-20 4×750s 0 4 61ISO−Oph030 / GY5 16:26:21.528 −24:26:00.96 2010-08-20 4×750s 15 71 66ISO−Oph032 / GY3 16:26:21.899 −24:44:39.76 2010-06-01 4×750s 12 29 65ISO−Oph033 / GY11 16:26:22.269 −24:24:07.06 2010-08-26 4×1800s 0 2 29ISO−Oph037 / LFAM3 / GY21 16:26:23.580 −24:24:39.50 2010-08-21 4×750s 0 2 36ISO−Oph072 / WL18 16:26:48.980 −24:38:25.24 2010-04-06 4×480s 3 17 51ISO−Oph087 16:26:58.639 −24:18:34.66 2010-08-28 4×750s 0 2 29ISO−Oph094 16:27:03.591 −24:20:05.45 2010-08-28 4×750s 0 1 10ISO−Oph102 / GY204 16:27:06.596 −24:41:48.84 2010-07-23 4×750s 12 41 68ISO−Oph115 / WL11 / GY229 16:27:12.131 −24:34:49.14 2010-07-30 4×750s 0 1 37ISO−Oph117 / WLY2-32b / GY235 16:27:13.823 −24:43:31.66 2010-06-08 4×480s 3 17 92ISO−Oph123 16:27:17.590 −24:05:13.70 2010-08-27 4×750s 58 74 83ISO−Oph160 / B162737-241756 16:27:37.422 −24:17:54.87 2010-08-27 4×750s 1 15 62ISO−Oph164 / GY310 16:27:38.631 −24:38:39.19 2010-06-08 4×750s 6 31 45ISO−Oph165 / GY312 16:27:38.945 −24:40:20.67 2010-06-08 4×750s 0 1 27ISO−Oph176 / GY350 16:27:46.291 −24:31:41.19 2010-08-21 4×750s 1 16 89ISO−Oph193 / B162812-241138 16:28:12.720 −24:11:35.60 2010-08-21 4×750s 2 28 24
Notes. Exposure times are the same in the three X-Shooter arms (UVB, VIS, and NIR). Wavelengths for the SNR calculation are reported in nm.
lower than ∼1.5, and always less than ∼1.9. Indeed, these spec-tra have all been obtained with slits whose sizes are comparablewith the seeing, so the slit losses are small. The only spectrum inwhich the conjunctions between spectra from different arms arenot very good is ISO-Oph102. In this object, the quality of thespectrum in the last ∼100 nm of the VIS arm is not good, andthis results in a bad matching of the VIS and NIR arms. Finally,telluric line removal has been performed using the IRAF2 tasktelluric following the procedure discussed in Alcala et al. (2014)and using standard telluric spectra obtained close in time and airmass to the targets.
3. Stellar and substellar properties
Here we discuss the method adopted to derive the stellar andsubstellar properties of the targets, and also the results obtainedand main features present in the spectra.
3.1. Method
Spectral classification for objects located in ρ-Oph is a difficultprocess, as these are usually highly-extincted and large excessbecause of disk emission, is also present at near-IR wavelengths(e.g., Luhman & Rieke, 1999; Wilking et al., 2005; Natta etal., 2006). Thanks to the very large wavelength coverage of ourspectra, however, we can derive the spectral type (SpT) and ex-tinction (AV ) of the targets using multiple spectral features si-multaneously, thus reducing the degeneracies present in this ana-lysis. Given that the spectra have very low or zero SNR in theUVB arm, the analysis cannot be performed using the methoddescribed in Manara et al. (2013b), which simultaneously deter-mines SpT, AV , and accretion luminosity (Lacc), fitting the UVand visible part of the spectra with a grid of models that includesthe contribution of photospheric and accretion-induced emis-sion, and reddening. Similarly, the analysis methods used by
2 IRAF is distributed by National Optical Astronomy Observatories,which is operated by the Association of Universities for Researchin Astronomy, Inc., under cooperative agreement with the NationalScience Foundation.
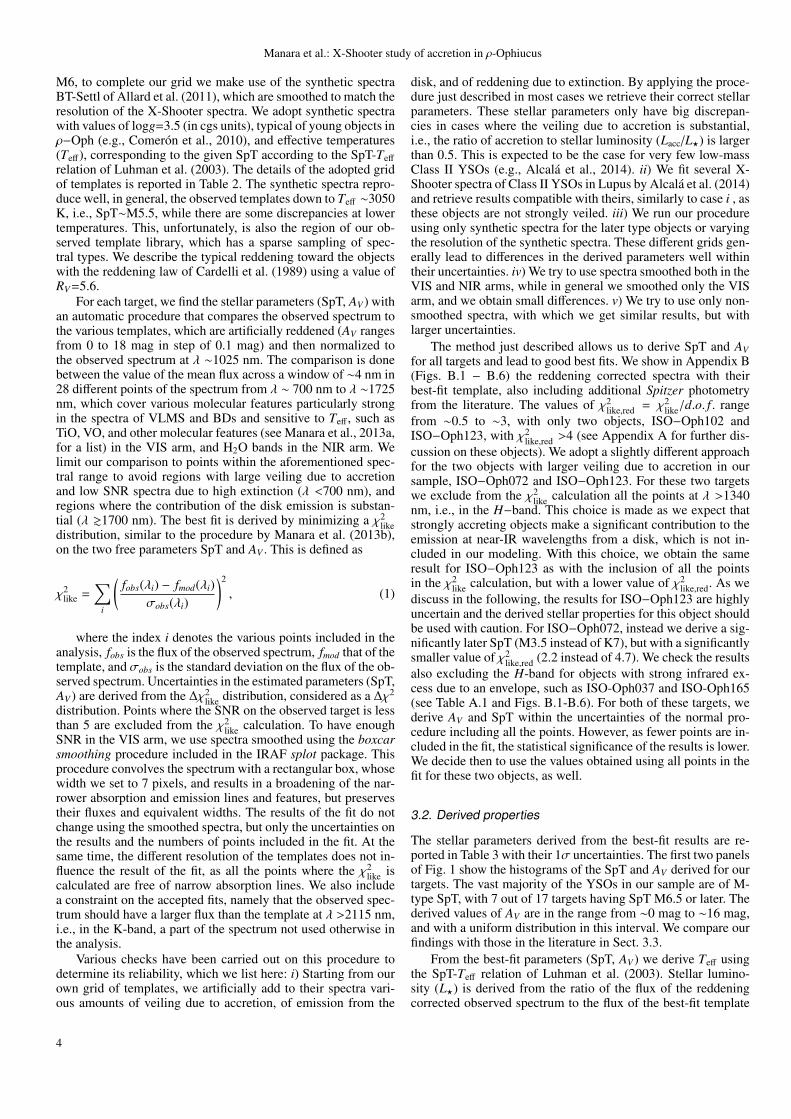
Table 2. Grid of photospheric templates
Object SpT Teff [K] RefTWA9A K5 4350 1TWA6 K7 4060 1TWA25 M0 3850 1TWA14 M0.5 3780 1TWA13B M1 3705 1synthetic spectrum M1.5 3600 2Sz122 M2 3560 1synthetic spectrum M2.5 3500 2TWA7 M3 3415 1TWA15A M3.5 3340 1Sz94 M4 3270 1SO797 M4.5 3200 1Par−Lup3−2 M5 3125 1SO999 M5.5 3060 1synthetic spectrum M6 3000 2Par−Lup3−1 M6.5 2935 1synthetic spectrum M7 2900 2synthetic spectrum M7.5 2800 2synthetic spectrum M8 2700 2synthetic spectrum M8.5 2550 2TWA26 M9 2400 1TWA29 M9.5 2330 1synthetic spectrum L0 2200 2
References. 1. Manara et al. (2013a); 2. Allard et al. (2011)
Alcala et al. (2014) or Rigliaco et al. (2012) cannot be adoptedhere, as all these need to perform a fit of the excess in the UVpart of the spectrum to derive Lacc, and are well suited for theSpT determination only for objects with low extinction.
The procedure we use here is the following: We collect a gridof photospheric templates, which cover the SpT from K5 to L0,with a typical step of 0.5 spectral subclasses throughout the en-tire M subclass. These are chosen primarily from the Class IIIspectra of Manara et al. (2013a), which are observed spectra ofnonaccreting PMS stars obtained with the same instrument. Asthis grid of templates is incomplete for SpT later than M6.5 andearlier than M9, and has no spectra with SpTs M1.5, M2.5, and
3
Manara et al.: X-Shooter study of accretion in ρ-Ophiucus
M6, to complete our grid we make use of the synthetic spectraBT-Settl of Allard et al. (2011), which are smoothed to match theresolution of the X-Shooter spectra. We adopt synthetic spectrawith values of logg=3.5 (in cgs units), typical of young objects inρ−Oph (e.g., Comeron et al., 2010), and effective temperatures(Teff), corresponding to the given SpT according to the SpT-Teff
relation of Luhman et al. (2003). The details of the adopted gridof templates is reported in Table 2. The synthetic spectra repro-duce well, in general, the observed templates down to Teff ∼3050K, i.e., SpT∼M5.5, while there are some discrepancies at lowertemperatures. This, unfortunately, is also the region of our ob-served template library, which has a sparse sampling of spec-tral types. We describe the typical reddening toward the objectswith the reddening law of Cardelli et al. (1989) using a value ofRV=5.6.
For each target, we find the stellar parameters (SpT, AV ) withan automatic procedure that compares the observed spectrum tothe various templates, which are artificially reddened (AV rangesfrom 0 to 18 mag in step of 0.1 mag) and then normalized tothe observed spectrum at λ ∼1025 nm. The comparison is donebetween the value of the mean flux across a window of ∼4 nm in28 different points of the spectrum from λ ∼ 700 nm to λ ∼1725nm, which cover various molecular features particularly strongin the spectra of VLMS and BDs and sensitive to Teff , such asTiO, VO, and other molecular features (see Manara et al., 2013a,for a list) in the VIS arm, and H2O bands in the NIR arm. Welimit our comparison to points within the aforementioned spec-tral range to avoid regions with large veiling due to accretionand low SNR spectra due to high extinction (λ <700 nm), andregions where the contribution of the disk emission is substan-tial (λ &1700 nm). The best fit is derived by minimizing a χ2
likedistribution, similar to the procedure by Manara et al. (2013b),on the two free parameters SpT and AV . This is defined as
χ2like =
∑i
(fobs(λi) − fmod(λi)
σobs(λi)
)2
, (1)
where the index i denotes the various points included in theanalysis, fobs is the flux of the observed spectrum, fmod that of thetemplate, and σobs is the standard deviation on the flux of the ob-served spectrum. Uncertainties in the estimated parameters (SpT,AV ) are derived from the ∆χ2
like distribution, considered as a ∆χ2
distribution. Points where the SNR on the observed target is lessthan 5 are excluded from the χ2
like calculation. To have enoughSNR in the VIS arm, we use spectra smoothed using the boxcarsmoothing procedure included in the IRAF splot package. Thisprocedure convolves the spectrum with a rectangular box, whosewidth we set to 7 pixels, and results in a broadening of the nar-rower absorption and emission lines and features, but preservestheir fluxes and equivalent widths. The results of the fit do notchange using the smoothed spectra, but only the uncertainties onthe results and the numbers of points included in the fit. At thesame time, the different resolution of the templates does not in-fluence the result of the fit, as all the points where the χ2
like iscalculated are free of narrow absorption lines. We also includea constraint on the accepted fits, namely that the observed spec-trum should have a larger flux than the template at λ >2115 nm,i.e., in the K-band, a part of the spectrum not used otherwise inthe analysis.
Various checks have been carried out on this procedure todetermine its reliability, which we list here: i) Starting from ourown grid of templates, we artificially add to their spectra vari-ous amounts of veiling due to accretion, of emission from the
disk, and of reddening due to extinction. By applying the proce-dure just described in most cases we retrieve their correct stellarparameters. These stellar parameters only have big discrepan-cies in cases where the veiling due to accretion is substantial,i.e., the ratio of accretion to stellar luminosity (Lacc/L?) is largerthan 0.5. This is expected to be the case for very few low-massClass II YSOs (e.g., Alcala et al., 2014). ii) We fit several X-Shooter spectra of Class II YSOs in Lupus by Alcala et al. (2014)and retrieve results compatible with theirs, similarly to case i , asthese objects are not strongly veiled. iii) We run our procedureusing only synthetic spectra for the later type objects or varyingthe resolution of the synthetic spectra. These different grids gen-erally lead to differences in the derived parameters well withintheir uncertainties. iv) We try to use spectra smoothed both in theVIS and NIR arms, while in general we smoothed only the VISarm, and we obtain small differences. v) We try to use only non-smoothed spectra, with which we get similar results, but withlarger uncertainties.
The method just described allows us to derive SpT and AVfor all targets and lead to good best fits. We show in Appendix B(Figs. B.1 − B.6) the reddening corrected spectra with theirbest-fit template, also including additional Spitzer photometryfrom the literature. The values of χ2
like,red = χ2like/d.o. f . range
from ∼0.5 to ∼3, with only two objects, ISO−Oph102 andISO−Oph123, with χ2
like,red >4 (see Appendix A for further dis-cussion on these objects). We adopt a slightly different approachfor the two objects with larger veiling due to accretion in oursample, ISO−Oph072 and ISO−Oph123. For these two targetswe exclude from the χ2
like calculation all the points at λ >1340nm, i.e., in the H−band. This choice is made as we expect thatstrongly accreting objects make a significant contribution to theemission at near-IR wavelengths from a disk, which is not in-cluded in our modeling. With this choice, we obtain the sameresult for ISO−Oph123 as with the inclusion of all the pointsin the χ2
like calculation, but with a lower value of χ2like,red. As we
discuss in the following, the results for ISO−Oph123 are highlyuncertain and the derived stellar properties for this object shouldbe used with caution. For ISO−Oph072, instead we derive a sig-nificantly later SpT (M3.5 instead of K7), but with a significantlysmaller value of χ2
like,red (2.2 instead of 4.7). We check the resultsalso excluding the H-band for objects with strong infrared ex-cess due to an envelope, such as ISO-Oph037 and ISO-Oph165(see Table A.1 and Figs. B.1-B.6). For both of these targets, wederive AV and SpT within the uncertainties of the normal pro-cedure including all the points. However, as fewer points are in-cluded in the fit, the statistical significance of the results is lower.We decide then to use the values obtained using all points in thefit for these two objects, as well.
3.2. Derived properties
The stellar parameters derived from the best-fit results are re-ported in Table 3 with their 1σ uncertainties. The first two panelsof Fig. 1 show the histograms of the SpT and AV derived for ourtargets. The vast majority of the YSOs in our sample are of M-type SpT, with 7 out of 17 targets having SpT M6.5 or later. Thederived values of AV are in the range from ∼0 mag to ∼16 mag,and with a uniform distribution in this interval. We compare ourfindings with those in the literature in Sect. 3.3.
From the best-fit parameters (SpT, AV ) we derive Teff usingthe SpT-Teff relation of Luhman et al. (2003). Stellar lumino-sity (L?) is derived from the ratio of the flux of the reddeningcorrected observed spectrum to the flux of the best-fit template
4
Manara et al.: X-Shooter study of accretion in ρ-Ophiucus
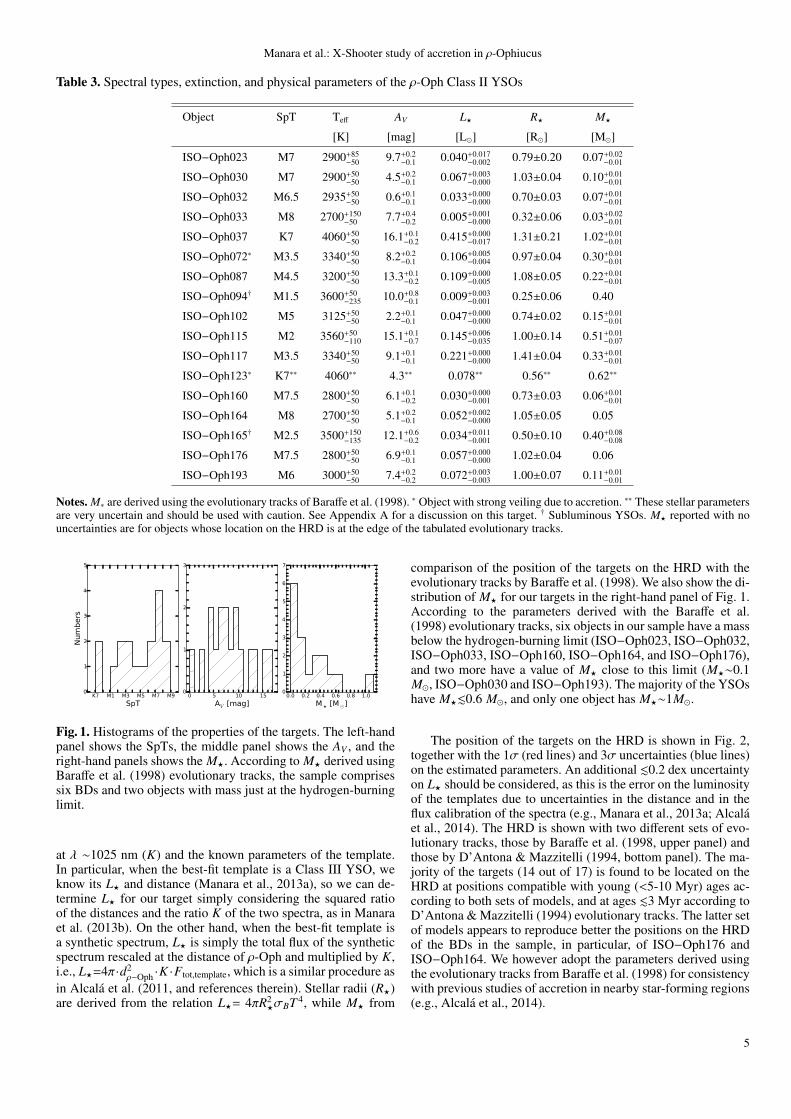
Table 3. Spectral types, extinction, and physical parameters of the ρ-Oph Class II YSOs
Object SpT Teff AV L? R? M?
[K] [mag] [L�] [R�] [M�]
ISO−Oph023 M7 2900+85−50 9.7+0.2
−0.1 0.040+0.017−0.002 0.79±0.20 0.07+0.02
−0.01
ISO−Oph030 M7 2900+50−50 4.5+0.2
−0.1 0.067+0.003−0.000 1.03±0.04 0.10+0.01
−0.01
ISO−Oph032 M6.5 2935+50−50 0.6+0.1
−0.1 0.033+0.000−0.000 0.70±0.03 0.07+0.01
−0.01
ISO−Oph033 M8 2700+150−50 7.7+0.4
−0.2 0.005+0.001−0.000 0.32±0.06 0.03+0.02
−0.01
ISO−Oph037 K7 4060+50−50 16.1+0.1
−0.2 0.415+0.000−0.017 1.31±0.21 1.02+0.01
−0.01
ISO−Oph072∗ M3.5 3340+50−50 8.2+0.2
−0.1 0.106+0.005−0.004 0.97±0.04 0.30+0.01
−0.01
ISO−Oph087 M4.5 3200+50−50 13.3+0.1
−0.2 0.109+0.000−0.005 1.08±0.05 0.22+0.01
−0.01
ISO−Oph094† M1.5 3600+50−235 10.0+0.8
−0.1 0.009+0.003−0.001 0.25±0.06 0.40
ISO−Oph102 M5 3125+50−50 2.2+0.1
−0.1 0.047+0.000−0.000 0.74±0.02 0.15+0.01
−0.01
ISO−Oph115 M2 3560+50−110 15.1+0.1
−0.7 0.145+0.006−0.035 1.00±0.14 0.51+0.01
−0.07
ISO−Oph117 M3.5 3340+50−50 9.1+0.1
−0.1 0.221+0.000−0.000 1.41±0.04 0.33+0.01
−0.01
ISO−Oph123∗ K7∗∗ 4060∗∗ 4.3∗∗ 0.078∗∗ 0.56∗∗ 0.62∗∗
ISO−Oph160 M7.5 2800+50−50 6.1+0.1
−0.2 0.030+0.000−0.001 0.73±0.03 0.06+0.01
−0.01
ISO−Oph164 M8 2700+50−50 5.1+0.2
−0.1 0.052+0.002−0.000 1.05±0.05 0.05
ISO−Oph165† M2.5 3500+150−135 12.1+0.6
−0.2 0.034+0.011−0.001 0.50±0.10 0.40+0.08
−0.08
ISO−Oph176 M7.5 2800+50−50 6.9+0.1
−0.1 0.057+0.000−0.000 1.02±0.04 0.06
ISO−Oph193 M6 3000+50−50 7.4+0.2
−0.2 0.072+0.003−0.003 1.00±0.07 0.11+0.01
−0.01
Notes. M∗ are derived using the evolutionary tracks of Baraffe et al. (1998). ∗ Object with strong veiling due to accretion. ∗∗ These stellar parametersare very uncertain and should be used with caution. See Appendix A for a discussion on this target. † Subluminous YSOs. M? reported with nouncertainties are for objects whose location on the HRD is at the edge of the tabulated evolutionary tracks.
K7 M1 M3 M5 M7 M9
SpT
0
1
2
3
4
5
Num
bers
0 5 10 15
AV [mag]
0
1
2
3
0.0 0.2 0.4 0.6 0.8 1.0
M [M¯]
0
1
2
3
4
5
6
7
Fig. 1. Histograms of the properties of the targets. The left-handpanel shows the SpTs, the middle panel shows the AV , and theright-hand panels shows the M?. According to M? derived usingBaraffe et al. (1998) evolutionary tracks, the sample comprisessix BDs and two objects with mass just at the hydrogen-burninglimit.
at λ ∼1025 nm (K) and the known parameters of the template.In particular, when the best-fit template is a Class III YSO, weknow its L? and distance (Manara et al., 2013a), so we can de-termine L? for our target simply considering the squared ratioof the distances and the ratio K of the two spectra, as in Manaraet al. (2013b). On the other hand, when the best-fit template isa synthetic spectrum, L? is simply the total flux of the syntheticspectrum rescaled at the distance of ρ-Oph and multiplied by K,i.e., L?=4π·d2
ρ−Oph ·K ·Ftot,template, which is a similar procedure asin Alcala et al. (2011, and references therein). Stellar radii (R?)are derived from the relation L?= 4πR2
?σBT 4, while M? from
comparison of the position of the targets on the HRD with theevolutionary tracks by Baraffe et al. (1998). We also show the di-stribution of M? for our targets in the right-hand panel of Fig. 1.According to the parameters derived with the Baraffe et al.(1998) evolutionary tracks, six objects in our sample have a massbelow the hydrogen-burning limit (ISO−Oph023, ISO−Oph032,ISO−Oph033, ISO−Oph160, ISO−Oph164, and ISO−Oph176),and two more have a value of M? close to this limit (M?∼0.1M�, ISO−Oph030 and ISO−Oph193). The majority of the YSOshave M?.0.6 M�, and only one object has M?∼1M�.
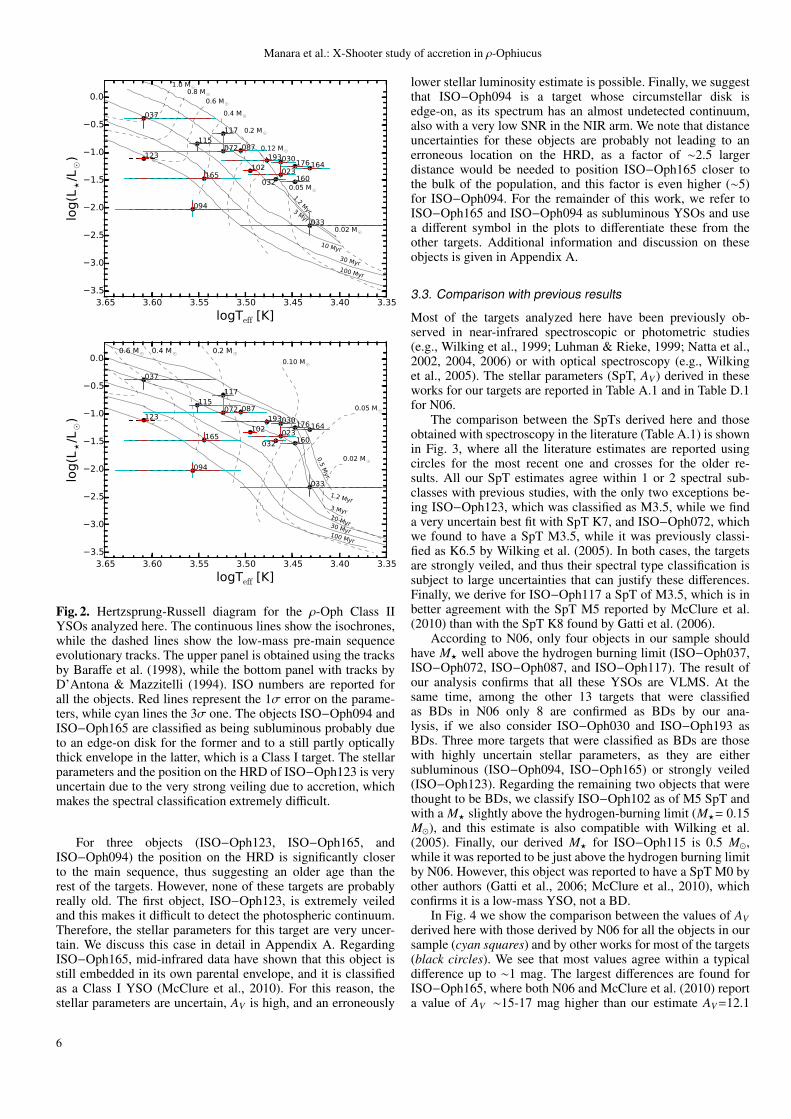
The position of the targets on the HRD is shown in Fig. 2,together with the 1σ (red lines) and 3σ uncertainties (blue lines)on the estimated parameters. An additional .0.2 dex uncertaintyon L? should be considered, as this is the error on the luminosityof the templates due to uncertainties in the distance and in theflux calibration of the spectra (e.g., Manara et al., 2013a; Alcalaet al., 2014). The HRD is shown with two different sets of evo-lutionary tracks, those by Baraffe et al. (1998, upper panel) andthose by D’Antona & Mazzitelli (1994, bottom panel). The ma-jority of the targets (14 out of 17) is found to be located on theHRD at positions compatible with young (<5-10 Myr) ages ac-cording to both sets of models, and at ages .3 Myr according toD’Antona & Mazzitelli (1994) evolutionary tracks. The latter setof models appears to reproduce better the positions on the HRDof the BDs in the sample, in particular, of ISO−Oph176 andISO−Oph164. We however adopt the parameters derived usingthe evolutionary tracks from Baraffe et al. (1998) for consistencywith previous studies of accretion in nearby star-forming regions(e.g., Alcala et al., 2014).
5
Manara et al.: X-Shooter study of accretion in ρ-Ophiucus
3.353.403.453.503.553.603.65
logTeff [K]
3.5
3.0
2.5
2.0
1.5
1.0
0.5
0.0
log(L
/L¯)
0.02 M¯
0.05 M¯
0.12 M¯
0.2 M¯
0.4 M¯
0.6 M¯
0.8 M¯
1.0 M¯
1.2 Myr3 Myr
10 Myr
30 Myr100 Myr
023
030
032
033
037
072 087
094
102
115117
123
160
164165
176193
3.353.403.453.503.553.603.65
logTeff [K]
3.5
3.0
2.5
2.0
1.5
1.0
0.5
0.0
log(L
/L¯)
0.02 M¯
0.05 M¯
0.10 M¯
0.2 M¯
0.4 M¯
0.6 M¯
0.8 M¯
1.0 M¯
0.5 Myr
1.2 Myr3 Myr10 Myr30 Myr100 Myr
0.2 M¯0.4 M¯0.6 M¯
023
030
032
033
037
072 087
094
102
115117
123
160
164165
176193
Fig. 2. Hertzsprung-Russell diagram for the ρ-Oph Class IIYSOs analyzed here. The continuous lines show the isochrones,while the dashed lines show the low-mass pre-main sequenceevolutionary tracks. The upper panel is obtained using the tracksby Baraffe et al. (1998), while the bottom panel with tracks byD’Antona & Mazzitelli (1994). ISO numbers are reported forall the objects. Red lines represent the 1σ error on the parame-ters, while cyan lines the 3σ one. The objects ISO−Oph094 andISO−Oph165 are classified as being subluminous probably dueto an edge-on disk for the former and to a still partly opticallythick envelope in the latter, which is a Class I target. The stellarparameters and the position on the HRD of ISO−Oph123 is veryuncertain due to the very strong veiling due to accretion, whichmakes the spectral classification extremely difficult.
For three objects (ISO−Oph123, ISO−Oph165, andISO−Oph094) the position on the HRD is significantly closerto the main sequence, thus suggesting an older age than therest of the targets. However, none of these targets are probablyreally old. The first object, ISO−Oph123, is extremely veiledand this makes it difficult to detect the photospheric continuum.Therefore, the stellar parameters for this target are very uncer-tain. We discuss this case in detail in Appendix A. RegardingISO−Oph165, mid-infrared data have shown that this object isstill embedded in its own parental envelope, and it is classifiedas a Class I YSO (McClure et al., 2010). For this reason, thestellar parameters are uncertain, AV is high, and an erroneously
lower stellar luminosity estimate is possible. Finally, we suggestthat ISO−Oph094 is a target whose circumstellar disk isedge-on, as its spectrum has an almost undetected continuum,also with a very low SNR in the NIR arm. We note that distanceuncertainties for these objects are probably not leading to anerroneous location on the HRD, as a factor of ∼2.5 largerdistance would be needed to position ISO−Oph165 closer tothe bulk of the population, and this factor is even higher (∼5)for ISO−Oph094. For the remainder of this work, we refer toISO−Oph165 and ISO−Oph094 as subluminous YSOs and usea different symbol in the plots to differentiate these from theother targets. Additional information and discussion on theseobjects is given in Appendix A.
3.3. Comparison with previous results
Most of the targets analyzed here have been previously ob-served in near-infrared spectroscopic or photometric studies(e.g., Wilking et al., 1999; Luhman & Rieke, 1999; Natta et al.,2002, 2004, 2006) or with optical spectroscopy (e.g., Wilkinget al., 2005). The stellar parameters (SpT, AV ) derived in theseworks for our targets are reported in Table A.1 and in Table D.1for N06.
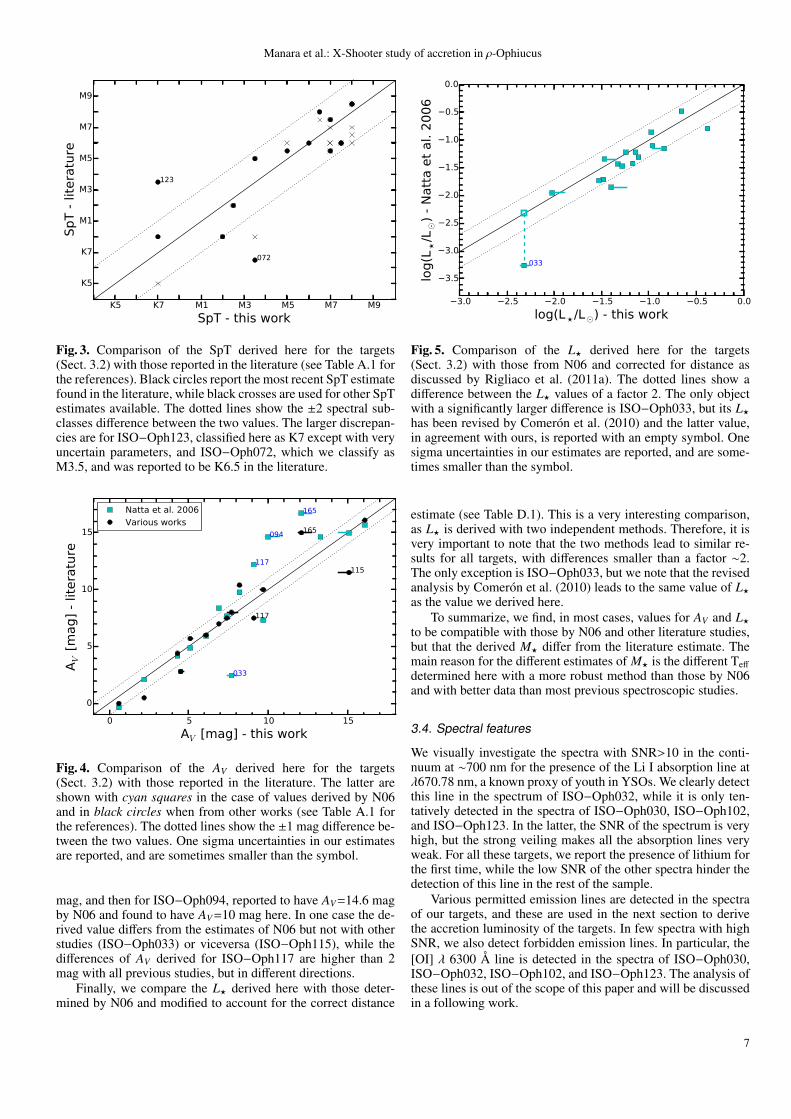
The comparison between the SpTs derived here and thoseobtained with spectroscopy in the literature (Table A.1) is shownin Fig. 3, where all the literature estimates are reported usingcircles for the most recent one and crosses for the older re-sults. All our SpT estimates agree within 1 or 2 spectral sub-classes with previous studies, with the only two exceptions be-ing ISO−Oph123, which was classified as M3.5, while we finda very uncertain best fit with SpT K7, and ISO−Oph072, whichwe found to have a SpT M3.5, while it was previously classi-fied as K6.5 by Wilking et al. (2005). In both cases, the targetsare strongly veiled, and thus their spectral type classification issubject to large uncertainties that can justify these differences.Finally, we derive for ISO−Oph117 a SpT of M3.5, which is inbetter agreement with the SpT M5 reported by McClure et al.(2010) than with the SpT K8 found by Gatti et al. (2006).
According to N06, only four objects in our sample shouldhave M? well above the hydrogen burning limit (ISO−Oph037,ISO−Oph072, ISO−Oph087, and ISO−Oph117). The result ofour analysis confirms that all these YSOs are VLMS. At thesame time, among the other 13 targets that were classifiedas BDs in N06 only 8 are confirmed as BDs by our ana-lysis, if we also consider ISO−Oph030 and ISO−Oph193 asBDs. Three more targets that were classified as BDs are thosewith highly uncertain stellar parameters, as they are eithersubluminous (ISO−Oph094, ISO−Oph165) or strongly veiled(ISO−Oph123). Regarding the remaining two objects that werethought to be BDs, we classify ISO−Oph102 as of M5 SpT andwith a M? slightly above the hydrogen-burning limit (M?= 0.15M�), and this estimate is also compatible with Wilking et al.(2005). Finally, our derived M? for ISO−Oph115 is 0.5 M�,while it was reported to be just above the hydrogen burning limitby N06. However, this object was reported to have a SpT M0 byother authors (Gatti et al., 2006; McClure et al., 2010), whichconfirms it is a low-mass YSO, not a BD.
In Fig. 4 we show the comparison between the values of AVderived here with those derived by N06 for all the objects in oursample (cyan squares) and by other works for most of the targets(black circles). We see that most values agree within a typicaldifference up to ∼1 mag. The largest differences are found forISO−Oph165, where both N06 and McClure et al. (2010) reporta value of AV ∼15-17 mag higher than our estimate AV=12.1
6
Manara et al.: X-Shooter study of accretion in ρ-Ophiucus
K5 K7 M1 M3 M5 M7 M9
SpT - this work
K5
K7
M1
M3
M5
M7
M9
SpT -
lit
era
ture
123
072
Fig. 3. Comparison of the SpT derived here for the targets(Sect. 3.2) with those reported in the literature (see Table A.1 forthe references). Black circles report the most recent SpT estimatefound in the literature, while black crosses are used for other SpTestimates available. The dotted lines show the ±2 spectral sub-classes difference between the two values. The larger discrepan-cies are for ISO−Oph123, classified here as K7 except with veryuncertain parameters, and ISO−Oph072, which we classify asM3.5, and was reported to be K6.5 in the literature.
0 5 10 15
AV [mag] - this work
0
5
10
15
AV [
mag]
- lit
era
ture
165
094
033
117115
165
094
117
Natta et al. 2006Various works
Fig. 4. Comparison of the AV derived here for the targets(Sect. 3.2) with those reported in the literature. The latter areshown with cyan squares in the case of values derived by N06and in black circles when from other works (see Table A.1 forthe references). The dotted lines show the ±1 mag difference be-tween the two values. One sigma uncertainties in our estimatesare reported, and are sometimes smaller than the symbol.
mag, and then for ISO−Oph094, reported to have AV=14.6 magby N06 and found to have AV=10 mag here. In one case the de-rived value differs from the estimates of N06 but not with otherstudies (ISO−Oph033) or viceversa (ISO−Oph115), while thedifferences of AV derived for ISO−Oph117 are higher than 2mag with all previous studies, but in different directions.
Finally, we compare the L? derived here with those deter-mined by N06 and modified to account for the correct distance
3.0 2.5 2.0 1.5 1.0 0.5 0.0
log(L /L¯) - this work
3.5
3.0
2.5
2.0
1.5
1.0
0.5
0.0
log(L
/L¯)
- N
att
a e
t al. 2
00
6
033
Fig. 5. Comparison of the L? derived here for the targets(Sect. 3.2) with those from N06 and corrected for distance asdiscussed by Rigliaco et al. (2011a). The dotted lines show adifference between the L? values of a factor 2. The only objectwith a significantly larger difference is ISO−Oph033, but its L?has been revised by Comeron et al. (2010) and the latter value,in agreement with ours, is reported with an empty symbol. Onesigma uncertainties in our estimates are reported, and are some-times smaller than the symbol.
estimate (see Table D.1). This is a very interesting comparison,as L? is derived with two independent methods. Therefore, it isvery important to note that the two methods lead to similar re-sults for all targets, with differences smaller than a factor ∼2.The only exception is ISO−Oph033, but we note that the revisedanalysis by Comeron et al. (2010) leads to the same value of L?as the value we derived here.
To summarize, we find, in most cases, values for AV and L?to be compatible with those by N06 and other literature studies,but that the derived M? differ from the literature estimate. Themain reason for the different estimates of M? is the different Teff
determined here with a more robust method than those by N06and with better data than most previous spectroscopic studies.
3.4. Spectral features
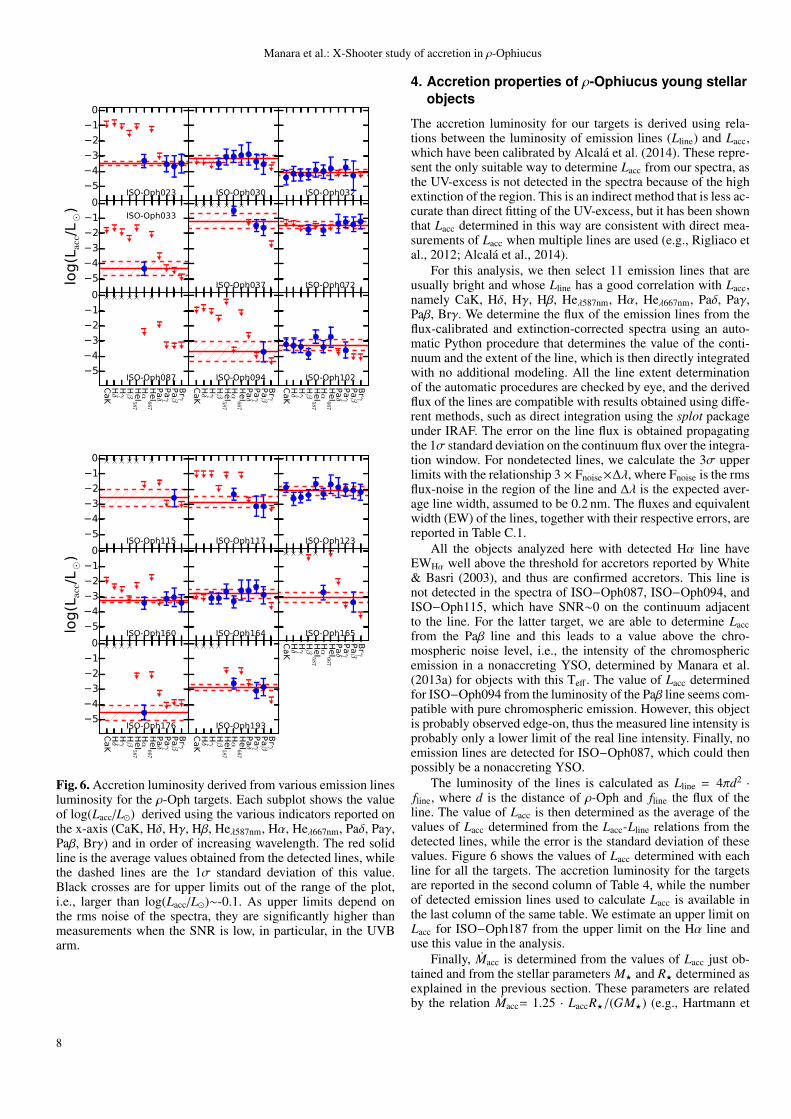
We visually investigate the spectra with SNR>10 in the conti-nuum at ∼700 nm for the presence of the Li I absorption line atλ670.78 nm, a known proxy of youth in YSOs. We clearly detectthis line in the spectrum of ISO−Oph032, while it is only ten-tatively detected in the spectra of ISO−Oph030, ISO−Oph102,and ISO−Oph123. In the latter, the SNR of the spectrum is veryhigh, but the strong veiling makes all the absorption lines veryweak. For all these targets, we report the presence of lithium forthe first time, while the low SNR of the other spectra hinder thedetection of this line in the rest of the sample.
Various permitted emission lines are detected in the spectraof our targets, and these are used in the next section to derivethe accretion luminosity of the targets. In few spectra with highSNR, we also detect forbidden emission lines. In particular, the[OI] λ 6300 Å line is detected in the spectra of ISO−Oph030,ISO−Oph032, ISO−Oph102, and ISO−Oph123. The analysis ofthese lines is out of the scope of this paper and will be discussedin a following work.
7
Manara et al.: X-Shooter study of accretion in ρ-Ophiucus
5
4
3
2
1
0
ISO-Oph023 ISO-Oph030 ISO-Oph032
5
4
3
2
1
0
log(L
acc/
L¯)
ISO-Oph033
ISO-Oph037 ISO-Oph072
CaK
Hδ
Hγ
Hβ
HeI5
87
Hα
HeI6
67
Paδ
Paγ
Paβ
Brγ
5
4
3
2
1
0
ISO-Oph087
CaK
Hδ
Hγ
Hβ
HeI5
87
Hα
HeI6
67
Paδ
Paγ
Paβ
Brγ
ISO-Oph094
CaK
Hδ
Hγ
Hβ
HeI5
87
Hα
HeI6
67
Paδ
Paγ
Paβ
Brγ
ISO-Oph102
5
4
3
2
1
0
ISO-Oph115 ISO-Oph117 ISO-Oph123
5
4
3
2
1
0
log(L
acc/
L¯)
ISO-Oph160 ISO-Oph164
CaK
Hδ
Hγ
Hβ
HeI587
Hα
HeI667
Paδ
Paγ
Paβ
Brγ
ISO-Oph165
CaK
Hδ
Hγ
Hβ
HeI5
87
Hα
HeI6
67
Paδ
Paγ
Paβ
Brγ
5
4
3
2
1
0
ISO-Oph176
CaK
Hδ
Hγ
Hβ
HeI5
87
Hα
HeI6
67
Paδ
Paγ
Paβ
Brγ
ISO-Oph193
Fig. 6. Accretion luminosity derived from various emission linesluminosity for the ρ-Oph targets. Each subplot shows the valueof log(Lacc/L�) derived using the various indicators reported onthe x-axis (CaK, Hδ, Hγ, Hβ, Heλ587nm, Hα, Heλ667nm, Paδ, Paγ,Paβ, Brγ) and in order of increasing wavelength. The red solidline is the average values obtained from the detected lines, whilethe dashed lines are the 1σ standard deviation of this value.Black crosses are for upper limits out of the range of the plot,i.e., larger than log(Lacc/L�)∼-0.1. As upper limits depend onthe rms noise of the spectra, they are significantly higher thanmeasurements when the SNR is low, in particular, in the UVBarm.
4. Accretion properties of ρ-Ophiucus young stellarobjects
The accretion luminosity for our targets is derived using rela-tions between the luminosity of emission lines (Lline) and Lacc,which have been calibrated by Alcala et al. (2014). These repre-sent the only suitable way to determine Lacc from our spectra, asthe UV-excess is not detected in the spectra because of the highextinction of the region. This is an indirect method that is less ac-curate than direct fitting of the UV-excess, but it has been shownthat Lacc determined in this way are consistent with direct mea-surements of Lacc when multiple lines are used (e.g., Rigliaco etal., 2012; Alcala et al., 2014).
For this analysis, we then select 11 emission lines that areusually bright and whose Lline has a good correlation with Lacc,namely CaK, Hδ, Hγ, Hβ, Heλ587nm, Hα, Heλ667nm, Paδ, Paγ,Paβ, Brγ. We determine the flux of the emission lines from theflux-calibrated and extinction-corrected spectra using an auto-matic Python procedure that determines the value of the conti-nuum and the extent of the line, which is then directly integratedwith no additional modeling. All the line extent determinationof the automatic procedures are checked by eye, and the derivedflux of the lines are compatible with results obtained using diffe-rent methods, such as direct integration using the splot packageunder IRAF. The error on the line flux is obtained propagatingthe 1σ standard deviation on the continuum flux over the integra-tion window. For nondetected lines, we calculate the 3σ upperlimits with the relationship 3 × Fnoise×∆λ, where Fnoise is the rmsflux-noise in the region of the line and ∆λ is the expected aver-age line width, assumed to be 0.2 nm. The fluxes and equivalentwidth (EW) of the lines, together with their respective errors, arereported in Table C.1.
All the objects analyzed here with detected Hα line haveEWHα well above the threshold for accretors reported by White& Basri (2003), and thus are confirmed accretors. This line isnot detected in the spectra of ISO−Oph087, ISO−Oph094, andISO−Oph115, which have SNR∼0 on the continuum adjacentto the line. For the latter target, we are able to determine Laccfrom the Paβ line and this leads to a value above the chro-mospheric noise level, i.e., the intensity of the chromosphericemission in a nonaccreting YSO, determined by Manara et al.(2013a) for objects with this Teff . The value of Lacc determinedfor ISO−Oph094 from the luminosity of the Paβ line seems com-patible with pure chromospheric emission. However, this objectis probably observed edge-on, thus the measured line intensity isprobably only a lower limit of the real line intensity. Finally, noemission lines are detected for ISO−Oph087, which could thenpossibly be a nonaccreting YSO.
The luminosity of the lines is calculated as Lline = 4πd2 ·
fline, where d is the distance of ρ-Oph and fline the flux of theline. The value of Lacc is then determined as the average of thevalues of Lacc determined from the Lacc-Lline relations from thedetected lines, while the error is the standard deviation of thesevalues. Figure 6 shows the values of Lacc determined with eachline for all the targets. The accretion luminosity for the targetsare reported in the second column of Table 4, while the numberof detected emission lines used to calculate Lacc is available inthe last column of the same table. We estimate an upper limit onLacc for ISO−Oph187 from the upper limit on the Hα line anduse this value in the analysis.
Finally, Macc is determined from the values of Lacc just ob-tained and from the stellar parameters M? and R? determined asexplained in the previous section. These parameters are relatedby the relation Macc= 1.25 · LaccR?/(GM?) (e.g., Hartmann et
8
Manara et al.: X-Shooter study of accretion in ρ-Ophiucus
Table 4. Accretion luminosity and mass accretion rates of theρ-Oph YSOs
Object log Lacc log Macc Detected lines[L�] [M�/yr] [#]
ISO−Oph023 -3.51 -9.85 4ISO−Oph030 -3.19 -9.58 7ISO−Oph032 -4.09 -10.49 9ISO−Oph033 -4.33 -10.70 1ISO−Oph037 -1.20 -8.49 3ISO−Oph072 -1.47 -8.36 8ISO−Oph087 <-2.21 <-8.92 0ISO−Oph094 -3.71 -11.32 1ISO−Oph102 -3.27 -9.98 8ISO−Oph115 -2.58 -9.69 1ISO−Oph117 -2.87 -9.64 3ISO−Oph123 -2.12 -9.56 11ISO−Oph160 -3.25 -9.56 4ISO−Oph164 -2.82 -8.90 8ISO−Oph165 -3.04 -10.34 2ISO−Oph176 -4.60 -10.73 1ISO−Oph193 -2.86 -9.30 3
Notes. Lacc is obtained as the mean of the values from the different emis-sion lines. Macc are derived using M? determined from the evolutionarytracks of Baraffe et al. (1998). The last column reports the number ofemission lines detected and used to derive Lacc.
al., 1998), which assumes accretion from a radius Rm = 5R?.The final value is reported for every object in the third columnof Table 4.
4.1. Comparison with previous results
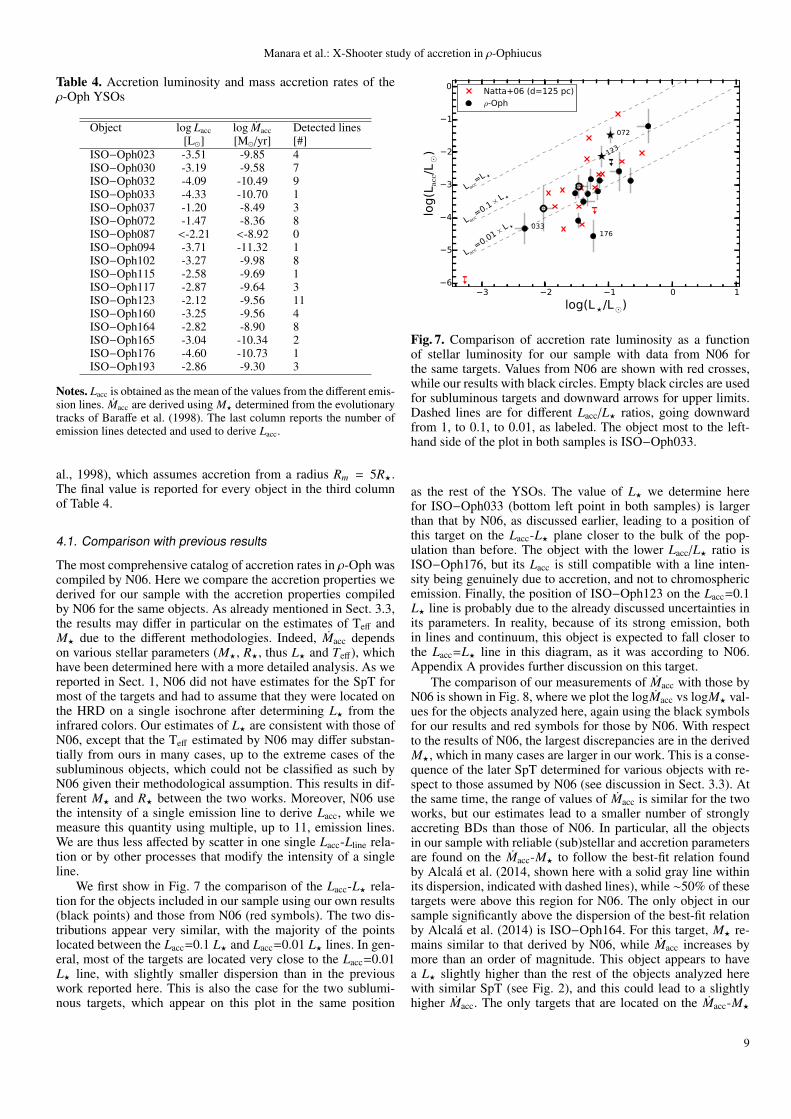
The most comprehensive catalog of accretion rates in ρ-Oph wascompiled by N06. Here we compare the accretion properties wederived for our sample with the accretion properties compiledby N06 for the same objects. As already mentioned in Sect. 3.3,the results may differ in particular on the estimates of Teff andM? due to the different methodologies. Indeed, Macc dependson various stellar parameters (M?, R?, thus L? and Teff), whichhave been determined here with a more detailed analysis. As wereported in Sect. 1, N06 did not have estimates for the SpT formost of the targets and had to assume that they were located onthe HRD on a single isochrone after determining L? from theinfrared colors. Our estimates of L? are consistent with those ofN06, except that the Teff estimated by N06 may differ substan-tially from ours in many cases, up to the extreme cases of thesubluminous objects, which could not be classified as such byN06 given their methodological assumption. This results in dif-ferent M? and R? between the two works. Moreover, N06 usethe intensity of a single emission line to derive Lacc, while wemeasure this quantity using multiple, up to 11, emission lines.We are thus less affected by scatter in one single Lacc-Lline rela-tion or by other processes that modify the intensity of a singleline.
We first show in Fig. 7 the comparison of the Lacc-L? rela-tion for the objects included in our sample using our own results(black points) and those from N06 (red symbols). The two dis-tributions appear very similar, with the majority of the pointslocated between the Lacc=0.1 L? and Lacc=0.01 L? lines. In gen-eral, most of the targets are located very close to the Lacc=0.01L? line, with slightly smaller dispersion than in the previouswork reported here. This is also the case for the two sublumi-nous targets, which appear on this plot in the same position
3 2 1 0 1
log(L /L¯)
6
5
4
3
2
1
0
log(L
acc/
L¯)
L acc=L
L acc=0.1
× L
L acc=0.01×
L 033176
072
123
Natta+06 (d=125 pc)ρ-Oph
Fig. 7. Comparison of accretion rate luminosity as a functionof stellar luminosity for our sample with data from N06 forthe same targets. Values from N06 are shown with red crosses,while our results with black circles. Empty black circles are usedfor subluminous targets and downward arrows for upper limits.Dashed lines are for different Lacc/L? ratios, going downwardfrom 1, to 0.1, to 0.01, as labeled. The object most to the left-hand side of the plot in both samples is ISO−Oph033.
as the rest of the YSOs. The value of L? we determine herefor ISO−Oph033 (bottom left point in both samples) is largerthan that by N06, as discussed earlier, leading to a position ofthis target on the Lacc-L? plane closer to the bulk of the pop-ulation than before. The object with the lower Lacc/L? ratio isISO−Oph176, but its Lacc is still compatible with a line inten-sity being genuinely due to accretion, and not to chromosphericemission. Finally, the position of ISO−Oph123 on the Lacc=0.1L? line is probably due to the already discussed uncertainties inits parameters. In reality, because of its strong emission, bothin lines and continuum, this object is expected to fall closer tothe Lacc=L? line in this diagram, as it was according to N06.Appendix A provides further discussion on this target.
The comparison of our measurements of Macc with those byN06 is shown in Fig. 8, where we plot the logMacc vs logM? val-ues for the objects analyzed here, again using the black symbolsfor our results and red symbols for those by N06. With respectto the results of N06, the largest discrepancies are in the derivedM?, which in many cases are larger in our work. This is a conse-quence of the later SpT determined for various objects with re-spect to those assumed by N06 (see discussion in Sect. 3.3). Atthe same time, the range of values of Macc is similar for the twoworks, but our estimates lead to a smaller number of stronglyaccreting BDs than those of N06. In particular, all the objectsin our sample with reliable (sub)stellar and accretion parametersare found on the Macc-M? to follow the best-fit relation foundby Alcala et al. (2014, shown here with a solid gray line withinits dispersion, indicated with dashed lines), while ∼50% of thesetargets were above this region for N06. The only object in oursample significantly above the dispersion of the best-fit relationby Alcala et al. (2014) is ISO−Oph164. For this target, M? re-mains similar to that derived by N06, while Macc increases bymore than an order of magnitude. This object appears to havea L? slightly higher than the rest of the objects analyzed herewith similar SpT (see Fig. 2), and this could lead to a slightlyhigher Macc. The only targets that are located on the Macc-M?
9
Manara et al.: X-Shooter study of accretion in ρ-Ophiucus
2.0 1.5 1.0 0.5 0.0
log(M /M¯)
12
11
10
9
8
7lo
g(M
acc/
[M¯/y
r])
164
123
Natta+06 (d=125 pc)ρ-Oph
Fig. 8. Mass accretion rate as a function of mass for the ρ-Ophsample. Values derived for the objects analyzed here are reportedwith black markers, values from N06 are shown with red sym-bols. Empty black circles are used for subluminous targets anddownward arrows are used for upper limits. The continuous linerepresents the linear fit of this relation by Alcala et al. (2014) fora sample of accreting objects in Lupus. The dashed lines repre-sent the 1σ deviation from the fit.
plane significantly below the bulk of the population are the twosubluminous targets.
We can thus conclude from this analysis that, in our limitedsample of BDs and VLMS, we see a smaller number of heavilyaccreting targets than N06. This strongly suggests that BDs andVLMS in ρ−Oph accrete at a rate similar to those in other re-gions, as we discuss in the next section, contrary to the claim ofN06. As the typical Lacc/L? ratio in our targets is similar to thatdetermined by N06, our suggestion is that the differences in theMacc-M? relation is mostly because of the different (sub)stellarparameters determined here. Given that we do not have assump-tions about the positions of the targets on the HRD, and we havelarger wavelength coverage that lead to a better constraint of AV ,SpT, and L?, we are confident that our results are more reli-able and that the distribution we observe in the Macc-M?planefor our sample resembles the real distribution. A larger study onthe whole sample of N06 with a data set similar to ours wouldfurther reinforce our finding. At present we do not attempt tofit our results as we have few objects sparsely sampled in theparameter space (L?, Lacc, M?, Macc).
5. Accretion in ρ-Oph compared with nearbystar-forming regions
As discussed in Sect. 1, the main interests in the data set pre-sented here are to determine whether BDs in ρ−Oph have signif-icantly higher accretion rates than in other star-forming regions,and to study a very young region to compare the accretion prop-erties of its targets with those of targets located in older star-forming regions. We have just discussed how our results differfrom those of N06 in the Macc-M? plane, leading to lower accre-tion rates for BDs than those reported by them. Here we compareour findings with those of Alcala et al. (2014) in the Lupus I andIII clouds, and those by Rigliaco et al. (2012) in the σ-Orionis(σ-Ori) cluster. These are selected as comparison sample as theyinclude a significant number of VLMS and some (∼5) BDs, and
3 2 1 0 1
log(L /L¯)
5
4
3
2
1
0
log(L
acc/
L¯)
L acc=L
L acc=0.1
× L
L acc=0.01×
L176
072
123
ρ-Oph
Lupusσ-Ori
Fig. 9. Accretion luminosity vs stellar luminosity for the wholeρ-Oph sample discussed here (black symbols), for the Lupussample of Alcala et al. (2014), reported with green symbols, andfor a sample in σ-Ori studied by Rigliaco et al. (2012) and re-ported with yellow triangles. Upper limits are shown as down-ward arrows. Empty symbols are used for subluminous objects,and stars for strongly veiled objects. Dashed lines are for diffe-rent Lacc/L? ratios, going downward from 1, to 0.1, to 0.01, aslabeled. The solid lines is the best fit for the GTO sample byNatta et al. (2014).
have been studied using spectra obtained with the same instru-ment. In addition, our accretion rates are determined using theLacc-Lline relation determined from these samples, hence the bi-ases in the Macc estimates are minimized than when comparingMacc estimates with other data sets. As these data have been col-lected as part of the Italian guaranteed time observation (GTO;Alcala et al., 2011), in the following we refer to the whole com-parison sample as GTO sample. Our targets are also interestingas they enlarge the number of targets at low M?, in particular,there are six more BDs and two more objects with M? just at thehydrogen burning limit.
5.1. Accretion luminosity and stellar luminosity relation
We show in Fig. 9 the position of our targets and those from theGTO sample (cf. legend in the plot and caption for symbols ex-planations) in the Lacc-L? plane. This is a particularly interestingrelation as it is obtained independently from models of PMS evo-lution, thus it can be considered a “purely observational” plot.The plot also indicates the best-fit relation for the GTO sampleby Natta et al. (2014), in which the slope is 1.53±0.18.
All the targets analyzed here are located in the same part ofthe Lacc-L? plane as those from the GTO sample. In particular,we do not have any extremely strong accretors (Lacc/L?>0.5),with the only possible exception being ISO−Oph123, which isprobably more intensely accreting than what is reported here.The number of objects between the Lacc= 0.01 L? and Lacc= 0.1L? lines decreases drastically at L?.0.1 L� in the GTO sample,and the same appears to be true in our sample, as well. Also forthis reason the best-fit relation has a slope significantly steeperthan unity, implying that for higher luminosity targets the emis-sion due to accretion is relatively more important than in lowerL? objects. This is also confirmed by the data collected here.
The location of the two subluminous targets in our sample issimilar to that of subluminous targets in the GTO sample (empty
10
Manara et al.: X-Shooter study of accretion in ρ-Ophiucus
2.0 1.5 1.0 0.5 0.0
log(M /M¯)
12
11
10
9
8
7lo
g(M
acc/
[M¯/y
r])
164
123
ρ-Oph
Lupusσ-Ori
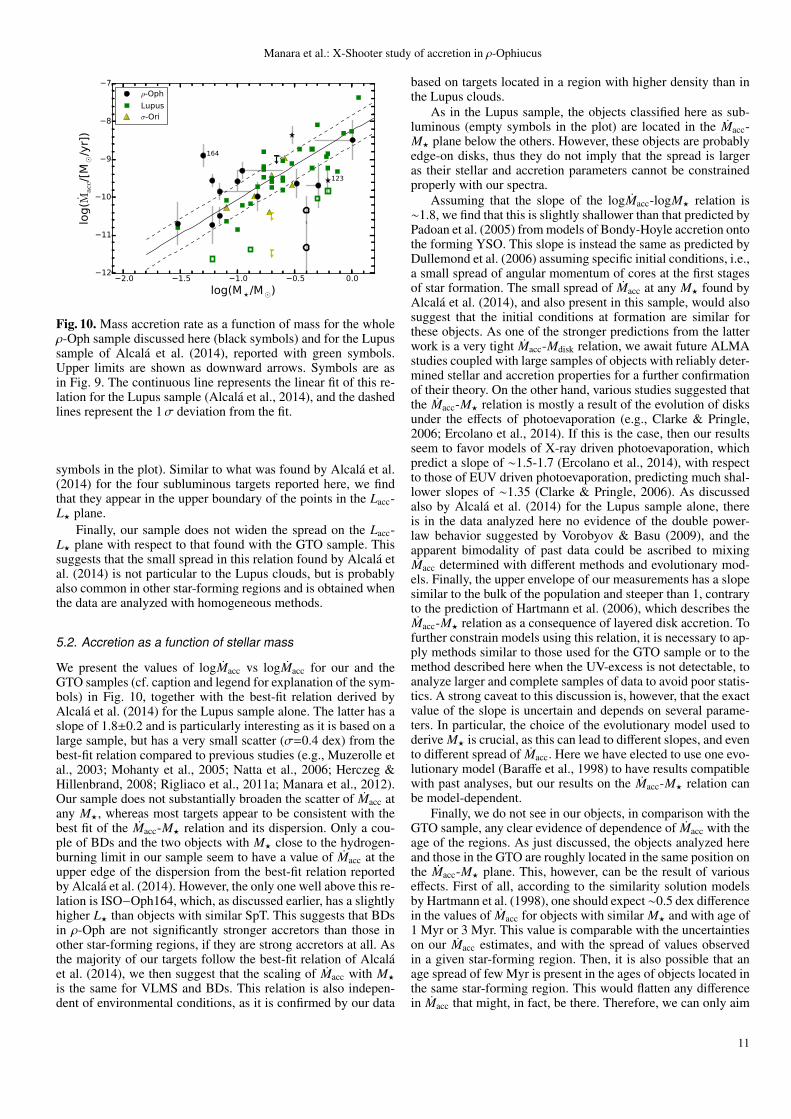
Fig. 10. Mass accretion rate as a function of mass for the wholeρ-Oph sample discussed here (black symbols) and for the Lupussample of Alcala et al. (2014), reported with green symbols.Upper limits are shown as downward arrows. Symbols are asin Fig. 9. The continuous line represents the linear fit of this re-lation for the Lupus sample (Alcala et al., 2014), and the dashedlines represent the 1σ deviation from the fit.
symbols in the plot). Similar to what was found by Alcala et al.(2014) for the four subluminous targets reported here, we findthat they appear in the upper boundary of the points in the Lacc-L? plane.
Finally, our sample does not widen the spread on the Lacc-L? plane with respect to that found with the GTO sample. Thissuggests that the small spread in this relation found by Alcala etal. (2014) is not particular to the Lupus clouds, but is probablyalso common in other star-forming regions and is obtained whenthe data are analyzed with homogeneous methods.
5.2. Accretion as a function of stellar mass
We present the values of logMacc vs logMacc for our and theGTO samples (cf. caption and legend for explanation of the sym-bols) in Fig. 10, together with the best-fit relation derived byAlcala et al. (2014) for the Lupus sample alone. The latter has aslope of 1.8±0.2 and is particularly interesting as it is based on alarge sample, but has a very small scatter (σ=0.4 dex) from thebest-fit relation compared to previous studies (e.g., Muzerolle etal., 2003; Mohanty et al., 2005; Natta et al., 2006; Herczeg &Hillenbrand, 2008; Rigliaco et al., 2011a; Manara et al., 2012).Our sample does not substantially broaden the scatter of Macc atany M?, whereas most targets appear to be consistent with thebest fit of the Macc-M? relation and its dispersion. Only a cou-ple of BDs and the two objects with M? close to the hydrogen-burning limit in our sample seem to have a value of Macc at theupper edge of the dispersion from the best-fit relation reportedby Alcala et al. (2014). However, the only one well above this re-lation is ISO−Oph164, which, as discussed earlier, has a slightlyhigher L? than objects with similar SpT. This suggests that BDsin ρ-Oph are not significantly stronger accretors than those inother star-forming regions, if they are strong accretors at all. Asthe majority of our targets follow the best-fit relation of Alcalaet al. (2014), we then suggest that the scaling of Macc with M?
is the same for VLMS and BDs. This relation is also indepen-dent of environmental conditions, as it is confirmed by our data
based on targets located in a region with higher density than inthe Lupus clouds.
As in the Lupus sample, the objects classified here as sub-luminous (empty symbols in the plot) are located in the Macc-M? plane below the others. However, these objects are probablyedge-on disks, thus they do not imply that the spread is largeras their stellar and accretion parameters cannot be constrainedproperly with our spectra.
Assuming that the slope of the logMacc-logM? relation is∼1.8, we find that this is slightly shallower than that predicted byPadoan et al. (2005) from models of Bondy-Hoyle accretion ontothe forming YSO. This slope is instead the same as predicted byDullemond et al. (2006) assuming specific initial conditions, i.e.,a small spread of angular momentum of cores at the first stagesof star formation. The small spread of Macc at any M? found byAlcala et al. (2014), and also present in this sample, would alsosuggest that the initial conditions at formation are similar forthese objects. As one of the stronger predictions from the latterwork is a very tight Macc-Mdisk relation, we await future ALMAstudies coupled with large samples of objects with reliably deter-mined stellar and accretion properties for a further confirmationof their theory. On the other hand, various studies suggested thatthe Macc-M? relation is mostly a result of the evolution of disksunder the effects of photoevaporation (e.g., Clarke & Pringle,2006; Ercolano et al., 2014). If this is the case, then our resultsseem to favor models of X-ray driven photoevaporation, whichpredict a slope of ∼1.5-1.7 (Ercolano et al., 2014), with respectto those of EUV driven photoevaporation, predicting much shal-lower slopes of ∼1.35 (Clarke & Pringle, 2006). As discussedalso by Alcala et al. (2014) for the Lupus sample alone, thereis in the data analyzed here no evidence of the double power-law behavior suggested by Vorobyov & Basu (2009), and theapparent bimodality of past data could be ascribed to mixingMacc determined with different methods and evolutionary mod-els. Finally, the upper envelope of our measurements has a slopesimilar to the bulk of the population and steeper than 1, contraryto the prediction of Hartmann et al. (2006), which describes theMacc-M? relation as a consequence of layered disk accretion. Tofurther constrain models using this relation, it is necessary to ap-ply methods similar to those used for the GTO sample or to themethod described here when the UV-excess is not detectable, toanalyze larger and complete samples of data to avoid poor statis-tics. A strong caveat to this discussion is, however, that the exactvalue of the slope is uncertain and depends on several parame-ters. In particular, the choice of the evolutionary model used toderive M? is crucial, as this can lead to different slopes, and evento different spread of Macc. Here we have elected to use one evo-lutionary model (Baraffe et al., 1998) to have results compatiblewith past analyses, but our results on the Macc-M? relation canbe model-dependent.
Finally, we do not see in our objects, in comparison with theGTO sample, any clear evidence of dependence of Macc with theage of the regions. As just discussed, the objects analyzed hereand those in the GTO are roughly located in the same position onthe Macc-M? plane. This, however, can be the result of variouseffects. First of all, according to the similarity solution modelsby Hartmann et al. (1998), one should expect ∼0.5 dex differencein the values of Macc for objects with similar M? and with age of1 Myr or 3 Myr. This value is comparable with the uncertaintieson our Macc estimates, and with the spread of values observedin a given star-forming region. Then, it is also possible that anage spread of few Myr is present in the ages of objects located inthe same star-forming region. This would flatten any differencein Macc that might, in fact, be there. Therefore, we can only aim
11
Manara et al.: X-Shooter study of accretion in ρ-Ophiucus
to constrain the dependence of Macc with the age of the targetswith significantly larger samples and more reliable estimates forthe PMS stellar age.
6. Conclusions
We presented new observations of 17 VLMS and BDs with diskslocated in the ρ-Oph cluster. The spectra analyzed here were ob-tained with the VLT/X-Shooter instruments and were usually ofgood quality from ∼750 nm to ∼2500 nm, allowing us to deter-mine SpT and AV for our targets by comparing the spectra invarious molecular features with a set of photospheric templates.With this analysis, we determined the (sub)stellar parameters forall the targets. The total sample comprises six BDs, two objectswith M? close to the hydrogen burning limit, eight VLMS andlow-mass YSOs, and one solar-mass PMS star.
We determined the accretion properties for the whole sampleusing the intensity of the emission lines present in our spectraand compared our findings with the most complete work avail-able in this field (N06). Our results differ from those by N06 aswe find a smaller number of strong accretors, in particular, in theBD regime. This suggests that BDs in this region are not accret-ing at a higher rate than in other star-forming regions, contraryto previous suggestions.
A further constraint on this result comes from the compar-ison of our results with those in the Lupus clouds by Alcala etal. (2014) and in the σ-Ori cluster by Rigliaco et al. (2012), theGTO sample. Our objects follow the same Lacc-L? and Macc-M?
relations as those in the GTO sample. However, these findingsare based on very few objects.
Finally, we do not find any evidence of differences of theaccretion properties of targets located in the young (∼1 Myr)ρ-Oph cluster or in the older (∼3 Myr) regions targeted in theGTO survey. However, the differences expected are small andhave various effects, such as observational uncertainties and agespread, and can make this analysis even more complicated. Onthe other hand, this work and other recent works that have usedthe capabilities of the VLT/X-Shooter spectrograph togetherwith detailed analysis techniques (e.g., Rigliaco et al., 2012;Alcala et al., 2014; Manara et al., 2014) have shown that the ob-servational uncertainties in the estimates of accretion rates andthe spread of values can be significantly reduced with respectto the past. This suggests that it will be possible with completesamples in various star-forming regions to have a clear under-standing of the evolution of accretion with time and with theproperties of the central PMS star.
Acknowledgements. We thank the anonymous referee for her/his careful read-ing of the manuscript. We thank the ESO staff in Paranal for performing theobservations in service mode.
ReferencesAlcala, J. M., Stelzer, B., Covino, E., et al. 2011, Astronomische Nachrichten,
332, 242Alcala, J. M., Natta, A., Manara, C. F., et al. 2014, A&A, 561, A2Alexander, R., Pascucci, I., Andrews, S., Armitage, P., & Cieza, L. 2014,
Protostars and Planets VI, 475Allard, F., Homeier, D., & Freytag, B. 2011, Astronomical Society of the Pacific
Conference Series, 448, 91Alves de Oliveira, C., Moraux, E., Bouvier, J., et al. 2010, A&A, 515, A75Alves de Oliveira, C., Moraux, E., Bouvier, J., & Bouy, H. 2012, A&A, 539,
A151Alves de Oliveira, C., Abraham, P., Marton, G., et al. 2013, A&A, 559, AA126Baraffe, I., Chabrier, G., Allard, F., & Hauschildt, P. H. 1998, A&A, 337, 403Bontemps, S., Andre, P., Kaas, A. A., et al. 2001, A&A, 372, 173Calvet, N., & Gullbring, E. 1998, ApJ, 509, 802
Calvet, N., Hartmann, L., & Strom, S. E. 2000, in Protostars and Planets IV, 377Cardelli, J. A., Clayton, G. C., & Mathis, J. S. 1989, ApJ, 345, 245Chapman, N. L., Mundy, L. G., Lai, S.-P., & Evans, N. J., II 2009, ApJ, 690, 496Clarke, C. J., & Pringle, J. E. 2006, MNRAS, 370, L10Comeron, F., Testi, L., & Natta, A. 2010, A&A, 522, A47D’Antona, F., & Mazzitelli, I. 1994, ApJS, 90, 467Dullemond, C. P., Natta, A., & Testi, L. 2006, ApJ, 645, L69Ercolano, B., Mayr, D., Owen, J. E., Rosotti, G., & Manara, C. F. 2014, MNRAS,
178Evans, N. J., II, Dunham, M. M., Jørgensen, J. K., et al. 2009, ApJS, 181, 321Gagne, M., Skinner, S. L., & Daniel, K. J. 2004, ApJ, 613, 393Gatti, T., Testi, L., Natta, A., Randich, S., & Muzerolle, J. 2006, A&A, 460, 547Gullbring, E., Hartmann, L., Briceno, C., & Calvet, N. 1998, ApJ, 492, 323Gullbring, E., Calvet, N., Muzerolle, J., & Hartmann, L. 2000, ApJ, 544, 927Greene, T. P., & Meyer, M. R. 1995, ApJ, 450, 233Hartigan, P., Edwards, S., & Ghandour, L. 1995, ApJ, 452, 736Hartmann, L., Calvet, N., Gullbring, E., & D’Alessio, P. 1998, ApJ, 495, 385Hartmann, L., D’Alessio, P., Calvet, N., & Muzerolle, J. 2006, ApJ, 648, 484Herczeg, G. J., & Hillenbrand, L. A. 2008, ApJ, 681, 594Kenyon, S. J., Lada, E. A., & Barsony, M. 1998, AJ, 115, 252Loinard, L., Torres, R. M., Mioduszewski, A. J., & Rodrıguez, L. F. 2008, ApJ,
675, L29Lombardi, M., Lada, C. J., & Alves, J. 2008, A&A, 480, 785Luhman, K. L., & Rieke, G. H. 1999, ApJ, 525, 440Luhman, K. L., Stauffer, J. R., Muench, A. A., et al. 2003, ApJ, 593, 1093Manara, C. F., Robberto, M., Da Rio, N., et al. 2012, ApJ, 755, 154Manara, C. F., Testi, L., Rigliaco, E., et al. 2013a, A&A, 551, A107Manara, C. F., Beccari, G., Da Rio, N., et al. 2013, A&A, 558, A114Manara, C. F., Testi, L., Natta, A., et al. 2014, A&A, 568, AA18Manara, C. F., Fedele, D., & Herczeg, G., in prep.McClure, M. 2009, ApJ, 693, L81McClure, M. K., Furlan, E., Manoj, P., et al. 2010, ApJS, 188, 75Modigliani, A., Goldoni, P., Royer, F., et al. 2010, Proc. SPIE, 7737Mohanty, S., Jayawardhana, R., & Basri, G. 2005, ApJ, 626, 498Muzerolle, J., Calvet, N., & Hartmann, L. 1998a, ApJ, 492, 743Muzerolle, J., Hartmann, L., & Calvet, N. 1998b, AJ, 116, 455Muzerolle, Hartmann & Calvet. 1998c, AJ, 116, 2965Muzerolle, J., Hillenbrand, L., Calvet, N., Briceno, C., & Hartmann, L. 2003,
ApJ, 592, 266Natta, A., Testi, L., Comeron, F., et al. 2002, A&A, 393, 597Natta, A., Testi, L., Muzerolle, J., et al. 2004, A&A, 424, 603Natta, A., Testi, L., & Randich, S. 2006, A&A, 452, 245Natta, A., Testi, L., Alcala, J. M., et al. 2014, A&A, 569, AA5Padoan, P., Kritsuk, A., Norman, M. L., & Nordlund, Å. 2005, ApJ, 622, L61Rigliaco, E., Natta, A., Randich, S., Testi, L., & Biazzo, K. 2011a, A&A, 525,
A47Rigliaco, E., Natta, A., Randich, S., et al. 2011b, A&A, 526, LL6Rigliaco, E., Natta, A., Testi, L., et al. 2012, A&A, 548, A56Rigliaco, E., Pascucci, I., Gorti, U., Edwards, S., & Hollenbach, D. 2013, ApJ,
772, 60Scholz, A. 2012, MNRAS, 420, 1495Stelzer, B., Alcala, J. M., Scholz, A., et al. 2013, A&A, 551, AA106Valenti, J. A., Basri, G., & Johns, C. M. 1993, AJ, 106, 2024Vernet, J., Dekker, H., D’Odorico, S., et al. 2011, A&A, 536, A105Vorobyov, E. I., & Basu, S. 2009, ApJ, 703, 922White, R. J., & Basri, G. 2003, ApJ, 582, 1109Wilking, B. A., & Lada, C. J. 1983, ApJ, 274, 698Wilking, B. A., Greene, T. P., & Meyer, M. R. 1999, AJ, 117, 469Wilking, B. A., Meyer, M. R., Robinson, J. G., & Greene, T. P. 2005, AJ, 130,
1733
Appendix A: Comments on individual objects
Here we report the previous results available in the literature inTable A.1. These are discussed in Sect. 3.3 in comparison withour estimates. In the following, we discuss some peculiar objectsin the sample.
A.1. ISO−Oph094
The location of this object on the HRD that we derive is that ofa very old PMS object, much older than 100 Myr. However, thespectrum of this object has SNR∼0 in the whole VIS arm and
12
Manara et al.: X-Shooter study of accretion in ρ-Ophiucus
Table A.1. Data available in the literature for the targets included in this work
Object/other name RA(2000) DEC(2000) SpT AV References McClure et al. (2010)h :m :s ◦ ’ ” [mag] classification
ISO−Oph023 / SKS1 / CRBR 2317.3-1925 16:26:18.821 −24:26:10.52 M7.5,M5.5,M7 10.0 1,2,3 DiskISO−Oph030 / GY5 16:26:21.528 −24:26:00.96 M5.5,M6,M6 2.8 4,1,3 DiskISO−Oph032 / GY3 16:26:21.899 −24:44:39.76 M8,M7.5 0.0 4,3 ...ISO−Oph033 / GY11 16:26:22.269 −24:24:07.06 M8.5,M6.5,M8.5 8.0 5,1,3 ...ISO−Oph037 / LFAM3 / GY21 16:26:23.580 −24:24:39.50 M0,K5 16.1 7,6 Disk/FSISO−Oph072 / WL18 16:26:48.980 −24:38:25.24 K6.5 10.4 4 DiskISO−Oph087 16:26:58.639 −24:18:34.66 ... ... ... ...ISO−Oph094 16:27:03.591 −24:20:05.45 M3? 20.1 8 ...ISO−Oph102 / GY204 16:27:06.596 −24:41:48.84 M5.5,M6 0.5 4,3 DiskISO−Oph115 / WL11 / GY229 16:27:12.131 −24:34:49.14 M0,M0 11.5 7,6 DiskISO−Oph117 / WLY2-32b / GY235 16:27:13.823 −24:43:31.66 M5,K8 7.5 7,6 Disk/FSISO−Oph123 16:27:17.590 −24:05:13.70 M3.5 4.4 4 ...ISO−Oph160 / B162737-241756 16:27:37.422 −24:17:54.87 M6 6.0 3 ...ISO−Oph164 / GY310 16:27:38.631 −24:38:39.19 M8.5,M7,M6 5.7 1,2,3 DiskISO−Oph165 / GY312 16:27:38.945 −24:40:20.67 M2 15.0 7 Envelope/IISO−Oph176 / GY350 16:27:46.291 −24:31:41.19 M6,M6 7.0 3,7 DiskISO−Oph193 / B162812-241138 16:28:12.720 −24:11:35.60 M6 7.5 3 ...
Notes. Spectral types, extinction, and mass accretion rates determined from the following studies: 1. Wilking et al. (1999); 2. Luhman & Rieke(1999); 3. Natta et al. (2002); 4. Wilking et al. (2005); 5. Comeron et al. (2010); 6. Gatti et al. (2006), 7. McClure et al. (2010, and referencestherein), 8. Alves de Oliveira et al. (2012)
also has low SNR in the NIR arm. The SpT we have derivedis compatible with the highly uncertain estimates by Alves deOliveira et al. (2012), who suggest that this object has probablya SpT earlier than M3 and strongly extincted (AV=20.1 mag).Also, their near-infrared spectra had very low SNR and theirestimates are tentative. Even if we allow for higher values ofAV in our fit, we obtain the same best fit as that we report inthis manuscript. As there is no other information available inthe literature for these targets from mid-infrared data other thanBontemps et al. (2001), we are not able to further constrain itsevolutionary class, which was reported to be Class II using ISOphotometry. With the spectra available and the information inour hand, we cannot further constrain the properties of this ob-ject. Our classification for this object as subluminous is also re-lated to the tentative detection of forbidden emission lines in itsspectrum. However, given the very low SNR of the continuum ofthis object, the subtraction of sky lines is not trivial and residualsare present even after careful extraction of the spectrum.
A.2. ISO−Oph102
The value of χ2like,red for the best fit for this object is ∼12.4. As
discussed in Sect. 2, the spectrum of this target is of very poorquality in the last∼100 nm of the VIS arm. We have therefore ne-glected some points in this region to avoid biases due to the poorquality of the spectrum. Even if the value of χ2
like,red is high, thebest-fit template reproduces correctly the spectrum in the otherfeatures at shorter wavelength and in the NIR. Finally, our esti-mates are in good agreement with the literature.
A.3. ISO−Oph123
As we mentioned many times, this object is very peculiar andthe analysis of its spectrum does not lead to a satisfying esti-mate of its stellar properties. This object has been studied byWilking et al. (2005) who reported a SpT of M3.5 with no par-ticular comments, only that there were strong emission lines in
the spectrum. Scholz (2012) has also noted that this object is ex-tremely variable in the near infrared, with variations up to ∼0.9mag in K-band. The flux calibration of the spectrum analyzedhere is compatible with the 2MASS photometry in J- and H-bands, and it was only correct by a factor 1.12 to account for slitlosses to match these bands. The magnitudes at optical wave-lengths reported in the literature are, instead, slightly lower thanthe observed flux of this spectrum. The procedure adopted herefor the rest of the targets does not result in a low value of χ2
like,redfor this target. The best-fit estimate is also probably uncertainas this object seems a very strong accretor, and we discussedthat our procedure fails if the target has Lacc/L?&0.5, as couldbe the case for this object. As the excess due to accretion couldsignificantly change the shape of the continuum, it is not pos-sible to determine the real reddening of the spectrum withoutconsidering all the components, such as excess due to accretionor reddening. We tried to fit this spectrum using the procedureby Manara et al. (2013b), as the SNR in the UVB arm, althoughvery low, is not zero. However, this automatic procedure is notable to reproduce the spectrum in the Balmer continuum regionwithout further constraints on some parameters of the fit. Wehave then constrained the value of AV to be between ∼5 magand ∼7 mag, as this is the range of values for which the spreadof Lacc derived from the various emission lines present in thespectrum is minimum. With this constraint and forcing L? forthis object to be that of a 1.2 or 2 Myr old YSO, we obtain abest fit with SpT M5. The accretion rates that would result fromthe fit of the UV-excess with these parameters are one order ofmagnitude higher than those derived from the emission lines,however, and would result in a VLMS (M?= 0.17 M�) accretingat Macc∼8×10⁻⁷ M�/yr. As we show in Fig. C.1, many emissionlines in this spectrum show strong absorption features in theirprofiles, and this could suggest that their real flux is larger. Wedo not expect the difference with the real flux to be larger than afactor ∼2-3, which still is not compatible with the estimates fromthe UV-excess fit. The profiles of these lines suggest that this ob-
13

Manara et al.: X-Shooter study of accretion in ρ-Ophiucus
ject might have a powerful jet, but more analyses are needed andare out of the scope of this work.
A.4. ISO−Oph165
As reported by McClure et al. (2010), this target is a Class I ob-ject. Therefore, its photospheric continuum is strongly extinctedby the envelope that still surrounds the central star and the esti-mates of L? are biased by this. This is the reason why this objectappears to be subluminous on the HRD.
14

Manara et al.: X-Shooter study of accretion in ρ-Ophiucus, Online Material p 1
Appendix B: Best fit of observed ρ-Oph spectrawith templates
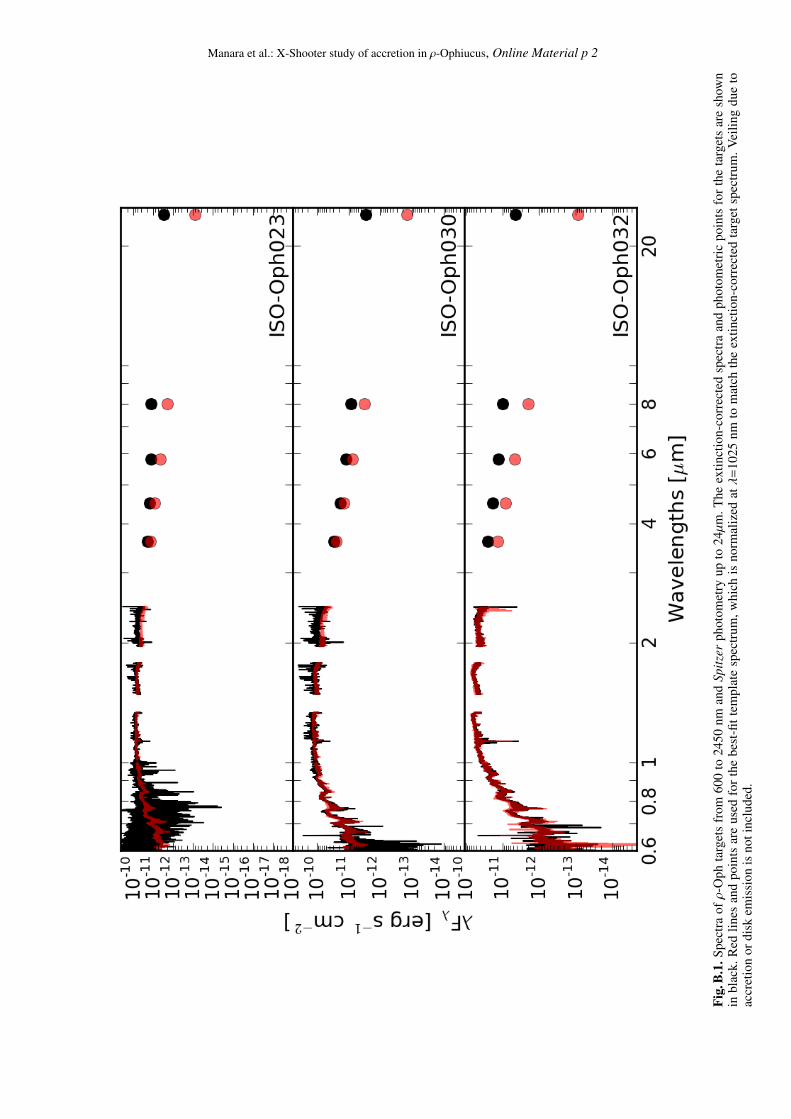
Manara et al.: X-Shooter study of accretion in ρ-Ophiucus, Online Material p 2
Fig.
B.1
.Spe
ctra
ofρ
-Oph
targ
ets
from
600
to24
50nm
and
Spitz
erph
otom
etry
upto
24µ
m.T
heex
tinct
ion-
corr
ecte
dsp
ectr
aan
dph
otom
etri
cpo
ints
for
the
targ
ets
are
show
nin
blac
k.R
edlin
esan
dpo
ints
are
used
for
the
best
-fitt
empl
ate
spec
trum
,whi
chis
norm
aliz
edatλ=
1025
nmto
mat
chth
eex
tinct
ion-
corr
ecte
dta
rget
spec
trum
.Vei
ling
due
toac
cret
ion
ordi
skem
issi
onis
noti
nclu
ded.
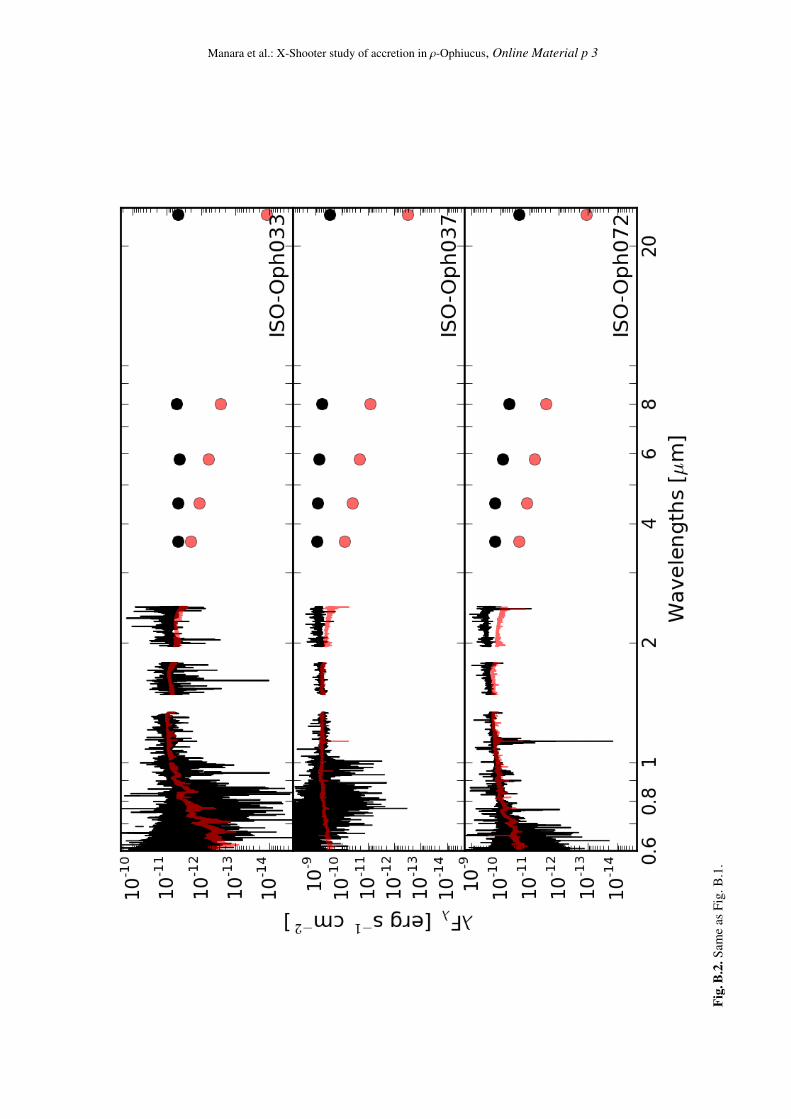
Manara et al.: X-Shooter study of accretion in ρ-Ophiucus, Online Material p 3
Fig.
B.2
.Sam
eas
Fig.
B.1
.
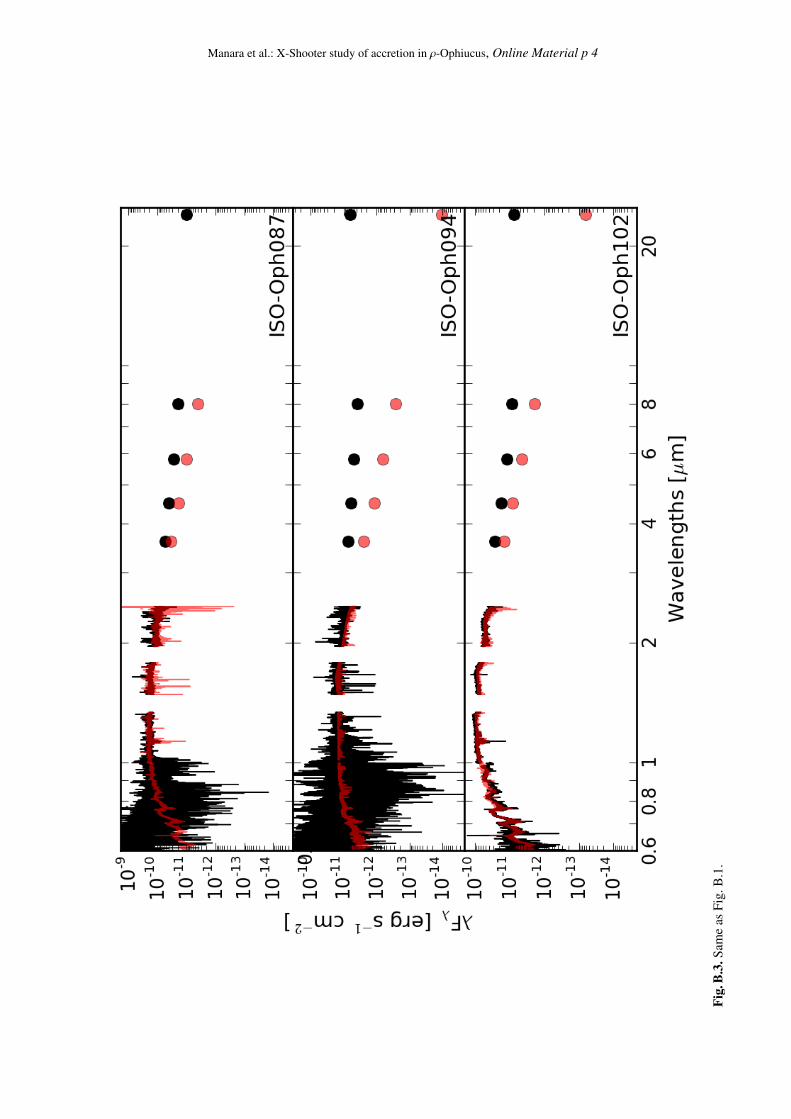
Manara et al.: X-Shooter study of accretion in ρ-Ophiucus, Online Material p 4
Fig.
B.3
.Sam
eas
Fig.
B.1
.
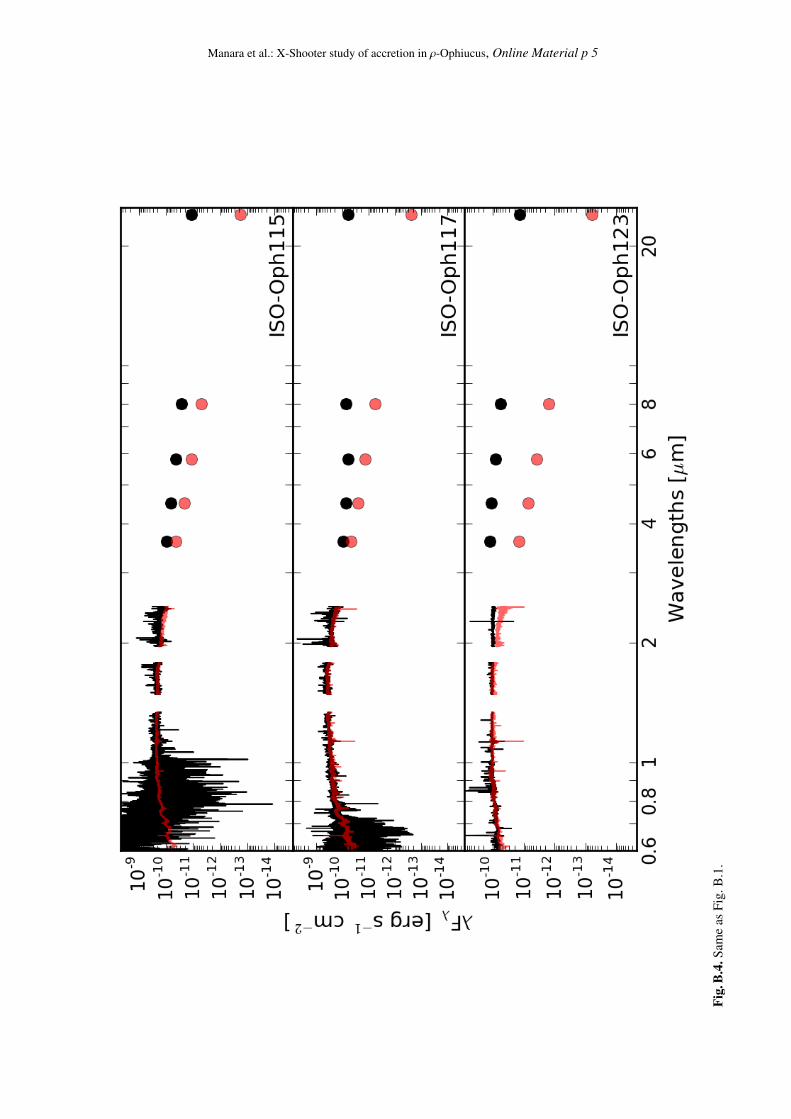
Manara et al.: X-Shooter study of accretion in ρ-Ophiucus, Online Material p 5
Fig.
B.4
.Sam
eas
Fig.
B.1
.
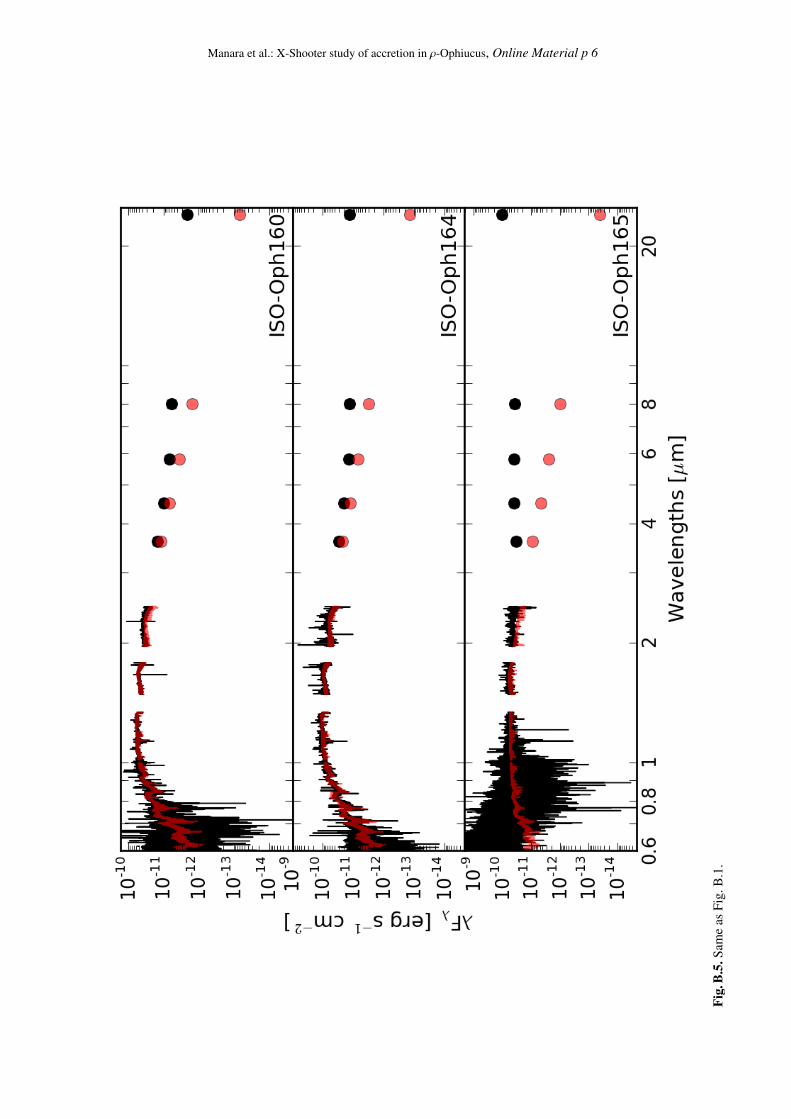
Manara et al.: X-Shooter study of accretion in ρ-Ophiucus, Online Material p 6
Fig.
B.5
.Sam
eas
Fig.
B.1
.
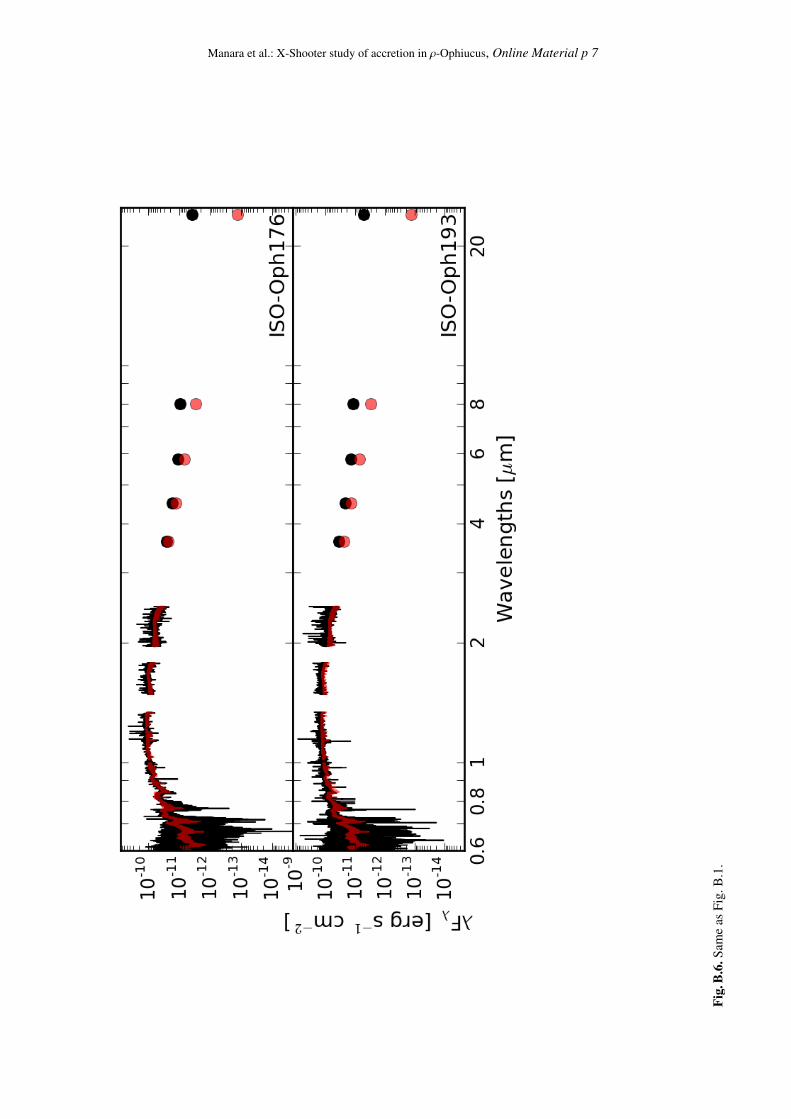
Manara et al.: X-Shooter study of accretion in ρ-Ophiucus, Online Material p 7
Fig.
B.6
.Sam
eas
Fig.
B.1
.
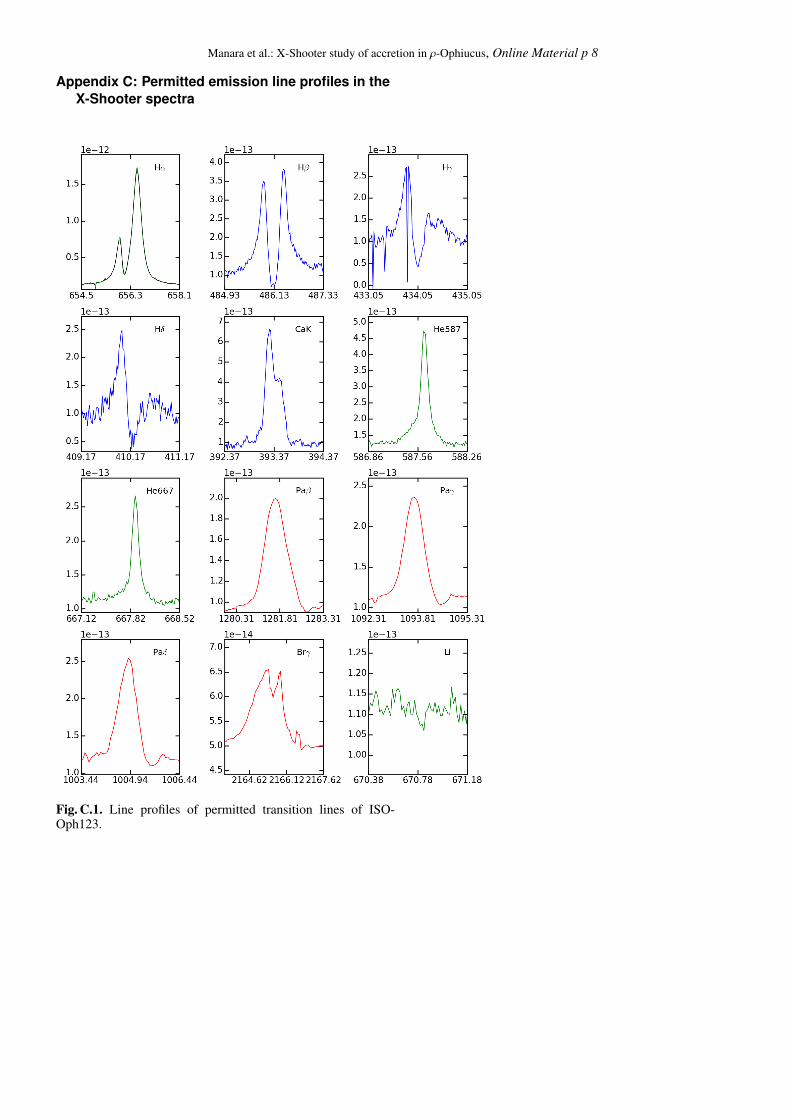
Manara et al.: X-Shooter study of accretion in ρ-Ophiucus, Online Material p 8
Appendix C: Permitted emission line profiles in theX-Shooter spectra
Fig. C.1. Line profiles of permitted transition lines of ISO-Oph123.
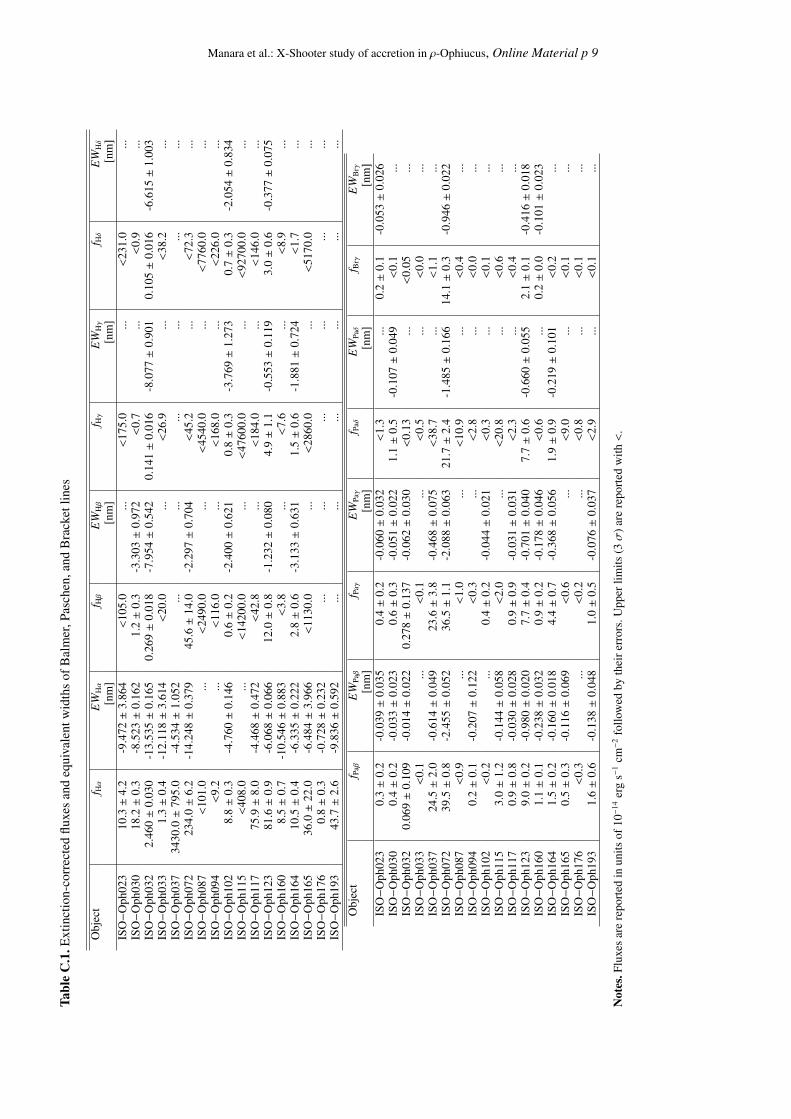
Manara et al.: X-Shooter study of accretion in ρ-Ophiucus, Online Material p 9Ta
ble
C.1
.Ext
inct
ion-
corr
ecte
dflu
xes
and
equi
vale
ntw
idth
sof
Bal
mer
,Pas
chen
,and
Bra
cket
lines
Obj
ect
f Hα
EW
Hα
f Hβ
EW
Hβ
f Hγ
EW
Hγ
f Hδ
EW
Hδ
[nm
][n
m]
[nm
][n
m]
ISO−
Oph
023
10.3±
4.2
-9.4
72±
3.86
4<
105.
0...
<17
5.0
...<
231.
0...
ISO−
Oph
030
18.2±
0.3
-8.5
23±
0.16
21.
2±
0.3
-3.3
03±
0.97
2<
0.7
...<
0.9
...IS
O−
Oph
032
2.46
0±
0.03
0-1
3.53
5±
0.16
50.
269±
0.01
8-7
.954±
0.54
20.
141±
0.01
6-8
.077±
0.90
10.
105±
0.01
6-6
.615±
1.00
3IS
O−
Oph
033
1.3±
0.4
-12.
118±
3.61
4<
20.0
...<
26.9
...<
38.2
...IS
O−
Oph
037
3430
.0±
795.
0-4
.534±
1.05
2...
......
......
...IS
O−
Oph
072
234.
0±
6.2
-14.
248±
0.37
945
.6±
14.0
-2.2
97±
0.70
4<
45.2
...<
72.3
...IS
O−
Oph
087
<10
1.0
...<
2490
.0...
<45
40.0
...<
7760
.0...
ISO−
Oph
094
<9.
2...
<11
6.0
...<
168.
0...
<22
6.0
...IS
O−
Oph
102
8.8±
0.3
-4.7
60±
0.14
60.
6±
0.2
-2.4
00±
0.62
10.
8±
0.3
-3.7
69±
1.27
30.
7±
0.3
-2.0
54±
0.83
4IS
O−
Oph
115
<40
8.0
...<
1420
0.0
...<
4760
0.0
...<
9270
0.0
...IS
O−
Oph
117
75.9±
8.0
-4.4
68±
0.47
2<
42.8
...<
184.
0...
<14
6.0
...IS
O−
Oph
123
81.6±
0.9
-6.0
68±
0.06
612
.0±
0.8
-1.2
32±
0.08
04.
9±
1.1
-0.5
53±
0.11
93.
0±
0.6
-0.3
77±
0.07
5IS
O−
Oph
160
8.5±
0.7
-10.
546±
0.88
3<
3.8
...<
7.6
...<
8.9
...IS
O−
Oph
164
10.5±
0.4
-6.3
35±
0.22
22.
8±
0.6
-3.1
33±
0.63
11.
5±
0.6
-1.8
81±
0.72
4<
1.7
...IS
O−
Oph
165
36.0±
22.0
-6.4
84±
3.96
6<
1130
.0...
<28
60.0
...<
5170
.0...
ISO−
Oph
176
0.8±
0.3
-0.7
28±
0.23
2...
......
......
...IS
O−
Oph
193
43.7±
2.6
-9.8
36±
0.59
2...
......
......
...
Obj
ect
f Paβ
EW
Paβ
f Paγ
EW
Paγ
f Paδ
EW
Paδ
f Brγ
EW
Brγ
[nm
][n
m]
[nm
][n
m]
ISO−
Oph
023
0.3±
0.2
-0.0
39±
0.03
50.
4±
0.2
-0.0
60±
0.03
2<
1.3
...0.
2±
0.1
-0.0
53±
0.02
6IS
O−
Oph
030
0.4±
0.2
-0.0
33±
0.02
30.
6±
0.3
-0.0
51±
0.02
21.
1±
0.5
-0.1
07±
0.04
9<
0.1
...IS
O−
Oph
032
0.06
9±
0.10
9-0
.014±
0.02
20.
278±
0.13
7-0
.062±
0.03
0<
0.13
...<
0.05
...IS
O−
Oph
033
<0.
1...
<0.
1...
<0.
5...
<0.
0...
ISO−
Oph
037
24.5±
2.0
-0.6
14±
0.04
923
.6±
3.8
-0.4
68±
0.07
5<
38.7
...<
1.1
...IS
O−
Oph
072
39.5±
0.8
-2.4
55±
0.05
236
.5±
1.1
-2.0
88±
0.06
321
.7±
2.4
-1.4
85±
0.16
614
.1±
0.3
-0.9
46±
0.02
2IS
O−
Oph
087
<0.
9...
<1.
0...
<10
.9...
<0.
4...
ISO−
Oph
094
0.2±
0.1
-0.2
07±
0.12
2<
0.3
...<
2.8
...<
0.0
...IS
O−
Oph
102
<0.
2...
0.4±
0.2
-0.0
44±
0.02
1<
0.3
...<
0.1
...IS
O−
Oph
115
3.0±
1.2
-0.1
44±
0.05
8<
2.0
...<
20.8
...<
0.6
...IS
O−
Oph
117
0.9±
0.8
-0.0
30±
0.02
80.
9±
0.9
-0.0
31±
0.03
1<
2.3
...<
0.4
...IS
O−
Oph
123
9.0±
0.2
-0.9
80±
0.02
07.
7±
0.4
-0.7
01±
0.04
07.
7±
0.6
-0.6
60±
0.05
52.
1±
0.1
-0.4
16±
0.01
8IS
O−
Oph
160
1.1±
0.1
-0.2
38±
0.03
20.
9±
0.2
-0.1
78±
0.04
6<
0.6
...0.
2±
0.0
-0.1
01±
0.02
3IS
O−
Oph
164
1.5±
0.2
-0.1
60±
0.01
84.
4±
0.7
-0.3
68±
0.05
61.
9±
0.9
-0.2
19±
0.10
1<
0.2
...IS
O−
Oph
165
0.5±
0.3
-0.1
16±
0.06
9<
0.6
...<
9.0
...<
0.1
...IS
O−
Oph
176
<0.
3...
<0.
2...
<0.
8...
<0.
1...
ISO−
Oph
193
1.6±
0.6
-0.1
38±
0.04
81.
0±
0.5
-0.0
76±
0.03
7<
2.9
...<
0.1
...
Not
es.F
luxe
sar
ere
port
edin
units
of10−
14er
gs−
1cm−
2fo
llow
edby
thei
rerr
ors.
Upp
erlim
its(3σ
)are
repo
rted
with
<.
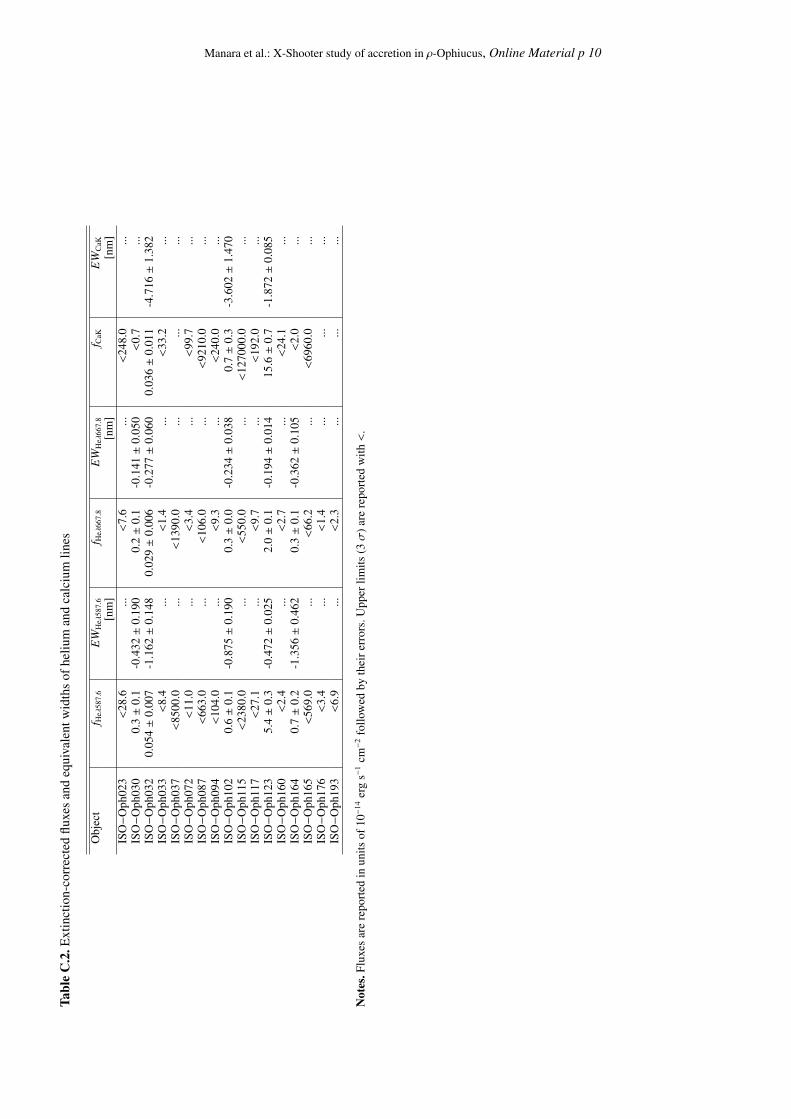
Manara et al.: X-Shooter study of accretion in ρ-Ophiucus, Online Material p 10Ta
ble
C.2
.Ext
inct
ion-
corr
ecte
dflu
xes
and
equi
vale
ntw
idth
sof
heliu
man
dca
lciu
mlin
es
Obj
ect
f Heλ
587.
6E
WH
eλ58
7.6
f Heλ
667.
8E
WH
eλ66
7.8
f CaK
EW
CaK
[nm
][n
m]
[nm
]IS
O−
Oph
023
<28
.6...
<7.
6...
<24
8.0
...IS
O−
Oph
030
0.3±
0.1
-0.4
32±
0.19
00.
2±
0.1
-0.1
41±
0.05
0<
0.7
...IS
O−
Oph
032
0.05
4±
0.00
7-1
.162±
0.14
80.
029±
0.00
6-0
.277±
0.06
00.
036±
0.01
1-4
.716±
1.38
2IS
O−
Oph
033
<8.
4...
<1.
4...
<33
.2...
ISO−
Oph
037
<85
00.0
...<
1390
.0...
......
ISO−
Oph
072
<11
.0...
<3.
4...
<99
.7...
ISO−
Oph
087
<66
3.0
...<
106.
0...
<92
10.0
...IS
O−
Oph
094
<10
4.0
...<
9.3
...<
240.
0...
ISO−
Oph
102
0.6±
0.1
-0.8
75±
0.19
00.
3±
0.0
-0.2
34±
0.03
80.
7±
0.3
-3.6
02±
1.47
0IS
O−
Oph
115
<23
80.0
...<
550.
0...
<12
7000
.0...
ISO−
Oph
117
<27
.1...
<9.
7...
<19
2.0
...IS
O−
Oph
123
5.4±
0.3
-0.4
72±
0.02
52.
0±
0.1
-0.1
94±
0.01
415
.6±
0.7
-1.8
72±
0.08
5IS
O−
Oph
160
<2.
4...
<2.
7...
<24
.1...
ISO−
Oph
164
0.7±
0.2
-1.3
56±
0.46
20.
3±
0.1
-0.3
62±
0.10
5<
2.0
...IS
O−
Oph
165
<56
9.0
...<
66.2
...<
6960
.0...
ISO−
Oph
176
<3.
4...
<1.
4...
......
ISO−
Oph
193
<6.
9...
<2.
3...
......
Not
es.F
luxe
sar
ere
port
edin
units
of10−
14er
gs−
1cm−
2fo
llow
edby
thei
rerr
ors.
Upp
erlim
its(3σ
)are
repo
rted
with
<.
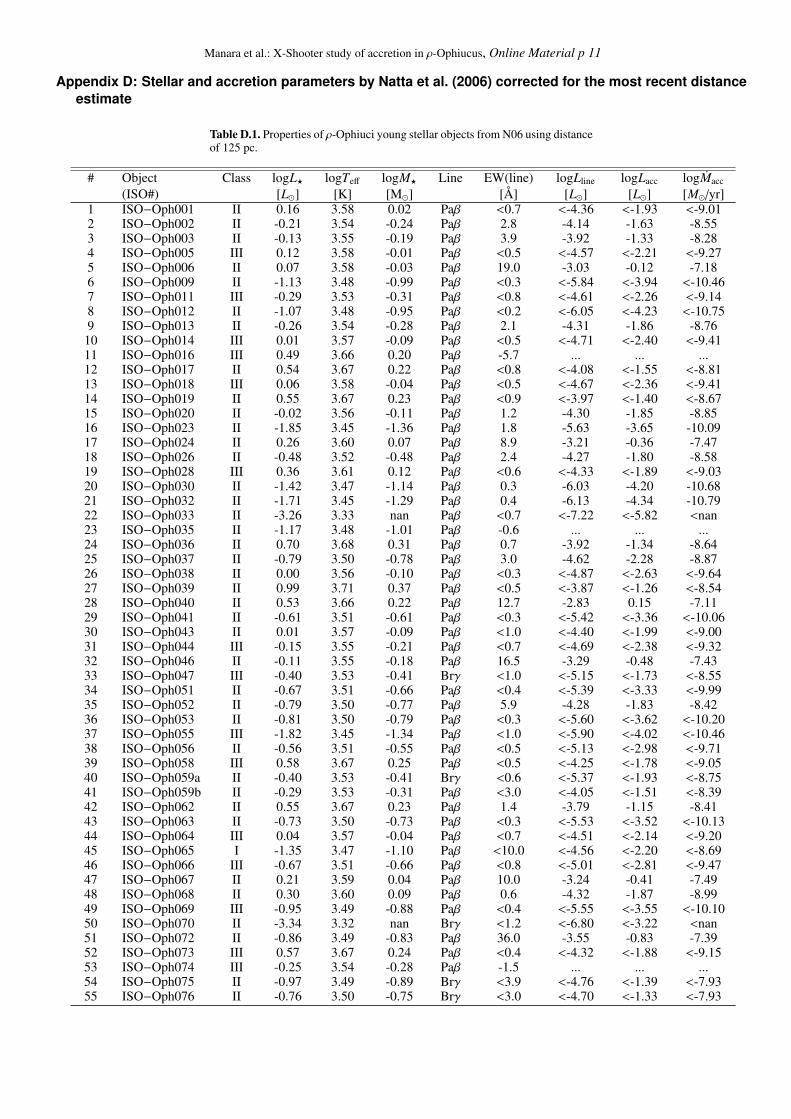
Manara et al.: X-Shooter study of accretion in ρ-Ophiucus, Online Material p 11
Appendix D: Stellar and accretion parameters by Natta et al. (2006) corrected for the most recent distanceestimate
Table D.1. Properties of ρ-Ophiuci young stellar objects from N06 using distanceof 125 pc.
# Object Class logL? logTeff logM? Line EW(line) logLline logLacc logMacc
(ISO#) [L�] [K] [M�] [Å] [L�] [L�] [M�/yr]1 ISO−Oph001 II 0.16 3.58 0.02 Paβ <0.7 <-4.36 <-1.93 <-9.012 ISO−Oph002 II -0.21 3.54 -0.24 Paβ 2.8 -4.14 -1.63 -8.553 ISO−Oph003 II -0.13 3.55 -0.19 Paβ 3.9 -3.92 -1.33 -8.284 ISO−Oph005 III 0.12 3.58 -0.01 Paβ <0.5 <-4.57 <-2.21 <-9.275 ISO−Oph006 II 0.07 3.58 -0.03 Paβ 19.0 -3.03 -0.12 -7.186 ISO−Oph009 II -1.13 3.48 -0.99 Paβ <0.3 <-5.84 <-3.94 <-10.467 ISO−Oph011 III -0.29 3.53 -0.31 Paβ <0.8 <-4.61 <-2.26 <-9.148 ISO−Oph012 II -1.07 3.48 -0.95 Paβ <0.2 <-6.05 <-4.23 <-10.759 ISO−Oph013 II -0.26 3.54 -0.28 Paβ 2.1 -4.31 -1.86 -8.76
10 ISO−Oph014 III 0.01 3.57 -0.09 Paβ <0.5 <-4.71 <-2.40 <-9.4111 ISO−Oph016 III 0.49 3.66 0.20 Paβ -5.7 ... ... ...12 ISO−Oph017 II 0.54 3.67 0.22 Paβ <0.8 <-4.08 <-1.55 <-8.8113 ISO−Oph018 III 0.06 3.58 -0.04 Paβ <0.5 <-4.67 <-2.36 <-9.4114 ISO−Oph019 II 0.55 3.67 0.23 Paβ <0.9 <-3.97 <-1.40 <-8.6715 ISO−Oph020 II -0.02 3.56 -0.11 Paβ 1.2 -4.30 -1.85 -8.8516 ISO−Oph023 II -1.85 3.45 -1.36 Paβ 1.8 -5.63 -3.65 -10.0917 ISO−Oph024 II 0.26 3.60 0.07 Paβ 8.9 -3.21 -0.36 -7.4718 ISO−Oph026 II -0.48 3.52 -0.48 Paβ 2.4 -4.27 -1.80 -8.5819 ISO−Oph028 III 0.36 3.61 0.12 Paβ <0.6 <-4.33 <-1.89 <-9.0320 ISO−Oph030 II -1.42 3.47 -1.14 Paβ 0.3 -6.03 -4.20 -10.6821 ISO−Oph032 II -1.71 3.45 -1.29 Paβ 0.4 -6.13 -4.34 -10.7922 ISO−Oph033 II -3.26 3.33 nan Paβ <0.7 <-7.22 <-5.82 <nan23 ISO−Oph035 II -1.17 3.48 -1.01 Paβ -0.6 ... ... ...24 ISO−Oph036 II 0.70 3.68 0.31 Paβ 0.7 -3.92 -1.34 -8.6425 ISO−Oph037 II -0.79 3.50 -0.78 Paβ 3.0 -4.62 -2.28 -8.8726 ISO−Oph038 II 0.00 3.56 -0.10 Paβ <0.3 <-4.87 <-2.63 <-9.6427 ISO−Oph039 II 0.99 3.71 0.37 Paβ <0.5 <-3.87 <-1.26 <-8.5428 ISO−Oph040 II 0.53 3.66 0.22 Paβ 12.7 -2.83 0.15 -7.1129 ISO−Oph041 II -0.61 3.51 -0.61 Paβ <0.3 <-5.42 <-3.36 <-10.0630 ISO−Oph043 II 0.01 3.57 -0.09 Paβ <1.0 <-4.40 <-1.99 <-9.0031 ISO−Oph044 III -0.15 3.55 -0.21 Paβ <0.7 <-4.69 <-2.38 <-9.3232 ISO−Oph046 II -0.11 3.55 -0.18 Paβ 16.5 -3.29 -0.48 -7.4333 ISO−Oph047 III -0.40 3.53 -0.41 Brγ <1.0 <-5.15 <-1.73 <-8.5534 ISO−Oph051 II -0.67 3.51 -0.66 Paβ <0.4 <-5.39 <-3.33 <-9.9935 ISO−Oph052 II -0.79 3.50 -0.77 Paβ 5.9 -4.28 -1.83 -8.4236 ISO−Oph053 II -0.81 3.50 -0.79 Paβ <0.3 <-5.60 <-3.62 <-10.2037 ISO−Oph055 III -1.82 3.45 -1.34 Paβ <1.0 <-5.90 <-4.02 <-10.4638 ISO−Oph056 II -0.56 3.51 -0.55 Paβ <0.5 <-5.13 <-2.98 <-9.7139 ISO−Oph058 III 0.58 3.67 0.25 Paβ <0.5 <-4.25 <-1.78 <-9.0540 ISO−Oph059a II -0.40 3.53 -0.41 Brγ <0.6 <-5.37 <-1.93 <-8.7541 ISO−Oph059b II -0.29 3.53 -0.31 Paβ <3.0 <-4.05 <-1.51 <-8.3942 ISO−Oph062 II 0.55 3.67 0.23 Paβ 1.4 -3.79 -1.15 -8.4143 ISO−Oph063 II -0.73 3.50 -0.73 Paβ <0.3 <-5.53 <-3.52 <-10.1344 ISO−Oph064 III 0.04 3.57 -0.04 Paβ <0.7 <-4.51 <-2.14 <-9.2045 ISO−Oph065 I -1.35 3.47 -1.10 Paβ <10.0 <-4.56 <-2.20 <-8.6946 ISO−Oph066 III -0.67 3.51 -0.66 Paβ <0.8 <-5.01 <-2.81 <-9.4747 ISO−Oph067 II 0.21 3.59 0.04 Paβ 10.0 -3.24 -0.41 -7.4948 ISO−Oph068 II 0.30 3.60 0.09 Paβ 0.6 -4.32 -1.87 -8.9949 ISO−Oph069 III -0.95 3.49 -0.88 Paβ <0.4 <-5.55 <-3.55 <-10.1050 ISO−Oph070 II -3.34 3.32 nan Brγ <1.2 <-6.80 <-3.22 <nan51 ISO−Oph072 II -0.86 3.49 -0.83 Paβ 36.0 -3.55 -0.83 -7.3952 ISO−Oph073 III 0.57 3.67 0.24 Paβ <0.4 <-4.32 <-1.88 <-9.1553 ISO−Oph074 III -0.25 3.54 -0.28 Paβ -1.5 ... ... ...54 ISO−Oph075 II -0.97 3.49 -0.89 Brγ <3.9 <-4.76 <-1.39 <-7.9355 ISO−Oph076 II -0.76 3.50 -0.75 Brγ <3.0 <-4.70 <-1.33 <-7.93
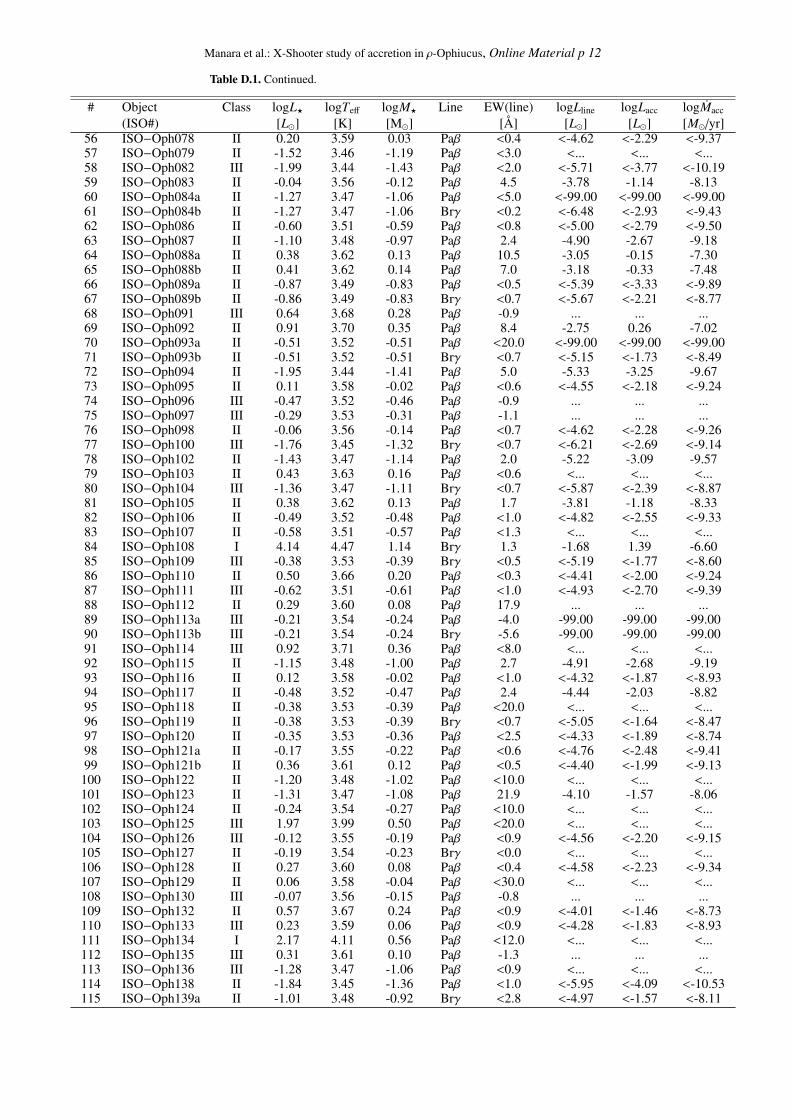
Manara et al.: X-Shooter study of accretion in ρ-Ophiucus, Online Material p 12
Table D.1. Continued.
# Object Class logL? logTeff logM? Line EW(line) logLline logLacc logMacc
(ISO#) [L�] [K] [M�] [Å] [L�] [L�] [M�/yr]56 ISO−Oph078 II 0.20 3.59 0.03 Paβ <0.4 <-4.62 <-2.29 <-9.3757 ISO−Oph079 II -1.52 3.46 -1.19 Paβ <3.0 <... <... <...58 ISO−Oph082 III -1.99 3.44 -1.43 Paβ <2.0 <-5.71 <-3.77 <-10.1959 ISO−Oph083 II -0.04 3.56 -0.12 Paβ 4.5 -3.78 -1.14 -8.1360 ISO−Oph084a II -1.27 3.47 -1.06 Paβ <5.0 <-99.00 <-99.00 <-99.0061 ISO−Oph084b II -1.27 3.47 -1.06 Brγ <0.2 <-6.48 <-2.93 <-9.4362 ISO−Oph086 II -0.60 3.51 -0.59 Paβ <0.8 <-5.00 <-2.79 <-9.5063 ISO−Oph087 II -1.10 3.48 -0.97 Paβ 2.4 -4.90 -2.67 -9.1864 ISO−Oph088a II 0.38 3.62 0.13 Paβ 10.5 -3.05 -0.15 -7.3065 ISO−Oph088b II 0.41 3.62 0.14 Paβ 7.0 -3.18 -0.33 -7.4866 ISO−Oph089a II -0.87 3.49 -0.83 Paβ <0.5 <-5.39 <-3.33 <-9.8967 ISO−Oph089b II -0.86 3.49 -0.83 Brγ <0.7 <-5.67 <-2.21 <-8.7768 ISO−Oph091 III 0.64 3.68 0.28 Paβ -0.9 ... ... ...69 ISO−Oph092 II 0.91 3.70 0.35 Paβ 8.4 -2.75 0.26 -7.0270 ISO−Oph093a II -0.51 3.52 -0.51 Paβ <20.0 <-99.00 <-99.00 <-99.0071 ISO−Oph093b II -0.51 3.52 -0.51 Brγ <0.7 <-5.15 <-1.73 <-8.4972 ISO−Oph094 II -1.95 3.44 -1.41 Paβ 5.0 -5.33 -3.25 -9.6773 ISO−Oph095 II 0.11 3.58 -0.02 Paβ <0.6 <-4.55 <-2.18 <-9.2474 ISO−Oph096 III -0.47 3.52 -0.46 Paβ -0.9 ... ... ...75 ISO−Oph097 III -0.29 3.53 -0.31 Paβ -1.1 ... ... ...76 ISO−Oph098 II -0.06 3.56 -0.14 Paβ <0.7 <-4.62 <-2.28 <-9.2677 ISO−Oph100 III -1.76 3.45 -1.32 Brγ <0.7 <-6.21 <-2.69 <-9.1478 ISO−Oph102 II -1.43 3.47 -1.14 Paβ 2.0 -5.22 -3.09 -9.5779 ISO−Oph103 II 0.43 3.63 0.16 Paβ <0.6 <... <... <...80 ISO−Oph104 III -1.36 3.47 -1.11 Brγ <0.7 <-5.87 <-2.39 <-8.8781 ISO−Oph105 II 0.38 3.62 0.13 Paβ 1.7 -3.81 -1.18 -8.3382 ISO−Oph106 II -0.49 3.52 -0.48 Paβ <1.0 <-4.82 <-2.55 <-9.3383 ISO−Oph107 II -0.58 3.51 -0.57 Paβ <1.3 <... <... <...84 ISO−Oph108 I 4.14 4.47 1.14 Brγ 1.3 -1.68 1.39 -6.6085 ISO−Oph109 III -0.38 3.53 -0.39 Brγ <0.5 <-5.19 <-1.77 <-8.6086 ISO−Oph110 II 0.50 3.66 0.20 Paβ <0.3 <-4.41 <-2.00 <-9.2487 ISO−Oph111 III -0.62 3.51 -0.61 Paβ <1.0 <-4.93 <-2.70 <-9.3988 ISO−Oph112 II 0.29 3.60 0.08 Paβ 17.9 ... ... ...89 ISO−Oph113a III -0.21 3.54 -0.24 Paβ -4.0 -99.00 -99.00 -99.0090 ISO−Oph113b III -0.21 3.54 -0.24 Brγ -5.6 -99.00 -99.00 -99.0091 ISO−Oph114 III 0.92 3.71 0.36 Paβ <8.0 <... <... <...92 ISO−Oph115 II -1.15 3.48 -1.00 Paβ 2.7 -4.91 -2.68 -9.1993 ISO−Oph116 II 0.12 3.58 -0.02 Paβ <1.0 <-4.32 <-1.87 <-8.9394 ISO−Oph117 II -0.48 3.52 -0.47 Paβ 2.4 -4.44 -2.03 -8.8295 ISO−Oph118 II -0.38 3.53 -0.39 Paβ <20.0 <... <... <...96 ISO−Oph119 II -0.38 3.53 -0.39 Brγ <0.7 <-5.05 <-1.64 <-8.4797 ISO−Oph120 II -0.35 3.53 -0.36 Paβ <2.5 <-4.33 <-1.89 <-8.7498 ISO−Oph121a II -0.17 3.55 -0.22 Paβ <0.6 <-4.76 <-2.48 <-9.4199 ISO−Oph121b II 0.36 3.61 0.12 Paβ <0.5 <-4.40 <-1.99 <-9.13
100 ISO−Oph122 II -1.20 3.48 -1.02 Paβ <10.0 <... <... <...101 ISO−Oph123 II -1.31 3.47 -1.08 Paβ 21.9 -4.10 -1.57 -8.06102 ISO−Oph124 II -0.24 3.54 -0.27 Paβ <10.0 <... <... <...103 ISO−Oph125 III 1.97 3.99 0.50 Paβ <20.0 <... <... <...104 ISO−Oph126 III -0.12 3.55 -0.19 Paβ <0.9 <-4.56 <-2.20 <-9.15105 ISO−Oph127 II -0.19 3.54 -0.23 Brγ <0.0 <... <... <...106 ISO−Oph128 II 0.27 3.60 0.08 Paβ <0.4 <-4.58 <-2.23 <-9.34107 ISO−Oph129 II 0.06 3.58 -0.04 Paβ <30.0 <... <... <...108 ISO−Oph130 III -0.07 3.56 -0.15 Paβ -0.8 ... ... ...109 ISO−Oph132 II 0.57 3.67 0.24 Paβ <0.9 <-4.01 <-1.46 <-8.73110 ISO−Oph133 III 0.23 3.59 0.06 Paβ <0.9 <-4.28 <-1.83 <-8.93111 ISO−Oph134 I 2.17 4.11 0.56 Paβ <12.0 <... <... <...112 ISO−Oph135 III 0.31 3.61 0.10 Paβ -1.3 ... ... ...113 ISO−Oph136 III -1.28 3.47 -1.06 Paβ <0.9 <... <... <...114 ISO−Oph138 II -1.84 3.45 -1.36 Paβ <1.0 <-5.95 <-4.09 <-10.53115 ISO−Oph139a II -1.01 3.48 -0.92 Brγ <2.8 <-4.97 <-1.57 <-8.11
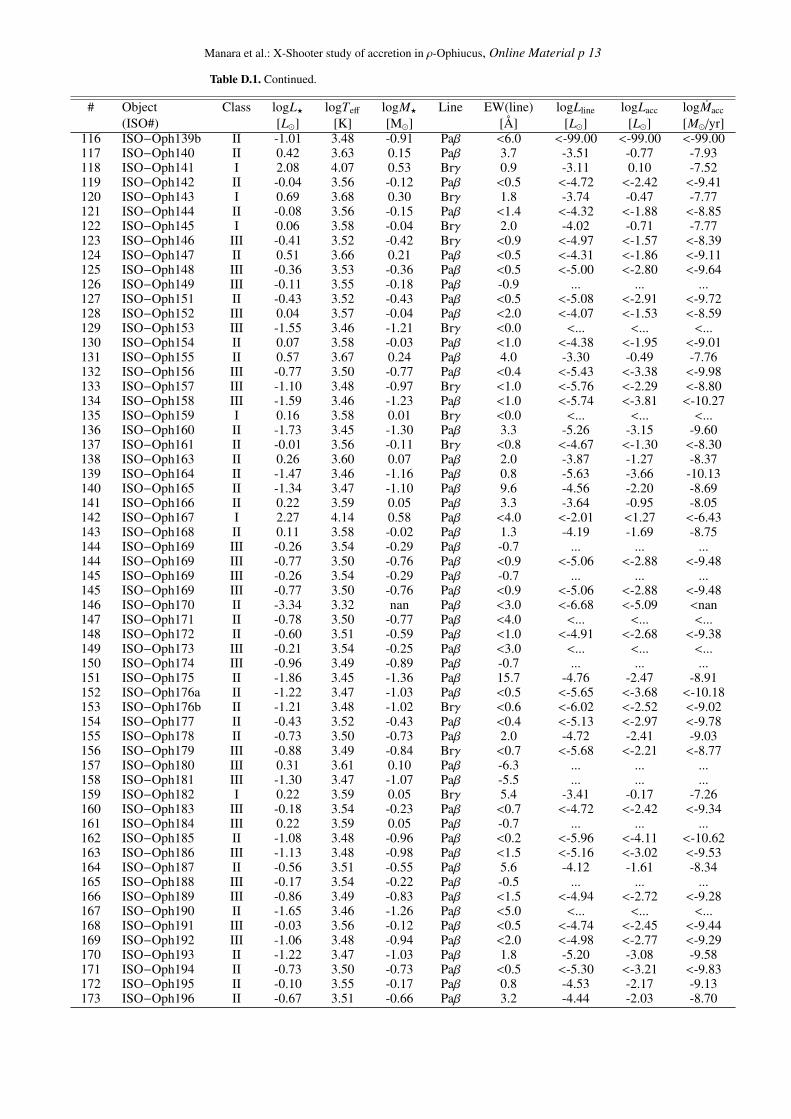
Manara et al.: X-Shooter study of accretion in ρ-Ophiucus, Online Material p 13
Table D.1. Continued.
# Object Class logL? logTeff logM? Line EW(line) logLline logLacc logMacc
(ISO#) [L�] [K] [M�] [Å] [L�] [L�] [M�/yr]116 ISO−Oph139b II -1.01 3.48 -0.91 Paβ <6.0 <-99.00 <-99.00 <-99.00117 ISO−Oph140 II 0.42 3.63 0.15 Paβ 3.7 -3.51 -0.77 -7.93118 ISO−Oph141 I 2.08 4.07 0.53 Brγ 0.9 -3.11 0.10 -7.52119 ISO−Oph142 II -0.04 3.56 -0.12 Paβ <0.5 <-4.72 <-2.42 <-9.41120 ISO−Oph143 I 0.69 3.68 0.30 Brγ 1.8 -3.74 -0.47 -7.77121 ISO−Oph144 II -0.08 3.56 -0.15 Paβ <1.4 <-4.32 <-1.88 <-8.85122 ISO−Oph145 I 0.06 3.58 -0.04 Brγ 2.0 -4.02 -0.71 -7.77123 ISO−Oph146 III -0.41 3.52 -0.42 Brγ <0.9 <-4.97 <-1.57 <-8.39124 ISO−Oph147 II 0.51 3.66 0.21 Paβ <0.5 <-4.31 <-1.86 <-9.11125 ISO−Oph148 III -0.36 3.53 -0.36 Paβ <0.5 <-5.00 <-2.80 <-9.64126 ISO−Oph149 III -0.11 3.55 -0.18 Paβ -0.9 ... ... ...127 ISO−Oph151 II -0.43 3.52 -0.43 Paβ <0.5 <-5.08 <-2.91 <-9.72128 ISO−Oph152 III 0.04 3.57 -0.04 Paβ <2.0 <-4.07 <-1.53 <-8.59129 ISO−Oph153 III -1.55 3.46 -1.21 Brγ <0.0 <... <... <...130 ISO−Oph154 II 0.07 3.58 -0.03 Paβ <1.0 <-4.38 <-1.95 <-9.01131 ISO−Oph155 II 0.57 3.67 0.24 Paβ 4.0 -3.30 -0.49 -7.76132 ISO−Oph156 III -0.77 3.50 -0.77 Paβ <0.4 <-5.43 <-3.38 <-9.98133 ISO−Oph157 III -1.10 3.48 -0.97 Brγ <1.0 <-5.76 <-2.29 <-8.80134 ISO−Oph158 III -1.59 3.46 -1.23 Paβ <1.0 <-5.74 <-3.81 <-10.27135 ISO−Oph159 I 0.16 3.58 0.01 Brγ <0.0 <... <... <...136 ISO−Oph160 II -1.73 3.45 -1.30 Paβ 3.3 -5.26 -3.15 -9.60137 ISO−Oph161 II -0.01 3.56 -0.11 Brγ <0.8 <-4.67 <-1.30 <-8.30138 ISO−Oph163 II 0.26 3.60 0.07 Paβ 2.0 -3.87 -1.27 -8.37139 ISO−Oph164 II -1.47 3.46 -1.16 Paβ 0.8 -5.63 -3.66 -10.13140 ISO−Oph165 II -1.34 3.47 -1.10 Paβ 9.6 -4.56 -2.20 -8.69141 ISO−Oph166 II 0.22 3.59 0.05 Paβ 3.3 -3.64 -0.95 -8.05142 ISO−Oph167 I 2.27 4.14 0.58 Paβ <4.0 <-2.01 <1.27 <-6.43143 ISO−Oph168 II 0.11 3.58 -0.02 Paβ 1.3 -4.19 -1.69 -8.75144 ISO−Oph169 III -0.26 3.54 -0.29 Paβ -0.7 ... ... ...144 ISO−Oph169 III -0.77 3.50 -0.76 Paβ <0.9 <-5.06 <-2.88 <-9.48145 ISO−Oph169 III -0.26 3.54 -0.29 Paβ -0.7 ... ... ...145 ISO−Oph169 III -0.77 3.50 -0.76 Paβ <0.9 <-5.06 <-2.88 <-9.48146 ISO−Oph170 II -3.34 3.32 nan Paβ <3.0 <-6.68 <-5.09 <nan147 ISO−Oph171 II -0.78 3.50 -0.77 Paβ <4.0 <... <... <...148 ISO−Oph172 II -0.60 3.51 -0.59 Paβ <1.0 <-4.91 <-2.68 <-9.38149 ISO−Oph173 III -0.21 3.54 -0.25 Paβ <3.0 <... <... <...150 ISO−Oph174 III -0.96 3.49 -0.89 Paβ -0.7 ... ... ...151 ISO−Oph175 II -1.86 3.45 -1.36 Paβ 15.7 -4.76 -2.47 -8.91152 ISO−Oph176a II -1.22 3.47 -1.03 Paβ <0.5 <-5.65 <-3.68 <-10.18153 ISO−Oph176b II -1.21 3.48 -1.02 Brγ <0.6 <-6.02 <-2.52 <-9.02154 ISO−Oph177 II -0.43 3.52 -0.43 Paβ <0.4 <-5.13 <-2.97 <-9.78155 ISO−Oph178 II -0.73 3.50 -0.73 Paβ 2.0 -4.72 -2.41 -9.03156 ISO−Oph179 III -0.88 3.49 -0.84 Brγ <0.7 <-5.68 <-2.21 <-8.77157 ISO−Oph180 III 0.31 3.61 0.10 Paβ -6.3 ... ... ...158 ISO−Oph181 III -1.30 3.47 -1.07 Paβ -5.5 ... ... ...159 ISO−Oph182 I 0.22 3.59 0.05 Brγ 5.4 -3.41 -0.17 -7.26160 ISO−Oph183 III -0.18 3.54 -0.23 Paβ <0.7 <-4.72 <-2.42 <-9.34161 ISO−Oph184 III 0.22 3.59 0.05 Paβ -0.7 ... ... ...162 ISO−Oph185 II -1.08 3.48 -0.96 Paβ <0.2 <-5.96 <-4.11 <-10.62163 ISO−Oph186 III -1.13 3.48 -0.98 Paβ <1.5 <-5.16 <-3.02 <-9.53164 ISO−Oph187 II -0.56 3.51 -0.55 Paβ 5.6 -4.12 -1.61 -8.34165 ISO−Oph188 III -0.17 3.54 -0.22 Paβ -0.5 ... ... ...166 ISO−Oph189 III -0.86 3.49 -0.83 Paβ <1.5 <-4.94 <-2.72 <-9.28167 ISO−Oph190 II -1.65 3.46 -1.26 Paβ <5.0 <... <... <...168 ISO−Oph191 III -0.03 3.56 -0.12 Paβ <0.5 <-4.74 <-2.45 <-9.44169 ISO−Oph192 III -1.06 3.48 -0.94 Paβ <2.0 <-4.98 <-2.77 <-9.29170 ISO−Oph193 II -1.22 3.47 -1.03 Paβ 1.8 -5.20 -3.08 -9.58171 ISO−Oph194 II -0.73 3.50 -0.73 Paβ <0.5 <-5.30 <-3.21 <-9.83172 ISO−Oph195 II -0.10 3.55 -0.17 Paβ 0.8 -4.53 -2.17 -9.13173 ISO−Oph196 II -0.67 3.51 -0.66 Paβ 3.2 -4.44 -2.03 -8.70

Manara et al.: X-Shooter study of accretion in ρ-Ophiucus, Online Material p 14
Table D.1. Continued.
# Object Class logL? logTeff logM? Line EW(line) logLline logLacc logMacc
(ISO#) [L�] [K] [M�] [Å] [L�] [L�] [M�/yr]174 ISO−Oph197 III -1.11 3.48 -0.97 Paβ <1.0 <-5.29 <-3.19 <-9.71175 ISO−Oph198 III 0.73 3.69 0.31 Paβ <0.4 <-4.12 <-1.60 <-8.90176 ISO−Oph199 II -0.13 3.55 -0.19 Paβ 1.7 -4.23 -1.75 -8.70
M? and age are derived using the evolutionary tracks of Baraffe et al. (1998) and assuming a single isochrone at 1 Myr as explainedin Rigliaco et al. (2011a).


![Digital Speech Processing— Lecture 10 Short-Time … speech...Short-Time Fourier Analysis Methods - Filter Bank Design 2 Review of STFT 1 123 0 2 1 ˆˆ ˆ ˆ ˆ ˆ ˆ.() [][]ˆ](https://static.fdocument.org/doc/165x107/5af943cd7f8b9ad2208d9fa6/digital-speech-processing-lecture-10-short-time-speechshort-time-fourier.jpg)