Saliniquinones A–F, New Members of the Highly Cytotoxic Anthraquinone-γ-Pyrones from the Marine...
6
RESEARCH FRONT CSIRO PUBLISHING Full Paper www.publish.csiro.au/journals/ajc Aust. J. Chem. 2010, 63, 929–934 Saliniquinones A–F, New Members of the Highly Cytotoxic Anthraquinone-γ-Pyrones from the Marine Actinomycete Salinispora arenicola Brian T. Murphy, A Tadigoppula Narender, A Christopher A. Kauffman, A Matthew Woolery, A Paul R. Jensen, A and William Fenical A,B A Center for Marine Biotechnology and Biomedicine, Scripps Institution of Oceanography, University of California–San Diego, La Jolla, CA 92093-0204, USA. B Corresponding author. Email: [email protected] Six new anthraquinone-γ-pyrones, saliniquinonesA–F (1–6), which are related to metabolites of the pluramycin/altromycin class, were isolated from a fermentation broth of the marine actinomycete Salinispora arenicola (strain CNS-325). Their structures were determined by analysis of one- and two-dimensional NMR spectroscopic and high-resolution mass spec- trometric data. The relative and absolute configurations of compounds 1–6 were determined by analysis of NOESY NMR spectroscopic data and by comparison of circular dichroism and optical rotation data with model compounds found in the literature. Saliniquinone A (1) exhibited potent inhibition of the human colon adenocarcinoma cell line (HCT-116) with an IC 50 of 9.9 × 10 −9 M. In the context of the biosynthetic diversity of S. arenicola, compounds 1–6 represent secondary metabolites that appear to be strain specific and thus occur outside of the core group of compounds commonly observed from this species. Manuscript received: 5 February 2010. Manuscript accepted: 12 May 2010. Introduction Actinomycetes have been an enduring source of bioactive sec- ondary metabolites for over 50 years, [1] although it is becoming ever more difficult to isolate novel bioactive secondary metabo- lites from terrestrial strains. As part of an effort to isolate new agents of potential use in the treatment of cancer, we have focussed our efforts toward actinomycete bacteria found in deep ocean sediments. As part of these studies, we have pre- viously described the first obligate marine actinomycete genus, Salinispora, [2] which has proven to be a prolific producer of structurally unique bioactive molecules, including salinospo- ramide A, [3] a potent proteasome inhibitor currently completing Phase I clinical trials for the treatment of various cancers. Pre- vious studies of Salinispora species have revealed that certain secondary metabolites are produced in species-specific patterns while others appear to be population or strain-specific. [4] As part of our current investigation into the relationships between actinomycete diversity and secondary metabolite production, strain CNS-325 was isolated from a marine sediment sample collected from Palau and identified as Salinispora arenicola by 16S rRNA gene sequence analysis. Fractions of the crude extract displayed potent antiproliferative activity against HCT-116 colon carcinoma cells in vitro. Herein, we describe the isolation and characterization of six new anthraquinone-γ-pyrones, salin- iquinones A–F (1–6) (Fig. 1). The isolation of new members of this potently cytotoxic skeletal class from S. arenicola expands the scope of secondary metabolite production observed from this species. Results Saliniquinone A (1) was obtained as a yellow amorphous solid. Positive-ion high-resolution electrospray ionization time- of-flight mass spectrometry (HRESI-TOF MS) analysis gave a pseudomolecular ion at m/z 405.0970, which suggested the molecular formula C 23 H 16 O 7 . The 13 C and g-HSQC NMR spectra of 1 in CDCl 3 showed three α,β-unsaturated ketone carbonyls (δ C 179.7 (C-4), 181.4 (C-7), 187.0 (C-12)), three sp 2 -oxygenated carbons (δ C 168.9 (C-2), 162.8 (C-110), 156.6 (C-12b)), and an additional 13 sp 2 carbons to be present in 1 (see Table 1). There was also evidence of three sp 3 -oxygenated carbons (δ C 65.2 (C-13), 59.6 (C-14), 66.1 (C-16)) and one sp 3 methyl carbon (δ C 14.0 (C-15)). Select 1 H NMR resonances from 1 in CDCl 3 exhibited the characteristic pattern of an aro- matic ABC spin system (δ H 7.84 (dd, J 7.5, 1.5, H-8), 7.71 (t, J 7.5, H-9), 7.39 (dd, J 7.5, 1.5, H-10)). In addition, resonances for two aromatic methine hydrogens (δ H 6.63 (s, H-3), 8.34 (s, H-6)), one terminal olefin (δ H 5.91 (ddd, J 7.0, 11, 17, H-17), 5.59 (d, J 11, H α -18), 5.66 (d, J 17, H β -18)), an oxymethylene (δ H 5.08 (d, J 6.0, H 2 -13)), an oxymethine (δ H 3.88 (d, J 7.0, H-16)), and a methyl group (δ H 1.87 (s, C-15)) were observed. Analysis of combined g-COSY and g-HMBC NMR spec- tra allowed the assembly of rings A–D (Fig. 2). Ring A was constructed from interpretation of COSY correlations from H-8 to H-9, and H-9 to H-10. HMBC correlations of a deshielded peri-hydroxy proton (δ H 12.73 (s, OH-11)) to C-10, C-11a, and C-12 (J 4 ) allowed the hydroxy group to be placed at C-11 and also linked ring A to the quinone ring B. The presence of an © CSIRO 2010 10.1071/CH10068 0004-9425/10/060929
Transcript of Saliniquinones A–F, New Members of the Highly Cytotoxic Anthraquinone-γ-Pyrones from the Marine...
RESEARCH FRONT
CSIRO PUBLISHING Full Paper
www.publish.csiro.au/journals/ajc Aust. J. Chem. 2010, 63, 929–934
Saliniquinones A–F, New Members of the Highly CytotoxicAnthraquinone-γ-Pyrones from the Marine ActinomyceteSalinispora arenicola
Brian T. Murphy,A Tadigoppula Narender,A Christopher A. Kauffman,A
Matthew Woolery,A Paul R. Jensen,A and William FenicalA,B
ACenter for Marine Biotechnology and Biomedicine, Scripps Institution of Oceanography,University of California–San Diego, La Jolla, CA 92093-0204, USA.
BCorresponding author. Email: [email protected]
Six new anthraquinone-γ-pyrones, saliniquinonesA–F (1–6), which are related to metabolites of the pluramycin/altromycinclass, were isolated from a fermentation broth of the marine actinomycete Salinispora arenicola (strain CNS-325). Theirstructures were determined by analysis of one- and two-dimensional NMR spectroscopic and high-resolution mass spec-trometric data. The relative and absolute configurations of compounds 1–6 were determined by analysis of NOESY NMRspectroscopic data and by comparison of circular dichroism and optical rotation data with model compounds found in theliterature. Saliniquinone A (1) exhibited potent inhibition of the human colon adenocarcinoma cell line (HCT-116) withan IC50 of 9.9 × 10⁻⁹ M. In the context of the biosynthetic diversity of S. arenicola, compounds 1–6 represent secondarymetabolites that appear to be strain specific and thus occur outside of the core group of compounds commonly observedfrom this species.
Manuscript received: 5 February 2010.Manuscript accepted: 12 May 2010.
Introduction
Actinomycetes have been an enduring source of bioactive sec-ondary metabolites for over 50 years,[1] although it is becomingever more difficult to isolate novel bioactive secondary metabo-lites from terrestrial strains. As part of an effort to isolatenew agents of potential use in the treatment of cancer, wehave focussed our efforts toward actinomycete bacteria foundin deep ocean sediments. As part of these studies, we have pre-viously described the first obligate marine actinomycete genus,Salinispora,[2] which has proven to be a prolific producer ofstructurally unique bioactive molecules, including salinospo-ramide A,[3] a potent proteasome inhibitor currently completingPhase I clinical trials for the treatment of various cancers. Pre-vious studies of Salinispora species have revealed that certainsecondary metabolites are produced in species-specific patternswhile others appear to be population or strain-specific.[4] Aspart of our current investigation into the relationships betweenactinomycete diversity and secondary metabolite production,strain CNS-325 was isolated from a marine sediment samplecollected from Palau and identified as Salinispora arenicola by16S rRNA gene sequence analysis. Fractions of the crude extractdisplayed potent antiproliferative activity against HCT-116 coloncarcinoma cells in vitro. Herein, we describe the isolationand characterization of six new anthraquinone-γ-pyrones, salin-iquinones A–F (1–6) (Fig. 1). The isolation of new members ofthis potently cytotoxic skeletal class from S. arenicola expandsthe scope of secondary metabolite production observed from thisspecies.
Results
Saliniquinone A (1) was obtained as a yellow amorphoussolid. Positive-ion high-resolution electrospray ionization time-of-flight mass spectrometry (HRESI-TOF MS) analysis gavea pseudomolecular ion at m/z 405.0970, which suggested themolecular formula C23H16O7. The 13C and g-HSQC NMRspectra of 1 in CDCl3 showed three α,β-unsaturated ketonecarbonyls (δC 179.7 (C-4), 181.4 (C-7), 187.0 (C-12)), threesp2-oxygenated carbons (δC 168.9 (C-2), 162.8 (C-110), 156.6(C-12b)), and an additional 13 sp2 carbons to be present in 1(see Table 1). There was also evidence of three sp3-oxygenatedcarbons (δC 65.2 (C-13), 59.6 (C-14), 66.1 (C-16)) and one sp3
methyl carbon (δC 14.0 (C-15)). Select 1H NMR resonancesfrom 1 in CDCl3 exhibited the characteristic pattern of an aro-matic ABC spin system (δH 7.84 (dd, J 7.5, 1.5, H-8), 7.71 (t,J 7.5, H-9), 7.39 (dd, J 7.5, 1.5, H-10)). In addition, resonancesfor two aromatic methine hydrogens (δH 6.63 (s, H-3), 8.34 (s,H-6)), one terminal olefin (δH 5.91 (ddd, J 7.0, 11, 17, H-17),5.59 (d, J 11, Hα-18), 5.66 (d, J 17, Hβ-18)), an oxymethylene(δH 5.08 (d, J 6.0, H2-13)), an oxymethine (δH 3.88 (d, J 7.0,H-16)), and a methyl group (δH 1.87 (s, C-15)) were observed.
Analysis of combined g-COSY and g-HMBC NMR spec-tra allowed the assembly of rings A–D (Fig. 2). Ring A wasconstructed from interpretation of COSY correlations from H-8to H-9, and H-9 to H-10. HMBC correlations of a deshieldedperi-hydroxy proton (δH 12.73 (s, OH-11)) to C-10, C-11a, andC-12 (J4) allowed the hydroxy group to be placed at C-11 andalso linked ring A to the quinone ring B. The presence of an
© CSIRO 2010 10.1071/CH10068 0004-9425/10/060929
RESEARCH FRONT
930 B. T. Murphy et al.
O
O
OH O
R
O
OH
O O OHCl
1 2 3 4
O
O
OH O
R
OOH
5 6
OH
12
77a
11a
8
12a12b
23
4a5
6a13
1415
16
A CB
D
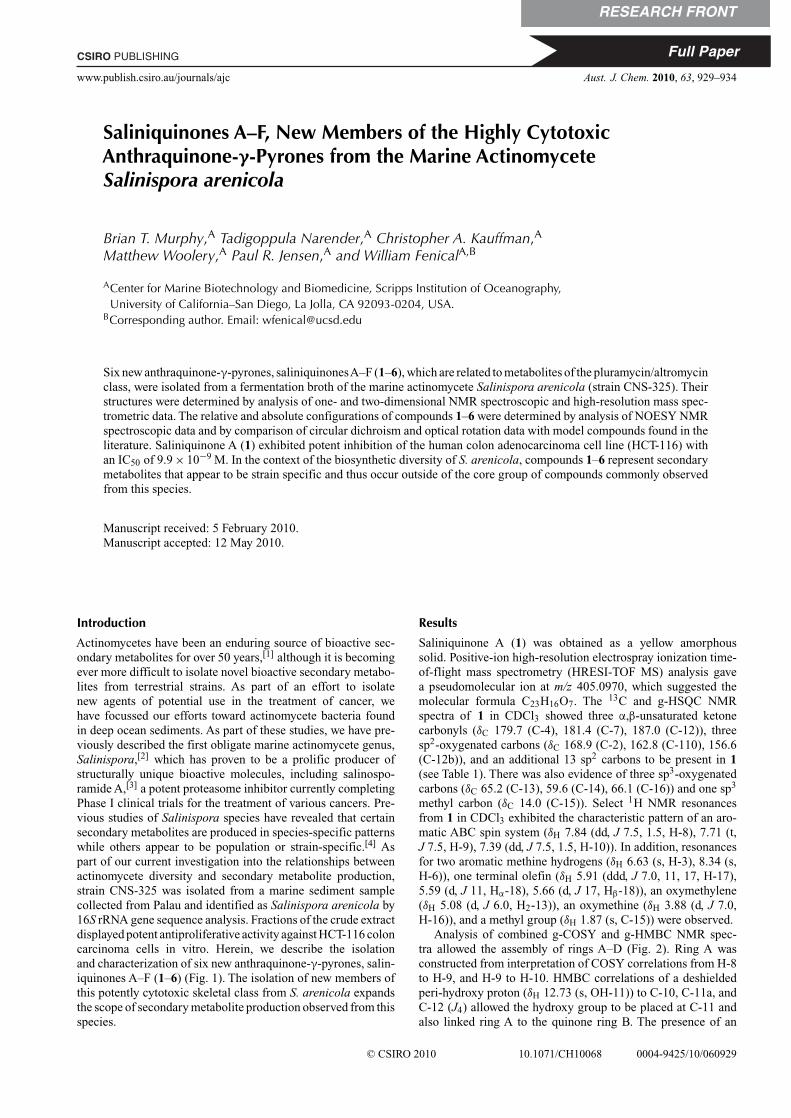
Fig. 1. Structures of saliniquinones A–F (1–6).
Table 1. 13C NMR spectroscopic data for saliniquinones A–F (1–6,in CDCl3)A
Position Compound δC
1 2 3 4 5 6
2 168.9 169.9 169.6 165.6 170.1 171.63 109.8 109.0 110.7 108.5 113.0 109.74 179.7 179.8 179.7 180.3 178.7 179.44a 126.6 126.6 126.3 126.4 126.5 126.35 150.2 150.0 150.2 149.6 150.3 150.46 124.0 124.0 124.0 123.5 126.0 126.06a 136.9 NRB NRB NRB 135.9 136.07 181.4 181.4 181.1 181.5 181.7 181.97a 132.3 132.1 132.0 132.1 132.3 132.18 119.9 119.8 119.8 119.5 119.6 119.59 137.3 136.9 137.1 136.6 136.8 136.610 125.8 125.7 125.6 125.6 125.5 125.411 162.8 162.8 162.8 162.7 162.6 162.611a 116.8 116.7 116.4 116.6 116.6 116.712 187.0 187.1 187.1 187.2 187.6 187.412a 121.6 121.5 121.0 121.4 119.5 119.612b 156.6 156.6 155.9 156.4 156.5 156.113 65.2 65.2 64.9 65.1 24.4 24.114 59.6 57.9 75.7 125.7 44.7 72.915 14.0 13.7 25.0 12.3 15.8 26.316 66.1 67.7 68.7 142.9 74.5 45.217 130.9 22.0 133.2 22.7 138.5 131.818 123.1 10.4 120.3 13.3 116.4 120.8
AChemical shifts (δ) in ppm.BResonances were not observed.
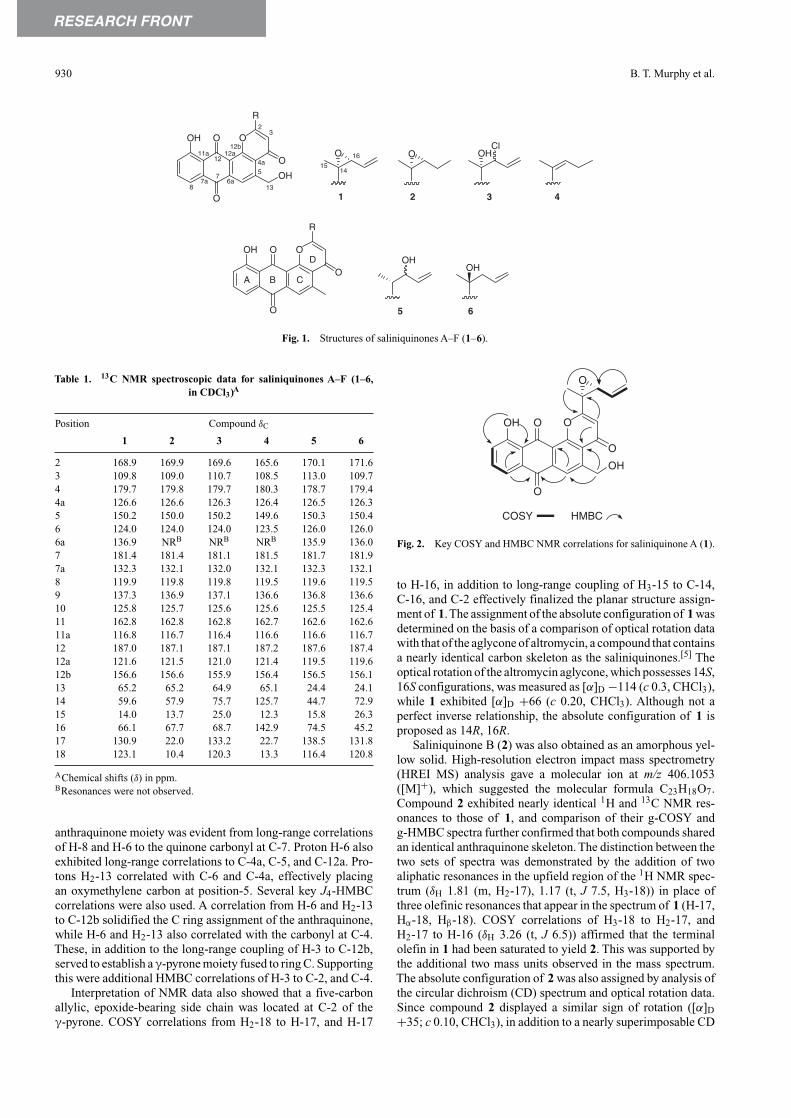
anthraquinone moiety was evident from long-range correlationsof H-8 and H-6 to the quinone carbonyl at C-7. Proton H-6 alsoexhibited long-range correlations to C-4a, C-5, and C-12a. Pro-tons H2-13 correlated with C-6 and C-4a, effectively placingan oxymethylene carbon at position-5. Several key J4-HMBCcorrelations were also used. A correlation from H-6 and H2-13to C-12b solidified the C ring assignment of the anthraquinone,while H-6 and H2-13 also correlated with the carbonyl at C-4.These, in addition to the long-range coupling of H-3 to C-12b,served to establish a γ-pyrone moiety fused to ring C. Supportingthis were additional HMBC correlations of H-3 to C-2, and C-4.
Interpretation of NMR data also showed that a five-carbonallylic, epoxide-bearing side chain was located at C-2 of theγ-pyrone. COSY correlations from H2-18 to H-17, and H-17
O
O
OH O
O
OH
O
COSY HMBC
Fig. 2. Key COSY and HMBC NMR correlations for saliniquinone A (1).
to H-16, in addition to long-range coupling of H3-15 to C-14,C-16, and C-2 effectively finalized the planar structure assign-ment of 1.The assignment of the absolute configuration of 1 wasdetermined on the basis of a comparison of optical rotation datawith that of the aglycone of altromycin, a compound that containsa nearly identical carbon skeleton as the saliniquinones.[5] Theoptical rotation of the altromycin aglycone, which possesses 14S,16S configurations, was measured as [α]D −114 (c 0.3, CHCl3),while 1 exhibited [α]D +66 (c 0.20, CHCl3). Although not aperfect inverse relationship, the absolute configuration of 1 isproposed as 14R, 16R.
Saliniquinone B (2) was also obtained as an amorphous yel-low solid. High-resolution electron impact mass spectrometry(HREI MS) analysis gave a molecular ion at m/z 406.1053([M]+), which suggested the molecular formula C23H18O7.Compound 2 exhibited nearly identical 1H and 13C NMR res-onances to those of 1, and comparison of their g-COSY andg-HMBC spectra further confirmed that both compounds sharedan identical anthraquinone skeleton. The distinction between thetwo sets of spectra was demonstrated by the addition of twoaliphatic resonances in the upfield region of the 1H NMR spec-trum (δH 1.81 (m, H2-17), 1.17 (t, J 7.5, H3-18)) in place ofthree olefinic resonances that appear in the spectrum of 1 (H-17,Hα-18, Hβ-18). COSY correlations of H3-18 to H2-17, andH2-17 to H-16 (δH 3.26 (t, J 6.5)) affirmed that the terminalolefin in 1 had been saturated to yield 2. This was supported bythe additional two mass units observed in the mass spectrum.The absolute configuration of 2 was also assigned by analysis ofthe circular dichroism (CD) spectrum and optical rotation data.Since compound 2 displayed a similar sign of rotation ([α]D+35; c 0.10, CHCl3), in addition to a nearly superimposable CD
RESEARCH FRONT
Saliniquinones A–F from S. arenicola 931
H
Cl
HO CH3
OD
H
3
Cl
H
HO CH3
OD
H
NOE
14S, 16R 14S, 16S
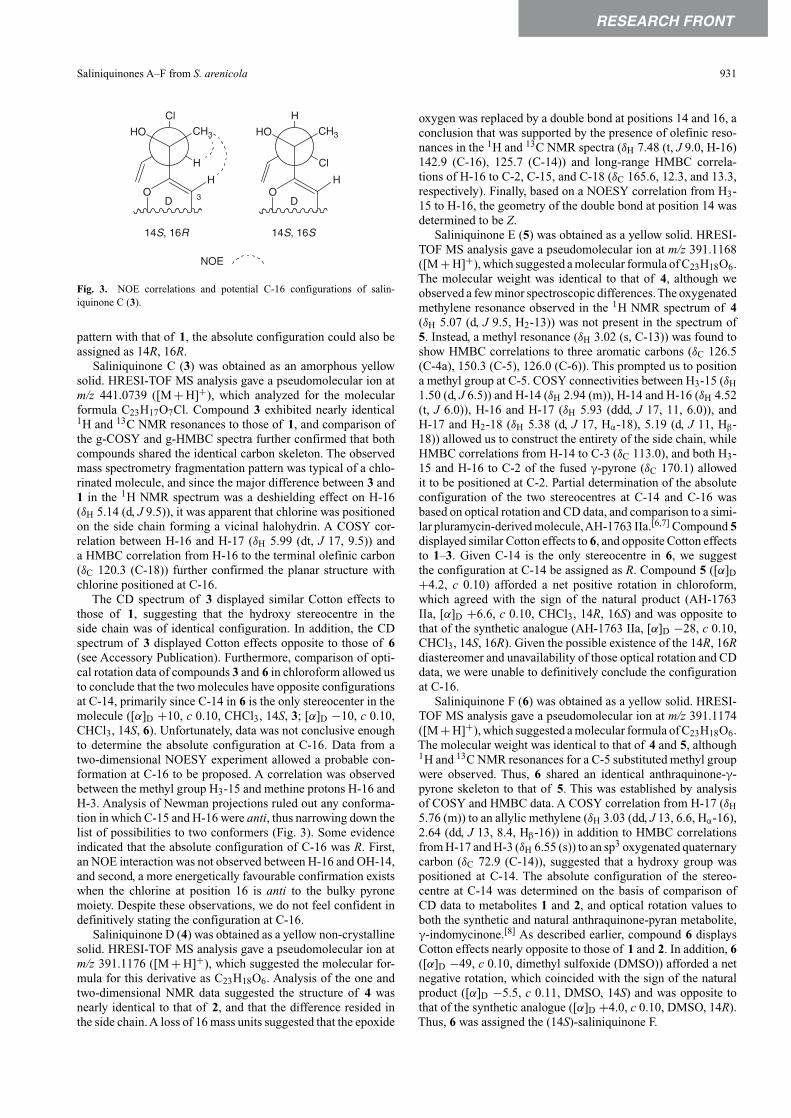
Fig. 3. NOE correlations and potential C-16 configurations of salin-iquinone C (3).
pattern with that of 1, the absolute configuration could also beassigned as 14R, 16R.
Saliniquinone C (3) was obtained as an amorphous yellowsolid. HRESI-TOF MS analysis gave a pseudomolecular ion atm/z 441.0739 ([M + H]+), which analyzed for the molecularformula C23H17O7Cl. Compound 3 exhibited nearly identical1H and 13C NMR resonances to those of 1, and comparison ofthe g-COSY and g-HMBC spectra further confirmed that bothcompounds shared the identical carbon skeleton. The observedmass spectrometry fragmentation pattern was typical of a chlo-rinated molecule, and since the major difference between 3 and1 in the 1H NMR spectrum was a deshielding effect on H-16(δH 5.14 (d, J 9.5)), it was apparent that chlorine was positionedon the side chain forming a vicinal halohydrin. A COSY cor-relation between H-16 and H-17 (δH 5.99 (dt, J 17, 9.5)) anda HMBC correlation from H-16 to the terminal olefinic carbon(δC 120.3 (C-18)) further confirmed the planar structure withchlorine positioned at C-16.
The CD spectrum of 3 displayed similar Cotton effects tothose of 1, suggesting that the hydroxy stereocentre in theside chain was of identical configuration. In addition, the CDspectrum of 3 displayed Cotton effects opposite to those of 6(see Accessory Publication). Furthermore, comparison of opti-cal rotation data of compounds 3 and 6 in chloroform allowed usto conclude that the two molecules have opposite configurationsat C-14, primarily since C-14 in 6 is the only stereocenter in themolecule ([α]D +10, c 0.10, CHCl3, 14S, 3; [α]D −10, c 0.10,CHCl3, 14S, 6). Unfortunately, data was not conclusive enoughto determine the absolute configuration at C-16. Data from atwo-dimensional NOESY experiment allowed a probable con-formation at C-16 to be proposed. A correlation was observedbetween the methyl group H3-15 and methine protons H-16 andH-3. Analysis of Newman projections ruled out any conforma-tion in which C-15 and H-16 were anti, thus narrowing down thelist of possibilities to two conformers (Fig. 3). Some evidenceindicated that the absolute configuration of C-16 was R. First,an NOE interaction was not observed between H-16 and OH-14,and second, a more energetically favourable confirmation existswhen the chlorine at position 16 is anti to the bulky pyronemoiety. Despite these observations, we do not feel confident indefinitively stating the configuration at C-16.
Saliniquinone D (4) was obtained as a yellow non-crystallinesolid. HRESI-TOF MS analysis gave a pseudomolecular ion atm/z 391.1176 ([M + H]+), which suggested the molecular for-mula for this derivative as C23H18O6. Analysis of the one andtwo-dimensional NMR data suggested the structure of 4 wasnearly identical to that of 2, and that the difference resided inthe side chain. A loss of 16 mass units suggested that the epoxide
oxygen was replaced by a double bond at positions 14 and 16, aconclusion that was supported by the presence of olefinic reso-nances in the 1H and 13C NMR spectra (δH 7.48 (t, J 9.0, H-16)142.9 (C-16), 125.7 (C-14)) and long-range HMBC correla-tions of H-16 to C-2, C-15, and C-18 (δC 165.6, 12.3, and 13.3,respectively). Finally, based on a NOESY correlation from H3-15 to H-16, the geometry of the double bond at position 14 wasdetermined to be Z.
Saliniquinone E (5) was obtained as a yellow solid. HRESI-TOF MS analysis gave a pseudomolecular ion at m/z 391.1168([M + H]+), which suggested a molecular formula of C23H18O6.The molecular weight was identical to that of 4, although weobserved a few minor spectroscopic differences.The oxygenatedmethylene resonance observed in the 1H NMR spectrum of 4(δH 5.07 (d, J 9.5, H2-13)) was not present in the spectrum of5. Instead, a methyl resonance (δH 3.02 (s, C-13)) was found toshow HMBC correlations to three aromatic carbons (δC 126.5(C-4a), 150.3 (C-5), 126.0 (C-6)). This prompted us to positiona methyl group at C-5. COSY connectivities between H3-15 (δH1.50 (d, J 6.5)) and H-14 (δH 2.94 (m)), H-14 and H-16 (δH 4.52(t, J 6.0)), H-16 and H-17 (δH 5.93 (ddd, J 17, 11, 6.0)), andH-17 and H2-18 (δH 5.38 (d, J 17, Hα-18), 5.19 (d, J 11, Hβ-18)) allowed us to construct the entirety of the side chain, whileHMBC correlations from H-14 to C-3 (δC 113.0), and both H3-15 and H-16 to C-2 of the fused γ-pyrone (δC 170.1) allowedit to be positioned at C-2. Partial determination of the absoluteconfiguration of the two stereocentres at C-14 and C-16 wasbased on optical rotation and CD data, and comparison to a simi-lar pluramycin-derived molecule,AH-1763 IIa.[6,7] Compound 5displayed similar Cotton effects to 6, and opposite Cotton effectsto 1–3. Given C-14 is the only stereocentre in 6, we suggestthe configuration at C-14 be assigned as R. Compound 5 ([α]D+4.2, c 0.10) afforded a net positive rotation in chloroform,which agreed with the sign of the natural product (AH-1763IIa, [α]D +6.6, c 0.10, CHCl3, 14R, 16S) and was opposite tothat of the synthetic analogue (AH-1763 IIa, [α]D −28, c 0.10,CHCl3, 14S, 16R). Given the possible existence of the 14R, 16Rdiastereomer and unavailability of those optical rotation and CDdata, we were unable to definitively conclude the configurationat C-16.
Saliniquinone F (6) was obtained as a yellow solid. HRESI-TOF MS analysis gave a pseudomolecular ion at m/z 391.1174([M + H]+), which suggested a molecular formula of C23H18O6.The molecular weight was identical to that of 4 and 5, although1H and 13C NMR resonances for a C-5 substituted methyl groupwere observed. Thus, 6 shared an identical anthraquinone-γ-pyrone skeleton to that of 5. This was established by analysisof COSY and HMBC data. A COSY correlation from H-17 (δH5.76 (m)) to an allylic methylene (δH 3.03 (dd, J 13, 6.6, Hα-16),2.64 (dd, J 13, 8.4, Hβ-16)) in addition to HMBC correlationsfrom H-17 and H-3 (δH 6.55 (s)) to an sp3 oxygenated quaternarycarbon (δC 72.9 (C-14)), suggested that a hydroxy group waspositioned at C-14. The absolute configuration of the stereo-centre at C-14 was determined on the basis of comparison ofCD data to metabolites 1 and 2, and optical rotation values toboth the synthetic and natural anthraquinone-pyran metabolite,γ-indomycinone.[8] As described earlier, compound 6 displaysCotton effects nearly opposite to those of 1 and 2. In addition, 6([α]D −49, c 0.10, dimethyl sulfoxide (DMSO)) afforded a netnegative rotation, which coincided with the sign of the naturalproduct ([α]D −5.5, c 0.11, DMSO, 14S) and was opposite tothat of the synthetic analogue ([α]D +4.0, c 0.10, DMSO, 14R).Thus, 6 was assigned the (14S)-saliniquinone F.
RESEARCH FRONT
932 B. T. Murphy et al.
Discussion
Saliniquinones A–F are members of the pluramycin class ofantitumor antibiotics, whose core structural feature consists ofan anthraquinone ring system fused with a γ-pyrone moiety.Most members of this structural class also contain C-glycosidicamino sugars at the 5-, 8-, and 10-positions. Commonly iso-lated from strains of Streptomyces, the antitumour properties ofpluramycins have been thoroughly studied; such bioactivity is theresult of their ability to alkylate N7 of the guanine base in DNAby intercalation.[9–15] Derivatives that contain an epoxide on theC-2 side chain displayed especially potent bioactivity, as thiswas shown to be the site of DNA alkylation. As expected, salin-iquinone A exhibited potent antiproliferative activity againstthe human colon adenocarcinoma cell line, HCT-116 (halfmaximum inhibitory concentration (IC50) = 9.9 × 10⁻⁹ M).
Pluramycin-class antibiotics have also been shown to inhibitthe growth of several Gram-positive bacteria and appear tobe largely ineffective against Gram-negative bacteria. Mini-mum inhibitory concentrations (MIC) of sapurimycin,[16] thealtromycins,[17] topopyrones A and C,[18] and antibiotic SF-2330[19] range from (0.10 to 8.0) × 10−6 M against variousstrains of Staphylococcus, Bacillus, Streptococcus, and otherGram-positive pathogens. Saliniquinone A was tested againstmethicillin-resistant S. aureus and exhibited a weak MIC of9.9 × 10−6 M.
Although the bioactivity of this structural class of metabo-lites has been examined, there have been few studies focussedon the biosynthetic assembly of various pluramycin-type skele-tons. In regard to the structures described in the current study,the closest structural relatives of the saliniquinones includethe indomycinones,[20] and the aglycones of kidamycin andhedamycin.[5,21,22] Hedamycin shares an identical core skeletonwith 5 and 6 but fashions a six carbon bis-epoxide side chainat C-2 and two C-glycosylated amino sugars at C-5 and C-8. Ina cloning experiment, Bililign et al. were the first to describethe biosynthetic gene cluster responsible for the production ofhedamycin in Streptomyces griseoruber.[23] In a rare collabora-tive assembly, the organism employs an iterative type I polyketidesynthase (PKS) to assemble the C-2 side chain, and thus ‘primes’the type II PKS with a starter unit. Subsequent chain elonga-tion and cyclization/aromatization results in the assembly of thehedamycin aglycone.
Although it has not been confirmed if S. arenicola strainCNS-325 produces saliniquinones A–F by a pathway similarto hedamycin biosynthesis, it is known that the closely relatedS. arenicola strain CNS-205, for which a complete genomesequence is available, does not possess the genetic machineryrequired to produce this class of secondary metabolites.[24] Thisobservation further emphasizes the metabolic diversity that canexist between strains of the same species, even when isolatedfrom the same location (in this case both strains originatedfrom Palau), despite evidence that some metabolites appear tobe common to all strains.[4] In terms of structural novelty, thesaliniquinones represent the first members of the pluramycinclass of antibiotics to contain both a terminal olefin and fivecarbons in the C-2 side chain; this is a deviation from all otherknown analogues that contain the prototypic four and six car-bon units. If the architecture of the CNS-325 biosynthetic genecluster that is responsible for production of the saliniquinonesis similar to the one previously discussed, this may indicatethat one malonyl CoA and one propionyl CoA unit combineto form a five-carbon side chain, as opposed to three malonyl
CoA units that compose the six-membered priming side chainfound in hedamycin. Regardless of their biosynthetic origin, thesaliniquinones represent yet another example of the metabolicdiversity of the genus Salinispora.
ExperimentalGeneral Experimental ProceduresOptical rotations were measured on a JASCO P-2000 polarime-ter. UV spectra were measured on a Beckman Coulter DU800spectrophotometer. CD spectra were recorded on anAVIV model215 spectrometer. IR spectra were recorded on a Perkin–Elmer1600 FTIR spectrometer. NMR spectra were obtained on VarianInova 500 and 300 MHz spectrometers, and a Bruker 600 MHzDRX-600 equipped with a 1.7 mm cryoprobe andAvance III con-sole. Chemical shifts (δ) are given in ppm, and coupling constants(J) are reported in Hz. For 13C and 1H NMR characterization dataof compounds 1–6, see Tables 1 and 2. High-resolution massspectra were obtained on an Agilent ESI-TOF at the ScrippsCenter for Mass Spectrometry. Low-resolution liquid chro-matography mass spectrometry (LC/MS) data were acquiredusing a Hewlett–Packard series 1100 system equipped with areversed-phase C18 column (Phenomenex Luna, 4.6 × 100 mm2,5 μm) at a flow rate of 0.7 mL min−1. High-performance liquidchromatography (HPLC) separations were performed using aWaters 600E system controller and pumps with a Model 480spectrophotometer. Separation was achieved using PhenomenexLuna semi-preparative C18 (250 × 10 mm2, 5 μm) and VarianDynamax preparative silica (250 × 21.4 mm2, 8 μm) columnsat flow rates of 2.0 and 10 mL min−1, respectively.
Antiproliferative BioassayAliquot samples of HCT-116 human colon adenocarci-
noma cells were transferred to 96-well plates and incubatedovernight at 37◦C in 5% CO2/air. Test compounds wereadded to the plates in DMSO and serially diluted. The plateswere then further incubated for another 72 h and at theend of this period a CellTiter 96 Aqueous non-radioactivecell proliferation assay (Promega) was used to assess cellviability. IC50 values were deduced from the bioreductionof (3-(4,5-dimethylthiazol-2-yl)-5-(3-carboxymethoxyphenyl)-2-(4-sulfophenyl)-2H -tetrazolium/phenazine methosulfate)(MTS/PMS) by living cells into a formazan product. MTS/PMSwas first applied to the sample wells, followed by incubation for3 h. Etoposide (Sigma; IC50 = (1.5–4.9) × 10−6 M) and DMSO(solvent) were used as the positive and negative controls in thisassay. The quantity of the formazan product (in proportion tothe number of living cells) in each well was determined by theMolecular Devices Emax microplate reader set to 490 nm wave-length. IC50 values were calculated using the analysis program,SOFTMax.
Bacterial Isolation and IdentificationStrain CNS-325 was isolated from a sediment sample col-
lected in Palau at a depth of ∼30 m in 2004 using previouslydescribed methods.[25] The identification of this strain wasaccomplished by 16S rRNA gene sequence analysis. The partial16S rRNA gene sequence (843 base pairs) has been depositedin GenBank under accession number GU593973.
Fermentation and ExtractionStrain CNS-325 was cultured in 52 × 1 L Fernbach flasks
that contained A1BFe+C medium for 7 days at 25–27◦C while
RESEARCH FRONT
Saliniquinones A–F from S. arenicola 933
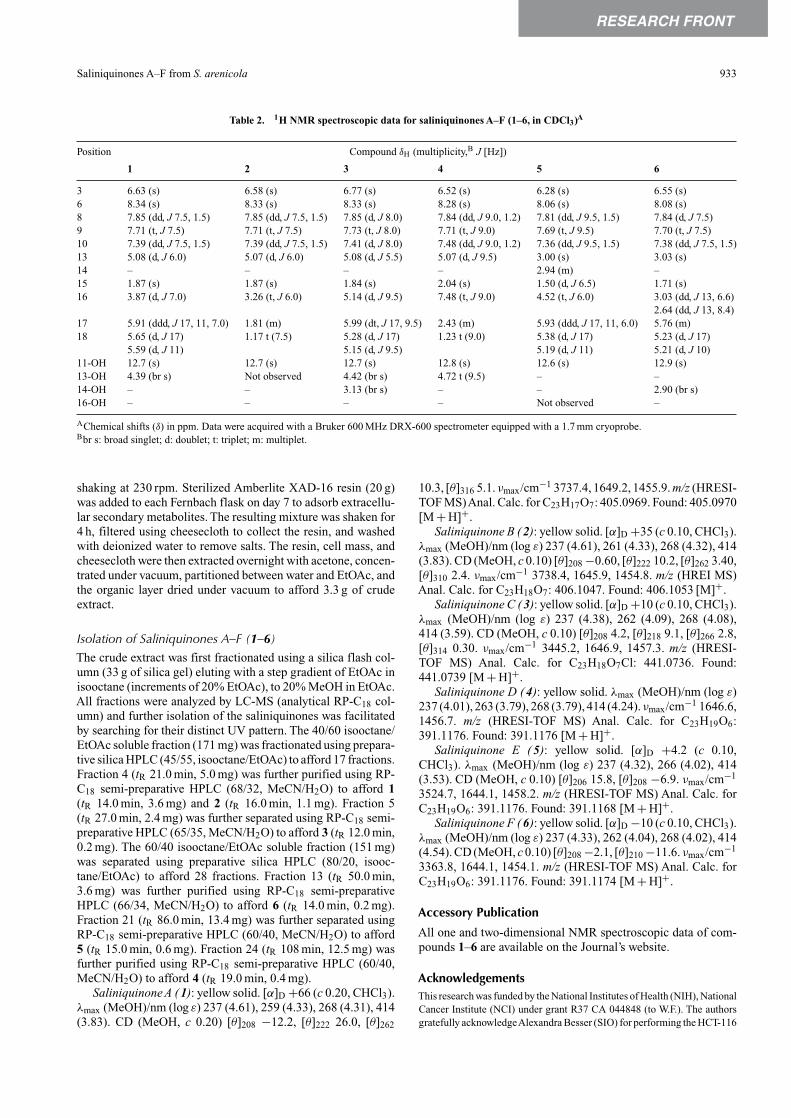
Table 2. 1H NMR spectroscopic data for saliniquinones A–F (1–6, in CDCl3)A
Position Compound δH (multiplicity,B J [Hz])
1 2 3 4 5 6
3 6.63 (s) 6.58 (s) 6.77 (s) 6.52 (s) 6.28 (s) 6.55 (s)6 8.34 (s) 8.33 (s) 8.33 (s) 8.28 (s) 8.06 (s) 8.08 (s)8 7.85 (dd, J 7.5, 1.5) 7.85 (dd, J 7.5, 1.5) 7.85 (d, J 8.0) 7.84 (dd, J 9.0, 1.2) 7.81 (dd, J 9.5, 1.5) 7.84 (d, J 7.5)9 7.71 (t, J 7.5) 7.71 (t, J 7.5) 7.73 (t, J 8.0) 7.71 (t, J 9.0) 7.69 (t, J 9.5) 7.70 (t, J 7.5)10 7.39 (dd, J 7.5, 1.5) 7.39 (dd, J 7.5, 1.5) 7.41 (d, J 8.0) 7.48 (dd, J 9.0, 1.2) 7.36 (dd, J 9.5, 1.5) 7.38 (dd, J 7.5, 1.5)13 5.08 (d, J 6.0) 5.07 (d, J 6.0) 5.08 (d, J 5.5) 5.07 (d, J 9.5) 3.00 (s) 3.03 (s)14 – – – – 2.94 (m) –15 1.87 (s) 1.87 (s) 1.84 (s) 2.04 (s) 1.50 (d, J 6.5) 1.71 (s)16 3.87 (d, J 7.0) 3.26 (t, J 6.0) 5.14 (d, J 9.5) 7.48 (t, J 9.0) 4.52 (t, J 6.0) 3.03 (dd, J 13, 6.6)
2.64 (dd, J 13, 8.4)17 5.91 (ddd, J 17, 11, 7.0) 1.81 (m) 5.99 (dt, J 17, 9.5) 2.43 (m) 5.93 (ddd, J 17, 11, 6.0) 5.76 (m)18 5.65 (d, J 17) 1.17 t (7.5) 5.28 (d, J 17) 1.23 t (9.0) 5.38 (d, J 17) 5.23 (d, J 17)
5.59 (d, J 11) 5.15 (d, J 9.5) 5.19 (d, J 11) 5.21 (d, J 10)11-OH 12.7 (s) 12.7 (s) 12.7 (s) 12.8 (s) 12.6 (s) 12.9 (s)13-OH 4.39 (br s) Not observed 4.42 (br s) 4.72 t (9.5) – –14-OH – – 3.13 (br s) – – 2.90 (br s)16-OH – – – – Not observed –
AChemical shifts (δ) in ppm. Data were acquired with a Bruker 600 MHz DRX-600 spectrometer equipped with a 1.7 mm cryoprobe.Bbr s: broad singlet; d: doublet; t: triplet; m: multiplet.
shaking at 230 rpm. Sterilized Amberlite XAD-16 resin (20 g)was added to each Fernbach flask on day 7 to adsorb extracellu-lar secondary metabolites. The resulting mixture was shaken for4 h, filtered using cheesecloth to collect the resin, and washedwith deionized water to remove salts. The resin, cell mass, andcheesecloth were then extracted overnight with acetone, concen-trated under vacuum, partitioned between water and EtOAc, andthe organic layer dried under vacuum to afford 3.3 g of crudeextract.
Isolation of Saliniquinones A–F (1–6)The crude extract was first fractionated using a silica flash col-umn (33 g of silica gel) eluting with a step gradient of EtOAc inisooctane (increments of 20% EtOAc), to 20% MeOH in EtOAc.All fractions were analyzed by LC-MS (analytical RP-C18 col-umn) and further isolation of the saliniquinones was facilitatedby searching for their distinct UV pattern. The 40/60 isooctane/EtOAc soluble fraction (171 mg) was fractionated using prepara-tive silica HPLC (45/55, isooctane/EtOAc) to afford 17 fractions.Fraction 4 (tR 21.0 min, 5.0 mg) was further purified using RP-C18 semi-preparative HPLC (68/32, MeCN/H2O) to afford 1(tR 14.0 min, 3.6 mg) and 2 (tR 16.0 min, 1.1 mg). Fraction 5(tR 27.0 min, 2.4 mg) was further separated using RP-C18 semi-preparative HPLC (65/35, MeCN/H2O) to afford 3 (tR 12.0 min,0.2 mg). The 60/40 isooctane/EtOAc soluble fraction (151 mg)was separated using preparative silica HPLC (80/20, isooc-tane/EtOAc) to afford 28 fractions. Fraction 13 (tR 50.0 min,3.6 mg) was further purified using RP-C18 semi-preparativeHPLC (66/34, MeCN/H2O) to afford 6 (tR 14.0 min, 0.2 mg).Fraction 21 (tR 86.0 min, 13.4 mg) was further separated usingRP-C18 semi-preparative HPLC (60/40, MeCN/H2O) to afford5 (tR 15.0 min, 0.6 mg). Fraction 24 (tR 108 min, 12.5 mg) wasfurther purified using RP-C18 semi-preparative HPLC (60/40,MeCN/H2O) to afford 4 (tR 19.0 min, 0.4 mg).
Saliniquinone A ( 1): yellow solid. [α]D +66 (c 0.20, CHCl3).λmax (MeOH)/nm (log ε) 237 (4.61), 259 (4.33), 268 (4.31), 414(3.83). CD (MeOH, c 0.20) [θ]208 −12.2, [θ]222 26.0, [θ]262
10.3, [θ]316 5.1. νmax/cm−1 3737.4, 1649.2, 1455.9. m/z (HRESI-TOF MS)Anal. Calc. for C23H17O7: 405.0969. Found: 405.0970[M + H]+.
Saliniquinone B ( 2): yellow solid. [α]D +35 (c 0.10, CHCl3).λmax (MeOH)/nm (log ε) 237 (4.61), 261 (4.33), 268 (4.32), 414(3.83). CD (MeOH, c 0.10) [θ]208 −0.60, [θ]222 10.2, [θ]262 3.40,[θ]310 2.4. νmax/cm−1 3738.4, 1645.9, 1454.8. m/z (HREI MS)Anal. Calc. for C23H18O7: 406.1047. Found: 406.1053 [M]+.
Saliniquinone C ( 3): yellow solid. [α]D +10 (c 0.10, CHCl3).λmax (MeOH)/nm (log ε) 237 (4.38), 262 (4.09), 268 (4.08),414 (3.59). CD (MeOH, c 0.10) [θ]208 4.2, [θ]218 9.1, [θ]266 2.8,[θ]314 0.30. νmax/cm−1 3445.2, 1646.9, 1457.3. m/z (HRESI-TOF MS) Anal. Calc. for C23H18O7Cl: 441.0736. Found:441.0739 [M + H]+.
Saliniquinone D ( 4): yellow solid. λmax (MeOH)/nm (log ε)237 (4.01), 263 (3.79), 268 (3.79), 414 (4.24). νmax/cm−1 1646.6,1456.7. m/z (HRESI-TOF MS) Anal. Calc. for C23H19O6:391.1176. Found: 391.1176 [M + H]+.
Saliniquinone E ( 5): yellow solid. [α]D +4.2 (c 0.10,CHCl3). λmax (MeOH)/nm (log ε) 237 (4.32), 266 (4.02), 414(3.53). CD (MeOH, c 0.10) [θ]206 15.8, [θ]208 −6.9. νmax/cm−1
3524.7, 1644.1, 1458.2. m/z (HRESI-TOF MS) Anal. Calc. forC23H19O6: 391.1176. Found: 391.1168 [M + H]+.
Saliniquinone F ( 6): yellow solid. [α]D −10 (c 0.10, CHCl3).λmax (MeOH)/nm (log ε) 237 (4.33), 262 (4.04), 268 (4.02), 414(4.54). CD (MeOH, c 0.10) [θ]208 −2.1, [θ]210 −11.6. νmax/cm−1
3363.8, 1644.1, 1454.1. m/z (HRESI-TOF MS) Anal. Calc. forC23H19O6: 391.1176. Found: 391.1174 [M + H]+.
Accessory Publication
All one and two-dimensional NMR spectroscopic data of com-pounds 1–6 are available on the Journal’s website.
AcknowledgementsThis research was funded by the National Institutes of Health (NIH), NationalCancer Institute (NCI) under grant R37 CA 044848 (to W.F.). The authorsgratefully acknowledgeAlexandra Besser (SIO) for performing the HCT-116
RESEARCH FRONT
934 B. T. Murphy et al.
bioassay and Ariane Jansma (UCSD) for assistance obtaining NMR spec-tra. T. Narender acknowledges the Department of Science and Technology(DST), New Delhi, India for the award of BOYSCAST fellowship to visitthe University of California San Diego.
References[1] D. J. Newman, G. M. Cragg, J. Nat. Prod. 2007, 70, 461. doi:10.1021/
NP068054V[2] L. A. Maldonado, W. Fenical, P. R. Jensen, C. A. Kauffman, T. J.
Mincer, A. C. Ward, A. T. Bull, M. Goodfellow, Int. J. Syst. Evol.Microbiol. 2005, 55, 1759. doi:10.1099/IJS.0.63625-0
[3] R. H. Feling, G. O. Buchanan, T. J. Mincer, C. A. Kauffman,P. R. Jensen, W. Fenical, Angew. Chem. Int. Ed. 2003, 42, 355.doi:10.1002/ANIE.200390115
[4] P. R. Jensen, P. G. Williams, D. C. Oh, L. Zeigler, W. Fenical, Appl.Environ. Microbiol. 2007, 73, 1146. doi:10.1128/AEM.01891-06
[5] Z. Fei, F. E. McDonald, Org. Lett. 2005, 7, 3617. doi:10.1021/OL0509742
[6] M. Uyeda, K. Yokomizo, A. Ito, K. Nakayama, H. Watanabe, Y. Kido,J. Antibiot. 1997, 50, 828.
[7] L. F. Tietze, K. M. Gericke, R. R. Singidi,Angew. Chem. Int. Ed. 2006,45, 6990. doi:10.1002/ANIE.200601992
[8] L. F. Tietze, R. R. Singidi, K. M. Gericke, Org. Lett. 2006, 8, 5873.doi:10.1021/OL062492B
[9] M. Hansen, S. Yun, L. Hurley, Chem. Biol. 1995, 2, 229.[10] D. Sun, M. Hansen, J. J. Clement, L. H. Hurley, Biochemistry 1993,
32, 8068. doi:10.1021/BI00083A003[11] J. H. Yoon, C. S. Lee, Mol. Cells 2000, 10, 71. doi:10.1007/S10059-
000-0071-Z
[12] M. R. Hansen, L. H. Hurley, Acc. Chem. Res. 1996, 29, 249.doi:10.1021/AR950167A
[13] M. R. Hansen, L. Hurley, J. Am. Chem. Soc. 1995, 117, 2421.doi:10.1021/JA00114A006
[14] K. Nakatani, A. Okamoto, T. Matsuono, I. Saito, J. Am. Chem. Soc.1998, 120, 11219. doi:10.1021/JA980801Q
[15] G. N. Bennett, Nucleic Acids Res. 1982, 10, 4581. doi:10.1093/NAR/10.15.4581
[16] M. Hara, T. Takiguchi, T. Ashizawa, K. Gomi, H. Nakano, J. Antibiot.1991, 44, 33.
[17] M. Jackson, J. P. Karwowski, R. J.Theriault, D. J. Hardy, S. J. Swanson,G. J. Barlow, P. M. Tillis, J. B. McAlpine, J. Antibiot. 1990, 43, 223.
[18] Y. Kanai, D. Ishiyama, H. Senda, W. Iwatani, H. Takahashi, H. Konno,S. Tokumasu, S. Kanazawa, J. Antibiot. 2000, 53, 863.
[19] J. Itoh, T. Shomura, T. Tsuyuki, J. Yoshida, M. Ito, M. Sezaki,M. Kojima, J. Antibiot. 1986, 39, 773.
[20] R. W. Schumacher, B. S. Davidson, D. A. Montenegro, V. S. Bernan,J. Nat. Prod. 1995, 58, 613. doi:10.1021/NP50118A024
[21] N. Kanda, J. Antibiot. 1971, 24, 599.[22] H. Schmitz, K. E. Crook, Jr, J.A. Bush,Antimicrob.Agents Chemother.
1966, 6, 606.[23] T. Bililign, C. G. Hyun, J. S. Williams, A. M. Czisny, J. S. Thorson,
Chem. Biol. 2004, 11, 959. doi:10.1016/J.CHEMBIOL.2004.04.016[24] K. Penn, C. Jenkins, M. Nett, D. W. Udwary, E. A. Gontang,
R. P. McGlinchey, B. Foster, A. Lapidus, S. Podell, E. E. Allen,B. S. Moore, P. R. Jensen, ISME J. 2009, 3, 1193. doi:10.1038/ISMEJ.2009.58
[25] E. A. Gontang, W. Fenical, P. R. Jensen, Appl. Environ. Microbiol.2007, 73, 3272. doi:10.1128/AEM.02811-06