Role of TNF-α receptor 2 (TNFR2) in the regulation of ... · Directores de la Tesis Doctoral ......
203
FACULTAD DE CIENCIAS BIOLÓGICAS Departament de Bioquímica y Biologia Molecular Doctorado en Biotecnología Role of TNF-α receptor 2 (TNFR2) in the regulation of adult neural stem cells Germán Belenguer Sánchez Directores de la Tesis Doctoral Isabel Fariñas Gómez Jose Manuel Morante Redolat Valencia, mayo de 2017
Transcript of Role of TNF-α receptor 2 (TNFR2) in the regulation of ... · Directores de la Tesis Doctoral ......
FACULTAD DE CIENCIAS BIOLÓGICAS
Departament de Bioquímica y Biologia Molecular
Doctorado en Biotecnología
Role of TNF-α receptor 2 (TNFR2) in the
regulation of adult neural stem cells
Germán Belenguer Sánchez
Directores de la Tesis Doctoral
Isabel Fariñas Gómez
Jose Manuel Morante Redolat
Valencia, mayo de 2017

Dña. Isabel Fariñas Gómez, Profesora Catedrática del Departamento de Biología
Celular, Biología Funcional y Antropología Física, de la Facultad de Ciencias
Biológicas de la Universidad de Valencia y, D. Jose Manuel Morante Redolat, Profesor
Ayudante Doctor del Departamento de Biología Celular, Biología Funcional y
Antropología Física, de la Facultad de Ciencias Biológicas de la Universidad de
Valencia
INFORMAN QUE:
D. Germán Belenguer Sánchez, licenciado en Biología y Bioquímica por la
Universidad de Valencia, ha realizado bajo su dirección el trabajo titulado "Role of
TNF-α receptor 2 (TNFR2) in the regulation of adult neural stem cells", y que
hallándose concluida, autorizan su presentación, a fin de que pueda ser juzgado por el
Tribunal correspondiente para la obtención del grado de Doctor por la Universitat de
València.
Y para que conste, en cumplimiento de la legislación, firman el presente informe en
Burjassot, a 31 de mayo del 2017.
Dra. Isabel Fariñas Gómez Dr. Jose Manuel Morante Redolat

Este trabajo de Tesis Doctoral ha sido posible gracias a una beca predoctoral del
Programa de Formación de Profesorado Universitario (FPU), financiada por el
Ministerio de Educación, Cultura y Deporte, un contrato predoctoral financiado por la
RETIC de Terapia Celular del ISCIII y un contrato como investigador no doctor
financiado por la red “CIBER en Enfermedades Neurodegenerativas” CIBERNED. La
investigación ha sido financiada por los siguientes proyectos de investigación:
‐ “Dinámica celular y auto-renovación en poblaciones de células madre del
cerebro adulto”. Plan Nacional de I+D+I MINECO, Ministerio de Economía y
Competitividad, SAF2011-13332. (2012 - 2014).
‐ “Estudio de células madre en el ámbito de las investigaciones básicas en
terapia celular”, Fundación Botín-Banco Santander. (2014 – 2018).
‐ “CIBER en Enfermedades Neurodegenerativas” (CIBERNED),
ISCIII,CB06/05/0086. (2006 - actualidad).


A mis padres,
Miguel Angel y Obdulia
A mi hermano,
Migue
A ti, mi amor,
Jenni

Me gustaría dedicar esta página a todas las personas que con su granito de arena
(o la playa entera…) me han ayudado a alcanzar la meta de un maratón que ha
durado 6 años.
En primer lugar me siento agradecido contigo, Isabel, por la oportunidad que me
concediste en su día, por confiar en mí y por todo lo que ha supuesto realizar una tesis
a tu lado. No solo me has puesto la caña en las manos sino que me has enseñado a
pescar. Sinceramente, creo que no encontraría un lugar mejor donde formarme
personal y profesionalmente. Formar parte de tu equipo es un orgullo por el que
siempre estaré agradecido.
Y por supuesto a Jose Manuel. Sabes que no hay suficientes páginas para poder
expresar mi agradecimiento a todo lo que has hecho por mí, tanto dentro como fuera
del laboratorio, sujetándome en todo momento, impidiendo que me caiga.
Simplemente, ¡gracias! Solo espero que sientas este trabajo tan tuyo como mío. Y a
Eva. Espero que ambos podáis sentiros orgullosos de vuestro pequeño padawan.
Ambos pusisteis las primeras piedras, me disteis todas las herramientas necesarias y
me habéis llevado hasta la meta.
Y a mis neuromoles. A todos los compañeros, con los que he compartido alegrías
y fracasos, lloros y risas, buenos y malos momentos que quedan grabados también en
esta tesis. Y en especial a mi CFN, ¡el motor del lab! Gracias por vuestro apoyo, estando
cerca o lejos, os he sentido a mi lado empujando. Y también a nuestros magníficos
tecnomoles, que nos allanan cada día el camino, vuestra labor ha sido esencial.
También quiero agradecer al Dr. Luís Parada y a todos los miembros de su
laboratorio por abrirme las puertas de su casa en el UTSW Medical Center de Dallas
dándome la oportunidad de conocer la ciencia en otros lugares y seguir formándome.
Agradezco también el trabajo de los profesionales de la secretaría del
departamento de Biología Celular, Funcional y Antropología Física y de los distintos
servicios del SCSIE, en especial al servicio de cultivos celulares y citometría, al servicio
de microscopía y a los técnicos del animalario del campus de Burjassot que con su
labor han permitido completar este trabajo.
Gracias también a vosotros, mi grupo, mis “monitores” y mis “torres del mar”,
mis amigos que me habéis ayudado, me habéis animado y habéis estado a mi lado
desde el principio. Habéis sido ese oasis necesario para reponer fuerzas y no
desfallecer.
A mis padres, Miguel Ángel y Obdulia, y a mi hermano Migue y a Giusy, a los que
os dedico esta tesis. Vosotros me habéis dado la base, habéis puesto los cimientos y
me habéis convertido en la persona que soy. Gracias por vuestro apoyo incondicional,
sabéis que sois mi pilar fundamental. Solo espero que os sintáis la mitad de orgullosos
de lo que yo estoy de vosotros. Y a todos los miembros de mi familia, de Gandía y de
Alcoy, porque sé que han estado a mi lado durante todo este tiempo. Y así lo he
sentido.
Quiero terminar mis agradecimientos contigo, Jenni, con mi columna vertebral,
mi guía, mi animadora, mi compañera de vida, mi amor. Gracias por todo. Gracias por
tu apoyo incondicional, por tus consejos, por tu paciencia. Gracias por creer y confiar
en mí. Sabes que este trabajo es tan tuyo como mío.
Simplemente, ¡gracias!
Index
I
Index
Introduction 1
1. Adult stem cells (SCs): functional units of homeostasis and tissue repair 3
1.1. Tissue-specific SCs 3
1.2. Dynamics and heterogeneity of adult SCs in homeostasis 4
1.3. Quiescence in adult SC populations: a novel level of regulation during
homeostasis and injury 7
1.4. Adult SC niches 10
2. Subependymal neural stem cells (NSCs) and adult neurogenesis 13
2.1. Adult subependymal NSCs have an embryonic origin 13
2.2. The SEZ neurogenic niche: neurogenesis and gliogenesis 15
2.3. The subependymal NSC lineage 17
2.4. Subependymal NSC in vitro culture: the neurosphere assay 24
3. The regulation of adult subependymal NSCs 27
3.1. Intrinsic regulators of adult subependymal NSCs 27
3.2. Niche-dependent regulation of adult subependymal NSCs 29
4. Regulation of adult NSCs by the innate immune system 33
4.1. The role of inflammation in regeneration 33
4.2. Microglia, neuroinflammation and neurogenesis 34
4.3. Tumour necrosis factor alpha (TNF-α) and progranulin (PGRN):
characteristics and signalling 37
Objectives 45
Material and methods 49
1. Experimental animals 51
Index
II
1.1. Mice handling 51
1.2. Mice strains 51
1.3. Genotyping 52
2. In vivo methods 53
2.1. Drug administration 53
2.2. In vivo labelling of proliferating SEZ cells by thymidine analogues
administration 53
2.3. Perfusion and histology 54
2.4. Immunohistochemistry (IHC) 54
2.5. SEZ cell counting 55
2.6. SEZ dissection 55
2.7. SEZ wholemount preparations and analysis of migrating neuroblasts 57
2.8. SEZ dissociation, flow cytometry analysis and MACS® separation 57
3. In vitro cell culture methods 60
3.1. Cell culture media 60
3.1.1. NSCs 60
3.1.2. N13 cell line 61
3.2. Reagents and drugs 62
3.3. Establishment of primary NSC culture and estimation of the number of SEZ
neurosphere-forming cells 62
3.4. Subculture and bulk expansion of established NSC cultures 64
3.5. The neurosphere formation assay (NSA) 64
3.6. Activated microglia conditioned medium and immunodepletion of TNF-α 65
3.7. Cell viability assessment by MTS assay 66
3.8. Cell cycle analysis 67
3.9. Immunocytochemistry 67
3.10. Cell-pair assay for mode of division assessment 68
3.11. Evaluation of multipotency of NSC cultures 68
Index
III
3.12. Evaluation of cell proliferation dynamics by dilution of fluorescent tracers
69
3.13. Transduction of NSC by Nucleofection® 69
3.14. Mitochondrial activity staining 70
4. Molecular methods 70
4.1. RNA extraction, retro-transcription and real-time PCR 70
4.2. Protein extraction, electrophoretic separation, transference and
immunodetection by Western Blot 72
4.3. Luciferase activity detection 73
4.4. Multiplex analysis of the phophorilated state of cell signalling mediators 73
5. Statistical analysis 74
6. Annex 1 75
Results 79
1. Characterization of the quiescent cell cycle in adult subependymal NSCs 79
1.1. Prospective identification of subependymal NSCs and their progeny 79
1.2. qNSC2 or alerted NSCs represent an intermediate state between dormancy
and activation 87
2. The effects of inflammation in the quiescent cell cycle of adult subependymal
NSCs 92
2.1. LPS-induced systemic inflammation disrupts SEZ homeostasis and modulates
NSC activity 92
2.2. A mild peripheral lesion drives quiescent NSCs into an alert state 96
2.3. Common patterns of cytokine expression in the SEZ following peripheral
intervention injections 97
3. Dual effects of TNF-α in adult subependymal NSCs 99
3.1. Mixed dose-dependent effects of TNF-α 99
3.2. TNF-α induces self-renewal of NSCs 104
Index
IV
3.3. Differential effects TNF-α signalling are mediated by distinct receptors 106
3.4. TNFR2 signalling is mediated by the p38 MAP kinase 110
4. Effects of TNF-α in adult subependymal quiescent NSCs 113
4.1. In vitro properties of qNSCs 113
4.2. Direct actions of TNF-α in the alert state 120
Discussion 123
Conclusions 143
Bibliography 147
Resumen 173
V
Abbreviation list
ADAMTS-7 disintegrin and metalloproteinase with thrombospondin type 1 motif 7
aNSC active NSC
Ara-C β-D-arabinofuranoside
ASCL1 achaete-scoute homologue 1
BBB blood-brain barrier
BLBP brain lipid-binding protein
BMP bone morphogenetic protein
BSA bovine serum albumin
CC corpus callosum
CDK cyclin-dependent kinases
ChP choroid plexus
cIAP cellular inhibitors of apoptosis
CldU 5-Chloro-2’-deoxyuridine
CNS central nervous system
CSC cancer stem cell
CSF cerebrospinal fluid
DAPI 4’,6-diamidine-2’-phenylindole dihydrochloride
DCX doublecourtin
DDAO Cell Trace Far Red DDAO-SE
DFFDA Cell trace Oregon Green 488 Carboxy-DFFDA-SE
DKO TNFR1 and TNFR2 double knock-out
DLK1 delta-like homologue 1
DMEM Dulbeccos modified eagle medium
DNMT3A DNA methyl transferase 3A
DRC DDAO retaining cell
EBSS Earle´s Balanced Salt Solution
ECM extracellular matrix
EDTA Ethylenediaminetetraacetic acid
EGF epidermal growth factor
EGFR epidermal growth factor receptor
EPO erythropoietin
ESC embryonic stem cell
FACS fluorescence activated cell sorting
FADD Fas-associated death domain
FBS foetal bovine serum
FGF fibroblast growth factor
FSC forward scatter
FTLD-TDP frontotemporal lobar degeneration with ubiquitinated TDP-43-positive
GABA gamma-aminobutyric acid
GCL granule cell layer
GFAP glial fibrillary acidic protein
GL glomerular layer
GLAST glutamate aspartate transporter
GRN granulin
GSC germ stem cell
HB heparin binding
HBSS Hanks balanced salt solution
HGF hepatocyte growth factor
HIF1-α hypoxia inducible factor-1 alpha
HSC hematopoietic stem cell
i.p. intraperitoneal
ICM inner cell mass
IdU 5-Iodo-2’-deoxyuridine
IFN interferon
IGF-2 insulin growth factor 2
IkB inhibitor kB
IKK IkB kinase complex
IL interleukin
kDa kilo daltons
LIF leukaemia inhibiting factor
LPS lipopolysaccharide
LRC label-retaining cells
MACS magnetic activated cell sorting
MCM microglia conditioned media
MMP matrix metalloproteinase
mTOR mechanistic target of rapamycin
MuSC muscle stem cell
Index
VI
NFκB nuclear factor kappa B
NSA neurosphere assay
NSAID non-steroidal anti-inflammatory drug
NSC neural stem cell
NT3 neurotrophin 3
OB olfactory bulb
PB phosphate buffer
PBS phosphate buffer saline
PCR polimerase chain reaction
PEDF pigmented epithelium-derived factor
PFA paraformaldehyde
PGRN progranulin
PRC1 poly-comb repressive complex 1
PSA-NCAM polysialylated neural-cell-adhesion molecule
qNSC quiescent NSC
qRT-PCR quantitative real-time PCR
R1KO TNFR1 knock-out
R2KO TNFR2 knock-out
RGC radial glial cell
RIP receptor interacting protein
RMS rostral migratory stream
ROS reactive oxygen species
RT room temperature
SAPKS stress-activated protein kinases
SC stem cell
SDF1 stromal cell-derived factor 1
SDS-PAGE sodium dodecyl sulfate polyacrylamide gel electrophoresis
SEZ sub-ependymal zone
SGZ sub-granular zone
Shh sonic hedgehog
SOX sex determining region Y-box
SSC side scatter
T/E Trypsin/EDTA
TACE TNF-α converting enzyme
TAP transit amplifying progenitor
TBS-T Tris-buffered saline tween 20
TE trophectoderm
TF transcription factor
TFG-β transforming growth factor
TMZ temozolomide
TNF tumor necrosis factor
TNFR1 TNF-α receptor 1
TNFR2 TNF-α receptor 2
TRADD TNF receptor-associated death domain
TRAF2 TNF receptor-associated factor 2
TX-100 TritonTM X-100
VCAM1 vascular cell adhesion molecule-1
VEGF vascular endothelium derived factor
V-SVZ ventricular-subventricular zone
VZ ventricular zone
WT wild-type

Introduction

Introduction
3
1. Adult stem cells (SCs): functional units of homeostasis and tissue repair
1.1. Tissue-specific SCs
Adult stem cells (SCs) are unique tissue-resident cells with the ability to
perpetuate (self-renewal) while producing new tissue-specific differentiated cells
(multipotency) and represent the essential component for the maintenance of
tissue homeostasis and repair in multicellular organisms (Barker et al., 2010). The
totipotent zygote soon starts to divide after fecundation giving rise to the inner
cell mass (ICM) and the trophectoderm (TE). During the initial stages of embryonic
development, the pluripotent cells from the ICM expand until they generate the
three germ layers (endoderm, mesoderm and ectoderm). From here and along the
embryonic development, pluripotent cells start a process of increasing
commitment losing their pluripotency and generating all the variety of
differentiated tissue-specific cell types. However, not all the somatic cells are
differentiated and discrete populations of multipotent SCs persist during the adult
lifespan to ensure tissue renewal and a certain degree of tissue regeneration in
response to injury (Fuchs et al., 2004; Weissman, 2000).
In homeostatic conditions, SCs are relatively quiescent cells that divide
infrequently to produce new SCs and non-renewing, rapidly cycling cells or transit
amplifying progenitor (TAP) cells that will proliferate for a discrete number of
cycles to eventually differentiate into functional cells of the particular tissue. This
hierarchical relation represents a conservative mechanism that preserves the SC
genomic integrity by limiting the number of times SCs divide thereby preventing
their premature differentiation and guaranteeing the availability of SCs during
adulthood. However, this process requires a finely regulated equilibrium between
self-renewal, proliferation and differentiation to ensure efficient replacement of
cells while limiting pathological situations such as cancer (Biteau et al., 2011).
Introduction
4
The inherent abilities of SCs for tissue regeneration convert them, together
with the use of embryonic pluripotent stem cell (ESC), in fundamental candidates
for regenerative medicine and tissue repair. Thus, the identification of bona fide SCs
and the understanding of their biology and regulation and how organs maintain
and repair themselves in the postnatal organism are crucial requirements before a
successful cell therapy is achieved. Furthermore, the evidences that cancer stem
cells (CSCs) are originated from somatic SCs (Alcantara Llaguno et al., 2009; Barker
et al., 2009; Lapouge et al., 2011; Youssef et al., 2010) not only reinforce the idea
that a precise control of stem cell proliferation is required to prevent tumour
formation, but also opens new perspectives for the identification of molecular
similarities between CSCs and tissue-specific SCs that would undoubtedly yield new
targets for cancer therapy.
1.2. Dynamics and heterogeneity of adult SCs in homeostasis
In the last decades, different SCs have been identified and proven to act as
true stem cells in many tissues. The discovery of hematopoietic stem cells (HSCs)
residing at the bone marrow represented the first demonstration about the
existence of cells with self-renewal and multipotency properties (Till and Mc, 1961)
and, since then, this system has played a leading role in the stem cell field and has
greatly helped in setting the standards for the characterization of other tissue-
specific SCs (Weissman, 2000). The discovery of SCs in a variety of tissues with
different cell replacement dynamics such as the intestinal epithelium, the hair
follicles, the peripheral and central nervous system, the skin or the muscles has
highlighted the existence of a remarkable diversity of SCs differing in their
identifying markers, degree of multipotentiality, or proliferative dynamics and thus,
contrary to what it was previously thought, SCs do not constitute a homogeneous
population. Instead, they rather represent an ensemble of single cells in different
proliferative states (quiescent or active) with different predispositions to respond
to external stimuli (Biteau et al., 2011; Chaker et al., 2016; Li and Clevers, 2010)
Introduction
5
(Figure 1). Nowadays there are known several tissues were quiescent and active
SCs coexist and participate in the long-term cell turnover; however, it is not fully
understood whether they represent two states of the same cell or they are rather
different pools, being the quiescent SCs a reservoir of the active pool. In any case,
in order to maintain tissue homeostasis, the SC activity actually seems to be
controlled at different levels: (1) as mentioned above, the balance between self-
renewal, proliferation and differentiation; (2) the induction of SC proliferation in
response to injury; and (3) return to a quiescent state after regeneration is
achieved.
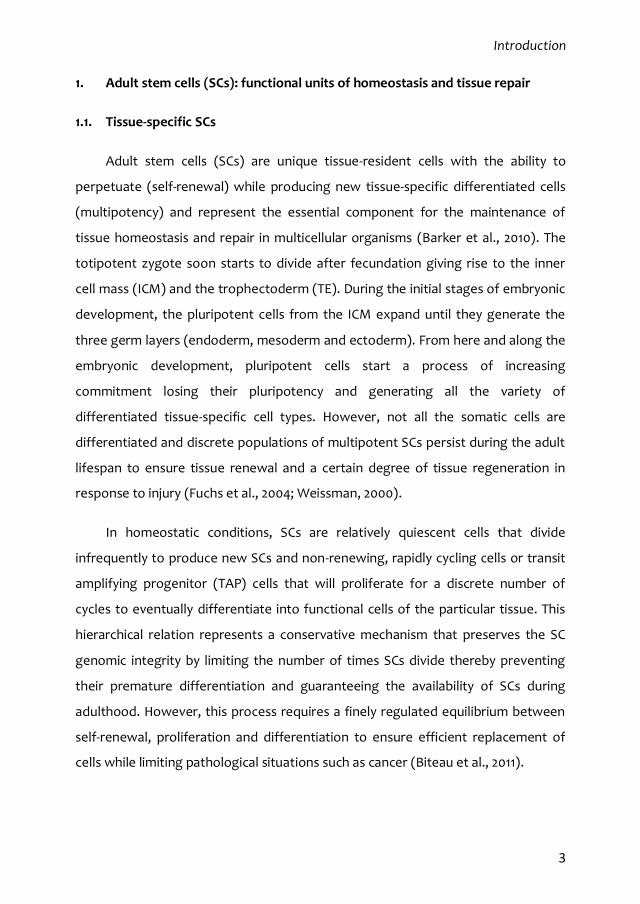
Figure 1. Adult SCs are dynamically heterogeneous. (A) Initially, it was proposed that tissue self-renewal relied on a single relatively quiescent stem cell population which asymmetrically divided to balance self-renewal and differentiation. (B) Instead, SCs co-exist in different proliferative states (quiescent and active) representing separated populations which are maintained by inhibitory and stimulatory cross-signalling. In this currently prevailing model, tissue turnover and regeneration is driven by the interconversion of quiescent and active SCs. Conversely, active stem cells may replace lost quiescent stem cells and, together with the progeny, may contribute to maintain quiescence. The figure depicts the particular situation of intestinal SC as an example. Adapted from Li et al. 2010.
Introduction
6
Apart from the heterogeneity in cell dynamics, recent data has evidenced that
SCs are also diverse in their self-renewal and differentiation potentials and suggest
that different stem cell types co-exist under homeostatic conditions (Dykstra et al.,
2007; Ousset et al., 2012; Stange et al., 2013; Van Keymeulen et al., 2011).
Furthermore, each SC type seems to have a pre-defined role under normal
conditions but they show flexibility after perturbations and can adapt to other
functions when required (Goodell et al., 2015). Therefore, the conception of stem
cell hierarchy is still currently evolving and new models have been proposed in
different tissues such as the hematopoietic and the intestinal stem cell systems
(Figure 2). These proposals suggest that SCs initially have different lineage biases
to generate specific restricted progenitors that produce a specific differentiated
cell. Moreover, the distinct SC types are also progressively committed to a more
restricted SC. However, after injury, committed progenitors may revert to a
partially-committed stem-like state. Thus, the complexity of this heterogeneous
systems with SCs that differ in their dynamics and multipotency has caused that,
despite all the progress made since SC discovery, the stem cell regulation is still
under thorough study.
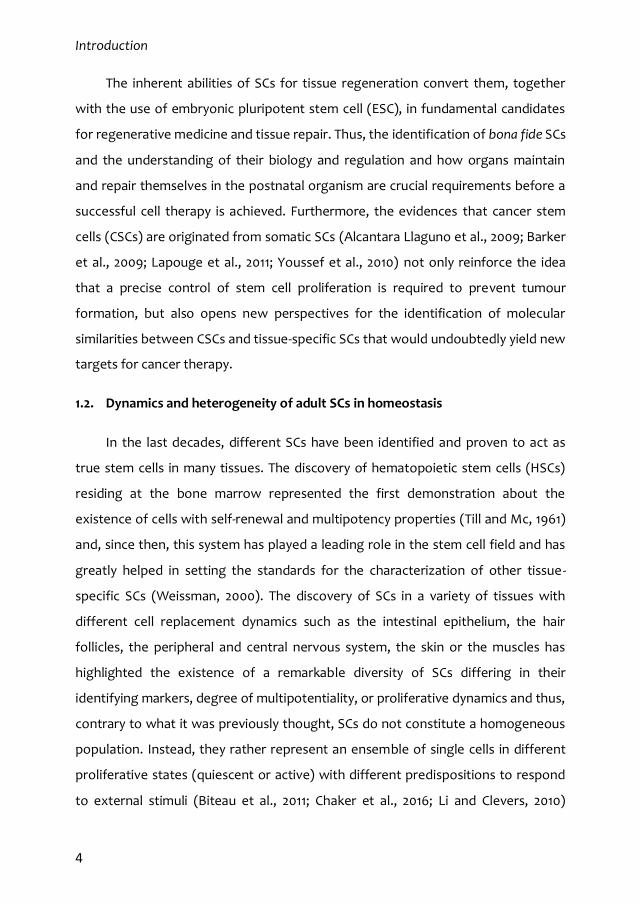
Figure 2. Adult SCs are functionally heterogeneous. Tissue-specific SCs have a pre-defined role under normal conditions and give rise to specific committed progenitors but they show flexibility after perturbations and can adapt to other functions when required. Additionally, progenitors may revert to a stem cell state upon extreme injury. Two examples of this are (a) the intestinal and (b) the hematopoietic SC systems. Adapted from Goodell et al. 2015.
Introduction
7
1.3. Quiescence in adult SC populations: a novel level of regulation during
homeostasis and injury
Quiescence is a reversible cell cycle arrested state (G0) and, unlike post-mitotic
cells, quiescent SCs keep the ability to re-enter cell cycle and proliferate. This
property of stem cells represents a key factor in preserving both the stemness for
long-term tissue renewal and their DNA integrity to avoid dysregulation of SCs
proliferation and tumorigenesis (Orford and Scadden, 2008). Cellular quiescence is
characterized by an un-replicated genome, a specific metabolic status
characterized by predominant glycolytic activity, a decreased cell size with
increased nuclei to cytoplasm ratio and a reversible suppression of global RNA and
protein synthesis. Contrary to the traditional view of quiescence as an inactive
default cell state, it is currently known that this condition is rather an active
regulated state where molecular changes are taking place in response to niche
signals (Rumman et al., 2015). In fact, quiescent SCs are maintained by either
growth inhibiting signals or absence of growth-promoting signals and loss of
quiescence is associated with compromised tissue regeneration (Daynac et al.,
2016; Delgado et al., 2014; Fleming et al., 2008; Porlan et al., 2013a). Furthermore,
quiescent SC exhibit better survival ability under adverse conditions and,
interestingly, they are activated upon injury to generate new SCs and progenitors
(Mich et al., 2014; Rodgers et al., 2014; Rossi et al., 2012; Tian et al., 2011). This
current knowledge has generated a novel area of research that is gaining biological
significance and relevance within the SC field but, unlike regulation of the
activation state of SC, the regulation of quiescence is vastly unknown.
Satellite cells are considered the tissue-specific SC in skeletal muscle (MuSCs)
and are characterized by an extremely low turn-over rate during homeostasis.
However, after injury, this mainly quiescent population dramatically increases
proliferation displaying a huge regenerative capacity (Dhawan and Rando, 2005).
Additionally, Rodgers et al. have recently found that the quiescent MuSC residing in
Introduction
8
a muscle contralateral to a mechanically injured muscle respond to the distant
injury displaying cycling properties different to the previously characterized for
quiescent and activated pools. This quiescent ‘alert’ state (Galert) of MuSCs, as it has
been defined, and compared to the quiescent ‘dormant’ state (G0), shows a higher
predisposition to enter proliferation, an accelerated cell-cycle entry, a higher
mitochondrial activity and a slightly bigger size. Moreover, global transcription
profiles suggest that it represents an intermediate state between G0 and active SCs
(Rodgers et al., 2014). MuSCs appear to adopt this state in response to remote
injuries whose impact on the physiology of the tissue is not enough to trigger SC
activation and, hence, expansion of the SC population. Additionally, it has also
been observed that other SC population, like the fibroadipogenic progenitors and
long-term HSCs, adopt similar alert properties upon distant injury indicating that
this quiescent transition is not an isolated phenomenon and may represent a
general response to injury. Interestingly, the Galert state reverts to the dormant
state following resolution of the inducer (Rodgers et al., 2014). Together, all these
data has demonstrated that SCs also undergo dynamic transitions between
functional phases in the quiescent state stablishing a novel reversible quiescence
cycle model (Figure 3). Moreover, this novel functional state also indicates that
dormant SCs in different tissues can adopt an adaptive state in response to signals
produced in remote regions of the organism, suggesting the existence of a
homeostatic control of adult SCs.
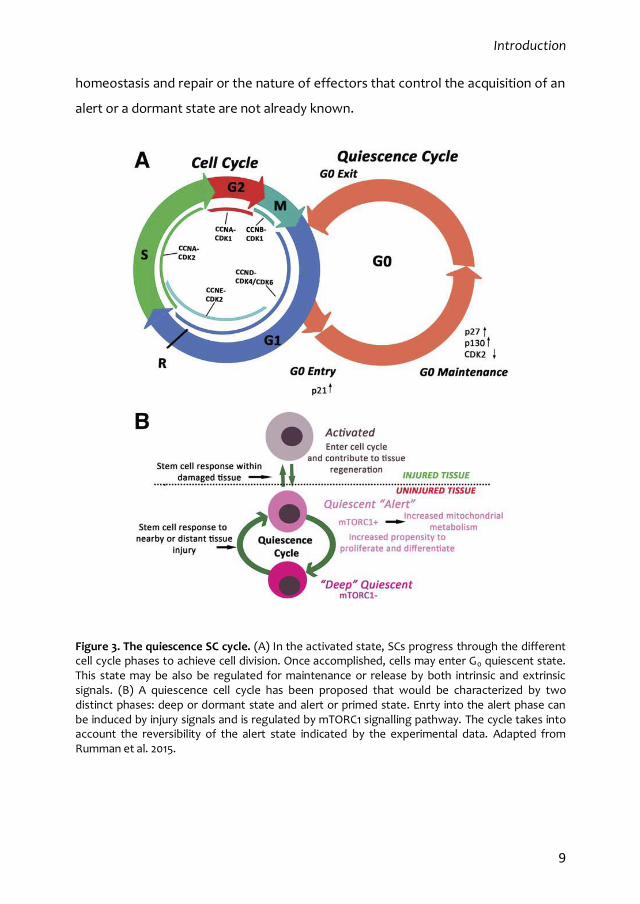
The existence of a quiescence cycle that precedes activation opens a new
regulatory level of SC dynamics. The signalling through the hepatocyte growth
factor (HGF) receptor cMet was found to activate the mTOR complex 1 (mTORC1)
signalling pathway to mediate the G0-Galert transition in MuSCs. Furthermore,
inhibition of mTORC1 completely abolished the acquisition of a Galert state indicating
that this pathway may play a central role in the “quiescence cell cycle” (Rodgers et
al., 2014) and indicates that this transition must also be a regulated process.
Nevertheless, the relevance of the quiescence cycle regulation in tissue
Introduction
9
homeostasis and repair or the nature of effectors that control the acquisition of an
alert or a dormant state are not already known.
Figure 3. The quiescence SC cycle. (A) In the activated state, SCs progress through the different cell cycle phases to achieve cell division. Once accomplished, cells may enter G0 quiescent state. This state may be also be regulated for maintenance or release by both intrinsic and extrinsic signals. (B) A quiescence cell cycle has been proposed that would be characterized by two distinct phases: deep or dormant state and alert or primed state. Enrty into the alert phase can be induced by injury signals and is regulated by mTORC1 signalling pathway. The cycle takes into account the reversibility of the alert state indicated by the experimental data. Adapted from Rumman et al. 2015.
Introduction
10
1.4. Adult SC niches
SCs reside on specific well-organized neighbourhoods termed ‘niches’. The SC
niche refers to the specialized microenvironment that surrounds, interact and
regulate the SC behaviour to keep a proper balance between quiescence or
activation and self-renewal or differentiation, thus playing a fundamental role in
tissue homeostasis. The term was initially proposed by R. Schofield in 1978 after
observing that HSC proliferative potential differed depending on the location they
were isolated from: the spleen or the bone marrow (Schofield, 1978). From there,
the hypothesis has been vastly supported by a variety of co-culture experiments
(Dexter et al., 1977; Moore et al., 1997; Rios and Williams, 1990) or by SC
transplantation into niches in which its components were previously removed
through irradiation or drug administration (Brinster and Zimmermann, 1994; Li and
Xie, 2005). Schofield proposed that a niche would act as ‘‘an environment…to
explain the unlimited proliferation and failure to mature of ...stem cells’’ by
regulating restriction on stem cell entry into cell cycle and differentiation
programs, integration of signals reflecting tissue and organismal state,
mechanisms for limiting “mutational errors”, and imposition of stem cell features
on daughter cells. Experimental evidence gathered since then has provided strong
support to Schofield´s postulates.
Invertebrate models with simpler stem cell-microenvironment relation like
germ stem cells (GSC) in the gonad tips of Drosophila and C. elegans provided the
first examples of discrete niches and their characterization has greatly helped to
the identification of SC niches in vertebrates (Morrison and Spradling, 2008; Voog
and Jones, 2010). So far, different SC niches have been identified in many tissues,
including the germline, bone marrow, skeletal muscle, skin and hair follicles,
mammary gland, and digestive, respiratory or central and peripheral nervous
systems and their current characterization is starting to resolve the critical
components in the SC niche (Wagers, 2012) (Figure 4).
Introduction
11
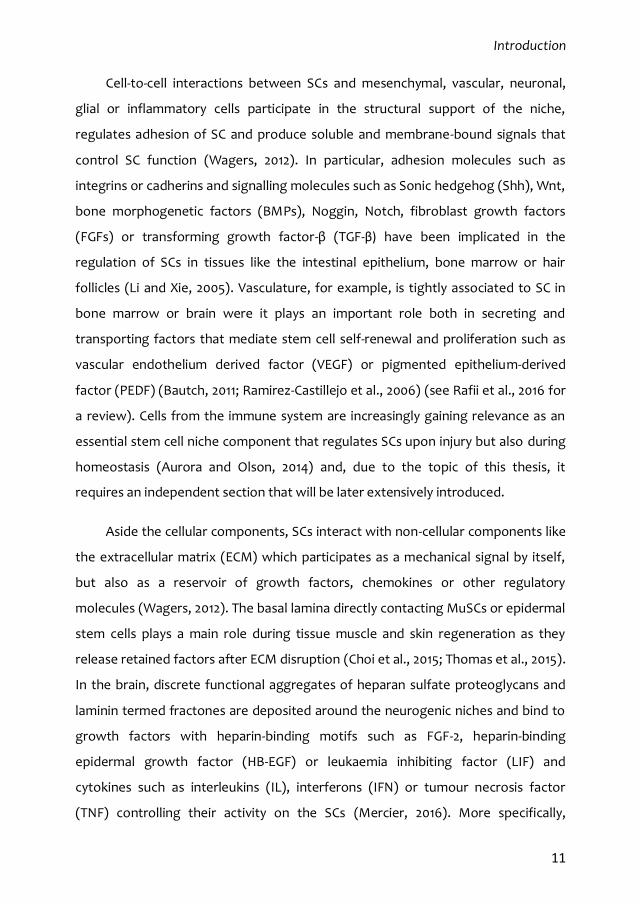
Cell-to-cell interactions between SCs and mesenchymal, vascular, neuronal,
glial or inflammatory cells participate in the structural support of the niche,
regulates adhesion of SC and produce soluble and membrane-bound signals that
control SC function (Wagers, 2012). In particular, adhesion molecules such as
integrins or cadherins and signalling molecules such as Sonic hedgehog (Shh), Wnt,
bone morphogenetic factors (BMPs), Noggin, Notch, fibroblast growth factors
(FGFs) or transforming growth factor-β (TGF-β) have been implicated in the
regulation of SCs in tissues like the intestinal epithelium, bone marrow or hair
follicles (Li and Xie, 2005). Vasculature, for example, is tightly associated to SC in
bone marrow or brain were it plays an important role both in secreting and
transporting factors that mediate stem cell self-renewal and proliferation such as
vascular endothelium derived factor (VEGF) or pigmented epithelium-derived
factor (PEDF) (Bautch, 2011; Ramirez-Castillejo et al., 2006) (see Rafii et al., 2016 for
a review). Cells from the immune system are increasingly gaining relevance as an
essential stem cell niche component that regulates SCs upon injury but also during
homeostasis (Aurora and Olson, 2014) and, due to the topic of this thesis, it
requires an independent section that will be later extensively introduced.
Aside the cellular components, SCs interact with non-cellular components like
the extracellular matrix (ECM) which participates as a mechanical signal by itself,
but also as a reservoir of growth factors, chemokines or other regulatory
molecules (Wagers, 2012). The basal lamina directly contacting MuSCs or epidermal
stem cells plays a main role during tissue muscle and skin regeneration as they
release retained factors after ECM disruption (Choi et al., 2015; Thomas et al., 2015).
In the brain, discrete functional aggregates of heparan sulfate proteoglycans and
laminin termed fractones are deposited around the neurogenic niches and bind to
growth factors with heparin-binding motifs such as FGF-2, heparin-binding
epidermal growth factor (HB-EGF) or leukaemia inhibiting factor (LIF) and
cytokines such as interleukins (IL), interferons (IFN) or tumour necrosis factor
(TNF) controlling their activity on the SCs (Mercier, 2016). More specifically,
Introduction
12
expression of the laminin receptor alpha6beta1 integrin allows brain SCs to interact
with the basal lamina of irrigating blood vessels and this interaction modulates
their activity (Shen et al., 2008).
Finally, different physical parameters such as matrix rigidity, temperature or
oxygen tension also influence the stem cell response to the microenvironment
(Wagers, 2012). In particular, the oxygen availability greatly influences the adult SC
biology (Kimura et al., 2015). O2 partial pressure varies along the different tissues
and it ranges from less than 1% up to 8-9%. It is worth noting that several SC reside
in relative hypoxic microdomains such as at the hematopoietic, the mesenchymal
or the neural stem cell niche. Interestingly, hypoxia has been related to quiescence
maintenance trough the stabilization of the hypoxia inducible factor-1 alpha (HIF-
1α) which translocates to the nucleus and regulates the expression of genes
related to oxygen homeostasis, glucose metabolism, proliferation or the
expression of growth factors such as VEGF or erythropoietin (EPO) (Mohyeldin et
al., 2010).
Figure 4. The SC niche. SCs reside in specialized niches composed of both cellular and acellular components that, in general, are common to the vast majority of SC compartments, despite some tissue-specific variations. Cell-cell interactions with mesenchymal, vascular, neuronal, glial or inflammatory cells and soluble factors secreted by these cells, interaction with the ECM and physical parameters as oxygen tension are known regulators of SC behaviour. Adapted from Wagers et al. 2012.
Introduction
13
At the organismal level, the crucial role of innervation, i. e. sympathetic
innervation to the bone marrow or nerve terminals within neurogenic niches, and
systemic circulation, as revealed by parabiosis experiments, in regulating SC niche
homeostasis and regeneration in different tissues has strongly emerged in the
recent years and has added a new level of complexity to the understanding of
niche biology (Conboy and Rando, 2012; del Toro and Mendez-Ferrer, 2013).
2. Subependymal neural stem cells (NSCs) and adult neurogenesis
Nowadays, it is well established that, in the adult vertebrate brain, new
neurons are continuously produced throughout adult lifespan (Bond et al., 2015). In
adult mammals, neurogenesis mainly occurs in two germinal zones: the sub-
granular zone (SGZ) of the dentate gyrus in the hippocampus and the sub-
ependymal zone (SEZ; also known as ventricular-subventricular zone or V-SVZ)
adjacent to the lateral ventricles. These brain regions harbour discrete populations
of neural stem cells (NSCs) which are maintained undifferentiated while they
generate new differentiated progeny (Bond et al., 2015). Like in other systems, the
discovery of adult neurogenesis (Altman and Das, 1965) and the identification of
the responsible tissue-specific SCs (Doetsch et al., 1999a; Seri et al., 2001) led to a
shift in our understanding of neural plasticity and opened new perspectives based
on the use of this previously denied potential for brain repair upon injury or
neurodegeneration. To this goal, the study and knowledge of the NSC biology and
regulation may provide the essential tools for an eventual manipulation of
endogenous NSCs.
2.1. Adult subependymal NSCs have an embryonic origin
The adult central nervous system (CNS) is derived from the embryonic
neuroectoderm, a pseudo-stratified neuroepithelium in the dorsal surface of the
developing embryo that invaginates during neurulation to form the neural tube.
Introduction
14
The neuroepithelial cells of the neural tube are the embryonic primary precursors
of the CNS and proliferate dividing symmetrically to expand the neural tube until
the ventricular zone (VZ) is formed. These primary precursors eventually transform
into radial glial cells (RGCs) which divide both symmetrically and asymmetrically to
generate two RGCs or one RGC and a neuroblast which migrates radially away from
the VZ to the expanding neural parenchyma, respectively. Asymmetric division
becomes more prominent following the onset of neurogenesis. RGCs have a long
basal cytoplasmic process contacting the pial surface which is used by the newborn
neurons as guiding scaffolds to migrate up to marginal zones where they
differentiate and connect with other neurons (Bjornsson et al., 2015; Kriegstein and
Alvarez-Buylla, 2009). At mid-gestation, RGCs can also divide asymmetrically to give
rise to intermediate progenitor cells which also contribute to neuron generation.
These intermediate progenitors accumulate above the VZ forming a new germinal
layer, the sub-ventricular zone (SVZ) which acts as a second germinal zone
(Bjornsson et al., 2015). At the end of foetal development, RGCs switch to produce
glial and ependymal cells (Figure 5). Thus, foetal RGCs are responsible for the
generation of the majority of neurons and of glial and ependymal cells of the adult
CNS (Anthony et al., 2004; Malatesta et al., 2000; Miyata et al., 2001; Noctor et al.,
2001; Spassky et al., 2005).
After birth, the remaining RGCs in the VZ differentiate either into ependymal
cells, that will line the lateral ventricles, or into glial cells, including NSCs that retain
many of the RGC features and populate the two adult neurogenic niches (Merkle et
al., 2004; Tramontin et al., 2003). Additionally, different recent studies have also
demonstrated that during intermediate embryonic stages (E13.5-E15.5), RGCs can
eventually derive into NSCs that remain relatively quiescent until adulthood when
they can be re-activated (Fuentealba et al., 2015; Furutachi et al., 2015).
Introduction
15
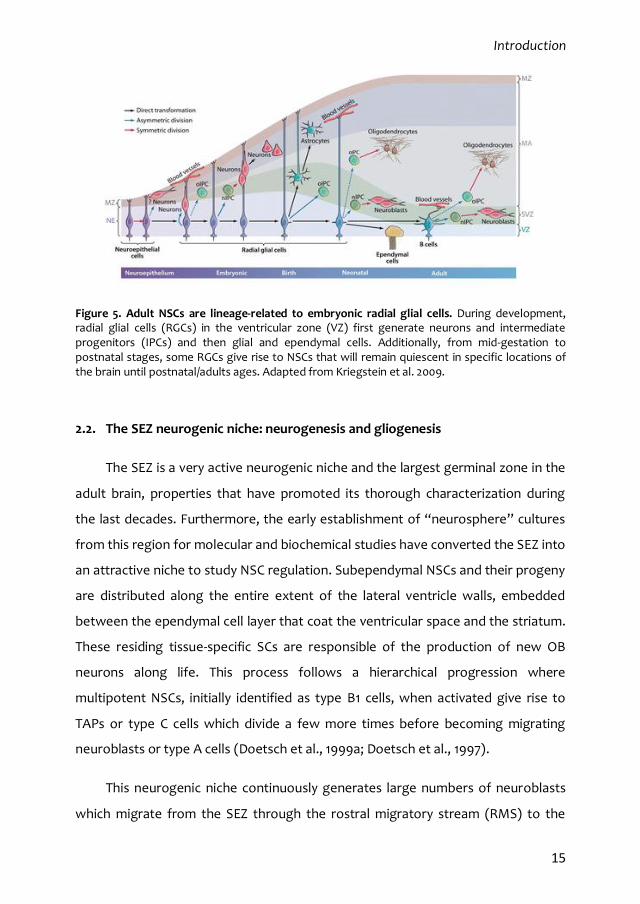
Figure 5. Adult NSCs are lineage-related to embryonic radial glial cells. During development, radial glial cells (RGCs) in the ventricular zone (VZ) first generate neurons and intermediate progenitors (IPCs) and then glial and ependymal cells. Additionally, from mid-gestation to postnatal stages, some RGCs give rise to NSCs that will remain quiescent in specific locations of the brain until postnatal/adults ages. Adapted from Kriegstein et al. 2009.
2.2. The SEZ neurogenic niche: neurogenesis and gliogenesis
The SEZ is a very active neurogenic niche and the largest germinal zone in the
adult brain, properties that have promoted its thorough characterization during
the last decades. Furthermore, the early establishment of “neurosphere” cultures
from this region for molecular and biochemical studies have converted the SEZ into
an attractive niche to study NSC regulation. Subependymal NSCs and their progeny
are distributed along the entire extent of the lateral ventricle walls, embedded
between the ependymal cell layer that coat the ventricular space and the striatum.
These residing tissue-specific SCs are responsible of the production of new OB
neurons along life. This process follows a hierarchical progression where
multipotent NSCs, initially identified as type B1 cells, when activated give rise to
TAPs or type C cells which divide a few more times before becoming migrating
neuroblasts or type A cells (Doetsch et al., 1999a; Doetsch et al., 1997).
This neurogenic niche continuously generates large numbers of neuroblasts
which migrate from the SEZ through the rostral migratory stream (RMS) to the
Introduction
16
olfactory bulb (OB). New-born neuroblasts are organized in chains surrounded by a
layer of astrocytes and migrate tangentially along this ‘gliotubes’ to the OB
(Doetsch and Alvarez-Buylla, 1996; Lalli, 2014). Here, the arriving immature
neuroblasts continue migrating radially to the granule (GCL) and the glomerular
(GL) cell layers until they are differentiated and integrated as mature interneurons
(Doetsch and Alvarez-Buylla, 1996). SEZ neurogenesis provide different subtypes of
interneurons that integrate in the OB contributing to OB function and the neural
plasticity of olfactory information processing (Chaker et al., 2016; Livneh et al.,
2014; Lledo and Valley, 2016) (Figure 6).
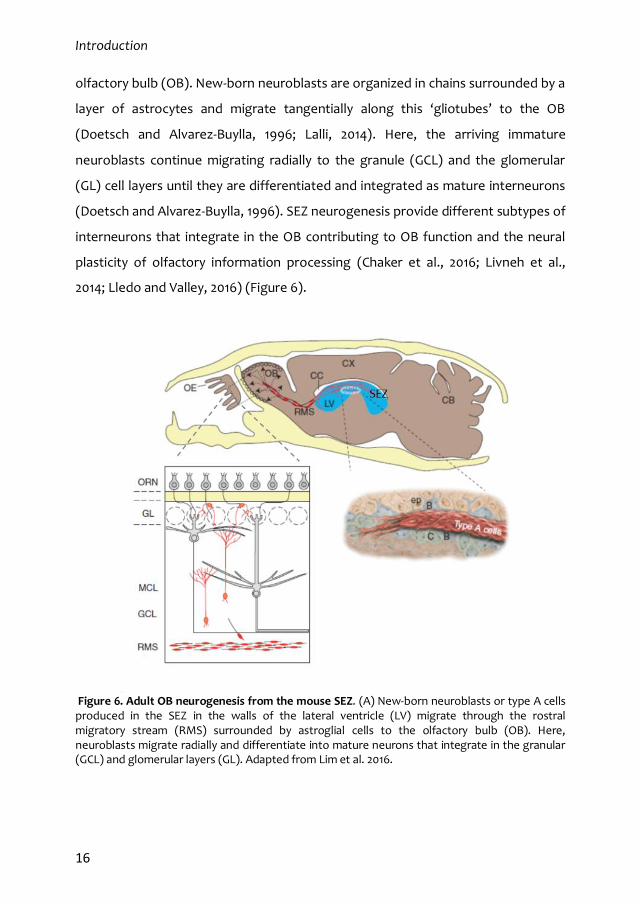
Figure 6. Adult OB neurogenesis from the mouse SEZ. (A) New-born neuroblasts or type A cells produced in the SEZ in the walls of the lateral ventricle (LV) migrate through the rostral migratory stream (RMS) surrounded by astroglial cells to the olfactory bulb (OB). Here, neuroblasts migrate radially and differentiate into mature neurons that integrate in the granular (GCL) and glomerular layers (GL). Adapted from Lim et al. 2016.
Introduction
17
Additionally, the SEZ also contributes, although to a lesser extent, to the
production of either new niche astrocytes that migrate to the RMS and the corpus
callosum (CC), and oligodendrocytes that mainly contribute to the CC re-
myelination (Menn et al., 2006; Sohn et al., 2015). Although SEZ gliogenesis is not
as productive as neurogenesis under homeostatic conditions, the generation of
new oligodendrocytes and astrocytes increases after injury which migrate to the
lesioned site and play an active role in tissue repair (Benner et al., 2013; Nait-
Oumesmar et al., 1999; Picard-Riera et al., 2002).
2.3. The subependymal NSC lineage
Type B1 NSCs are glial cells that show ultrastructural and molecular features of
other brain astrocytes such as the expression of the markers glial fibrillary acidic
protein (GFAP), glutamate aspartate transporter (GLAST) and brain lipid-binding
protein (BLBP) (Doetsch, 2003; Doetsch et al., 1999a). However, unlike non-
neurogenic niche astrocytes which show a branched morphology, B1 cells display a
more radial shape (Doetsch et al., 1997) and retain an apical-basal polarity similar to
embryonic RGCs contacting the cerebrospinal fluid (CSF) that fills the ventricles
through an apical process that ends in a single primary cilium. This primary cilium
intercalates among multiciliated ependymal cells organized in structures displaying
a pinwheel pattern (Mirzadeh et al., 2008). Type B1 cells also have long basal
processes that run radially or tangentially to the ventricular surface for long
distances to contact the basal lamina of capillaries of the extensive planar plexus of
blood vessels that irrigate this area through specialized cell endings (Shen et al.,
2008; Tavazoie et al., 2008) (Figure 7).
It has been long demonstrated that type B1 astrocytes are relative quiescent
cells that behave as NSCs under homeostasis and regeneration. The administration
of antimitotic drugs revealed the presence of quiescent B1 cells that survive the
treatment and completely regenerate the SEZ afterwards (Doetsch et al., 1999b).
Additionally, cell-lineage genetic tracing of GFAP cells demonstrated their ability to
Introduction
18
generate TAPs and neuroblasts that migrate to the OB (Doetsch et al., 1999a).
Furthermore, type B1 cells are also able to form multipotent self-renewing
neurospheres in vitro that can be maintained and expanded for many passages
thus fulfilling in vivo and in vitro hallmarks of SCs (Doetsch et al., 1999a).
From there, several lineage-tracing strategies have been used to identify the
NSC pool studying the potentiality of different marker expressing-cells to behave
as NSCs and generate progeny. Inducible Cre drivers such as Gfap (Mich et al.,
2014), Glast (Calzolari et al., 2015; Mich et al., 2014), Nestin (Chaker et al., 2015;
Imayoshi et al., 2008) and Gli1 (Ahn and Joyner, 2005; Mich et al., 2014) has
demonstrated the ability of this cells to behave as multipotent NSCs generating
either OB neurons and astrocytes and oligodendrocytes. Additionally, other
lineage-tracing reporters such as Dlx1 (Mich et al., 2014), Ascl1 (Kim et al., 2011; Kim
et al., 2007; Mich et al., 2014), Sox1 (Venere et al., 2012), Sox2 (Kang and Hebert,
2012), Fgfr3 (Young et al., 2010), Tlx (Liu et al., 2008), Musashi (Takeda et al., 2013),
Id1 (Nam and Benezra, 2009) or Hes5 (Giachino et al., 2014) expressing-cells has also
showed the ability of this cells to generate new OB neurons but not
oligodendrocytes or astrocytes. However, whether a single tripotent NSC exists or,
alternatively, there are separated neurogenic and gliogenic compartments is still
unclear.
Once activated, type B1 NSCs cells can undergo asymmetric division to self-
renew and generate type C cells (Ortega et al., 2013a; Ortega et al., 2013b) which
behave as TAP cells dividing symmetrically approximately three times before
becoming type A cells, which remain proliferative for one or two more rounds
(Ponti et al., 2013). Type C cells start a process of commitment losing the astroglial
features of NSCs such as the expression of GFAP or GLAST. Instead, type C cells are
characterized by the expression of the transcription factor achaete-scoute
homologue 1 (ASCL1) or the ependymal growth factor receptor (EGFR) (Doetsch et
al., 2002a). Type A cells, in contrast, are distinguished by the expression of the
Introduction
19
neuronal isoform of tubulin β-III-tubulin, doublecourtin (DCX), and polysialylated
neural-cell-adhesion molecule (PSA-NCAM) (Doetsch et al., 1997).
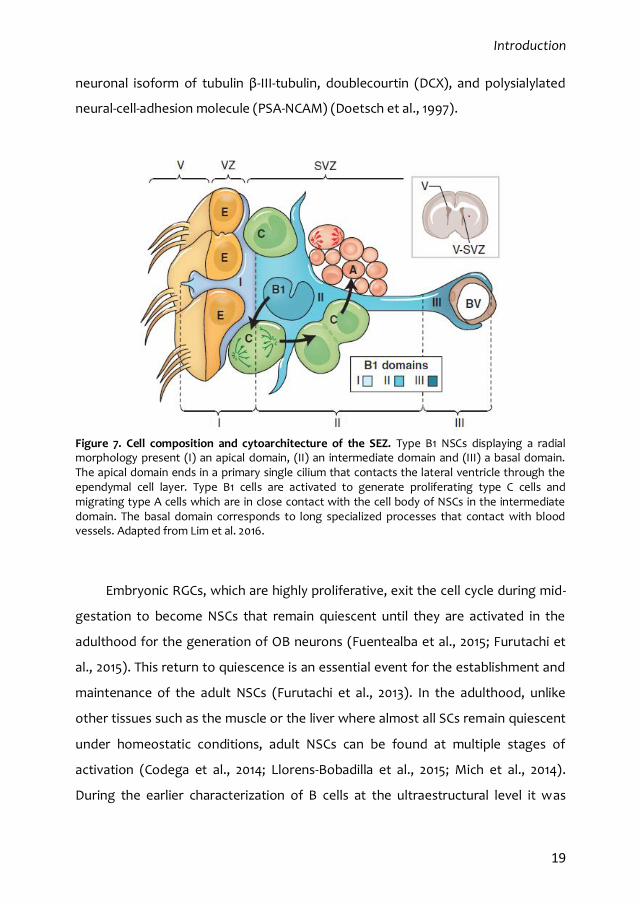
Figure 7. Cell composition and cytoarchitecture of the SEZ. Type B1 NSCs displaying a radial morphology present (I) an apical domain, (II) an intermediate domain and (III) a basal domain. The apical domain ends in a primary single cilium that contacts the lateral ventricle through the ependymal cell layer. Type B1 cells are activated to generate proliferating type C cells and migrating type A cells which are in close contact with the cell body of NSCs in the intermediate domain. The basal domain corresponds to long specialized processes that contact with blood vessels. Adapted from Lim et al. 2016.
Embryonic RGCs, which are highly proliferative, exit the cell cycle during mid-
gestation to become NSCs that remain quiescent until they are activated in the
adulthood for the generation of OB neurons (Fuentealba et al., 2015; Furutachi et
al., 2015). This return to quiescence is an essential event for the establishment and
maintenance of the adult NSCs (Furutachi et al., 2013). In the adulthood, unlike
other tissues such as the muscle or the liver where almost all SCs remain quiescent
under homeostatic conditions, adult NSCs can be found at multiple stages of
activation (Codega et al., 2014; Llorens-Bobadilla et al., 2015; Mich et al., 2014).
During the earlier characterization of B cells at the ultraestructural level it was
Introduction
20
already observed that two types of B cells coexisted lining the ventricles: type B1
cells have light cytoplasm, contact the ventricle and show null replication activity,
and type B2 cells with darker cytoplasm, are closer to blood vessels and replicate
the DNA content incorporating traceable nucleoside analogues (Doetsch et al.,
1997). This description soon suggested the existence of at least two different
proliferative states. More recently, it has been shown that a subset of GFAP+ and
Glast+ astrocytes expressing EGFR are sensitive to antimitotic drugs such as
cytosine β-D-arabinofuranoside (Ara-C) or temozolomide (TMZ) indicating that this
subset of NSCs is actively dividing. In contrast, a pool of EGFR- NSCs remain
quiescent, survive the treatments, and retain the ability to restore the production
of new OB neurons through the regeneration of the entire lineage (Codega et al.,
2014; Mich et al., 2014; Pastrana et al., 2009). It is now clear that both pool of cells,
quiescent and active NSCs (qNSCs and aNSCs), participate in tissue homeostasis;
however, whether they represent two states of the same cell or different SC
populations that can interconvert is still unknown.
Due to all the features shared between neurogenic and non-neurogenic
astrocytes like the expression of the same glial markers such as GFAP or GLAST, the
identification and isolation of bona fide NSCs has been a challenging task.
Moreover, the existence of a pool of NSCs that remain quiescent from embryonic
stages and along adulthood (Codega et al., 2014; Fuentealba et al., 2015; Furutachi
et al., 2015; Llorens-Bobadilla et al., 2015; Mich et al., 2014) has called into question
nucleoside retaining methods as ways to unequivocally label quiescent cells as
some of them may never become labelled. Slow-cycling cells such as those label-
retaining cells (LRCs) that incorporate and retain nucleoside analogues may only be
attributed to a previously activated population and thus, cannot be generally used
to distinguish between quiescent dormant neurogenic astrocytes and niche
astrocytes.
Introduction
21
Unfortunately, so far there is no single marker that unequivocally identifies
each pool of NSCs like there is in other systems such as the case with Lgr5 and Bmi1
in the intestinal epithelium (Tian et al., 2011) or Pax7 in the skeletal muscle (Rodgers
et al., 2014). However, several different strategies based in fluorescence activated
cell sorting (FACS) have been used to successfully isolate SEZ cells that display
functional in vivo and in vitro properties of aNSCs and qNSCs (Codega et al., 2014;
Daynac et al., 2013; Giachino et al., 2014; Khatri et al., 2014; Llorens-Bobadilla et al.,
2015; Mich et al., 2014). Interestingly, EGFR expression is used in all cases to
differentiate between a quiescent and an activated state. Nevertheless, they differ
in the marker combinations used to distinguish between qNSCs and other niche
astrocytes including CD133 and GFAP::GFP reporter mice (Codega et al., 2014) or
GLAST (Llorens-Bobadilla et al., 2015), LeX (Daynac et al., 2013), PlexinB2 and GLAST
(Mich et al., 2014) or the Hes5::GFP reporter mice and BLBP (Giachino et al., 2014).
Additionally, the expression of CD24 has also been used to discard immature
neuroblasts (Codega et al., 2014; Daynac et al., 2013; Llorens-Bobadilla et al., 2015;
Mich et al., 2014).
Isolation of NSC pools displaying different activation states has allowed a
deeper characterization of each of them. Transcriptome analysis of both
populations has revealed that qNSCs and aNSCs are molecularly heterogeneous
(Codega et al., 2014). qNSCs show enrichment in gene categories of cell-cell
adhesion, extracellular-matrix-response and anchorage-dependent niche signals,
but also of cell communication, signalling receptors, transmembrane transporters
and ion channels, a combination that reflects their active regulation and
communication with the microenvironment. In contrast, aNSC transcriptome is
more related with cell-cycle and DNA repair gene categories (Codega et al., 2014).
Furthermore, qNSCs and aNSCs also differ in the expression of metabolism-related
genes displaying the quiescent pool a preference in glycolysis and fatty acid
metabolism whereas aNSCs up-regulate oxidative phosphorylation genes (Codega
Introduction
22
et al., 2014). Additionally, and accordingly with their active state, aNSCs also display
higher translational rates than qNSCs (Llorens-Bobadilla et al., 2015).
Following this line, a recent work has further refined the transition of NSCs
from quiescence to activation to eventually become immature neuroblasts
(Llorens-Bobadilla et al., 2015). Taking advantage of the novel single-cell RNA-seq
technologies, the authors described a more detailed sequence of molecular
changes that take place between qNSCs, aNSCs, TAPs and neuroblasts which has
revealed the existence of different quiescent and active states. Clustering of
individual NSC transcriptomes by principal component analysis revealed the
existence of four different cell populations which, placed in a pseudo-time line of
‘differentiation’, suggested a gradual transition from a ‘dormant’ state (qNSC1)
that is ‘primed’ (qNSC2) before actively dividing states (non-mitotic aNSC1 and
mitotic aNSC2). It is worth noting that a similar progression has been observed in a
parallel cell-single transcriptome analysis of SGZ NSCs (Shin et al., 2015). The
molecular hallmarks of each state also suggested that NSC activation and early
lineage progression is organized as a continuum of successive molecular events.
For example, dormant qNSC1 showed the highest levels of glial markers while
aNSCs have already started a down-regulation of the glial gene expression
programme. Instead, aNSCs up-regulate the expression of lineage-specific
transcription factors such as Ascl1. Interestingly, the qNSC2 pool displayed
intermediate features between dormant and active cells such as the activation of
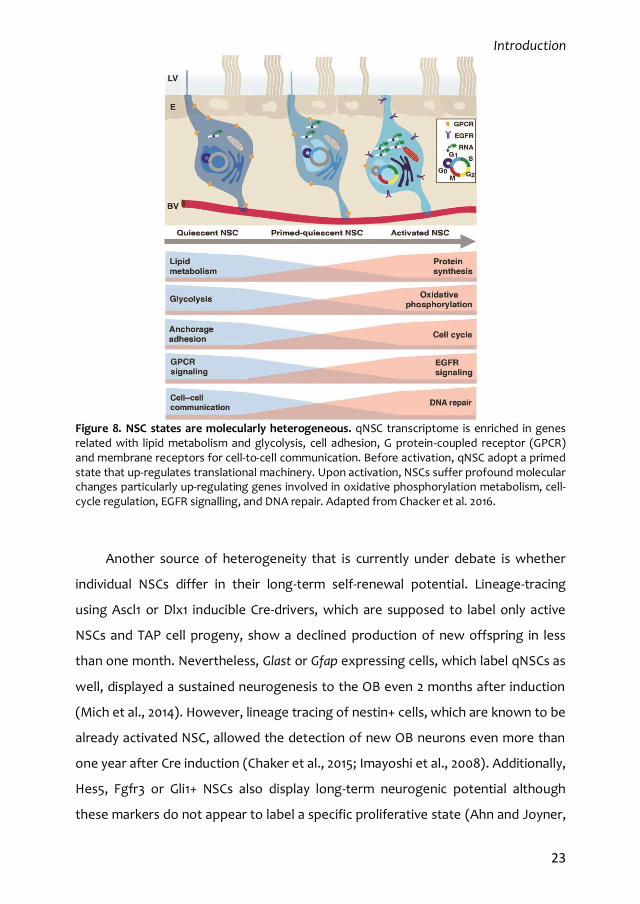
the protein synthesis machinery (Llorens-Bobadilla et al., 2015) (Figure 8). It is
worth noting that the existence of a ‘primed’ quiescent state that is set-up for
activation vastly resembles to the Galert state observed in MuSCs (Rodgers et al.,
2014). In agreement with this, the qNSC2 pool increases upon ischaemic brain injury
suggesting that qNSCs detect injury signals which may regulate their transition to a
primed state for a subsequent activation. However, it has not been explored
whether this is a reversible state or which are the molecular mechanisms or the
effectors that regulate priming and activation of qNSCs.
Introduction
23
Figure 8. NSC states are molecularly heterogeneous. qNSC transcriptome is enriched in genes related with lipid metabolism and glycolysis, cell adhesion, G protein-coupled receptor (GPCR) and membrane receptors for cell-to-cell communication. Before activation, qNSC adopt a primed state that up-regulates translational machinery. Upon activation, NSCs suffer profound molecular changes particularly up-regulating genes involved in oxidative phosphorylation metabolism, cell-cycle regulation, EGFR signalling, and DNA repair. Adapted from Chacker et al. 2016.
Another source of heterogeneity that is currently under debate is whether
individual NSCs differ in their long-term self-renewal potential. Lineage-tracing
using Ascl1 or Dlx1 inducible Cre-drivers, which are supposed to label only active
NSCs and TAP cell progeny, show a declined production of new offspring in less
than one month. Nevertheless, Glast or Gfap expressing cells, which label qNSCs as
well, displayed a sustained neurogenesis to the OB even 2 months after induction
(Mich et al., 2014). However, lineage tracing of nestin+ cells, which are known to be
already activated NSC, allowed the detection of new OB neurons even more than
one year after Cre induction (Chaker et al., 2015; Imayoshi et al., 2008). Additionally,
Hes5, Fgfr3 or Gli1+ NSCs also display long-term neurogenic potential although
these markers do not appear to label a specific proliferative state (Ahn and Joyner,
Introduction
24
2005; Giachino et al., 2014; Young et al., 2010). These data suggest that qNSCs may
present a more sustained self-renewal potential while aNSCs seem to have a more
limited self-renewal potential. Furthermore, these results also question whether
aNSCs are capable of returning to quiescence thus maintaining a long-term self-
renewal potential. Recent clonal analysis of single NSCs either using the confetti
reporter mice (Calzolari et al., 2015) or embryonic retroviral library bar-coding
(Fuentealba et al., 2015) and inducible Cre under the Glast promoter support this
idea as the majority of individual NSCs, once activated, produced the expansion of
neurogenic progeny for a limited number of rounds before becoming exhausted.
Nevertheless, it is worth noting that a few clones contained both OB neurons and
SEZ NSCs after long periods indicating that at least some activated NSCs may revert
to a quiescent state keeping a long-term self-renewal potential. Although this is still
under debate, it is currently clear that NSCs are dynamically, molecularly and
functionally heterogeneous.
2.4. Subependymal NSC in vitro culture: the neurosphere assay
Several tissue-specific SCs were initially isolated and characterized by
culturing tissue dissociates under conditions that promote their selective
expansion. Initial work by Reynolds and Weiss led to the establishment of defined
culture conditions that allowed the isolation and expansion of individual cells from
young adult (2-month old) mouse periventricular tissue under non-adhesive
conditions. These cells were initially maintained in a serum-free medium containing
EGF to induce their proliferation. Under these culture conditions most of the cells
died during the first days in culture, but a small population of cells began to divide
and formed floating aggregates of cells with immunocytochemical features of
neuroepithelial cells, called primary “neurospheres” (Reynolds and Weiss, 1992).
Subsequent mechanical dissociation and subculture of these neurospheres allowed
propagation of the cultures, revealing the self-renewal capacity of some of the
cells. Additionally, when cultured onto an adhesive substrate in the presence of
Introduction
25
serum, they could produce both astrocytes and neurons. This provided the first in
vitro evidence that multipotential SCs were present in the adult mammalian brain
and a method to expand large numbers of postnatal NSCs (Reynolds and Weiss,
1992).
Since these early experiments, the neurosphere culture has evolved into a
powerful tool that enables the study of NSC proliferation, self-renewal and
developmental potential under highly controlled environmental conditions
(Belenguer et al., 2016). Once primary neurospheres are obtained from the SEZ
tissue, they can be expanded for extended periods of time by dissociating them
after 4-7 days and seeding individual cells under the same conditions. Either
primary or secondary cultures can be assayed for the neurosphere assay (NSA), the
gold standard of the NSC studies in vitro which allows the study of the clonogenic
capacity and self-renewal of NSCs. Additionally, NSCs cultures can be challenged
for differentiation to study the process itself and quantify the different populations
of differentiated progeny or to assess the multipotency of individual clones. It is
worth noting that the establishment of in vitro cultures allows to characterize NSCs
from a molecular and biochemical point of view that otherwise could not be
fulfilled (Belenguer et al., 2016) (Figure 9). Although the neurosphere assay
approach only grants an operational definition of a stem cell, the culture of NSCs
has notably increased our knowledge on how these cells are regulated, for
example by signals from their microenvironment or niches (Porlan et al., 2013b).
However, this type of culture is not exempt of limitations. The most important
one is that neurosphere cultures contain a heterogeneous population of cells as
NSCs coexist with their progeny (different types of more committed progenitors
and even differentiated cells). Stem cells unavoidably produce cell progeny in vitro
and some of the highly proliferative committed progenitors or TAP cells appear
also capable of forming neurospheres, albeit only for a few passages (Doetsch et
al., 2002a; Reynolds and Rietze, 2005). Indeed, only a fraction of the total cells in
Introduction
26
the culture behave as bona fide NSCs and, therefore, the assays need to carefully
address their specific properties. In addition, qNSCs only extremely rarely form
neurospheres while the strong mitogenic stimulation of culture conditions
promote the selective expansion of aNSCs or TAPs (Codega et al., 2014; Mich et al.,
2014). Therefore, the neurosphere assay in the current culture conditions better
reflects the potential of aNSC and TAPs (Belenguer et al., 2016; Pastrana et al.,
2011). However, the development and application of new NSC culture protocols to
isolated populations of qNSCs and aNSCs appears as a promising strategy to
further understand the fundamental properties and behaviour of the different
types of NSCs.
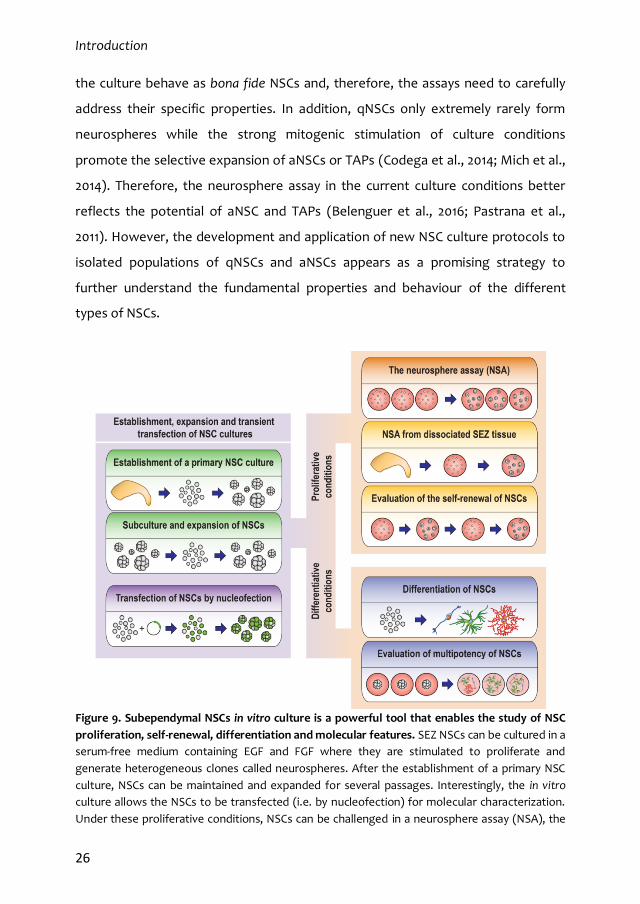
Figure 9. Subependymal NSCs in vitro culture is a powerful tool that enables the study of NSC
proliferation, self-renewal, differentiation and molecular features. SEZ NSCs can be cultured in a
serum-free medium containing EGF and FGF where they are stimulated to proliferate and
generate heterogeneous clones called neurospheres. After the establishment of a primary NSC
culture, NSCs can be maintained and expanded for several passages. Interestingly, the in vitro
culture allows the NSCs to be transfected (i.e. by nucleofection) for molecular characterization.
Under these proliferative conditions, NSCs can be challenged in a neurosphere assay (NSA), the
Introduction
27
gold standard in vitro approach, which allows the evaluation of the NSC clonogenic capacity,
either from primary or secondary cultures. Additionally, performing a sequential NSA by
disaggregating initial clones and sub-culturing them again allows the evaluation of NSC self-
renewal. Finally, after mitogen retrieval, NSCs are differentiated into neurons, astrocytes and
oligodendrocytes in serum-containing media allowing the study of differentiated progeny and
the clonal analysis of NSC potential.
3. The regulation of adult subependymal NSCs
A proper cell turnover during homeostasis or a functional tissue repair upon
injury is the consequence of a finely regulated balance between quiescence and
activation, self-renewal, proliferation, cell fate and differentiation of SCs. Current
increasingly knowledge in the adult neurogenic niches is revealing the active
participation of multiple players, either cell intrinsic determinants or signals from
the extrinsic niche.
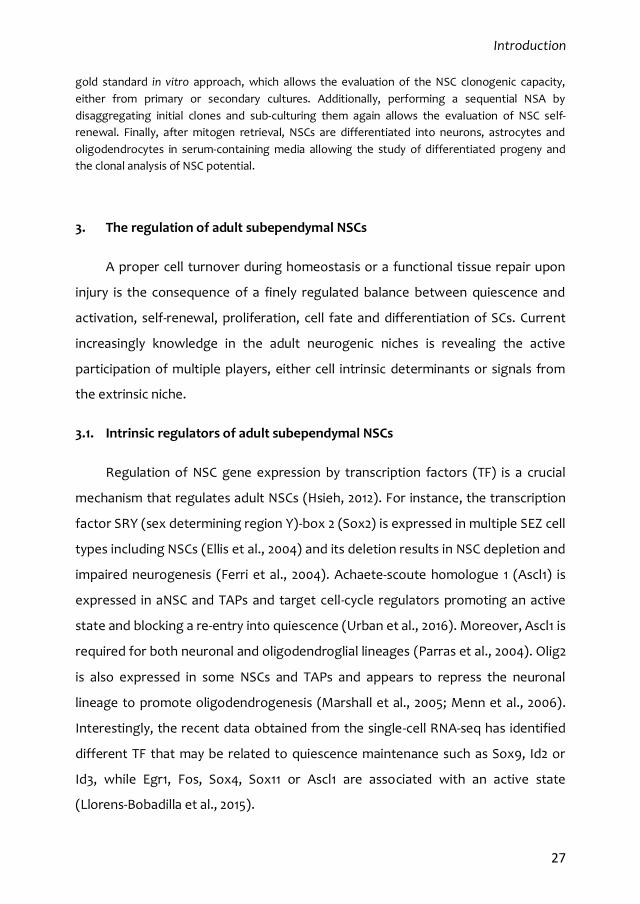
3.1. Intrinsic regulators of adult subependymal NSCs
Regulation of NSC gene expression by transcription factors (TF) is a crucial
mechanism that regulates adult NSCs (Hsieh, 2012). For instance, the transcription
factor SRY (sex determining region Y)-box 2 (Sox2) is expressed in multiple SEZ cell
types including NSCs (Ellis et al., 2004) and its deletion results in NSC depletion and
impaired neurogenesis (Ferri et al., 2004). Achaete-scoute homologue 1 (Ascl1) is
expressed in aNSC and TAPs and target cell-cycle regulators promoting an active
state and blocking a re-entry into quiescence (Urban et al., 2016). Moreover, Ascl1 is
required for both neuronal and oligodendroglial lineages (Parras et al., 2004). Olig2
is also expressed in some NSCs and TAPs and appears to repress the neuronal
lineage to promote oligodendrogenesis (Marshall et al., 2005; Menn et al., 2006).
Interestingly, the recent data obtained from the single-cell RNA-seq has identified
different TF that may be related to quiescence maintenance such as Sox9, Id2 or
Id3, while Egr1, Fos, Sox4, Sox11 or Ascl1 are associated with an active state
(Llorens-Bobadilla et al., 2015).
Introduction
28
Regional heterogeneity is emerging as a key component of SEZ SC identity
and cell fate. Fate mapping experiments have revealed that the diversity of OB
interneurons subtypes or the production of astrocytes and oligodendrocytes is
regionally specified and this is also correlated with a regional expression of specific
TF. Thus, the observed different lineages may actually be intrinsically defined by
the combinations of lineage transcription factors that, in addition, seem to be
already defined during embryonic stages (Chaker et al., 2016; Llorens-Bobadilla and
Martin-Villalba, 2016).
NSC maintenance and neurogenesis also depends on the tightly regulated cell
cycle progression which is controlled by multiple regulators including cyclins,
cyclin-dependent kinases (CDK), CDK inhibitors or TF. For instance, up-regulation of
CKIs p16 and p19 impairs NSC self-renewal (Molofsky et al., 2003; Molofsky et al.,
2006). Instead, CKI p27 has been related to TAP regulation and prevention of
premature differentiation (Doetsch et al., 2002b). Furthermore, other regulators
such as p21 has been implicated in NSC cell-cycle regulation preventing qNSCs
release but also with non-cell autonomous functions preventing a premature
differentiation through the inhibition of bone morphogenetic protein 2 (BMP2)
over-expression (Kippin et al., 2005b; Porlan et al., 2013a). Moreover, p21 also
displays a direct regulation of SOX2 expression eventually modulating NSC self-
renewal (Marques-Torrejon et al., 2013).
Additional controls of NSC behaviour come from the regulation of gene
expression by heritable epigenetic modifications. DNA methylation through DNA
methyl transferase 3A (DNMT3A) or histone modification mediated by BMI1, a
component of the poly-comb repressive complex 1 (PRC1), are good examples of
this novel component of NSC regulation as they regulate the expression of key
neurogenic genes that participate in NSC maintenance (Mich et al., 2014; Molofsky
et al., 2003; Wu et al., 2010).
Introduction
29
Recent studies have revealed changes in energetic demands during different
stem cell behaviours. Activation of qNSCs is accompanied by down-regulation of
glycolytic metabolism and up-regulation of mitochondrial oxidation in both SEZ and
SGZ (Llorens-Bobadilla et al., 2015; Shin et al., 2015). These evidences suggest that a
glycolytic metabolism may be important for maintaining NSC self-renewal and
multipotency while oxidative phosphorylation is needed to fulfil the higher
energetic demands that sustain proliferating states. In fact, it has been shown that
NSCs have a stronger dependency on glycolytic metabolism than neurons and
lower requirements for oxidative metabolism (Candelario et al., 2013). Additionally,
lipid metabolism, mitochondrial metabolism and protection to the associated
generation of reactive oxygen species (ROS) are also emerging as potential
regulators of NSC activity (Knobloch and Jessberger, 2017).
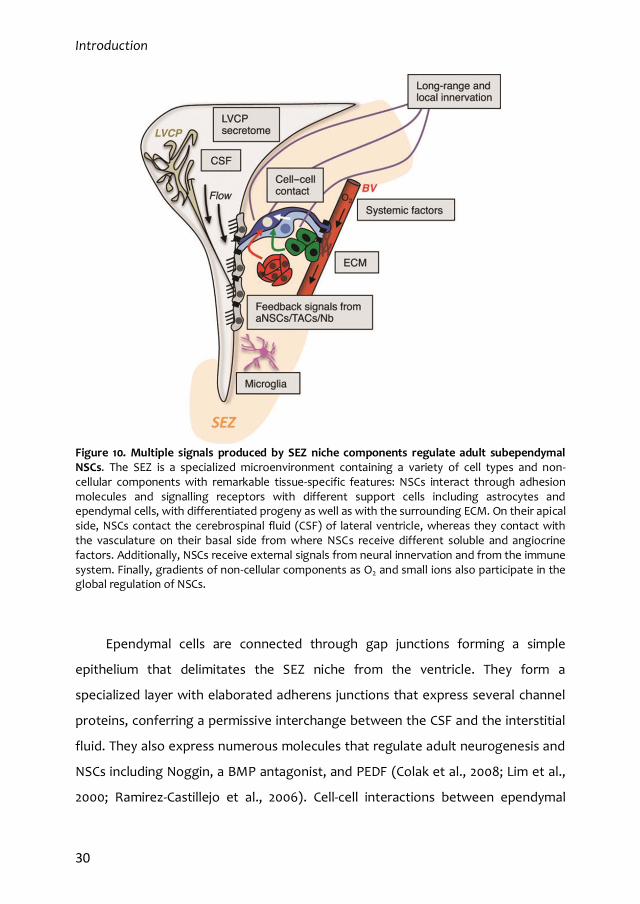
3.2. Niche-dependent regulation of adult subependymal NSCs
The SEZ is a specialized microenvironment containing a variety of cells types
which actively participate in the global decision making of NSCs. Moreover, this
neurogenic niche presents a remarkable cellular architecture which allows the
interaction with local cells and the surrounding ECM while receiving soluble factors
from different sources, either locally or systemically produced. On their apical side,
NSCs contact the CSF that fills the ventricles and continuously flows beaten by
multiciliated ependymal cells (Mirzadeh et al., 2008). On their basal side, NSCs
contact with an extensive vascular plexus that runs parallel to the SEZ (Shen et al.,
2008; Tavazoie et al., 2008). Additionally, NSCs receive external signals from neural
innervation and from the immune system through residing microglia (Bjornsson et
al., 2015) (Figure 10).
Introduction
30
Figure 10. Multiple signals produced by SEZ niche components regulate adult subependymal NSCs. The SEZ is a specialized microenvironment containing a variety of cell types and non-cellular components with remarkable tissue-specific features: NSCs interact through adhesion molecules and signalling receptors with different support cells including astrocytes and ependymal cells, with differentiated progeny as well as with the surrounding ECM. On their apical side, NSCs contact the cerebrospinal fluid (CSF) of lateral ventricle, whereas they contact with the vasculature on their basal side from where NSCs receive different soluble and angiocrine factors. Additionally, NSCs receive external signals from neural innervation and from the immune system. Finally, gradients of non-cellular components as O2 and small ions also participate in the global regulation of NSCs.
Ependymal cells are connected through gap junctions forming a simple
epithelium that delimitates the SEZ niche from the ventricle. They form a
specialized layer with elaborated adherens junctions that express several channel
proteins, conferring a permissive interchange between the CSF and the interstitial
fluid. They also express numerous molecules that regulate adult neurogenesis and
NSCs including Noggin, a BMP antagonist, and PEDF (Colak et al., 2008; Lim et al.,
2000; Ramirez-Castillejo et al., 2006). Cell-cell interactions between ependymal
Introduction
31
cells and NSCs through N-cadherin have been also implicated in the maintenance of
NSC quiescence and the cleavage of these connections through the matrix
metallopeptidase MT5-MMP is required for proper activation of NSCs (Porlan et al.,
2014). Likewise, NSC apical end-feet express high levels of the adhesion and
signalling molecule vascular cell adhesion molecule-1 (VCAM1) for interaction with
ependymal cells which is required for pinwheel organization and quiescence
(Kokovay et al., 2012). Cell-cell interactions with derived progeny are also relevant,
acting as negative feedback signals to prevent NSC exhaustion. Membrane-bound
notch-ligand Dll1 is expressed in aNSCs and TAPs and send pro-dormancy signals to
qNSCs, which express the receptor Notch2 (Kawaguchi et al., 2013; Llorens-
Bobadilla et al., 2015). Mature astrocytes secrete delta-like homologue 1 (DLK1) that
binds to the membrane-bound isoform present in NSCs to regulate self-renewal
(Ferron et al., 2011).
The motile cilia present in ependymal cells actively beat the CSF which
contains multiple factors secreted by the choroid plexus (ChP), a thin highly
vascularized epithelium floating attached to the lateral ventricle cavity. It
participates both in brain homeostasis (Redzic et al., 2005) and in neurogenic
regulation through the secretion of signalling factors (Lun et al., 2015). For
instance, the CSF provides migratory cues that guide neuroblasts to reach the RMS
(Sawamoto et al., 2006). A recent global transcriptome analysis of the ChP has
revealed the expression of multiple growth factors and signalling molecules with
previously known effects on NSCs and neurogenesis, including neurotrophin 3
(NT3) (Delgado et al., 2014), insulin growth factor 2 (IGF2) (Ziegler et al., 2012) or
FGF2 (Zheng et al., 2004) and novel candidates such as BMP5 or IGF1 (Silva-Vargas
et al., 2016).
The intimate connection between NSCs and the parallel vascular plexus
strongly suggests that NSCs reside in a vascular niche which provides important
extrinsic signals (Shen et al., 2008; Tavazoie et al., 2008). Moreover, NSCs contact
Introduction
32
the blood vessels at specialized sites with a relatively permissive blood-brain barrier
(BBB) due to the lack of astrocyte end-feet (Tavazoie et al., 2008). Therefore NSCs
receive both local extrinsic signals from the endothelial cells, known as angiocrine
factors (Rafii et al., 2016), and distant produced factors from the blood stream
including hormones, cytokines, metabolites and gases that can cross the BBB.
Endothelial cells produce a variety of described NSC regulating molecules such as
VEGF and PEDF which participate in NSC self-renewal (Ramirez-Castillejo et al.,
2006; Shen et al., 2004), NT3 involved in quiescence maintenance (Delgado et al.,
2014), or the chemokine stromal cell-derived factor 1 (SDF1) that regulates survival
and migration of the NSC lineage (Kokovay et al., 2010). Additionally, direct cell-cell
contact between NSCs and endothelial cells has also been demonstrated to
promote quiescence (Ottone et al., 2014).
NSCs express receptors and respond to a variety of neurotransmitters (Berg
et al., 2013). For instance, neuroblasts produce and release gamma-aminobutyric
acid (GABA) to promote NSC quiescence thus auto-regulating the neuroblast
demand (Liu et al., 2005a). The SEZ is also innervated by a variety of mature
neurons including dopaminergic, serotonergic, cholinergic or nitric oxide (NO)
neurons. Serotonin and acetylcholine increase NSC proliferation (Paez-Gonzalez et
al., 2014; Tong et al., 2014) whereas studies of NO and dopamine suggest dual
actions on NSC and progenitor proliferation (Hoglinger et al., 2004; Kippin et al.,
2005a; Romero-Grimaldi et al., 2008). In addition, supraependymal 5HT
serotoninergic axons originating from the raphe nucleus directly interact with NSCs
to increase their proliferation via 5HT2C (Tong et al., 2014).
NSCs are located in a relatively hypoxic environment and this low oxygen
tension has been suggested to facilitate stemness and prevent NSC differentiation
(Mohyeldin et al., 2010). Although NSCs are in contact with blood vessels, the cell
body of the qNSC resides closer to the ependymal cell layer, far from regions with
higher gas renewal, what suggests that hypoxia may be related to a quiescent
Introduction
33
state. Additionally, a less dependency on oxidative phosphorylation of qNSCs
further supports this idea (Candelario et al., 2013; Llorens-Bobadilla et al., 2015).
Hypoxia is known to regulate gene expression through the transcriptional factor
HIF-1α, which has been recently implicated in NSC maintenance and SEZ vascular
stability (Li et al., 2014).
4. Regulation of adult NSCs by the innate immune system
4.1. The role of inflammation in regeneration
Living organisms are constantly exposed to a variety of internal and external
stimuli and some of them can be classified as danger signals that either represent a
direct consequence of tissue damage (like the release of proteins and metabolites
normally sequestered within cells, hypoxia, mechanical or chemical traumas,
among others) or indicate the presence of harmful agents that may threaten tissue
and even organism integrity (like invading microbes of viral and bacterial origin).
When such signals are detected, a complex response is set in motion that is aimed
at eliminating the danger signals and eventually restoring tissue and organism
homeostasis. This response is generically referred to as inflammation, which
represents a fundamental part of the innate immune system and its overall
blueprint has been determined early in the evolution of metazoans, as indicated by
the presence of a typical inflammatory response to wounds in invertebrates
(Aurora and Olson, 2014). Inflammatory responses appear both essential for
homeostasis and potentially dangerous. Activation of the immune system and its
response to injury has evolved in vertebrates in the direction of promoting wound
sealing and scarring to protect the damaged tissue of adult homeothermic
individuals from pathogen invasion in a very rapid and efficient way. The down-side
effect of this refined adaptive immune response is the loss of epimorphic
Introduction
34
regeneration that is characteristic of cold-blooded organisms (Aurora and Olson,
2014).
Despite the loss of extensive regenerative capacity, adult mammalian tissues
contain resident SCs that support cell turnover and production of new cells under
physiological conditions. Inflammation has been shown to act on several SC niches,
but the observation of changes in tissue turnover that could reflect both
detrimental and beneficial effects has left the precise role of inflammation in tissue
maintenance and regeneration as controversial and generated an area of intense
investigation (Kizil et al., 2012a; Kizil et al., 2015; Kyritsis et al., 2014).
The initial phase of inflammation recruits the participation of resident immune
cells, such as macrophages outside the CNS and microglial cells in the brain, which
then secrete pro-inflammatory cytokines that initiate a cascade of molecular
events. Acute inflammation is followed by active resolution by anti-inflammatory
molecules. Within this complex temporal progression, the response of cells,
including SC, to the changing landscape of cytokines is an intense research field
which includes the study of the specific cross-talk between inflammation and stem
cells (Kizil et al., 2015). Failed resolution results in chronic inflammation which is
considered as hazardous to tissues, as reflected in its involvement in the onset and
progression of many diseases.
4.2. Microglia, neuroinflammation and neurogenesis
Microglia are the resident macrophages and serve as primary immune effector
cells of the CNS. These cells have a foetal hematopoietic origin and are derived
from a specific type of myeloid progenitors that infiltrate the brain through blood
vessels between E8.5 and E9.5 and hence are observed in the neuroepithelium of
rodents before the onset of foetal neurogenesis. Moreover, their numbers increase
throughout embryogenesis and postnatal stages through division within the CNS
(Ginhoux et al., 2010). They have a multitude of functions, ranging from

Introduction
35
phagocytosis to neuroprotection and immune surveillance during infection and
injury. In the adult brain, microglia in the resting state continuously survey the local
environment, with their dynamic processes interacting with a number of cell types,
including astrocytes, neurons, and endothelial cells (Nimmerjahn et al., 2005).
Microglial cells engage an innate immune reaction to various forms of
pathogenesis and insults (Aguzzi et al., 2013).
Effects of microglia in CNS homeostasis and reaction to injury depend largely
on their balanced secretion of pro-inflammatory and anti-inflammatory cytokines
and chemokines. They are also emerging as a fundamental component of the
neurogenic niches both in homeostasis and upon injury through cytokine secretion
and phagocytosis and debris clearance (Borsini et al., 2015; Sato, 2015; Sierra et al.,
2010). As such, recent studies have shown that adult neurogenesis is modulated by
inflammatory cytokines in response to an activated immune system. Interestingly,
microglia is a conspicuous component of the SEZ and RMS and, compared to other
microglial cells, SEZ microglia comprise a morphologically and antigenically distinct
cell subtype characterized by an activated phenotype, low expression of
purinoceptors and lack of ATP-elicitable chemotaxis (Goings et al., 2006; Ribeiro
Xavier et al., 2015).
Immune cell activation is among the first responses detected in a tissue upon
injury and a peripheral inflammatory response is transduced to the brain through
different mechanisms, including cytokine passage through the BBB by saturable
transport systems or peripheral cytokine-induced self-stimulated release of pro-
inflammatory molecules from CNS cell sources like microglia or endothelial cells
(Banks and Erickson, 2010). Cytokines are low molecular-weight (8 to 40 kDa)
glycoproteins secreted by various cell types, such some leukocytes, endothelial
cells and resident macrophages like microglia, in response to infection, noxious
stimuli that induce an immune response, inflammation, and trauma. Some
cytokines act to make disease worse whereas others serve to reduce inflammation
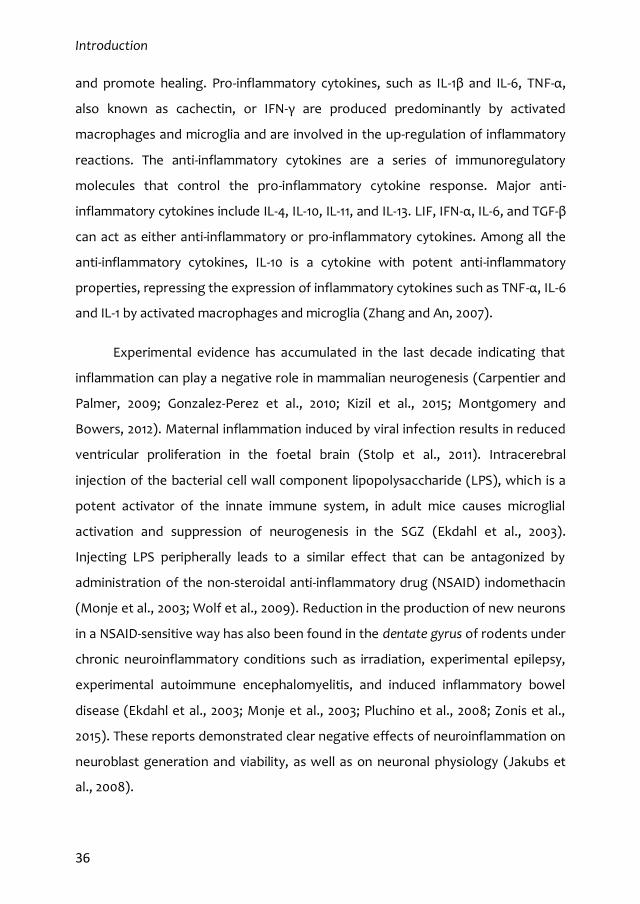
Introduction
36
and promote healing. Pro-inflammatory cytokines, such as IL-1β and IL-6, TNF-α,
also known as cachectin, or IFN-γ are produced predominantly by activated
macrophages and microglia and are involved in the up-regulation of inflammatory
reactions. The anti-inflammatory cytokines are a series of immunoregulatory
molecules that control the pro-inflammatory cytokine response. Major anti-
inflammatory cytokines include IL-4, IL-10, IL-11, and IL-13. LIF, IFN-α, IL-6, and TGF-β
can act as either anti-inflammatory or pro-inflammatory cytokines. Among all the
anti-inflammatory cytokines, IL-10 is a cytokine with potent anti-inflammatory
properties, repressing the expression of inflammatory cytokines such as TNF-α, IL-6
and IL-1 by activated macrophages and microglia (Zhang and An, 2007).
Experimental evidence has accumulated in the last decade indicating that
inflammation can play a negative role in mammalian neurogenesis (Carpentier and
Palmer, 2009; Gonzalez-Perez et al., 2010; Kizil et al., 2015; Montgomery and
Bowers, 2012). Maternal inflammation induced by viral infection results in reduced
ventricular proliferation in the foetal brain (Stolp et al., 2011). Intracerebral
injection of the bacterial cell wall component lipopolysaccharide (LPS), which is a
potent activator of the innate immune system, in adult mice causes microglial
activation and suppression of neurogenesis in the SGZ (Ekdahl et al., 2003).
Injecting LPS peripherally leads to a similar effect that can be antagonized by
administration of the non-steroidal anti-inflammatory drug (NSAID) indomethacin
(Monje et al., 2003; Wolf et al., 2009). Reduction in the production of new neurons
in a NSAID-sensitive way has also been found in the dentate gyrus of rodents under
chronic neuroinflammatory conditions such as irradiation, experimental epilepsy,
experimental autoimmune encephalomyelitis, and induced inflammatory bowel
disease (Ekdahl et al., 2003; Monje et al., 2003; Pluchino et al., 2008; Zonis et al.,
2015). These reports demonstrated clear negative effects of neuroinflammation on
neuroblast generation and viability, as well as on neuronal physiology (Jakubs et
al., 2008).
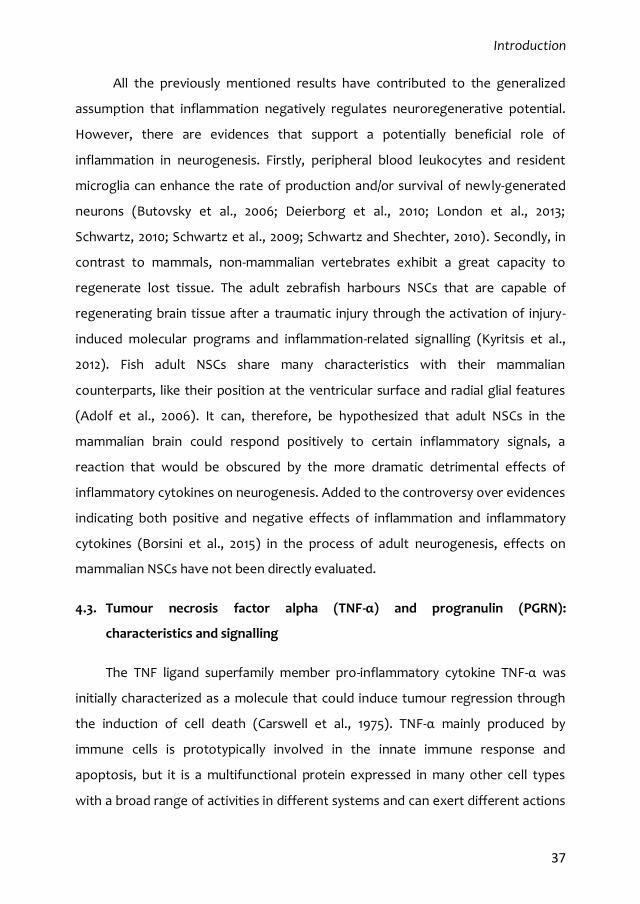
Introduction
37
All the previously mentioned results have contributed to the generalized
assumption that inflammation negatively regulates neuroregenerative potential.
However, there are evidences that support a potentially beneficial role of
inflammation in neurogenesis. Firstly, peripheral blood leukocytes and resident
microglia can enhance the rate of production and/or survival of newly-generated
neurons (Butovsky et al., 2006; Deierborg et al., 2010; London et al., 2013;
Schwartz, 2010; Schwartz et al., 2009; Schwartz and Shechter, 2010). Secondly, in
contrast to mammals, non-mammalian vertebrates exhibit a great capacity to
regenerate lost tissue. The adult zebrafish harbours NSCs that are capable of
regenerating brain tissue after a traumatic injury through the activation of injury-
induced molecular programs and inflammation-related signalling (Kyritsis et al.,
2012). Fish adult NSCs share many characteristics with their mammalian
counterparts, like their position at the ventricular surface and radial glial features
(Adolf et al., 2006). It can, therefore, be hypothesized that adult NSCs in the
mammalian brain could respond positively to certain inflammatory signals, a
reaction that would be obscured by the more dramatic detrimental effects of
inflammatory cytokines on neurogenesis. Added to the controversy over evidences
indicating both positive and negative effects of inflammation and inflammatory
cytokines (Borsini et al., 2015) in the process of adult neurogenesis, effects on
mammalian NSCs have not been directly evaluated.
4.3. Tumour necrosis factor alpha (TNF-α) and progranulin (PGRN):
characteristics and signalling
The TNF ligand superfamily member pro-inflammatory cytokine TNF-α was
initially characterized as a molecule that could induce tumour regression through
the induction of cell death (Carswell et al., 1975). TNF-α mainly produced by
immune cells is prototypically involved in the innate immune response and
apoptosis, but it is a multifunctional protein expressed in many other cell types
with a broad range of activities in different systems and can exert different actions
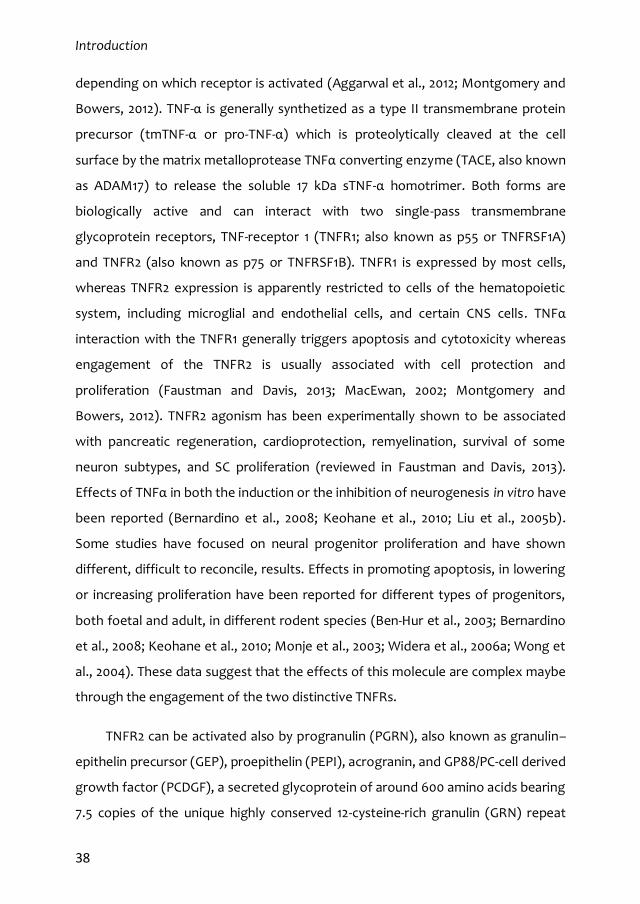
Introduction
38
depending on which receptor is activated (Aggarwal et al., 2012; Montgomery and
Bowers, 2012). TNF-α is generally synthetized as a type II transmembrane protein
precursor (tmTNF-α or pro-TNF-α) which is proteolytically cleaved at the cell
surface by the matrix metalloprotease TNFα converting enzyme (TACE, also known
as ADAM17) to release the soluble 17 kDa sTNF-α homotrimer. Both forms are
biologically active and can interact with two single-pass transmembrane
glycoprotein receptors, TNF-receptor 1 (TNFR1; also known as p55 or TNFRSF1A)
and TNFR2 (also known as p75 or TNFRSF1B). TNFR1 is expressed by most cells,
whereas TNFR2 expression is apparently restricted to cells of the hematopoietic
system, including microglial and endothelial cells, and certain CNS cells. TNFα
interaction with the TNFR1 generally triggers apoptosis and cytotoxicity whereas
engagement of the TNFR2 is usually associated with cell protection and
proliferation (Faustman and Davis, 2013; MacEwan, 2002; Montgomery and
Bowers, 2012). TNFR2 agonism has been experimentally shown to be associated
with pancreatic regeneration, cardioprotection, remyelination, survival of some
neuron subtypes, and SC proliferation (reviewed in Faustman and Davis, 2013).
Effects of TNFα in both the induction or the inhibition of neurogenesis in vitro have
been reported (Bernardino et al., 2008; Keohane et al., 2010; Liu et al., 2005b).
Some studies have focused on neural progenitor proliferation and have shown
different, difficult to reconcile, results. Effects in promoting apoptosis, in lowering
or increasing proliferation have been reported for different types of progenitors,
both foetal and adult, in different rodent species (Ben-Hur et al., 2003; Bernardino
et al., 2008; Keohane et al., 2010; Monje et al., 2003; Widera et al., 2006a; Wong et
al., 2004). These data suggest that the effects of this molecule are complex maybe
through the engagement of the two distinctive TNFRs.
TNFR2 can be activated also by progranulin (PGRN), also known as granulin–
epithelin precursor (GEP), proepithelin (PEPI), acrogranin, and GP88/PC-cell derived
growth factor (PCDGF), a secreted glycoprotein of around 600 amino acids bearing
7.5 copies of the unique highly conserved 12-cysteine-rich granulin (GRN) repeat
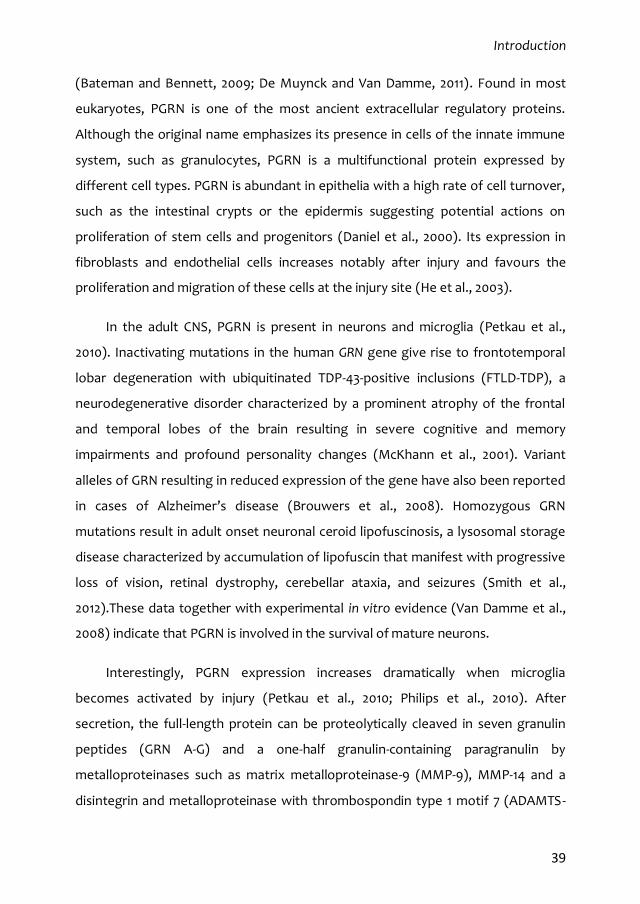
Introduction
39
(Bateman and Bennett, 2009; De Muynck and Van Damme, 2011). Found in most
eukaryotes, PGRN is one of the most ancient extracellular regulatory proteins.
Although the original name emphasizes its presence in cells of the innate immune
system, such as granulocytes, PGRN is a multifunctional protein expressed by
different cell types. PGRN is abundant in epithelia with a high rate of cell turnover,
such as the intestinal crypts or the epidermis suggesting potential actions on
proliferation of stem cells and progenitors (Daniel et al., 2000). Its expression in
fibroblasts and endothelial cells increases notably after injury and favours the
proliferation and migration of these cells at the injury site (He et al., 2003).
In the adult CNS, PGRN is present in neurons and microglia (Petkau et al.,
2010). Inactivating mutations in the human GRN gene give rise to frontotemporal
lobar degeneration with ubiquitinated TDP-43-positive inclusions (FTLD-TDP), a
neurodegenerative disorder characterized by a prominent atrophy of the frontal
and temporal lobes of the brain resulting in severe cognitive and memory
impairments and profound personality changes (McKhann et al., 2001). Variant
alleles of GRN resulting in reduced expression of the gene have also been reported
in cases of Alzheimer’s disease (Brouwers et al., 2008). Homozygous GRN
mutations result in adult onset neuronal ceroid lipofuscinosis, a lysosomal storage
disease characterized by accumulation of lipofuscin that manifest with progressive
loss of vision, retinal dystrophy, cerebellar ataxia, and seizures (Smith et al.,
2012).These data together with experimental in vitro evidence (Van Damme et al.,
2008) indicate that PGRN is involved in the survival of mature neurons.
Interestingly, PGRN expression increases dramatically when microglia
becomes activated by injury (Petkau et al., 2010; Philips et al., 2010). After
secretion, the full-length protein can be proteolytically cleaved in seven granulin
peptides (GRN A-G) and a one-half granulin-containing paragranulin by
metalloproteinases such as matrix metalloproteinase-9 (MMP-9), MMP-14 and a
disintegrin and metalloproteinase with thrombospondin type 1 motif 7 (ADAMTS-
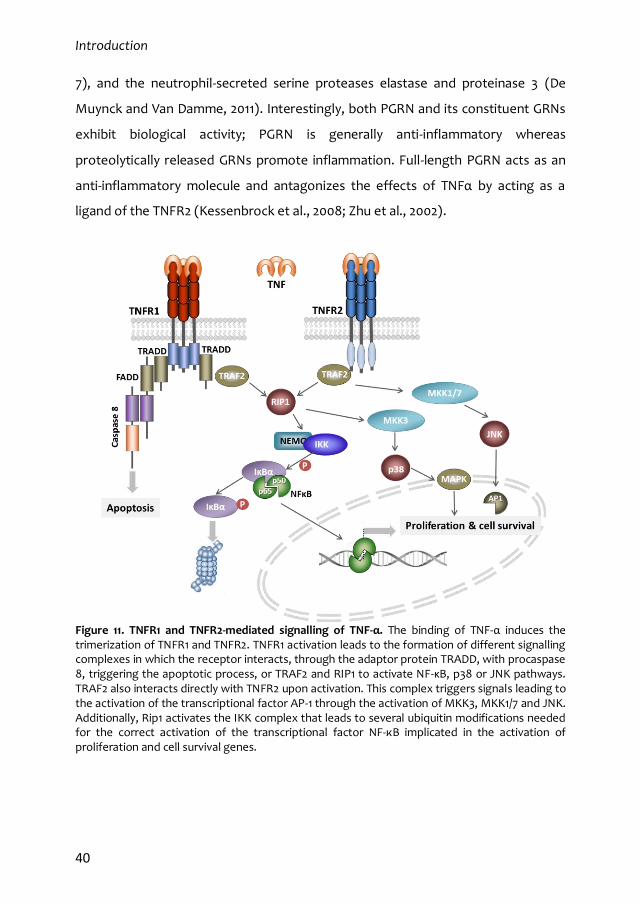
Introduction
40
7), and the neutrophil-secreted serine proteases elastase and proteinase 3 (De
Muynck and Van Damme, 2011). Interestingly, both PGRN and its constituent GRNs
exhibit biological activity; PGRN is generally anti-inflammatory whereas
proteolytically released GRNs promote inflammation. Full-length PGRN acts as an
anti-inflammatory molecule and antagonizes the effects of TNFα by acting as a
ligand of the TNFR2 (Kessenbrock et al., 2008; Zhu et al., 2002).
Figure 11. TNFR1 and TNFR2-mediated signalling of TNF-α. The binding of TNF-α induces the trimerization of TNFR1 and TNFR2. TNFR1 activation leads to the formation of different signalling complexes in which the receptor interacts, through the adaptor protein TRADD, with procaspase 8, triggering the apoptotic process, or TRAF2 and RIP1 to activate NF-κB, p38 or JNK pathways. TRAF2 also interacts directly with TNFR2 upon activation. This complex triggers signals leading to the activation of the transcriptional factor AP-1 through the activation of MKK3, MKK1/7 and JNK. Additionally, Rip1 activates the IKK complex that leads to several ubiquitin modifications needed for the correct activation of the transcriptional factor NF-κB implicated in the activation of proliferation and cell survival genes.
Introduction
41
TNF receptors lack catalytic activity, but their cytoplasmic domains can, upon
ligand engagement, induce the assembly of adaptor proteins that mediate the
intracellular responses. TNFR1, but not TNFR2 has a death domain that allows the
association of the TNF receptor-associated death domain (TRADD) and subsequent
recruitment of Fas-associated death domain (FADD), DED caspases, and induction
of apoptosis. In addition to caspase activation through TNFR1, cytoplasmic
association of TNF receptor-associated factor 2 (TRAF2) and cellular inhibitors of
apoptosis (cIAP 1 and 2) to TNF-R1-bound TRADD or to TNF-R2 directly, results in
the activation of receptor interacting protein (RIP) and induction of downstream
nuclear factor kappa B (NFκB), or in the activation of mitogen-activated protein
kinases (MAPK) or stress-activated protein kinases (SAPKs) JNK and p38 (Cabal-
Hierro and Lazo, 2012; Escos et al., 2016; Gaestel, 2006; Wajant et al., 2003) (Figure
11).
Initially discovered in the immune system where NF-kB-regulated gene
expression is essential for the processes of inflammation and host defense, NF-kB
comprises a group of dimeric transcription factors which have demonstrated to
play a major role in various aspects of brain function. NF-kB transcription factors
are expressed throughout the brain in both in neurons and glial cells and are
present in neurogenic areas, suggesting potential roles in NSC behavior (Aggarwal,
2000; Sethi et al., 2008). NF-kB controls the expression of numerous genes
involved in cell division, apoptosis, and inflammation (Chen and Green, 2004), but
has never been implicated in stem cell self-renewal. Before stimulation, the family
of transcription factors Rel/ NF-kB is retained in the cytoplasm in a latent form by
association with inhibitor proteins of the inhibitor kB (IkB) family, with the most
common neuronal species being the p50–p65 heterodimer and the p50–p50
homodimer. Of the five mammalian proteins of the Rel/NF-kB family (NF-kB 1/p50,
p105, NF-kB 2/p49/52, p100, RelA/p65, RelB and c-Rel), only p65 (RelA) is expressed
by B cells of the adult SEZ (Denis-Donini et al., 2005). The canonical mechanism of
NF-kB activation involves phosphorylation of the inhibitory IkB subunit by the IkB
Introduction
42
kinase complex (IKK) leading to its ubiquitination and subsequent proteasomal
degradation, thereby releasing the active NF-kB factor dimmer. Free Rel/NF-kB
then moves to the nucleus where it activates transcription of target genes (Widera
et al., 2006a; Widera et al., 2006b).
The binding of TNF-α to cell surface receptors engages other signal
transduction pathways, including three groups of mitogen-activated protein
kinases (MAPK): extracellular-signal-regulated kinases (ERKs); and the stress-
activated protein kinases (SAPK) c-Jun N-terminal (JNK) and p38 kinases
(Bogoyevitch et al., 2010; Sabio and Davis, 2014). TNF-induced activation of the JNK
and p38 pathways occurs through a non-apoptotic TRAF2-dependent pathway.
MAP kinase pathways share a common structure formed by three sequentially
acting protein kinases, generally including a MAP kinase kinase (MAP2K or MKK)
and a MKK kinase (MAP3K or MKKK) (Sabio and Davis, 2014). JNK and p38
pathways are engaged by similar MAP3K isoforms, but diverge during the
activation of MAP2K isoforms that selectively activate them. The JNK family
includes three members (JNK1, JNK2, and JNK3) and four members of the p38 MAP
kinase family have been identified (p38α, p38β, p38γ, and p38δ) (Gaestel, 2006;
Sabio and Davis, 2014). The different JNK isoforms are activated by dual
phosphorylation (Lee et al., 1997; Wajant et al., 2003; Yeh et al., 1997). JNK is
activated by the MAP2K isoforms MKK4 and MKK7. MKK4 and MKK7 preferentially
phosphorylate JNK on tyrosine and threonine, respectively and efficient dual
phosphorylation therefore requires collaborative actions of both kinases. Indeed,
compound MKK4/7-deficiency prevents TNFα-stimulated JNK activation (Tournier
et al., 2001; Wajant et al., 2003). Upon activation, JNKs translocate into the nucleus
and phosphorylate, thereby enhancing, the activity of transcription factors c-Jun,
AP-1 or ATF2 (Chang and Karin, 2001; Shaulian and Karin, 2002). TNF not only
robustly activates the JNK-inducing MAP kinase cascade, but also the p38-MAPK
signalling cascade (Gaestel, 2015). The p38 MAP kinases can be activated by MKK3,
MKK4, and MKK6 in vitro, but p38 MAP kinase activation in vivo is primarily
Introduction
43
mediated by MKK3 and MKK6 (Brancho et al., 2003). The activation of p38 MAP
kinases (by MKK3 and MKK6) and JNK (by MKK4 and MKK7) is induced by
members of the MAP3K protein kinase family. Roles for ASK1, MEKK, MLK, TAK1,
and TPL2 isoforms of MAP3K in the TNFα response have been reported. The
relative importance of these pathways appears to be cell type-dependent and
context-specific. Mechanisms that account for the selective involvement of these
MAP3K isoforms in TNFα signalling have not been completely defined (Sabio and
Davis, 2014).


Objectives

Objectives
47
Tissue-specific SCs appear co-exist in two states of activation in most adult niches,
but the transitions between these states as well as their regulation remain largely
unknown. Moreover, some adult SCs appear to respond to remote injuries in ways
that are not fully understood. This work proposes the hypothesis that adult NSCs
react to inflammatory signals triggered in the periphery by modifying their
activation state within the stem cell quiescence cycle.
The specific objectives proposed to test this hypothesis are:
1.- Development of a cell cytometry-based protocol for the prospective
identification and analysis of adult subependymal NSCs and their progeny.
2.- Characterization of the quiescent cell cycle of adult subependymal NSCs during
regeneration and in response to inflammation.
3.- Analysis of the effects of the inflammatory mediators TNF-α and progranulin and
their common receptor TNFR2 on NSCs.


Material and methods

Material and methods
51
1. Experimental animals
1.1. Mice handling
All animals used along this thesis were acquired from Charles River
Laboratories and then were breed and housed at the local animal housing facility
(University of Valencia, Burjassot) according to the European Union 86/609/EEC
and Spanish RD-1201/2005 guidelines and under official veterinary supervision. All
experimental procedures with animals were approved by the corresponding local
ethics committee.
When performance of highly invasive techniques was inevitable, mice were
prior deeply anesthetized by intraperitoneal (i.p) injection of a mixture of
medetomidine (0.5-1 mg per gram of body weight) and ketamine (50-75 mg per
gram of body weight) diluted in saline solution (0.09% NaCl).
1.2. Mice strains
All experiments were done using adult mice of 2 to 4 months of age in all
cases. The following mouse strains were used along this thesis:
- C57BI6 (WT): wild-type strain used as a source of biological samples along
the different in vivo or in vitro experiments. These mice were also used as a
control reference to compare with genetically modified mice strains.
- B6;129S-Tnfrsf1atm1Imx/J (R1KO): null mutant mice lacking Tnfrsf1a (TNFR1)
gene expression. The mice colony was kept in homozygosis.
- B6;129S-Tnfrsf1btm1Imx/J (R2KO): null mutant mice lacking Tnfrsf1b (TNFR2)
gene expression. The mice colony was kept either in homozygosis or in
heterozygosis and inter-crossed to generate homozygous mice.
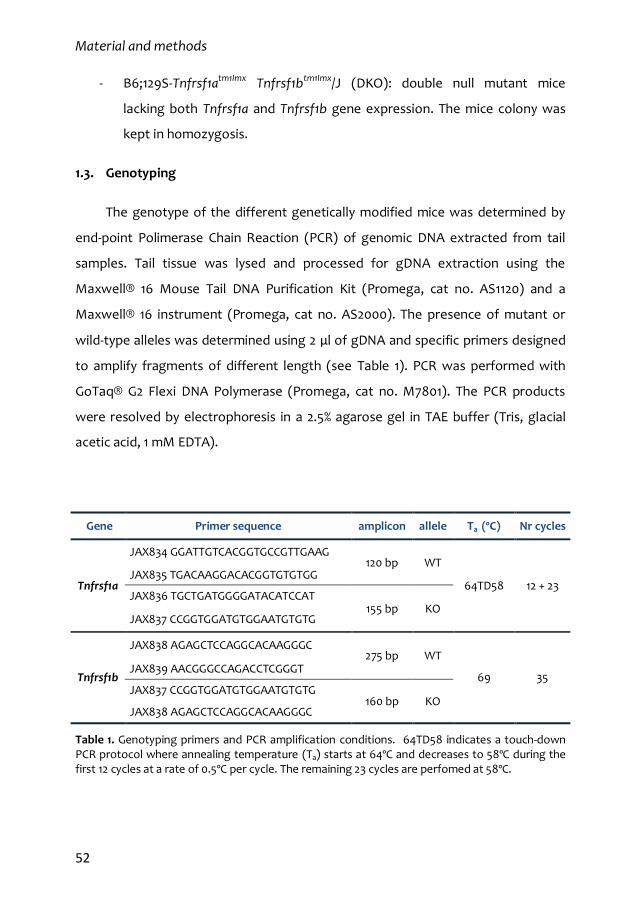
Material and methods
52
- B6;129S-Tnfrsf1atm1Imx Tnfrsf1btm1Imx/J (DKO): double null mutant mice
lacking both Tnfrsf1a and Tnfrsf1b gene expression. The mice colony was
kept in homozygosis.
1.3. Genotyping
The genotype of the different genetically modified mice was determined by
end-point Polimerase Chain Reaction (PCR) of genomic DNA extracted from tail
samples. Tail tissue was lysed and processed for gDNA extraction using the
Maxwell® 16 Mouse Tail DNA Purification Kit (Promega, cat no. AS1120) and a
Maxwell® 16 instrument (Promega, cat no. AS2000). The presence of mutant or
wild-type alleles was determined using 2 μl of gDNA and specific primers designed
to amplify fragments of different length (see Table 1). PCR was performed with
GoTaq® G2 Flexi DNA Polymerase (Promega, cat no. M7801). The PCR products
were resolved by electrophoresis in a 2.5% agarose gel in TAE buffer (Tris, glacial
acetic acid, 1 mM EDTA).
Gene Primer sequence amplicon allele Ta (ºC) Nr cycles
Tnfrsf1a
JAX834 GGATTGTCACGGTGCCGTTGAAG 120 bp WT
64TD58 12 + 23 JAX835 TGACAAGGACACGGTGTGTGG
JAX836 TGCTGATGGGGATACATCCAT 155 bp KO
JAX837 CCGGTGGATGTGGAATGTGTG
Tnfrsf1b
JAX838 AGAGCTCCAGGCACAAGGGC 275 bp WT
69 35 JAX839 AACGGGCCAGACCTCGGGT
JAX837 CCGGTGGATGTGGAATGTGTG 160 bp KO
JAX838 AGAGCTCCAGGCACAAGGGC
Table 1. Genotyping primers and PCR amplification conditions. 64TD58 indicates a touch-down PCR protocol where annealing temperature (Ta) starts at 64ºC and decreases to 58ºC during the first 12 cycles at a rate of 0.5ºC per cycle. The remaining 23 cycles are perfomed at 58ºC.
Material and methods
53
2. In vivo methods
2.1. Drug administration
Different drugs were administered for in vivo experiments:
- Lipopolysaccharide (LPS) (from E. Coli O111:B4, Sigma, cat no. L2630) was
reconstituted at 1 mg/ml in saline solution and intraperitoneally injected at
a single dose of 5 mg/kg.
- Temozolomide (TMZ) (Sigma, cat no. T2577) was reconstituted at 10 mg/ml
in 25% DMSO saline solution and heated at 65oC until it was dissolved.
Room temperature (RT) TMZ was intraperitoneally administered at 100
mg/kg/day for 3 consecutive days.
2.2. In vivo labelling of proliferating SEZ cells by thymidine analogues
administration
Mitotically active cells that reside in the SEZ differ in their proliferative state
and cell cycle kinetics, a property that has been extensively used to distinguish
slow-cycling NSCs from highly proliferative TAPs and neuroblasts. In order to
evaluate the proliferative state of NSCs, mice first received a regimen of seven i.p.
injections (one every 2 h) with 10 mg/ml 5-Chloro-2’-deoxyuridine (CldU; Sigma, cat
no. C6891) in saline solution (0.09% NaCl) dispensing a final dose of 50 mg of
thymidine analogues per Kg. After 28 days, highly proliferative cells are expected
to have diluted the incorporated CldU into their progeny, while slow-cycling cells,
mainly active NSCs, are expected to retain the label defining this population as LRC
(Porlan et al., 2014). Finally, to score all the proliferating cells, a single i.p. pulse of
10 mg/mL 5-Iodo-2’-deoxyuridine (IdU; Sigma, cat no. I7125) diluted in saline
solution with 40% dimethyl sulfoxide was administered i.p. 1 h prior of sacrifice.
Material and methods
54
2.3. Perfusion and histology
In order to preserve brain structures and cell integrity for the subsequent
histological analysis, mice were transcardially perfused with 27.5 mL of saline
solution followed by 82.5-110 mL of 4% paraformaldehyde (PFA) in 0.1M Phosphate
Buffer Saline (PBS) at a flow rate of 5.5 mL/min. Then, brains were extracted and
post-fixed in 4% PFA during another hour at RT. After washing the tissue with
abundant PBS, brains were included in warm 2% agar solution and cooled until
solidification. Serially collected coronal sections of 30 µm of thickness were
obtained in a Leica VT1000 vibratome and kept in PBS-0.05% azide at 4ºC until the
analysis.
2.4. Immunohistochemistry (IHC)
Prior to specific antigen detection with primary antibodies, potential
unspecific binding sites were neutralized incubating the tissue slices in blocking
solution (5% Foetal Bovine Serum (FBS), 1% Glycine, 1% Bovine Serum Albumin (BSA),
0.1-0.2% TritonTM X-100 (TX-100) and 0.05% azide in 0.1M phosphate buffer (PB)) for 1
h at room temperature. Next, samples were incubated with primary antibodies
diluted in blocking solution (see Annex 1) at 4ºC for 24 h. After 3 washes with 0.1M
PB, primary antibodies were detected with fluorescent-labelled secondary
antibodies (see Annex 1) diluted in blocking buffer and incubated for 1 h at RT.
Finally, cell nuclei were stained with 4’,6-diamidine-2’-phenylindole dihydrochloride
(DAPI; 1 mg/mL in distilled water) during 5 min. Labelled tissue was extended over
glass microscope slides and mounted with FluoromountG (Electron Microscopy
Sciences, cat. no. 17984) medium.
For detection of thymidine analogues, an initial step of chromatin
denaturalization was required so the tissue was previously incubated in 2N HCl for
20 min at 37ºC. Then acid pH was neutralized with 0.1 M sodium borate buffer
pH8.5 and before the blocking step, tissue was extendedly washed with 0.1 M PB.
Material and methods
55
2.5. SEZ cell counting
For the counting of the GFAP/Ki67/EGFR population, immunostained slide
series containing the anterior horn of lateral ventricles were photographed in an
Olympus FluoView FV10i confocal laser scanning microscope equipped with 405,
458, 488 and 633 nm lasers and images were processed using FV10-ASW 2.1 viewer
software. Cell populations were manually counted and data was obtained as a
percentage of positive cells relative to a subpopulation or total cells (DAPI count)
in the lateral ventricle wall.
CldU+, IdU+ and CldU/IdU+ cells laying the ventricle were manually counted in
two entire series of tissue (10-11 slices) under a fluorescence microscope (NIKON
eclipse Ni) and the number of total cells of each type in the SEZ was estimated
applying the Cavalieri method, which takes into account the number of cells
counted, the number of tissue slices counted, the number of total tissue series and
the slice thickness.
2.6. SEZ dissection
Adult mice were sacrificed by cervical dislocation. Figure 12 illustrates the
step-by-step procedure of SEZ dissection. The brain was removed (Figure 12a) and
placed in a plate with ice-cold PBS (Biowest, cat no. X0515) where we discarded the
olfactory bulbs and cerebellum to obtain a 4-5 mm thick slice that contains the
lateral ventricles (Figure 12b). Both hemispheres were then separated for fine
dissection (Figure 12c). First, the tissue was opened following the corpus callosum
line (Figure 12d) separating the hippocampus, septum and diencephalon from the
cortex and exposing the SEZ (Figure 12e). Next, the SEZ area was delimited by
removing the surrounding tissue using as reference the white matter tracts (corpus
callosum dorsal and anterior capsule/stria terminalis ventral to the SEZ) (Figures
12f-i). Finally, the SEZ block was finely cut under the surface of the ventricle wall to
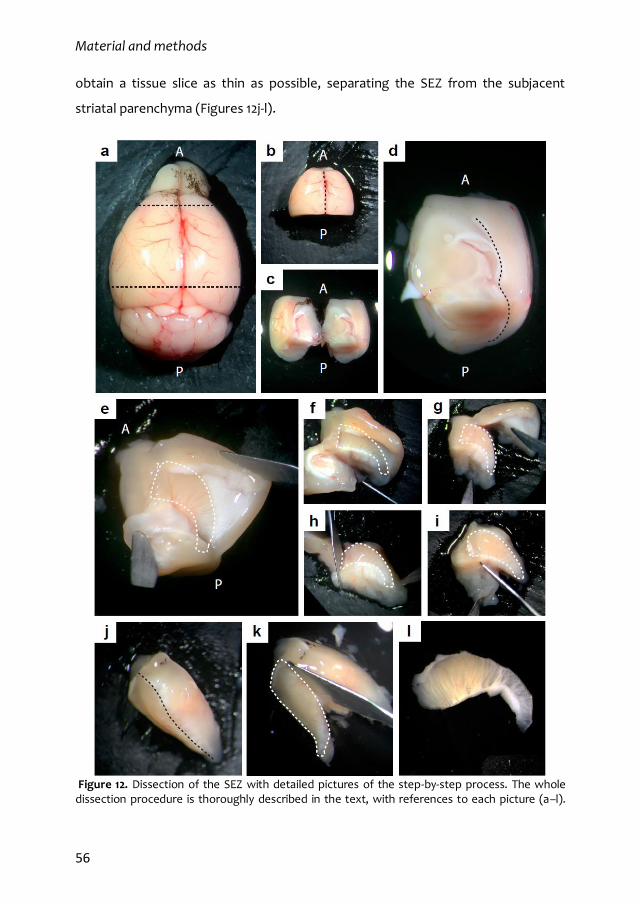
Material and methods
56
obtain a tissue slice as thin as possible, separating the SEZ from the subjacent
striatal parenchyma (Figures 12j-l).
Figure 12. Dissection of the SEZ with detailed pictures of the step-by-step process. The whole dissection procedure is thoroughly described in the text, with references to each picture (a–l).
Material and methods
57
Black dashed lines mark where to cut while white dashed lines plot the shape of the SEZ. A: anterior region, P: posterior region.
2.7. SEZ wholemount preparations and analysis of migrating neuroblasts
Migrating neuroblast chains were directly analysed in the intact SEZ as whole-
mount preparations. After dissection, fresh tissue was fixed and permeated in PFA
4% with 0.5% Tx-100 at 4oC. The next day, the tissue was washed three times with
0.5% Tx-100 PBS and incubated for 1 h in blocking buffer (0.5% Tx-100, 10% FBS in
PBS). Primary antibodies (see Annex 1) were added to fresh blocking buffer and
SEZ samples were incubated at 4ºC for 2 days. After washing three times with 0.1%
Tx-100 PBS, fluorescent-labelled secondary antibodies were incubated in blocking
buffer at 4ºC. The following day, the tissue was washed and incubated with 1 μg/ml
DAPI in 0.1% Tx-100 for 10 minutes. Finally, wholemount preparations were
mounted in abundant FluorMount-GT medium. The whole SEZ area was
photographed in a Fluoview FV10iW confocal microscope (Olympus) and the SEZ
area occupied by DCX+ chains was quantified using the image J analysis software.
2.8. SEZ dissociation, flow cytometry analysis and MACS® separation
In order to preserve antigen integrity and reduce the presence of debris or
dead cells, the preparation of SEZ samples was optimized for flow cytometry
analysis or cell sorting. After dissection, both SEZs from each mice were minced
and enzymatically digested at 37oC for 20 min with 1 ml of enzymatic mix (Hanks
balanced salt solution (HBSS) without Calcium and Magnesium, 10 mM HEPES, 0.4
mM EDTA and 1:10 Trypsin/EDTA (GIBCO-BRL, cat no. 25200-056)). Digestion was
quenched with 3 ml of 100 μg/ml trypsin inhibitor (Sigma, cat no. T6522) diluted in
washing medium (0.6% Glucose, 0.1% NaHCO3, 5 mM HEPES, 2 mM L-glutamine, 0.4%
BSA, 1X Antibiotic/Antimicotic in DMEM/F-12) and the digested pieces were
centrifuged at 15 xg for 5 min. After removing the medium, remaining tissue was
mechanically dissociated in 2 ml of washing medium with 10 μg/ml DNase I (Roche,
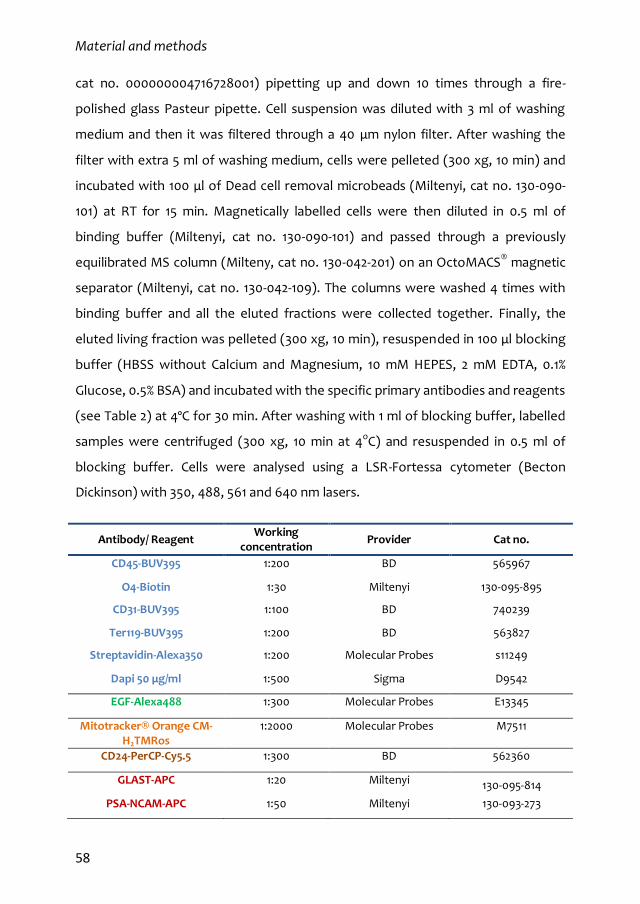
Material and methods
58
cat no. 000000004716728001) pipetting up and down 10 times through a fire-
polished glass Pasteur pipette. Cell suspension was diluted with 3 ml of washing
medium and then it was filtered through a 40 μm nylon filter. After washing the
filter with extra 5 ml of washing medium, cells were pelleted (300 xg, 10 min) and
incubated with 100 μl of Dead cell removal microbeads (Miltenyi, cat no. 130-090-
101) at RT for 15 min. Magnetically labelled cells were then diluted in 0.5 ml of
binding buffer (Miltenyi, cat no. 130-090-101) and passed through a previously
equilibrated MS column (Milteny, cat no. 130-042-201) on an OctoMACS® magnetic
separator (Miltenyi, cat no. 130-042-109). The columns were washed 4 times with
binding buffer and all the eluted fractions were collected together. Finally, the
eluted living fraction was pelleted (300 xg, 10 min), resuspended in 100 μl blocking
buffer (HBSS without Calcium and Magnesium, 10 mM HEPES, 2 mM EDTA, 0.1%
Glucose, 0.5% BSA) and incubated with the specific primary antibodies and reagents
(see Table 2) at 4ºC for 30 min. After washing with 1 ml of blocking buffer, labelled
samples were centrifuged (300 xg, 10 min at 4oC) and resuspended in 0.5 ml of
blocking buffer. Cells were analysed using a LSR-Fortessa cytometer (Becton
Dickinson) with 350, 488, 561 and 640 nm lasers.
Antibody/ Reagent Working
concentration Provider Cat no.
CD45-BUV395 1:200 BD 565967
O4-Biotin 1:30 Miltenyi 130-095-895
CD31-BUV395 1:100 BD 740239
Ter119-BUV395 1:200 BD 563827
Streptavidin-Alexa350 1:200 Molecular Probes s11249
Dapi 50 μg/ml 1:500 Sigma D9542
EGF-Alexa488 1:300 Molecular Probes E13345
Mitotracker® Orange CM-H2TMRos
1:2000 Molecular Probes M7511
CD24-PerCP-Cy5.5 1:300 BD 562360
GLAST-APC 1:20 Miltenyi 130-095-814
PSA-NCAM-APC 1:50 Miltenyi 130-093-273
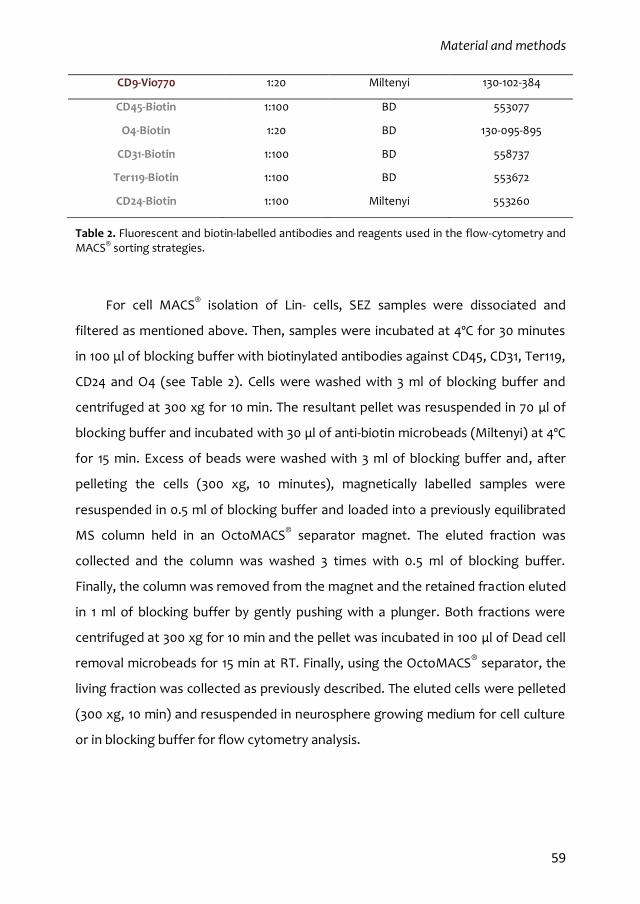
Material and methods
59
CD9-Vio770 1:20 Miltenyi 130-102-384
CD45-Biotin 1:100 BD 553077
O4-Biotin 1:20 BD 130-095-895
CD31-Biotin 1:100 BD 558737
Ter119-Biotin 1:100 BD 553672
CD24-Biotin 1:100 Miltenyi 553260
Table 2. Fluorescent and biotin-labelled antibodies and reagents used in the flow-cytometry and MACS® sorting strategies.
For cell MACS® isolation of Lin- cells, SEZ samples were dissociated and
filtered as mentioned above. Then, samples were incubated at 4ºC for 30 minutes
in 100 μl of blocking buffer with biotinylated antibodies against CD45, CD31, Ter119,
CD24 and O4 (see Table 2). Cells were washed with 3 ml of blocking buffer and
centrifuged at 300 xg for 10 min. The resultant pellet was resuspended in 70 μl of
blocking buffer and incubated with 30 μl of anti-biotin microbeads (Miltenyi) at 4ºC
for 15 min. Excess of beads were washed with 3 ml of blocking buffer and, after
pelleting the cells (300 xg, 10 minutes), magnetically labelled samples were
resuspended in 0.5 ml of blocking buffer and loaded into a previously equilibrated
MS column held in an OctoMACS® separator magnet. The eluted fraction was
collected and the column was washed 3 times with 0.5 ml of blocking buffer.
Finally, the column was removed from the magnet and the retained fraction eluted
in 1 ml of blocking buffer by gently pushing with a plunger. Both fractions were
centrifuged at 300 xg for 10 min and the pellet was incubated in 100 μl of Dead cell
removal microbeads for 15 min at RT. Finally, using the OctoMACS® separator, the
living fraction was collected as previously described. The eluted cells were pelleted
(300 xg, 10 min) and resuspended in neurosphere growing medium for cell culture
or in blocking buffer for flow cytometry analysis.
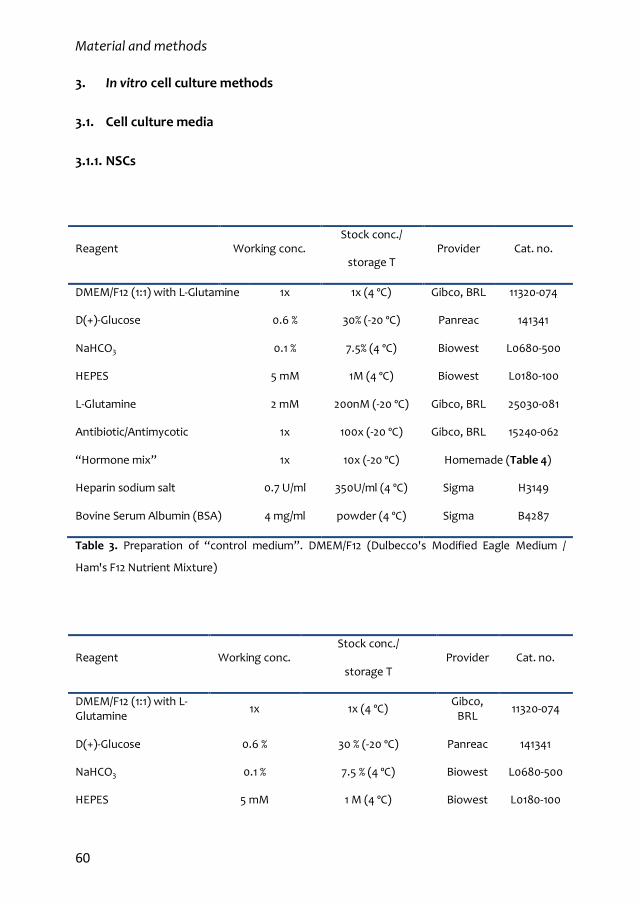
Material and methods
60
3. In vitro cell culture methods
3.1. Cell culture media
3.1.1. NSCs
Reagent Working conc. Stock conc./
storage T Provider Cat. no.
DMEM/F12 (1:1) with L-Glutamine 1x 1x (4 ºC) Gibco, BRL 11320-074
D(+)-Glucose 0.6 % 30% (-20 ºC) Panreac 141341
NaHCO3 0.1 % 7.5% (4 ºC) Biowest L0680-500
HEPES 5 mM 1M (4 ºC) Biowest L0180-100
L-Glutamine 2 mM 200nM (-20 ºC) Gibco, BRL 25030-081
Antibiotic/Antimycotic 1x 100x (-20 ºC) Gibco, BRL 15240-062
“Hormone mix” 1x 10x (-20 ºC) Homemade (Table 4)
Heparin sodium salt 0.7 U/ml 350U/ml (4 ºC) Sigma H3149
Bovine Serum Albumin (BSA) 4 mg/ml powder (4 ºC) Sigma B4287
Table 3. Preparation of “control medium”. DMEM/F12 (Dulbecco's Modified Eagle Medium /
Ham's F12 Nutrient Mixture)
Reagent Working conc. Stock conc./
storage T Provider Cat. no.
DMEM/F12 (1:1) with L-Glutamine
1x 1x (4 ºC) Gibco,
BRL 11320-074
D(+)-Glucose 0.6 % 30 % (-20 ºC) Panreac 141341
NaHCO3 0.1 % 7.5 % (4 ºC) Biowest L0680-500
HEPES 5 mM 1 M (4 ºC) Biowest L0180-100
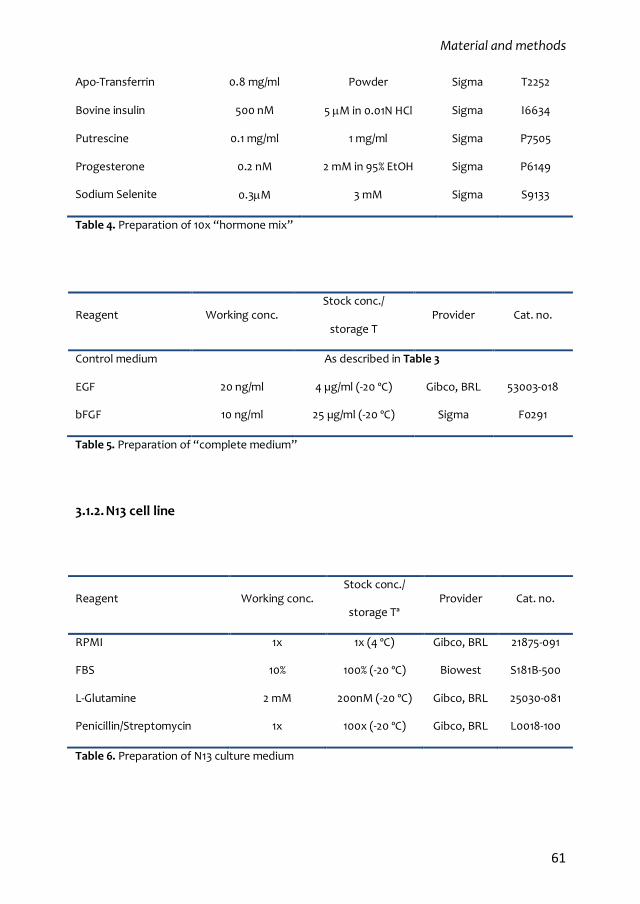
Material and methods
61
Apo-Transferrin 0.8 mg/ml Powder Sigma T2252
Bovine insulin 500 nM 5 M in 0.01N HCl Sigma I6634
Putrescine 0.1 mg/ml 1 mg/ml Sigma P7505
Progesterone 0.2 nM 2 mM in 95% EtOH Sigma P6149
Sodium Selenite 0.3M 3 mM Sigma S9133
Table 4. Preparation of 10x “hormone mix”
Reagent Working conc. Stock conc./
storage T Provider Cat. no.
Control medium As described in Table 3
EGF 20 ng/ml 4 µg/ml (-20 ºC) Gibco, BRL 53003-018
bFGF 10 ng/ml 25 µg/ml (-20 ºC) Sigma F0291
Table 5. Preparation of “complete medium”
3.1.2. N13 cell line
Reagent Working conc. Stock conc./
storage Tª Provider Cat. no.
RPMI 1x 1x (4 ºC) Gibco, BRL 21875-091
FBS 10% 100% (-20 ºC) Biowest S181B-500
L-Glutamine 2 mM 200nM (-20 ºC) Gibco, BRL 25030-081
Penicillin/Streptomycin 1x 100x (-20 ºC) Gibco, BRL L0018-100
Table 6. Preparation of N13 culture medium
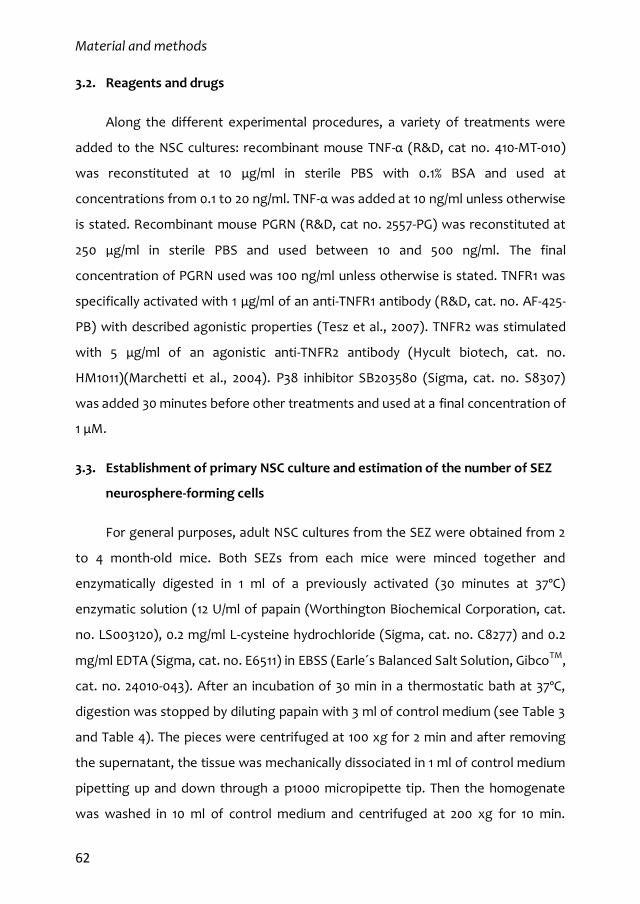
Material and methods
62
3.2. Reagents and drugs
Along the different experimental procedures, a variety of treatments were
added to the NSC cultures: recombinant mouse TNF-α (R&D, cat no. 410-MT-010)
was reconstituted at 10 μg/ml in sterile PBS with 0.1% BSA and used at
concentrations from 0.1 to 20 ng/ml. TNF-α was added at 10 ng/ml unless otherwise
is stated. Recombinant mouse PGRN (R&D, cat no. 2557-PG) was reconstituted at
250 μg/ml in sterile PBS and used between 10 and 500 ng/ml. The final
concentration of PGRN used was 100 ng/ml unless otherwise is stated. TNFR1 was
specifically activated with 1 μg/ml of an anti-TNFR1 antibody (R&D, cat. no. AF-425-
PB) with described agonistic properties (Tesz et al., 2007). TNFR2 was stimulated
with 5 μg/ml of an agonistic anti-TNFR2 antibody (Hycult biotech, cat. no.
HM1011)(Marchetti et al., 2004). P38 inhibitor SB203580 (Sigma, cat. no. S8307)
was added 30 minutes before other treatments and used at a final concentration of
1 μM.
3.3. Establishment of primary NSC culture and estimation of the number of SEZ
neurosphere-forming cells
For general purposes, adult NSC cultures from the SEZ were obtained from 2
to 4 month-old mice. Both SEZs from each mice were minced together and
enzymatically digested in 1 ml of a previously activated (30 minutes at 37ºC)
enzymatic solution (12 U/ml of papain (Worthington Biochemical Corporation, cat.
no. LS003120), 0.2 mg/ml L-cysteine hydrochloride (Sigma, cat. no. C8277) and 0.2
mg/ml EDTA (Sigma, cat. no. E6511) in EBSS (Earle´s Balanced Salt Solution, GibcoTM,
cat. no. 24010-043). After an incubation of 30 min in a thermostatic bath at 37ºC,
digestion was stopped by diluting papain with 3 ml of control medium (see Table 3
and Table 4). The pieces were centrifuged at 100 xg for 2 min and after removing
the supernatant, the tissue was mechanically dissociated in 1 ml of control medium
pipetting up and down through a p1000 micropipette tip. Then the homogenate
was washed in 10 ml of control medium and centrifuged at 200 xg for 10 min.
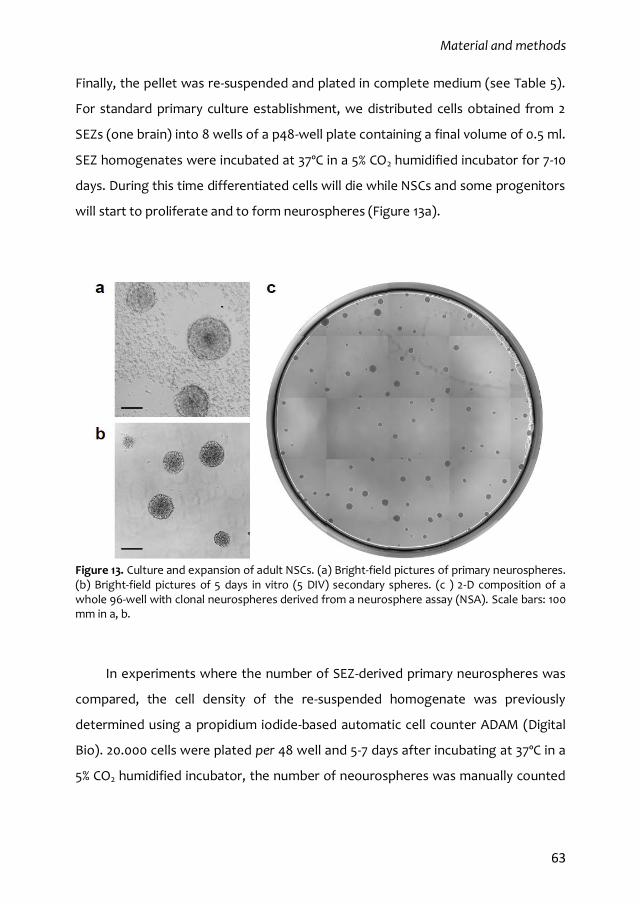
Material and methods
63
Finally, the pellet was re-suspended and plated in complete medium (see Table 5).
For standard primary culture establishment, we distributed cells obtained from 2
SEZs (one brain) into 8 wells of a p48-well plate containing a final volume of 0.5 ml.
SEZ homogenates were incubated at 37ºC in a 5% CO2 humidified incubator for 7-10
days. During this time differentiated cells will die while NSCs and some progenitors
will start to proliferate and to form neurospheres (Figure 13a).
Figure 13. Culture and expansion of adult NSCs. (a) Bright-field pictures of primary neurospheres. (b) Bright-field pictures of 5 days in vitro (5 DIV) secondary spheres. (c ) 2-D composition of a whole 96-well with clonal neurospheres derived from a neurosphere assay (NSA). Scale bars: 100 mm in a, b.
In experiments where the number of SEZ-derived primary neurospheres was
compared, the cell density of the re-suspended homogenate was previously
determined using a propidium iodide-based automatic cell counter ADAM (Digital
Bio). 20.000 cells were plated per 48 well and 5-7 days after incubating at 37ºC in a
5% CO2 humidified incubator, the number of neourospheres was manually counted
Material and methods
64
on an inverted microscope with phase contrast optics. The total number of primary
neurospheres per SEZ was estimated using the formula (N/C) x S where:
N: is the average number of neurospheres per well.
C: is the number of viable cells seeded per well.
S: is the total number of viable cells per SEZ.
3.4. Subculture and bulk expansion of established NSC cultures
Once primary neurospheres are obtained from the SEZ tissue, they can be
expanded for extended periods of time by dissociating them after 4-7 days and
seeding individual cells under the same conditions.
Grown neurospheres were transferred to a 15 ml conical tube and centrifuged
5 min at 100-130 xg depending on the overall neurosphere size. Pelleted cells were
dissociated with 200 μl of Accutase® solution (Sigma, cat. no. A6964). After 10 min
at RT, Accutase® was diluted with 800 μl of control medium and neurospheres
were mechanically dissociated by thoroughly pipetting 10-15 times with a p1000
micropipette. After washing the cell suspension in 8-10 ml with control medium,
individual cells were centrifuged 10 min at 200 xg. The resultant pellet was re-
suspended in complete medium to estimate the concentration of viable cells using
the automatic ADAM cell counter system.
For culture passage and bulk expansion, 10.000-viable cells/cm2 were seeded
on fresh pre-warmed complete medium and incubated at 37ºC in a 5% CO2
humidified incubator. After 5-7 days, new neurospheres were ready for
subculturing (Figure 13b).
3.5. The neurosphere formation assay (NSA)
Proliferation and self-renewal of NSCs was assessed evaluating the ability of
individual cells to generate new neurospheres. After obtaining a single cell
suspension as mentioned above, cells were plated at pseudo-clonal density (5
Material and methods
65
cel/μl) seeding 1000 cells in 200 μl of complete medium per 96 well. When different
treatments were evaluated, cells were prepared at twice the concentration
required (10 cel/ μl) to plate cells in 100 μl of complete medium and mix them with
the same volume of double concentrated treatment diluted in complete medium as
well. After 5-6 days at 37ºC in a 5% CO2 humidified incubator, neurospheres were
manually counted on an inverted microscope under phase contrast optics. For
diameter assessment, neurospheres were photographed in an INCELL Analyzer
2000 (General Electric) (Figure 13c) and sphere diameter was measured by image
analysis using the Image J software.
An increase in self-renewal might not lead to higher number of neurospheres
in a NSA, but obtained neurospheres would be enriched in NSCs. Consequently, if
these neurospheres are dissociated and submitted to a second round of NSA, more
secondary neurospheres will be scored revealing the phenotype. In parallel, from
the same original cell suspension, NSC were plated in 24-well plates by seeding
25,000 in 1 ml of NSC complete medium per well. The different treatments were
added to each well maintaining the final volume of 1 ml. After 5 days at 37ºC in a 5%
CO2 humidified incubator neurospheres were collected from the 24-well plates and
dissociated with 40 μl of Accutase® solution as previously described. Accutase®
was diluted with 160 μl of complete medium and after obtaining a single cell
suspension and estimating the number of viable cells, a second round of NSA assay
was set up as mentioned above.
3.6. Activated microglia conditioned medium and immunodepletion of TNF-α
N13 microglia cells were grown in their specific culture medium (see Table 6)
at 37ºC in a 5% CO2 humidified incubator and passed every 2-3 days with
Trypsin/EDTA (T/E) (Gibco-BRL, cat no. 25200-056). For NSC medium conditioning,
400.000 cells were plated in a 6-well plate and the next day the cells were
stimulated to a pro-inflammatory M0 state with 250 ng/ml LPS. After 3 h, the
growth medium containing LPS was removed and the cells were washed twice
Material and methods
66
with abundant PBS. Next, 3 ml of NSC control medium without BSA were
conditioned for 24 h. Finally, the conditioned media was collected and filtered
through a 0.45 μm pore-size filter.
The conditioned media was incubated with 2.5 μg/ml of anti-TNF-α antibody
(Abcam, cat no. ab1793) or with a non-related antibody (anti-Nestin antibody,
Abcam, cat no. ab6142) at the same concentration overnight at 4ºC in constant
agitation. The next day, 40 μl of previously washed Dynabeads® Protein G (Life
technologies, cat no. 10003D,) were added to the medium for an additional
incubation of 1 h at 4ºC in constant agitation. Finally, Dynabeads® were
magnetically removed from the media using a DYNAL® magnet (Invitrogen). The
resultant conditioned media was diluted 1:4 in fresh NSC complete medium for
treatment of NSC cultures in a neurosphere assay.
3.7. Cell viability assessment by MTS assay
Viability of NSCs in the presence of TNF-α was measured by MTS
determination using the CellTiter 96® Aqueous Non-radioactive Cell Proliferation
Assay (Promega, cat. No G5421). 5000 cells were plated in a 96-well with 100 μl of
complete medium and incubated at different time points with a MTS/PMS working
solution (20:1) at 37ºC in a 5% CO2 humidified incubator. Absorbance at 490nm of
each well was measured after 1 h in a Victor®3 Multilabel Plate Reader
(PerkinElmer). Each experimental point was done by triplicate and the cell viability
was calculated with the formula (tx A490 – blank A490/ t0 A490 – blank A490) x 100
where:
tx A490: is the average absorbance at 490nm of each time point.
t0 A490: is the average absorbance at 490nm of the initial time point.
blank A490: is the average absorbance at 490nm of the complete medium
without cells.
Material and methods
67
3.8. Cell cycle analysis
Single cells were plated in complete medium at a density of 10.000 cells/cm2
and, after 24 h at 37ºC in a 5% CO2 humidified incubator, cells were pelleted and
dissociated in 50 μl of Accutase® solution. After 10 min, 200 μl of DNA PREP LPR
reagent (Beckman Coulter, cat. no. 6607055) were directly added to permeate and
fix the cells during 5 min. Finally, cells were stained with 250 μl of 100 μg/ml
propidium iodide and 20 ng/ml of RNaseA. After 45 min at 37ºC, the DNA content
was assessed in a FACSVerse (BD) flow cytometer.
3.9. Immunocytochemistry
In general, prior to antigen detection with specific antibodies, cells were
attached and fixed for antigen preservation. Therefore, the day before, glass
coverslips were incubated with Matrigel® (Corning®, cat. no. 354230) diluted 1:100
in control medium at 37ºC in a 5% CO2 humidified incubator. The next day, before
attaching cells, Matrigel-coated coverslips were washed twice with sterile dH2O.
Cells were plated on 48-well plates with coated coverslips and were incubated for
20 min to allow cell attachment. Next, cells were fixed in 1% PFA at 37ºC for 15 min
and washed 3 times with PBS.
Before immunolabelling, unspecific binding of antibodies was minimized
incubating the cells in blocking buffer (10% FBS, 1% Glycine, 0.1 M PBS) for 30 min.
After that, samples were incubated with specific primary antibodies (see Annex 1)
diluted in blocking buffer overnight at 4ºC. Primary antibodies were washed three
times with PBS before incubating the cells with the corresponding fluorescent-
labelled secondary antibodies (see Annex 1) diluted in blocking buffer for 1 h at RT.
Finally, cells were washed with PBS and incubated with 1 μg/ml DAPI for 5 minutes
before mounting the coverslips in microscope slides with FluorsaveTM Reagent
(Millipore, cat. no. 345789).
Material and methods
68
3.10. Cell-pair assay for mode of division assessment
Symmetry of cell division was evaluated in recently-divided cells. Single cells
were plated in complete medium at very low density (4.000 cel/cm2) to minimize
the aggregation of individual cells and were incubated at 37ºC in a 5% CO2
humidified incubator. After 24 h, cells were gently dispensed in Matrigel®-coated
coverslips for fixation and detection of EGFR expression by immunocytochemistry.
At least 100 cell-pairs per condition were manually counted under a fluorescence
microscope (NIKON eclipse Ni) to obtain the percentage of each type of division.
3.11. Evaluation of multipotency of NSC cultures
Pre-treated NSC cultures were dissociated and plated at a density of 25,000
cells in a 60 mm dish with 4 ml of complete medium to obtain isolated clones.
Neurospheres were ready for clonal differentiation after 7 days at 37ºC in a 5% CO2
humidified incubator. The day before picking clones, 96-well plates were coated
with Matrigel® diluted 1:100 in control medium. The next day, Matrigel®-coated
plates were washed twice with sterile dH2O and filled with 100 μl of control
medium. Individual clones were picked under a dissecting microscope in a
horizontal laminar flow cabinet using a p20 micropipette and were transferred to
the Matrigel®-coated wells (1 neurosphere/well). The plates were placed in the
incubator for at least for 2 h to let neurospheres attach to the matrix. Empty wells
and those containing more than one clone were discarded for subsequent
differentiation. Once neurospheres were completely attached to the matrix,
control medium was carefully aspirated and replaced with 200 μl of differentiation
medium I (NSC control medium supplemented with 10 ng/ml of bFGF). After the
initial 2 days of incubation, the differentiation medium I was replaced by the
differentiation medium II (NSC control medium supplemented with 2% FBS).
Differentiated clones were ready for immunocytochemistry analysis of the
presence of the three different lineages after 5 days. Each clone was analysed in a
fluorescent inverted microscope and classified as unipotent (A, if only astrocytes
Material and methods
69
could be found), bipotent (AO/AN, if, besides astrocytes, there were neurons or
oligodendrocytes in the well) or tripotent (AON, if all three lineages were
observed).
3.12. Evaluation of cell proliferation dynamics by dilution of fluorescent tracers
SEZ homogenates were obtained as previously described except for
mechanical dissociation of tissue pieces after papain digestion that was done in 1
mL of 10 mM HEPES and HBSS to avoid BSA-sequestering of the membrane-
permeant fluorescent tracers. Then, 2 μg/ml of Cell Trace Far Red DDAO-SE
(Thermo Fischer, cat. no. C34553) was directly added for incubation at 37ºC for 7
minutes. After that, cells were washed with control medium and centrifuged at 200
xg for 10 min. Finally the loaded pellet was seeded in NSC complete medium. After
10 days, when primary neurospheres had arose and the fluorescent tracer had
heterogeneously diluted between the progeny, a second round of cell tracer
loading was performed using the Cell trace Oregon Green 488 Carboxy-DFFDA-SE
(Thermo Fischer, cat. no. C34555). Primary neurospheres were dissociated as
described above and single cells were washed with 10 mM HEPES and HBSS and
then were loaded with the second cell tracer in the same conditions. Double-
loaded cells were finally plated in complete medium for a second round of
proliferation to assess the proliferation dynamics of the label retaining cells. After 3
days at 37ºC in a 5% CO2 humidified incubator, secondary neurospheres were
dissociated and the fluorescence intensity of each cell tracer was measured in a
FACS Fortessa flow cytometer (BD).
3.13. Transduction of NSC by Nucleofection®
Transient introduction of exogenous DNA for expression of the 5x κB
luciferase-based reporter (5x κB-luc) was done by Nucleofection®, a method that
combines electroporation with cell-type specific reagents developed by Amaxa. In
general, a total number of 1.5 x 10⁶ cells were used for transduction. Cells were
Material and methods
70
pelleted at 200 xg for 10 min and 5 μl of a mix containing the different plasmids
were directly added to the cell pellet: 0.5 μg of 5x κB-luc was mixed with 0.05 μg of
pRenilla endogenous control vector, 3 μg of pcDNA3.1 as adjuvant and 0.5 μg of
pGFPmax (Lonza) reporter plasmid to monitor the transfection efficiency. The
pellet was then resuspended in 95 μl of Nucleofection Solution from the Mouse
Neural Stem Cell Nucleofector® Kit (Lonza, cat. no. VPG-1004) and placed in a
Nucleofector® cuvette. The cells were electroporated in a Nucleofector® 2b device
using the A-031 nucleofection program. Electroporated cells were gently collected
with warm complete medium, seeded in a P100 cell culture plate containing 8 ml of
complete medium and incubated for 24 h at 37ºC in a 5% CO2 humidified incubator
before using the cells for reporter expression under the different treatments.
3.14. Mitochondrial activity staining
After obtaining a single cell suspension as described above, cells were
incubated with MitoTrackerTM Orange CM-H2TMRos diluted 1:2000 in 0.5 ml of
blocking buffer for 30 min on ice. Then stained cells were washed with 1 ml of
blocking buffer, centrifuged at 200 xg 10 min and resuspended in 0.5 ml of blocking
buffer for flow cytometry analysis.
4. Molecular methods
4.1. RNA extraction, retro-transcription and real-time PCR
SEZ RNA samples were obtained using the Maxwell® 16 LEV simplyRNA Tissue
Kit (Promega, cat. no. AS1280) following the instructions provided by the
manufacturer. The RNA obtained was then quantified using the Qubit® RNA HS
Assay Kit (Thermo Fischer, cat. no. Q32852) in a Qubit Fluorometer (Thermo
Fischer).
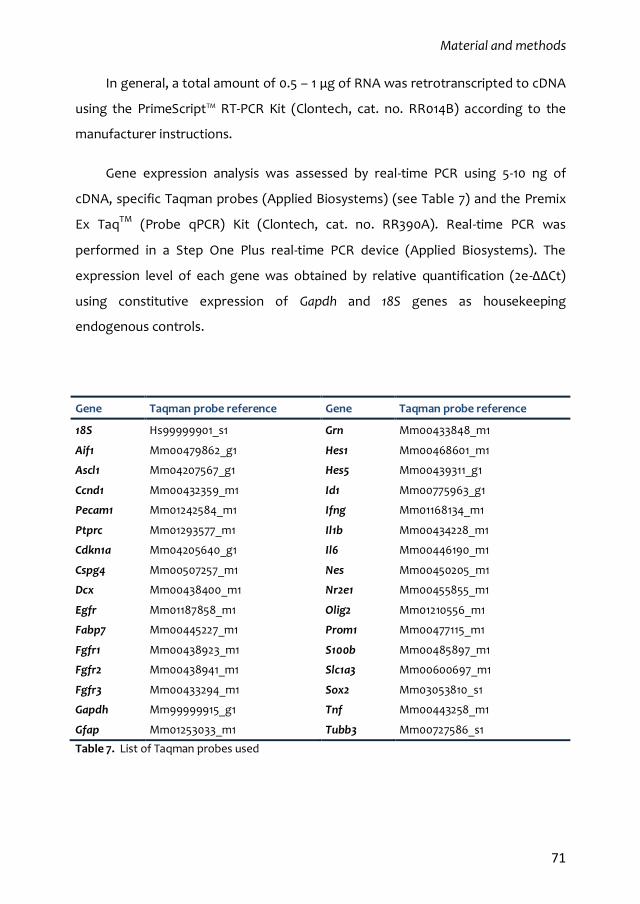
Material and methods
71
In general, a total amount of 0.5 – 1 μg of RNA was retrotranscripted to cDNA
using the PrimeScript™ RT-PCR Kit (Clontech, cat. no. RR014B) according to the
manufacturer instructions.
Gene expression analysis was assessed by real-time PCR using 5-10 ng of
cDNA, specific Taqman probes (Applied Biosystems) (see Table 7) and the Premix
Ex TaqTM (Probe qPCR) Kit (Clontech, cat. no. RR390A). Real-time PCR was
performed in a Step One Plus real-time PCR device (Applied Biosystems). The
expression level of each gene was obtained by relative quantification (2e-ΔΔCt)
using constitutive expression of Gapdh and 18S genes as housekeeping
endogenous controls.
Gene Taqman probe reference Gene Taqman probe reference
18S Hs99999901_s1 Grn Mm00433848_m1
Aif1 Mm00479862_g1 Hes1 Mm00468601_m1
Ascl1 Mm04207567_g1 Hes5 Mm00439311_g1
Ccnd1 Mm00432359_m1 Id1 Mm00775963_g1
Pecam1 Mm01242584_m1 Ifng Mm01168134_m1
Ptprc Mm01293577_m1 Il1b Mm00434228_m1
Cdkn1a Mm04205640_g1 Il6 Mm00446190_m1
Cspg4 Mm00507257_m1 Nes Mm00450205_m1
Dcx Mm00438400_m1 Nr2e1 Mm00455855_m1
Egfr Mm01187858_m1 Olig2 Mm01210556_m1
Fabp7 Mm00445227_m1 Prom1 Mm00477115_m1
Fgfr1 Mm00438923_m1 S100b Mm00485897_m1
Fgfr2 Mm00438941_m1 Slc1a3 Mm00600697_m1
Fgfr3 Mm00433294_m1 Sox2 Mm03053810_s1
Gapdh Mm99999915_g1 Tnf Mm00443258_m1
Gfap Mm01253033_m1 Tubb3 Mm00727586_s1
Table 7. List of Taqman probes used
Material and methods
72
4.2. Protein extraction, electrophoretic separation, transference and
immunodetection by Western Blot
Cells or SEZ samples were lysed in cold RIPA buffer (NaCl 150 mM, 0.5 %
sodium deoxycholate, 50 mM Tris-HCl pH 8.0, 1% Tx-100 and 1% SDS) supplemented
with Complete® protease inhibitor cocktail (Roche, cat. no. 11836153001) and
placed on ice for 30 min. Then the lysates were homogenized with sequential
passing through a 23G and then a 20G needle. Finally, protein samples were
centrifuged at 12000 xg for 10 min at 4ºC and the supernatant was transferred to a
new Eppendorf tube.
The concentration of each sample was determined using the Pierce® BCA
Protein Assay Kit (Thermo Fisher, cat. no. 23227) following the instruction of the
manufacturer. BSA was used to stablish a standard curve and A560 was measured in
a Victor®3 Multilabel Plate Reader.
Direct conditioned media or 20-80 µg of cell lysates were mixed with 4X
sample buffer (Glicerol 20%, 10% SDS, 10% β-mercaptoethanol, 40 μg/ml Bromo
phenol blue and 250 mM Tris-HCl 1M pH6.8,) and boiled at 95ºC for 10 min.
Samples were loaded in 10% poly-acrylamide gels and proteins were resolved
by sodium dodecyl sulphate polyacrylamide gel electrophoresis (SDS-PAGE) at 20
mA/gel in an electrophoresis running buffer (25 mM Tris-base, 192 mM glycine and
1% SDS). Proteins were transferred to PVDF membranes using the Trans-Blot Turbo
Transfer Pack (Bio-Rad, cat. no. 1704157) and the Trans-Blot Turbo transfer device
(Bio-Rad).
The membrane was washed in TBS-T buffer (0.1 M Tris-HCl pH 7.5, 0.9% NaCl
and 0.05% Tween®-20 (Sigma, cat. no P9416)) and incubated for 1h with blocking
buffer (5% skimmed milk in Tris buffer) to minimize unspecific binding. Primary
antibodies (see Annex 1) were diluted in blocking buffer and the membrane was
incubated overnight at 4ºC or 1h at RT in continuous agitation. Next, after washing
Material and methods
73
the membrane with TBS-T several times, HRP-labelled secondary antibodies (see
Annex 1) were added in blocking buffer and were incubated at RT for 1 h. Finally,
after washing the membrane with TBS-T, proteins were revealed with Western
Lightning® Plus-ECL (Perkin-Elmer, cat. no. NEL103001EA) and chemoluminescence
was captured in an Alliance Mini HD9 (Uvitec) image capture system.
4.3. Luciferase activity detection
Transduced cells were collected and centrifuged at 200 xg for 10 min. The
pellet was lysed in 50 μl of Passive Lysis Buffer (Promega, cat no. E1941) and
homogenised by vortexing 10 min. Firefly luciferase (reporter-dependent) and
Renilla luciferase (constitutively expressed) activity were determined in 10 μl of cell
lysate with the Dual-Luciferase® Reporter Assay System (Promega, cat. no E1960)
and luminescence was measured in a Victor®3 Multilabel Plate Reader.
4.4. Multiplex analysis of the phophorilated state of cell signalling mediators
Cells were collected, centrifuged and lysed in MILLIPLEX MAP Lysis buffer
(Millipore, cat no. 43-040). Cell lysates were homogenized by vortexing 10 min at
4ºC and stored at -80ºC until they were processed by Neuron Biolabs S.L.U
(Granada, Spain). The phosphorylated state and the total amount of CREB, JNK,
NF-κB, p38, AKT, p70S6K and STAT3 was measured with the MILLIPLEX® MAP 9-
plex Multi-Pathway Magnetic Bead Signaling kit Phosphoprotein (Millipore, cat no.:
48-680MAG) and the MILLIPLEX® MAP 9-plex Multi-Pathway Magnetic Bead
Signaling kit Total (Millipore, cat no.: 48-681MAG) kits respectively following the
instructions of the manufacturer. The same amount of protein in each
experimental group was loaded per well (2.7-3.3 μg) and each condition was
measured in two experimental replicates. The detection of phosphoproteins and
total proteins was performed in a MAGPIX® luminex MAP® system coupled with
two lasers. The phosphoprotein levels were normalized by the total amount of
each protein and relativized to the untreated condition.
Material and methods
74
5. Statistical analysis
Significance differences between experimental groups were assessed using
the unpaired or paired two-tailed Student t-test or one-way ANOVA with
Bonferroni correction when appropriate using the GraphPad PRISM® 5 software.
Relative values were transformed using the formula arcsen(square root (value))
and percentages were transformed using arcsen(square root (value/100)) before
statistical analysis. Significance lower than p=0.05 were considered as significant
differences in all cases. All data is expressed as mean + standard error of the mean
(sem) and the number of experiments carried out with independent cultures or
animals (n) is specified in each figure. When data are represented, * refers to p<
0.05, ** to p< 0.01 and *** to p< 0.001.
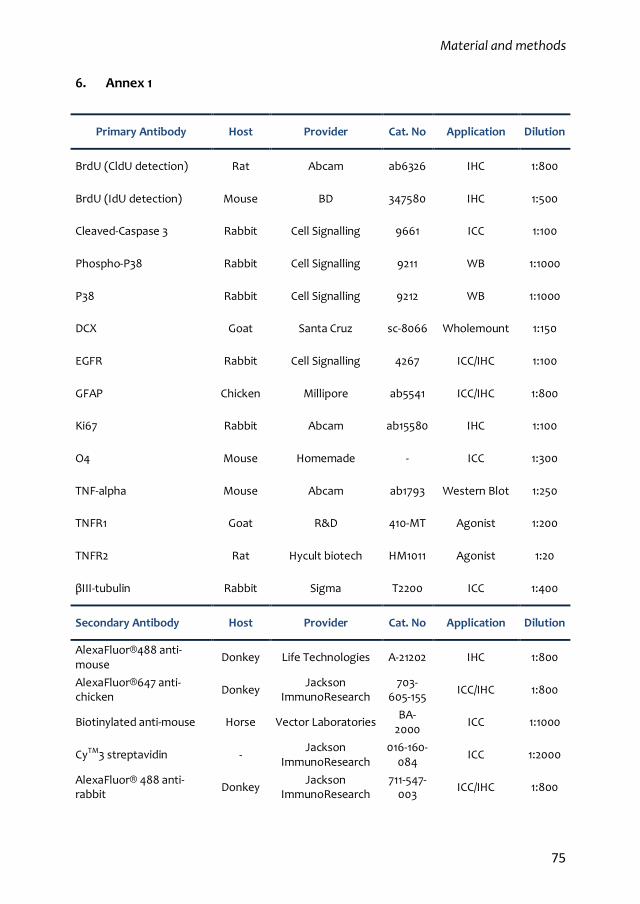
Material and methods
75
6. Annex 1
Primary Antibody Host Provider Cat. No Application Dilution
BrdU (CldU detection) Rat Abcam ab6326 IHC 1:800
BrdU (IdU detection) Mouse BD 347580 IHC 1:500
Cleaved-Caspase 3 Rabbit Cell Signalling 9661 ICC 1:100
Phospho-P38 Rabbit Cell Signalling 9211 WB 1:1000
P38 Rabbit Cell Signalling 9212 WB 1:1000
DCX Goat Santa Cruz sc-8066 Wholemount 1:150
EGFR Rabbit Cell Signalling 4267 ICC/IHC 1:100
GFAP Chicken Millipore ab5541 ICC/IHC 1:800
Ki67 Rabbit Abcam ab15580 IHC 1:100
O4 Mouse Homemade - ICC 1:300
TNF-alpha Mouse Abcam ab1793 Western Blot 1:250
TNFR1 Goat R&D 410-MT Agonist 1:200
TNFR2 Rat Hycult biotech HM1011 Agonist 1:20
βIII-tubulin Rabbit Sigma T2200 ICC 1:400
Secondary Antibody Host Provider Cat. No Application Dilution
AlexaFluor®488 anti-mouse
Donkey Life Technologies A-21202 IHC 1:800
AlexaFluor®647 anti-chicken
Donkey Jackson
ImmunoResearch 703-
605-155 ICC/IHC 1:800
Biotinylated anti-mouse Horse Vector Laboratories BA-
2000 ICC 1:1000
CyTM3 streptavidin - Jackson
ImmunoResearch 016-160-
084 ICC 1:2000
AlexaFluor® 488 anti-rabbit
Donkey Jackson
ImmunoResearch 711-547-
003 ICC/IHC 1:800
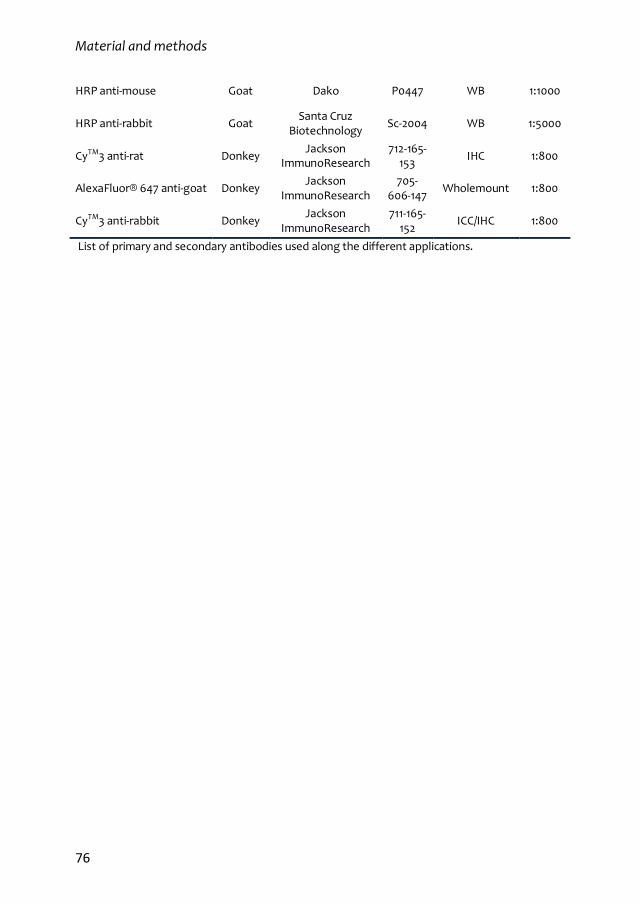
Material and methods
76
HRP anti-mouse Goat Dako P0447 WB 1:1000
HRP anti-rabbit Goat Santa Cruz
Biotechnology Sc-2004 WB 1:5000
CyTM3 anti-rat Donkey Jackson
ImmunoResearch 712-165-
153 IHC 1:800
AlexaFluor® 647 anti-goat Donkey Jackson
ImmunoResearch 705-
606-147 Wholemount 1:800
CyTM3 anti-rabbit Donkey Jackson
ImmunoResearch 711-165-
152 ICC/IHC 1:800
List of primary and secondary antibodies used along the different applications.

Results

Results
79
1. Characterization of the quiescent cell cycle in adult subependymal NSCs
1.1. Prospective identification of subependymal NSCs and their progeny
Since their discovery, identification of bona fide adult NSCs has been a
challenging task because single specific markers that could unequivocally identify
the different SEZ populations have not been found and the SEZ astrocytic lineage
which includes the NSC population/s shows morphological, molecular and
functional heterogeneity (Morrens et al., 2012). To overcome these limitations,
different genetic lineage-tracing strategies and/or immunohistochemical
approaches combining retention of thymidine analogues with different astroglial
or stem cell markers have been classically used in histological analyses to study
NSCs and their progeny (Kuhn et al., 2016). Nevertheless, recent evidences
demonstrating that adult stem cells coexist in different quiescent (dormant qNSC1
vs. alert qNSC2 or primed) (Llorens-Bobadilla et al., 2015; Rodgers et al., 2014) and
active (aNSC) states (Codega et al., 2014; Daynac et al., 2016; Giachino et al., 2014;
Llorens-Bobadilla et al., 2015; Mich et al., 2014), have revealed a new level of
complexity rendering these classical approaches insufficient to finely resolve the
different pieces of this tricky puzzle.
In the last few years several groups have assayed different strategies to label
and isolate NSCs or their progeny by flow cytometry (Codega et al., 2014; Daynac et
al., 2016; Giachino et al., 2014; Llorens-Bobadilla et al., 2015; Mich et al., 2014). These
approaches are usually based on the combination of multiple markers, either using
transgenic reporters and/or labelling with fluorescent antibodies against cell
surface proteins to then analyse the marker profile of each individual SEZ cell.
Despite having proved their relative accuracy, none of the protocols published so
far ensures the detection of the complete population of NSCs and their different
proliferative states. Furthermore, strategies that rely on the expression of reporter
transgenes such as hGFAP::GFP or Hes5::GFP mouse strains (Codega et al., 2014;
Giachino et al., 2014), cannot be directly applied to the study of NSCs in other
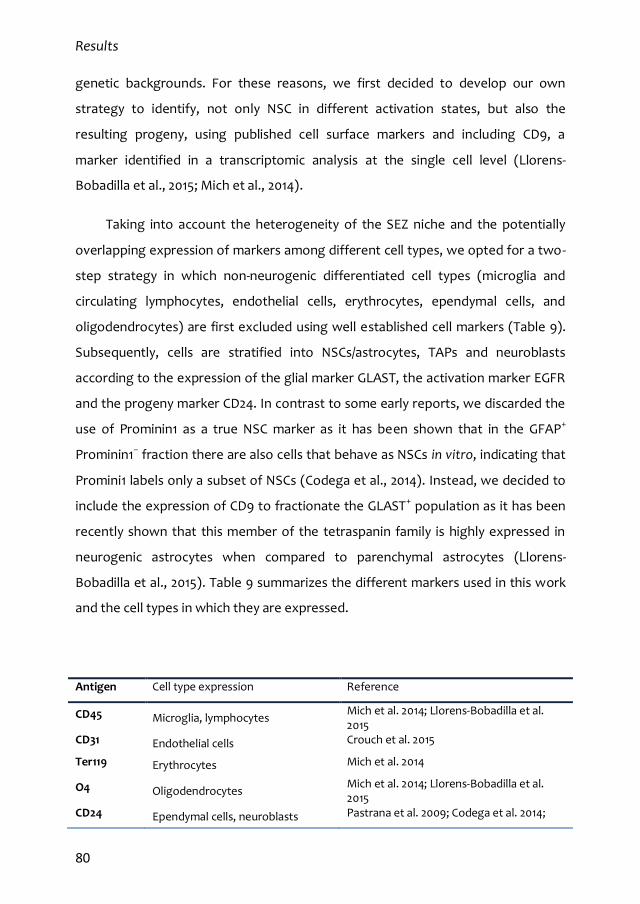
Results
80
genetic backgrounds. For these reasons, we first decided to develop our own
strategy to identify, not only NSC in different activation states, but also the
resulting progeny, using published cell surface markers and including CD9, a
marker identified in a transcriptomic analysis at the single cell level (Llorens-
Bobadilla et al., 2015; Mich et al., 2014).
Taking into account the heterogeneity of the SEZ niche and the potentially
overlapping expression of markers among different cell types, we opted for a two-
step strategy in which non-neurogenic differentiated cell types (microglia and
circulating lymphocytes, endothelial cells, erythrocytes, ependymal cells, and
oligodendrocytes) are first excluded using well established cell markers (Table 9).
Subsequently, cells are stratified into NSCs/astrocytes, TAPs and neuroblasts
according to the expression of the glial marker GLAST, the activation marker EGFR
and the progeny marker CD24. In contrast to some early reports, we discarded the
use of Prominin1 as a true NSC marker as it has been shown that in the GFAP+
Prominin1– fraction there are also cells that behave as NSCs in vitro, indicating that
Promini1 labels only a subset of NSCs (Codega et al., 2014). Instead, we decided to
include the expression of CD9 to fractionate the GLAST+ population as it has been
recently shown that this member of the tetraspanin family is highly expressed in
neurogenic astrocytes when compared to parenchymal astrocytes (Llorens-
Bobadilla et al., 2015). Table 9 summarizes the different markers used in this work
and the cell types in which they are expressed.
Antigen Cell type expression Reference
CD45 Microglia, lymphocytes Mich et al. 2014; Llorens-Bobadilla et al. 2015
CD31 Endothelial cells Crouch et al. 2015
Ter119 Erythrocytes Mich et al. 2014
O4 Oligodendrocytes Mich et al. 2014; Llorens-Bobadilla et al. 2015
CD24 Ependymal cells, neuroblasts Pastrana et al. 2009; Codega et al. 2014;
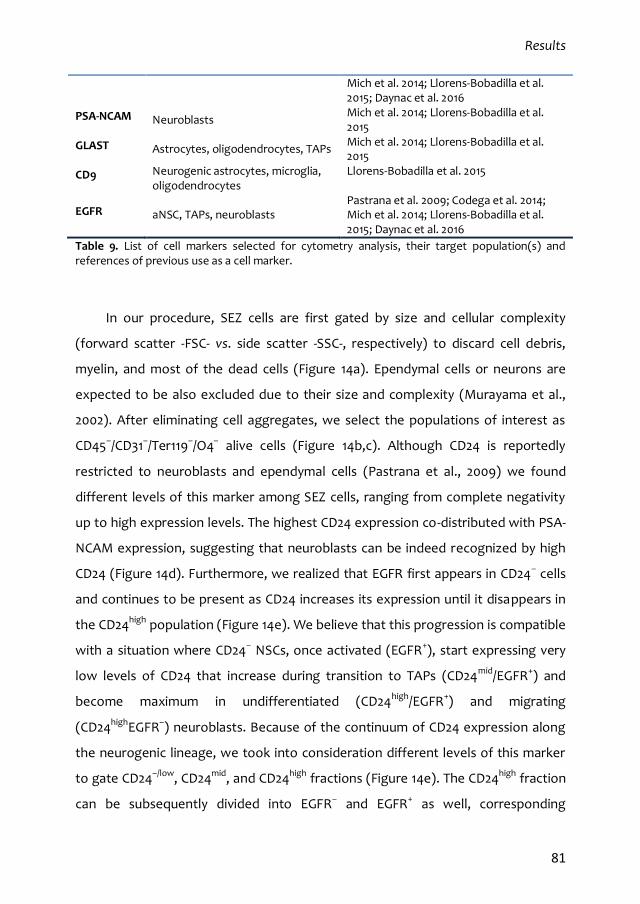
Results
81
Mich et al. 2014; Llorens-Bobadilla et al. 2015; Daynac et al. 2016
PSA-NCAM Neuroblasts Mich et al. 2014; Llorens-Bobadilla et al. 2015
GLAST Astrocytes, oligodendrocytes, TAPs Mich et al. 2014; Llorens-Bobadilla et al. 2015
CD9 Neurogenic astrocytes, microglia, oligodendrocytes
Llorens-Bobadilla et al. 2015
EGFR aNSC, TAPs, neuroblasts Pastrana et al. 2009; Codega et al. 2014; Mich et al. 2014; Llorens-Bobadilla et al. 2015; Daynac et al. 2016
Table 9. List of cell markers selected for cytometry analysis, their target population(s) and references of previous use as a cell marker.
In our procedure, SEZ cells are first gated by size and cellular complexity
(forward scatter -FSC- vs. side scatter -SSC-, respectively) to discard cell debris,
myelin, and most of the dead cells (Figure 14a). Ependymal cells or neurons are
expected to be also excluded due to their size and complexity (Murayama et al.,
2002). After eliminating cell aggregates, we select the populations of interest as
CD45–/CD31–/Ter119–/O4– alive cells (Figure 14b,c). Although CD24 is reportedly
restricted to neuroblasts and ependymal cells (Pastrana et al., 2009) we found
different levels of this marker among SEZ cells, ranging from complete negativity
up to high expression levels. The highest CD24 expression co-distributed with PSA-
NCAM expression, suggesting that neuroblasts can be indeed recognized by high
CD24 (Figure 14d). Furthermore, we realized that EGFR first appears in CD24– cells
and continues to be present as CD24 increases its expression until it disappears in
the CD24high population (Figure 14e). We believe that this progression is compatible
with a situation where CD24– NSCs, once activated (EGFR+), start expressing very
low levels of CD24 that increase during transition to TAPs (CD24mid/EGFR+) and
become maximum in undifferentiated (CD24high/EGFR+) and migrating
(CD24highEGFR–) neuroblasts. Because of the continuum of CD24 expression along
the neurogenic lineage, we took into consideration different levels of this marker
to gate CD24–/low, CD24mid, and CD24high fractions (Figure 14e). The CD24high fraction
can be subsequently divided into EGFR– and EGFR+ as well, corresponding
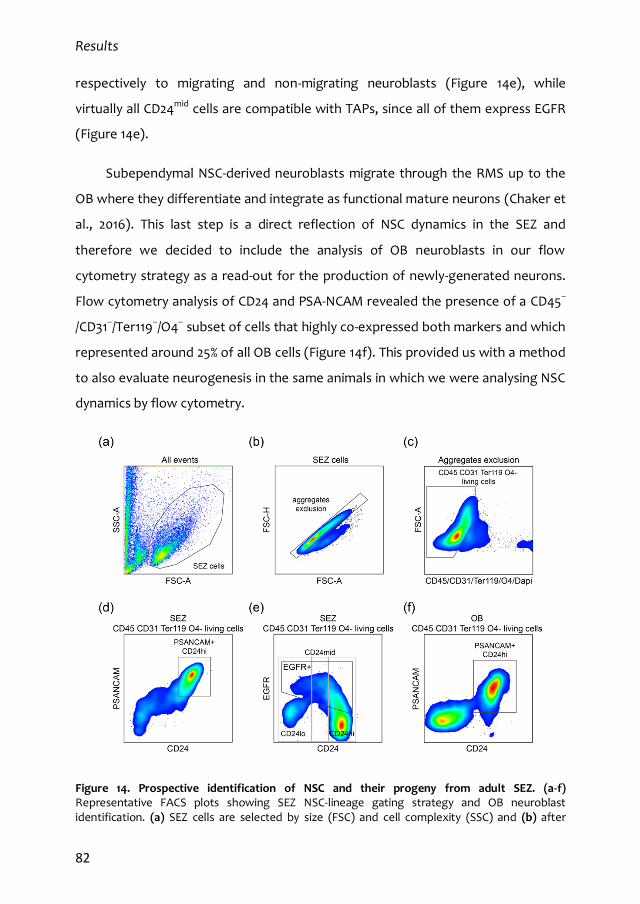
Results
82
respectively to migrating and non-migrating neuroblasts (Figure 14e), while
virtually all CD24mid cells are compatible with TAPs, since all of them express EGFR
(Figure 14e).
Subependymal NSC-derived neuroblasts migrate through the RMS up to the
OB where they differentiate and integrate as functional mature neurons (Chaker et
al., 2016). This last step is a direct reflection of NSC dynamics in the SEZ and
therefore we decided to include the analysis of OB neuroblasts in our flow
cytometry strategy as a read-out for the production of newly-generated neurons.
Flow cytometry analysis of CD24 and PSA-NCAM revealed the presence of a CD45–
/CD31–/Ter119–/O4– subset of cells that highly co-expressed both markers and which
represented around 25% of all OB cells (Figure 14f). This provided us with a method
to also evaluate neurogenesis in the same animals in which we were analysing NSC
dynamics by flow cytometry.
Figure 14. Prospective identification of NSC and their progeny from adult SEZ. (a-f) Representative FACS plots showing SEZ NSC-lineage gating strategy and OB neuroblast identification. (a) SEZ cells are selected by size (FSC) and cell complexity (SSC) and (b) after
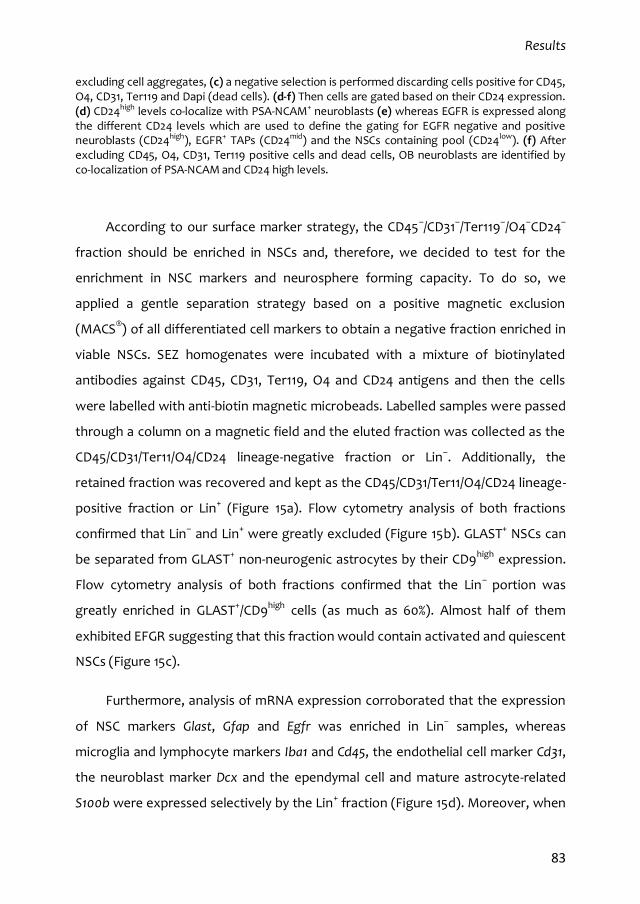
Results
83
excluding cell aggregates, (c) a negative selection is performed discarding cells positive for CD45, O4, CD31, Ter119 and Dapi (dead cells). (d-f) Then cells are gated based on their CD24 expression. (d) CD24high levels co-localize with PSA-NCAM+ neuroblasts (e) whereas EGFR is expressed along the different CD24 levels which are used to define the gating for EGFR negative and positive neuroblasts (CD24high), EGFR+ TAPs (CD24mid) and the NSCs containing pool (CD24low). (f) After excluding CD45, O4, CD31, Ter119 positive cells and dead cells, OB neuroblasts are identified by co-localization of PSA-NCAM and CD24 high levels.
According to our surface marker strategy, the CD45–/CD31–/Ter119–/O4–CD24–
fraction should be enriched in NSCs and, therefore, we decided to test for the
enrichment in NSC markers and neurosphere forming capacity. To do so, we
applied a gentle separation strategy based on a positive magnetic exclusion
(MACS®) of all differentiated cell markers to obtain a negative fraction enriched in
viable NSCs. SEZ homogenates were incubated with a mixture of biotinylated
antibodies against CD45, CD31, Ter119, O4 and CD24 antigens and then the cells
were labelled with anti-biotin magnetic microbeads. Labelled samples were passed
through a column on a magnetic field and the eluted fraction was collected as the
CD45/CD31/Ter11/O4/CD24 lineage-negative fraction or Lin–. Additionally, the
retained fraction was recovered and kept as the CD45/CD31/Ter11/O4/CD24 lineage-
positive fraction or Lin+ (Figure 15a). Flow cytometry analysis of both fractions
confirmed that Lin– and Lin+ were greatly excluded (Figure 15b). GLAST+ NSCs can
be separated from GLAST+ non-neurogenic astrocytes by their CD9high expression.
Flow cytometry analysis of both fractions confirmed that the Lin– portion was
greatly enriched in GLAST+/CD9high cells (as much as 60%). Almost half of them
exhibited EFGR suggesting that this fraction would contain activated and quiescent
NSCs (Figure 15c).
Furthermore, analysis of mRNA expression corroborated that the expression
of NSC markers Glast, Gfap and Egfr was enriched in Lin– samples, whereas
microglia and lymphocyte markers Iba1 and Cd45, the endothelial cell marker Cd31,
the neuroblast marker Dcx and the ependymal cell and mature astrocyte-related
S100b were expressed selectively by the Lin+ fraction (Figure 15d). Moreover, when
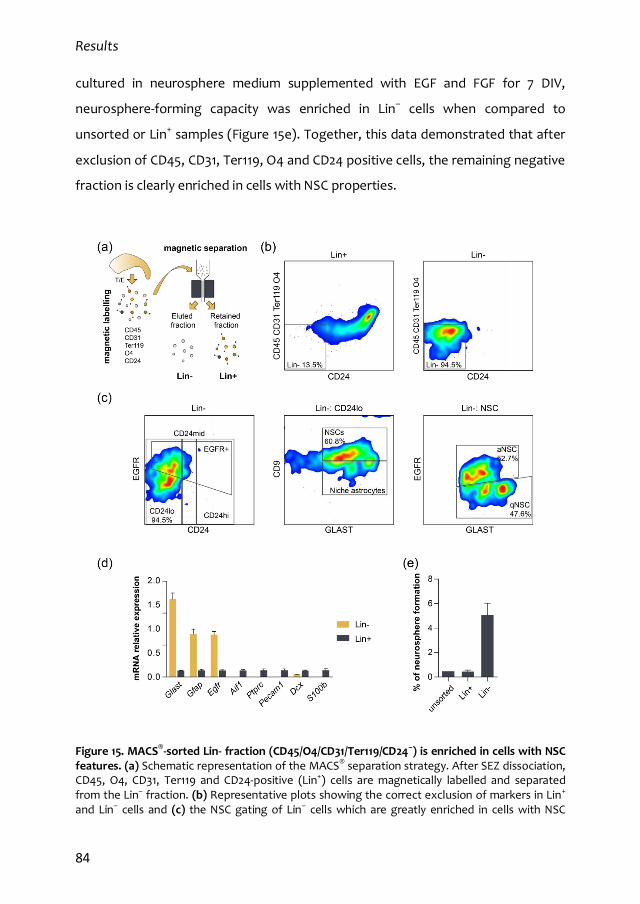
Results
84
cultured in neurosphere medium supplemented with EGF and FGF for 7 DIV,
neurosphere-forming capacity was enriched in Lin– cells when compared to
unsorted or Lin+ samples (Figure 15e). Together, this data demonstrated that after
exclusion of CD45, CD31, Ter119, O4 and CD24 positive cells, the remaining negative
fraction is clearly enriched in cells with NSC properties.
Figure 15. MACS®-sorted Lin- fraction (CD45/O4/CD31/Ter119/CD24–) is enriched in cells with NSC features. (a) Schematic representation of the MACS® separation strategy. After SEZ dissociation, CD45, O4, CD31, Ter119 and CD24-positive (Lin+) cells are magnetically labelled and separated from the Lin– fraction. (b) Representative plots showing the correct exclusion of markers in Lin+ and Lin– cells and (c) the NSC gating of Lin– cells which are greatly enriched in cells with NSC
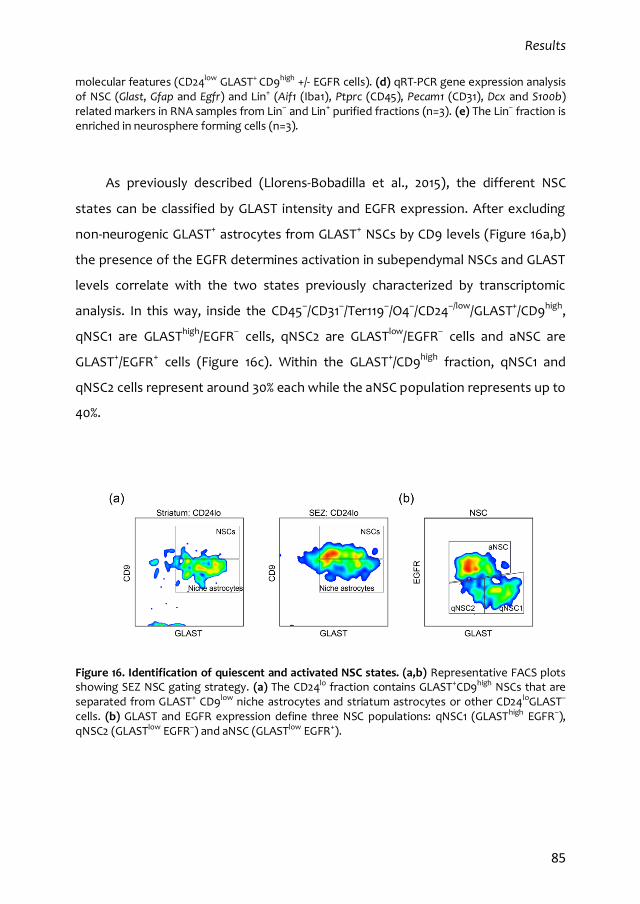
Results
85
molecular features (CD24low GLAST+ CD9high +/- EGFR cells). (d) qRT-PCR gene expression analysis of NSC (Glast, Gfap and Egfr) and Lin+ (Aif1 (Iba1), Ptprc (CD45), Pecam1 (CD31), Dcx and S100b) related markers in RNA samples from Lin– and Lin+ purified fractions (n=3). (e) The Lin– fraction is enriched in neurosphere forming cells (n=3).
As previously described (Llorens-Bobadilla et al., 2015), the different NSC
states can be classified by GLAST intensity and EGFR expression. After excluding
non-neurogenic GLAST+ astrocytes from GLAST+ NSCs by CD9 levels (Figure 16a,b)
the presence of the EGFR determines activation in subependymal NSCs and GLAST
levels correlate with the two states previously characterized by transcriptomic
analysis. In this way, inside the CD45–/CD31–/Ter119–/O4–/CD24–/low/GLAST+/CD9high,
qNSC1 are GLASThigh/EGFR– cells, qNSC2 are GLASTlow/EGFR– cells and aNSC are
GLAST+/EGFR+ cells (Figure 16c). Within the GLAST+/CD9high fraction, qNSC1 and
qNSC2 cells represent around 30% each while the aNSC population represents up to
40%.
Figure 16. Identification of quiescent and activated NSC states. (a,b) Representative FACS plots showing SEZ NSC gating strategy. (a) The CD24lo fraction contains GLAST+CD9high NSCs that are separated from GLAST+ CD9low niche astrocytes and striatum astrocytes or other CD24loGLAST– cells. (b) GLAST and EGFR expression define three NSC populations: qNSC1 (GLASThigh EGFR–), qNSC2 (GLASTlow EGFR–) and aNSC (GLASTlow EGFR+).
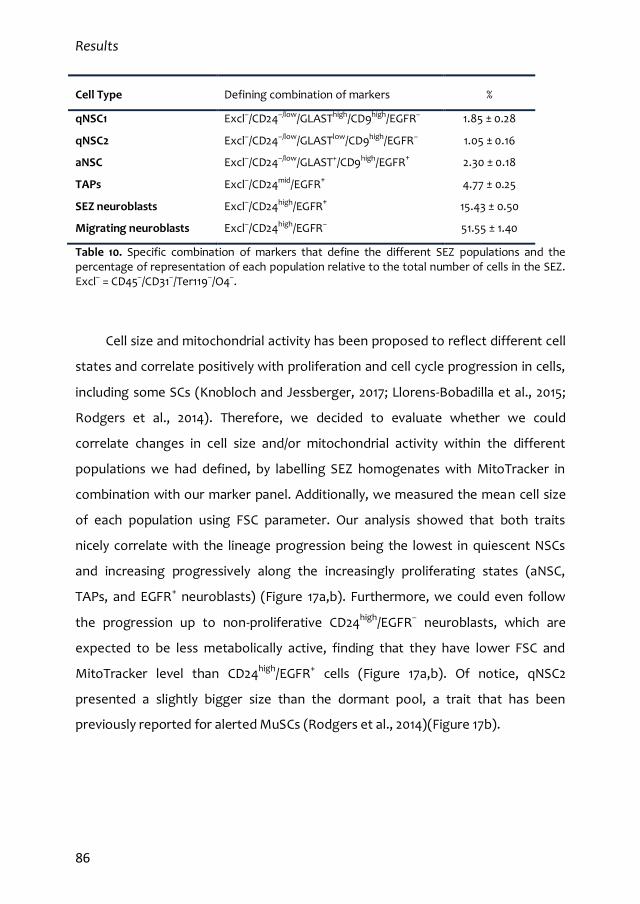
Results
86
Cell Type Defining combination of markers %
qNSC1 Excl–/CD24–/low/GLASThigh/CD9high/EGFR– 1.85 ± 0.28
qNSC2 Excl–/CD24–/low/GLASTlow/CD9high/EGFR– 1.05 ± 0.16
aNSC Excl–/CD24–/low/GLAST+/CD9high/EGFR+ 2.30 ± 0.18
TAPs Excl–/CD24mid/EGFR+ 4.77 ± 0.25
SEZ neuroblasts Excl–/CD24high/EGFR+ 15.43 ± 0.50
Migrating neuroblasts Excl–/CD24high/EGFR– 51.55 ± 1.40
Table 10. Specific combination of markers that define the different SEZ populations and the percentage of representation of each population relative to the total number of cells in the SEZ. Excl– = CD45–/CD31–/Ter119–/O4–.
Cell size and mitochondrial activity has been proposed to reflect different cell
states and correlate positively with proliferation and cell cycle progression in cells,
including some SCs (Knobloch and Jessberger, 2017; Llorens-Bobadilla et al., 2015;
Rodgers et al., 2014). Therefore, we decided to evaluate whether we could
correlate changes in cell size and/or mitochondrial activity within the different
populations we had defined, by labelling SEZ homogenates with MitoTracker in
combination with our marker panel. Additionally, we measured the mean cell size
of each population using FSC parameter. Our analysis showed that both traits
nicely correlate with the lineage progression being the lowest in quiescent NSCs
and increasing progressively along the increasingly proliferating states (aNSC,
TAPs, and EGFR+ neuroblasts) (Figure 17a,b). Furthermore, we could even follow
the progression up to non-proliferative CD24high/EGFR– neuroblasts, which are
expected to be less metabolically active, finding that they have lower FSC and
MitoTracker level than CD24high/EGFR+ cells (Figure 17a,b). Of notice, qNSC2
presented a slightly bigger size than the dormant pool, a trait that has been
previously reported for alerted MuSCs (Rodgers et al., 2014)(Figure 17b).
Results
87
Figure 17. Proliferating cells exhibit increased cell size and high mitochondrial activity. (a) Representative histogram of the FSC intensity in qNSC1, qNSC2 and aNSCs and quantification of the mean FSC intensity in each cell type (n=5) reflecting that the proliferative populations (aNSCs, TAPs and EGFR+ neuroblasts) display bigger cell size. (b) Representative histogram showing MitoTracker intensity in qNSC1, qNSC2 and aNSC and quantification of mean intensity in each cell type (n=3). Note that proliferating aNSCs, TAPs and EGFR+ neuroblasts increase their mitochondrial activity until they become EGFR– neuroblasts.
1.2. qNSC2 or alerted NSCs represent an intermediate state between dormancy
and activation
As a first validation of our cell classification strategy, we decided to
interrogate our populations in a regeneration paradigm. Subependymal NSCs can
completely regenerate the structure following near complete elimination of their
proliferating cell progeny with a subacute treatment with anti-mitotic agents, such
as Ara-C or TMZ, which kill the different proliferative SEZ cell types including aNSCs
while sparing quiescent cells (Doetsch et al., 1999a; Mich et al., 2014; Pastrana et
al., 2009). We performed some initial experiments with AraC infused intra-cortically
Results
88
for 6 days using osmotic minipumps, but the surgery induced a very high brain
microglial reaction in both saline and AraC-injected animals, as detected with
antibodies to IBA-1 (data not shown). Because we wanted to evaluate effects of
inflammation in subependymal NSCs, we decided to use the alternative anti-mitotic
drug TMZ which is administered to the animals by intraperitoneal (i.p.) injection. It
has been shown that 3 doses of TMZ during 3 days effectively eliminate the
activated NSCs and neurosphere forming cells, forcing the remaining qNSCs to exit
from dormancy, become activated, and regenerate the SEZ (Mich et al., 2014). TMZ
or vehicle DMSO was intraperitoneally administered for 3 consecutive days and
mice were sacrificed 3 days after the last injection. The effectiveness of the
treatment was confirmed by scoring the number of primary neurospheres in vitro
and quantifying neuroblast chains in whole-mounts of the lateral ventricle wall
immunostained for neuroblast marker DCX (Figure 18b,c). Flow cytometry analysis
of TMZ-treated SEZ tissue showed the almost complete abolition of the CD24mid/high
cell fraction containing neuroblasts and TAPs (Figure 18d). Additionally, at the OB
we could observe that the portion of cells co-expressing CD24 and PSA-NCAM
(arriving immature neuroblasts) had also disappeared after the treatment (Figure
18f). Interestingly, the CD24–/low fraction was greatly enriched after the anti-mitotic
treatment; moreover, the vast majority of them could be identified as quiescent
NSCs whereas aNSC were almost completely absent (Figure 18e) in line with
previous reports showing their sensitivity to anti-mitotic drugs (Doetsch et al.,
1999a; Mich et al., 2014; Pastrana et al., 2009). This result supports the concept that
the selected CD45–/CD31–/Ter119–/O4–CD24–/low/GLAST+/CD9high/EGFR– cells are
mainly quiescent and that the absence of EGFR distinguish them from the activated
pool of NSCs.
To further confirm this idea, we tested the ability of the remaining quiescent
NSCs to be activated and to replenish the TAP and neuroblast populations
analysing the SEZ and OB of TMZ lesioned mice after 35 days. Although it has been
described that cell replenishment is complete by 90 days, signs of regeneration can
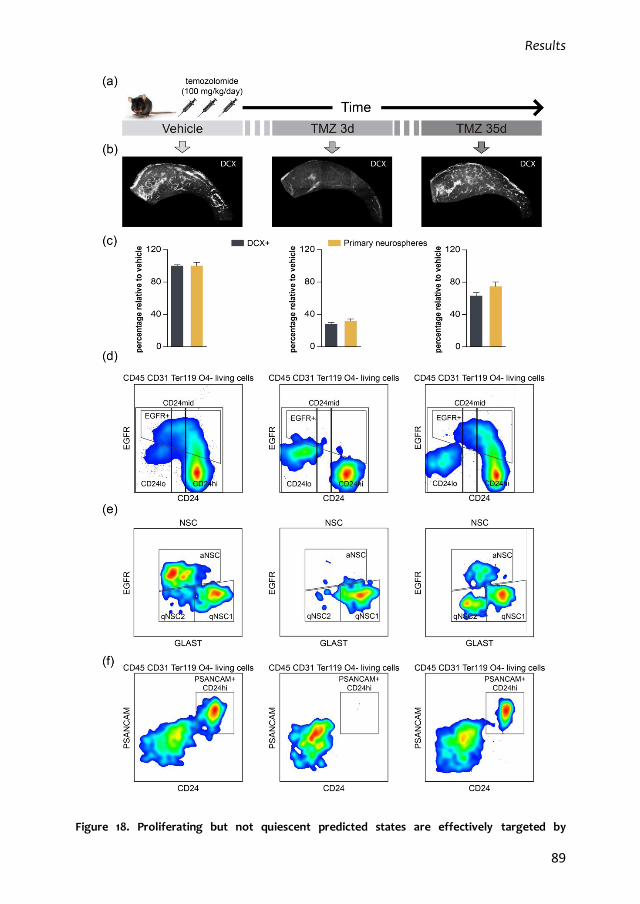
Results
89
Figure 18. Proliferating but not quiescent predicted states are effectively targeted by
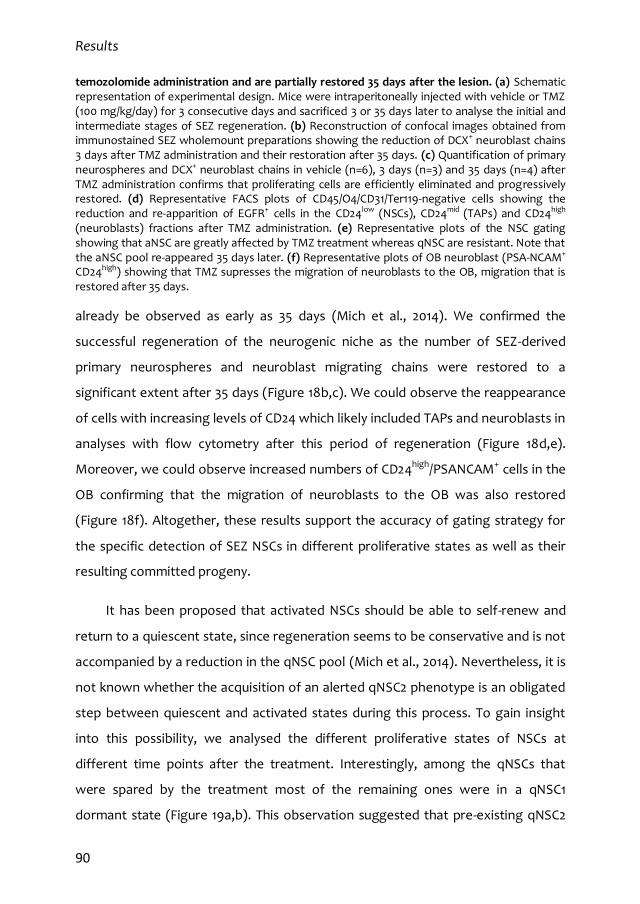
Results
90
temozolomide administration and are partially restored 35 days after the lesion. (a) Schematic representation of experimental design. Mice were intraperitoneally injected with vehicle or TMZ (100 mg/kg/day) for 3 consecutive days and sacrificed 3 or 35 days later to analyse the initial and intermediate stages of SEZ regeneration. (b) Reconstruction of confocal images obtained from immunostained SEZ wholemount preparations showing the reduction of DCX+ neuroblast chains 3 days after TMZ administration and their restoration after 35 days. (c) Quantification of primary neurospheres and DCX+ neuroblast chains in vehicle (n=6), 3 days (n=3) and 35 days (n=4) after TMZ administration confirms that proliferating cells are efficiently eliminated and progressively restored. (d) Representative FACS plots of CD45/O4/CD31/Ter119-negative cells showing the reduction and re-apparition of EGFR+ cells in the CD24low (NSCs), CD24mid (TAPs) and CD24high (neuroblasts) fractions after TMZ administration. (e) Representative plots of the NSC gating showing that aNSC are greatly affected by TMZ treatment whereas qNSC are resistant. Note that the aNSC pool re-appeared 35 days later. (f) Representative plots of OB neuroblast (PSA-NCAM+ CD24high) showing that TMZ supresses the migration of neuroblasts to the OB, migration that is restored after 35 days.
already be observed as early as 35 days (Mich et al., 2014). We confirmed the
successful regeneration of the neurogenic niche as the number of SEZ-derived
primary neurospheres and neuroblast migrating chains were restored to a
significant extent after 35 days (Figure 18b,c). We could observe the reappearance
of cells with increasing levels of CD24 which likely included TAPs and neuroblasts in
analyses with flow cytometry after this period of regeneration (Figure 18d,e).
Moreover, we could observe increased numbers of CD24high/PSANCAM+ cells in the
OB confirming that the migration of neuroblasts to the OB was also restored
(Figure 18f). Altogether, these results support the accuracy of gating strategy for
the specific detection of SEZ NSCs in different proliferative states as well as their
resulting committed progeny.
It has been proposed that activated NSCs should be able to self-renew and
return to a quiescent state, since regeneration seems to be conservative and is not
accompanied by a reduction in the qNSC pool (Mich et al., 2014). Nevertheless, it is
not known whether the acquisition of an alerted qNSC2 phenotype is an obligated
step between quiescent and activated states during this process. To gain insight
into this possibility, we analysed the different proliferative states of NSCs at
different time points after the treatment. Interestingly, among the qNSCs that
were spared by the treatment most of the remaining ones were in a qNSC1
dormant state (Figure 19a,b). This observation suggested that pre-existing qNSC2
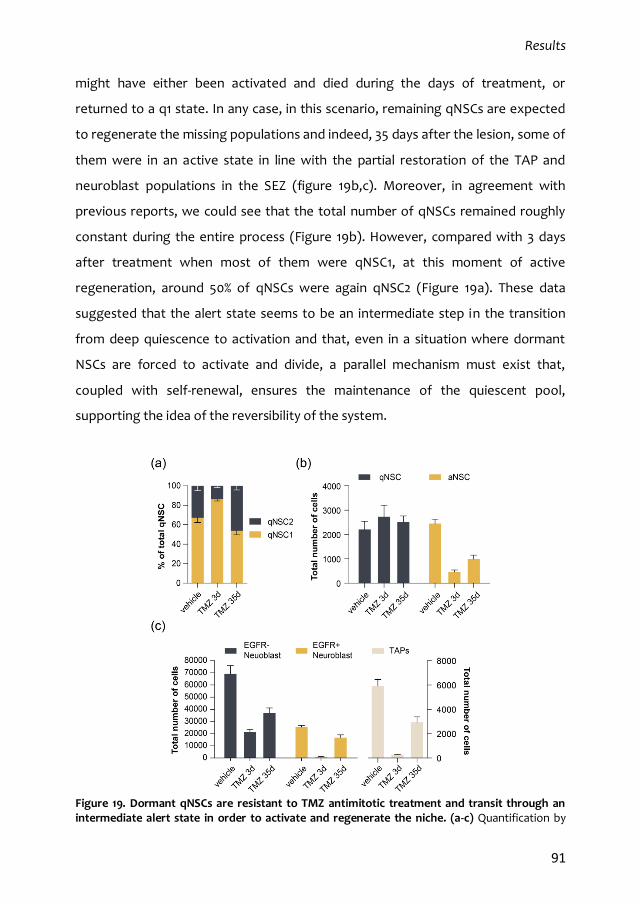
Results
91
might have either been activated and died during the days of treatment, or
returned to a q1 state. In any case, in this scenario, remaining qNSCs are expected
to regenerate the missing populations and indeed, 35 days after the lesion, some of
them were in an active state in line with the partial restoration of the TAP and
neuroblast populations in the SEZ (figure 19b,c). Moreover, in agreement with
previous reports, we could see that the total number of qNSCs remained roughly
constant during the entire process (Figure 19b). However, compared with 3 days
after treatment when most of them were qNSC1, at this moment of active
regeneration, around 50% of qNSCs were again qNSC2 (Figure 19a). These data
suggested that the alert state seems to be an intermediate step in the transition
from deep quiescence to activation and that, even in a situation where dormant
NSCs are forced to activate and divide, a parallel mechanism must exist that,
coupled with self-renewal, ensures the maintenance of the quiescent pool,
supporting the idea of the reversibility of the system.
Figure 19. Dormant qNSCs are resistant to TMZ antimitotic treatment and transit through an intermediate alert state in order to activate and regenerate the niche. (a-c) Quantification by
Results
92
flow cytometry of the different NSC states, TAPs and EGFR+ and EGFR– neuroblasts during a TMZ-based regeneration paradigm. (a) 3 days after TMZ, most of the quiescent NSCs that remain in the SEZ are in a dormant qNSC1 state, but 35 days later, qNSC2 have re-appeared and the balance between both populations has returned to basal levels. (b) qNSCs remain roughly constant whereas TMZ administration drastically reduces the total number of aNSCs observed at 3 days, which are partially restored 35 later. (c) NSC progeny, i.e. TAPs, EGFR+ and EGFR– neuroblasts, is greatly reduced 3 days after TMZ administration and is partially restored 35 days after. (vehicle n=6; TMZ 3d n=3; TMZ 35d n=3).
2. The effects of inflammation in the quiescent cell cycle of adult
subependymal NSCs
2.1. LPS-induced systemic inflammation disrupts SEZ homeostasis and modulates
NSC activity
One of the main objectives of this thesis was to assess the effects of
inflammation on subependymal NSCs and neurogenesis. Thus, initially, in order to
get a general picture of the SEZ response, we induced systemic inflammation with
a well-established and extensively used procedure, consisting in the i.p. injection of
LPS. Mice were injected with saline or 5 mg/kg of LPS and the SEZ was analysed at
1h, 24h, 3 days or 6 days after the administration. As a first approach to evaluate
the effect of inflammation on SEZ homeostasis, we performed quantitative real
time PCR (qRT-PCR) analysis of a set of genes selected as representative markers
of the different populations on the SEZ neurogenic niche. Significant changes were
observed at 24h after injection that were mainly characterized by a downregulation
of most of the genes (Sox2, Hes5, Fabp7, Cyclind1, S100β, Ascl1, Nr2e1, Nestin, Olig2,
Cspg4, Egfr, Dcx, Hes1, Tubb3, Fgfr1 or Fgfr2) (Figure 20a) indicating potentially
negative effects of inflammation over most of the SEZ populations. However, we
simultaneously found increased expression of some NSC-related genes (Gfap,
Prom1, Cdkn1a, Id1 or Fgfr3) suggesting that positive effects might have been
specifically promoted in these cells (Figure 20a). Interestingly, during the days
following the initial perturbation, expression profile of the evaluated genes
returned to the initial pre-inflammation levels (Figure 20a). This analysis
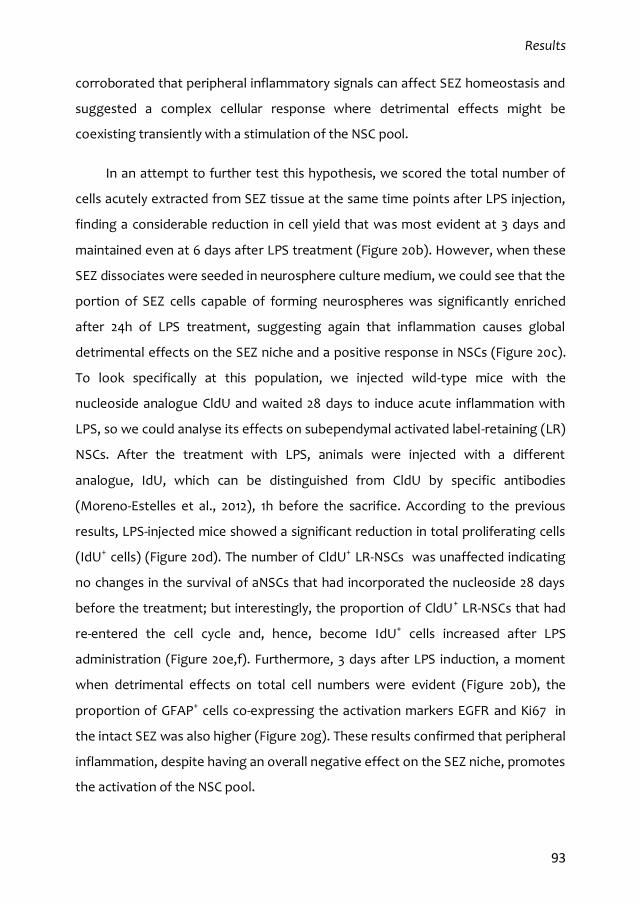
Results
93
corroborated that peripheral inflammatory signals can affect SEZ homeostasis and
suggested a complex cellular response where detrimental effects might be
coexisting transiently with a stimulation of the NSC pool.
In an attempt to further test this hypothesis, we scored the total number of
cells acutely extracted from SEZ tissue at the same time points after LPS injection,
finding a considerable reduction in cell yield that was most evident at 3 days and
maintained even at 6 days after LPS treatment (Figure 20b). However, when these
SEZ dissociates were seeded in neurosphere culture medium, we could see that the
portion of SEZ cells capable of forming neurospheres was significantly enriched
after 24h of LPS treatment, suggesting again that inflammation causes global
detrimental effects on the SEZ niche and a positive response in NSCs (Figure 20c).
To look specifically at this population, we injected wild-type mice with the
nucleoside analogue CldU and waited 28 days to induce acute inflammation with
LPS, so we could analyse its effects on subependymal activated label-retaining (LR)
NSCs. After the treatment with LPS, animals were injected with a different
analogue, IdU, which can be distinguished from CldU by specific antibodies
(Moreno-Estelles et al., 2012), 1h before the sacrifice. According to the previous
results, LPS-injected mice showed a significant reduction in total proliferating cells
(IdU+ cells) (Figure 20d). The number of CldU+ LR-NSCs was unaffected indicating
no changes in the survival of aNSCs that had incorporated the nucleoside 28 days
before the treatment; but interestingly, the proportion of CldU+ LR-NSCs that had
re-entered the cell cycle and, hence, become IdU+ cells increased after LPS
administration (Figure 20e,f). Furthermore, 3 days after LPS induction, a moment
when detrimental effects on total cell numbers were evident (Figure 20b), the
proportion of GFAP+ cells co-expressing the activation markers EGFR and Ki67 in
the intact SEZ was also higher (Figure 20g). These results confirmed that peripheral
inflammation, despite having an overall negative effect on the SEZ niche, promotes
the activation of the NSC pool.
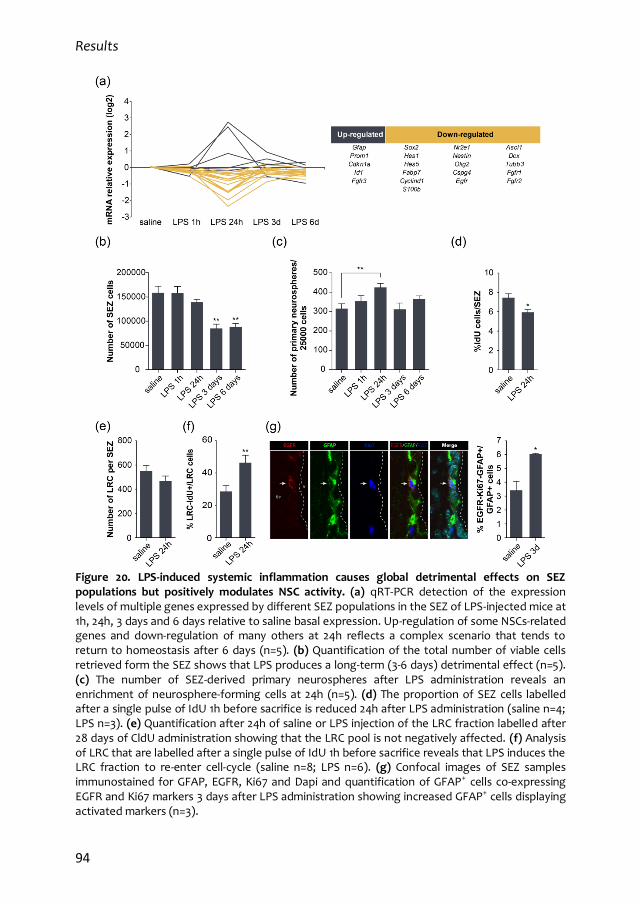
Results
94
Figure 20. LPS-induced systemic inflammation causes global detrimental effects on SEZ populations but positively modulates NSC activity. (a) qRT-PCR detection of the expression levels of multiple genes expressed by different SEZ populations in the SEZ of LPS-injected mice at 1h, 24h, 3 days and 6 days relative to saline basal expression. Up-regulation of some NSCs-related genes and down-regulation of many others at 24h reflects a complex scenario that tends to return to homeostasis after 6 days (n=5). (b) Quantification of the total number of viable cells retrieved form the SEZ shows that LPS produces a long-term (3-6 days) detrimental effect (n=5). (c) The number of SEZ-derived primary neurospheres after LPS administration reveals an enrichment of neurosphere-forming cells at 24h (n=5). (d) The proportion of SEZ cells labelled after a single pulse of IdU 1h before sacrifice is reduced 24h after LPS administration (saline n=4; LPS n=3). (e) Quantification after 24h of saline or LPS injection of the LRC fraction labelled after 28 days of CldU administration showing that the LRC pool is not negatively affected. (f) Analysis of LRC that are labelled after a single pulse of IdU 1h before sacrifice reveals that LPS induces the LRC fraction to re-enter cell-cycle (saline n=8; LPS n=6). (g) Confocal images of SEZ samples immunostained for GFAP, EGFR, Ki67 and Dapi and quantification of GFAP+ cells co-expressing EGFR and Ki67 markers 3 days after LPS administration showing increased GFAP+ cells displaying activated markers (n=3).
Results
95
In order to evaluate effects of LPS in the different NSC populations the SEZs
of naïve, saline or LPS-injected mice were dissociated 24h after the injection and
prepared for flow cytometry. While naïve and saline groups showed similar
proportion of activated NSCs, as expected, we found that qNSC/aNSC profile
shifted towards activation in the LPS-injected mice (Figure 21a). Additionally, we
could see that this increased activation led to a significant enrichment in TAPs and
EGFR+ neuroblasts but not in EGFR– neuroblasts (Figure 21b-d). These results
corroborated that acute inflammation is promoting activation of both aNSCs, as
indicated by the nucleoside incorporation experiments shown above, and qNSCs,
as indicated by the flow cytometry analysis. The observation that this activation
does not result in increased levels of EGFR– neuroblasts is in line with reportedly
reduced neurogenesis observed after LPS treatment and suggests direct
deleterious effects of inflammation in neuroblasts (Monje et al., 2003).
Figure 21. LPS-induced systemic inflammation activates NSCs and increases the production of TAPs and EGFR+ neuroblasts. (a-d) Flow cytometry analysis of NSCs, TAPs and neuroblasts in naïve, saline and LPS groups. Quantification of each cell type 24h after LPS injection shows (a) a higher proportion of NSCs in activated state and (b) increased TAPs (c) and EGFR+ neuroblasts but not (d) EGFR– neuroblasts in the SEZ (naive n=6; saline n=4; LPS 24h n=4).
We further stratified the NSC population in our LPS paradigm. Apart from the
previously observed increase in activated NSCs, we found that the remaining
quiescent pool contained more alert cells (qNSC2) at the expense of the qNSC1
population compared to the naïve basal situation (Figure 22a) suggesting that
inflammation was indeed activating qNSC1 to promote a qNSC2 state.
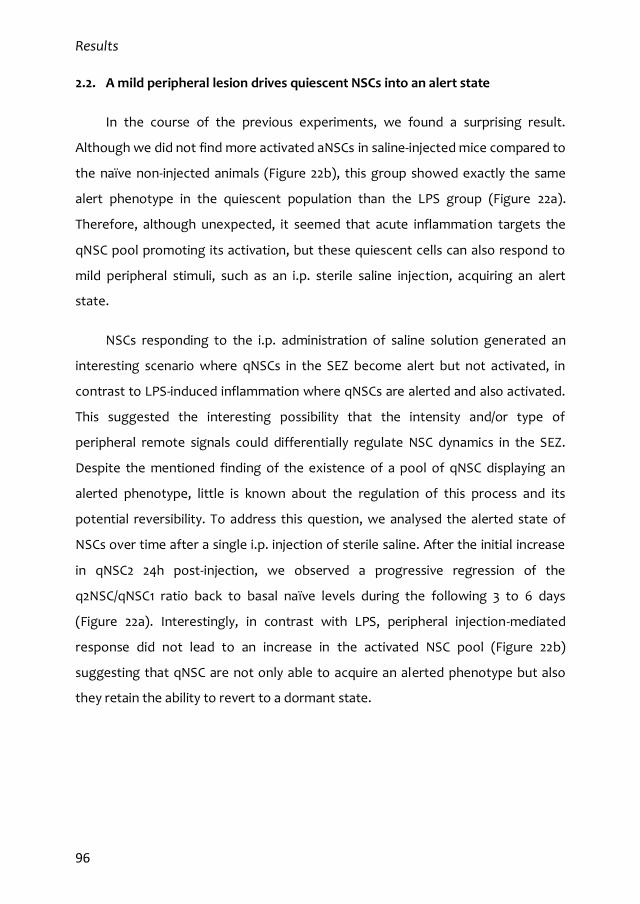
Results
96
2.2. A mild peripheral lesion drives quiescent NSCs into an alert state
In the course of the previous experiments, we found a surprising result.
Although we did not find more activated aNSCs in saline-injected mice compared to
the naïve non-injected animals (Figure 22b), this group showed exactly the same
alert phenotype in the quiescent population than the LPS group (Figure 22a).
Therefore, although unexpected, it seemed that acute inflammation targets the
qNSC pool promoting its activation, but these quiescent cells can also respond to
mild peripheral stimuli, such as an i.p. sterile saline injection, acquiring an alert
state.
NSCs responding to the i.p. administration of saline solution generated an
interesting scenario where qNSCs in the SEZ become alert but not activated, in
contrast to LPS-induced inflammation where qNSCs are alerted and also activated.
This suggested the interesting possibility that the intensity and/or type of
peripheral remote signals could differentially regulate NSC dynamics in the SEZ.
Despite the mentioned finding of the existence of a pool of qNSC displaying an
alerted phenotype, little is known about the regulation of this process and its
potential reversibility. To address this question, we analysed the alerted state of
NSCs over time after a single i.p. injection of sterile saline. After the initial increase
in qNSC2 24h post-injection, we observed a progressive regression of the
q2NSC/qNSC1 ratio back to basal naïve levels during the following 3 to 6 days
(Figure 22a). Interestingly, in contrast with LPS, peripheral injection-mediated
response did not lead to an increase in the activated NSC pool (Figure 22b)
suggesting that qNSC are not only able to acquire an alerted phenotype but also
they retain the ability to revert to a dormant state.
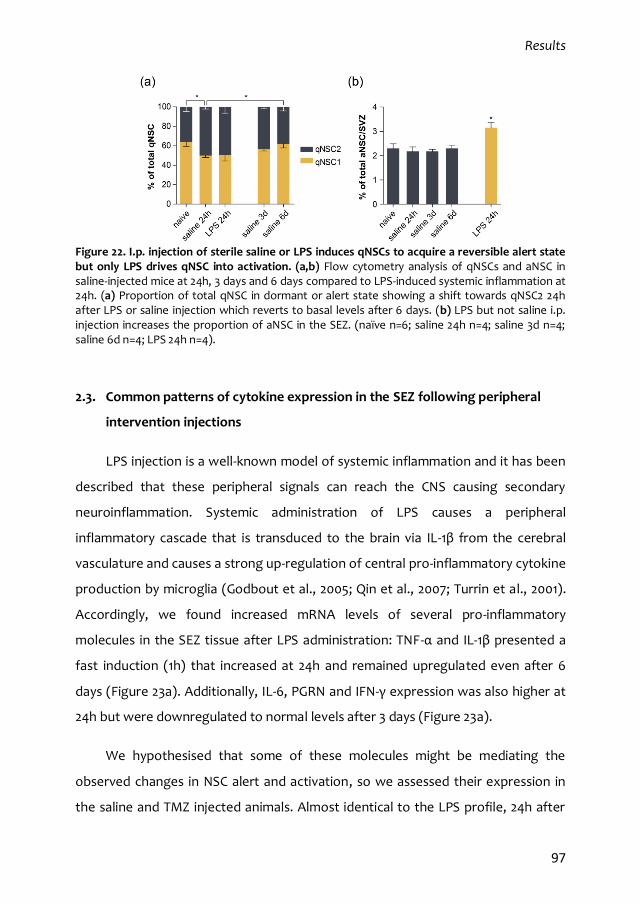
Results
97
Figure 22. I.p. injection of sterile saline or LPS induces qNSCs to acquire a reversible alert state but only LPS drives qNSC into activation. (a,b) Flow cytometry analysis of qNSCs and aNSC in saline-injected mice at 24h, 3 days and 6 days compared to LPS-induced systemic inflammation at 24h. (a) Proportion of total qNSC in dormant or alert state showing a shift towards qNSC2 24h after LPS or saline injection which reverts to basal levels after 6 days. (b) LPS but not saline i.p. injection increases the proportion of aNSC in the SEZ. (naïve n=6; saline 24h n=4; saline 3d n=4; saline 6d n=4; LPS 24h n=4).
2.3. Common patterns of cytokine expression in the SEZ following peripheral
intervention injections
LPS injection is a well-known model of systemic inflammation and it has been
described that these peripheral signals can reach the CNS causing secondary
neuroinflammation. Systemic administration of LPS causes a peripheral
inflammatory cascade that is transduced to the brain via IL-1β from the cerebral
vasculature and causes a strong up-regulation of central pro-inflammatory cytokine
production by microglia (Godbout et al., 2005; Qin et al., 2007; Turrin et al., 2001).
Accordingly, we found increased mRNA levels of several pro-inflammatory
molecules in the SEZ tissue after LPS administration: TNF-α and IL-1β presented a
fast induction (1h) that increased at 24h and remained upregulated even after 6
days (Figure 23a). Additionally, IL-6, PGRN and IFN-γ expression was also higher at
24h but were downregulated to normal levels after 3 days (Figure 23a).
We hypothesised that some of these molecules might be mediating the
observed changes in NSC alert and activation, so we assessed their expression in
the saline and TMZ injected animals. Almost identical to the LPS profile, 24h after
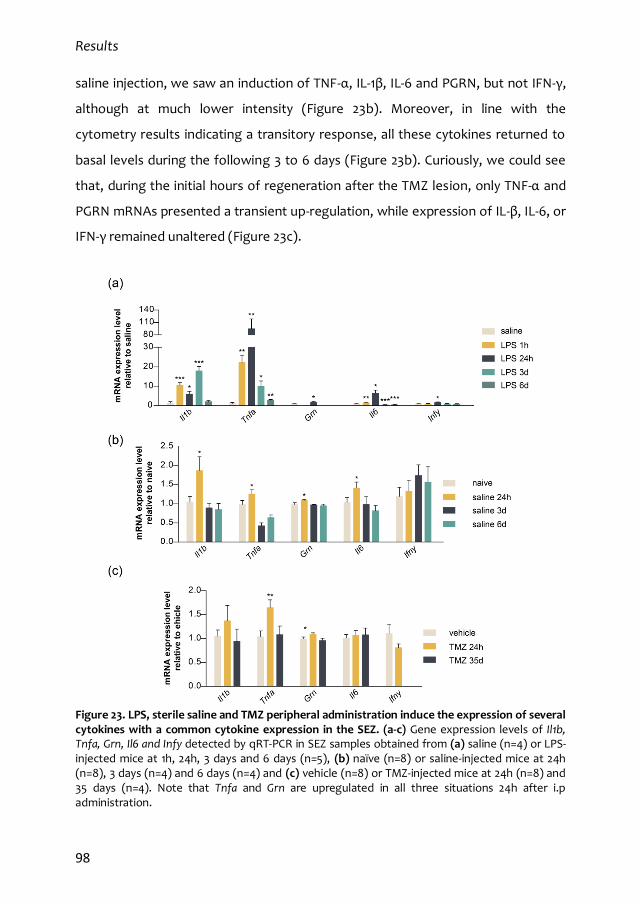
Results
98
saline injection, we saw an induction of TNF-α, IL-1β, IL-6 and PGRN, but not IFN-γ,
although at much lower intensity (Figure 23b). Moreover, in line with the
cytometry results indicating a transitory response, all these cytokines returned to
basal levels during the following 3 to 6 days (Figure 23b). Curiously, we could see
that, during the initial hours of regeneration after the TMZ lesion, only TNF-α and
PGRN mRNAs presented a transient up-regulation, while expression of IL-β, IL-6, or
IFN-γ remained unaltered (Figure 23c).
Figure 23. LPS, sterile saline and TMZ peripheral administration induce the expression of several cytokines with a common cytokine expression in the SEZ. (a-c) Gene expression levels of Il1b, Tnfa, Grn, Il6 and Infy detected by qRT-PCR in SEZ samples obtained from (a) saline (n=4) or LPS-injected mice at 1h, 24h, 3 days and 6 days (n=5), (b) naïve (n=8) or saline-injected mice at 24h (n=8), 3 days (n=4) and 6 days (n=4) and (c) vehicle (n=8) or TMZ-injected mice at 24h (n=8) and 35 days (n=4). Note that Tnfa and Grn are upregulated in all three situations 24h after i.p administration.
Results
99
Taken together, these results indicated that, in response to different stimuli
that have in common the conservative mobilization of the dormant NSC pool,
either to become activated (TMZ and LPS injections) or just to acquire a transient
alert phenotype (saline injection), inflammatory mediators TNF-α and PGRN are
induced in the SEZ tissue and might, therefore, be act as niche factors regulating
these processes.
3. Dual effects of TNF-α in adult subependymal NSCs
3.1. Mixed dose-dependent effects of TNF-α
In order to study the effects of TNF-α in NSCs in greater depth, we decided to
take advantage of the neurosphere assay. Neurospheres contain a heterogeneous
population of cells where a small fraction of NSCs coexist with their progeny
(different types of more committed progenitors and even some differentiated
cells). As a consequence, in order to address specific effects of a factor on the NSC
population, neurosphere formation must be evaluated both in the presence of the
tested molecule and in a sequential assay by disaggregating the treated
neurospheres and sub-culturing them in the absence of the factor (Belenguer et al.,
2016). NSCs were plated at very low density and treated with increasing
concentrations of recombinant murine TNF-α. After 5 div, compared to untreated
controls, cultures treated with the lowest concentration (0.1 ng/ml) formed more
neurospheres, whereas increasing concentrations of TNF-α (10–20 ng/ml) led to a
reduction in the number of neurospheres (Figure 24b). These results suggested
that TNF-α modulates NSC proliferation and/or survival in a complex manner.
Nevertheless, when dissociated and plated again in the absence of the factor, TNF-
α pre-treated cells, at any concentration, consistently gave rise to a greater number
of neurospheres (Figure 24c) suggesting that, besides its effects in
proliferation/survival, TNF-α is specifically promoting the expansion of the
population of neurosphere forming cells.
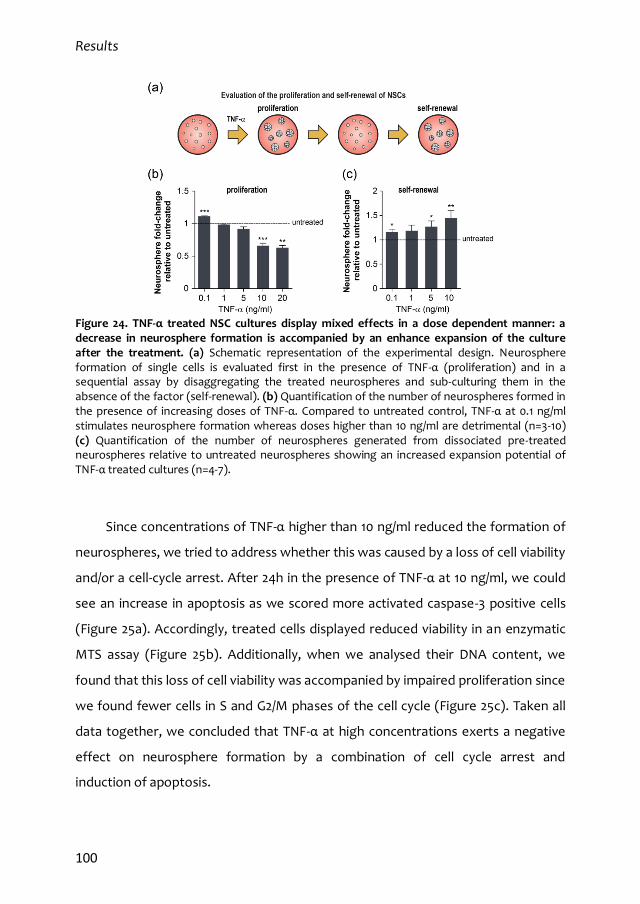
Results
100
Figure 24. TNF-α treated NSC cultures display mixed effects in a dose dependent manner: a decrease in neurosphere formation is accompanied by an enhance expansion of the culture after the treatment. (a) Schematic representation of the experimental design. Neurosphere formation of single cells is evaluated first in the presence of TNF-α (proliferation) and in a sequential assay by disaggregating the treated neurospheres and sub-culturing them in the absence of the factor (self-renewal). (b) Quantification of the number of neurospheres formed in the presence of increasing doses of TNF-α. Compared to untreated control, TNF-α at 0.1 ng/ml stimulates neurosphere formation whereas doses higher than 10 ng/ml are detrimental (n=3-10) (c) Quantification of the number of neurospheres generated from dissociated pre-treated neurospheres relative to untreated neurospheres showing an increased expansion potential of TNF-α treated cultures (n=4-7).
Since concentrations of TNF-α higher than 10 ng/ml reduced the formation of
neurospheres, we tried to address whether this was caused by a loss of cell viability
and/or a cell-cycle arrest. After 24h in the presence of TNF-α at 10 ng/ml, we could
see an increase in apoptosis as we scored more activated caspase-3 positive cells
(Figure 25a). Accordingly, treated cells displayed reduced viability in an enzymatic
MTS assay (Figure 25b). Additionally, when we analysed their DNA content, we
found that this loss of cell viability was accompanied by impaired proliferation since
we found fewer cells in S and G2/M phases of the cell cycle (Figure 25c). Taken all
data together, we concluded that TNF-α at high concentrations exerts a negative
effect on neurosphere formation by a combination of cell cycle arrest and
induction of apoptosis.
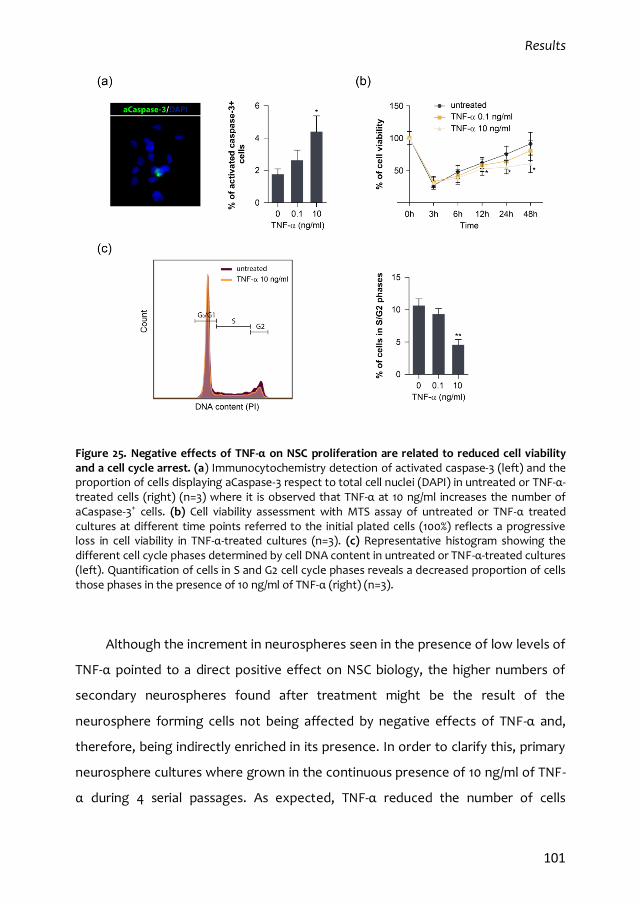
Results
101
Figure 25. Negative effects of TNF-α on NSC proliferation are related to reduced cell viability and a cell cycle arrest. (a) Immunocytochemistry detection of activated caspase-3 (left) and the proportion of cells displaying aCaspase-3 respect to total cell nuclei (DAPI) in untreated or TNF-α- treated cells (right) (n=3) where it is observed that TNF-α at 10 ng/ml increases the number of aCaspase-3+ cells. (b) Cell viability assessment with MTS assay of untreated or TNF-α treated cultures at different time points referred to the initial plated cells (100%) reflects a progressive loss in cell viability in TNF-α-treated cultures (n=3). (c) Representative histogram showing the different cell cycle phases determined by cell DNA content in untreated or TNF-α-treated cultures (left). Quantification of cells in S and G2 cell cycle phases reveals a decreased proportion of cells those phases in the presence of 10 ng/ml of TNF-α (right) (n=3).
Although the increment in neurospheres seen in the presence of low levels of
TNF-α pointed to a direct positive effect on NSC biology, the higher numbers of
secondary neurospheres found after treatment might be the result of the
neurosphere forming cells not being affected by negative effects of TNF-α and,
therefore, being indirectly enriched in its presence. In order to clarify this, primary
neurosphere cultures where grown in the continuous presence of 10 ng/ml of TNF-
α during 4 serial passages. As expected, TNF-α reduced the number of cells
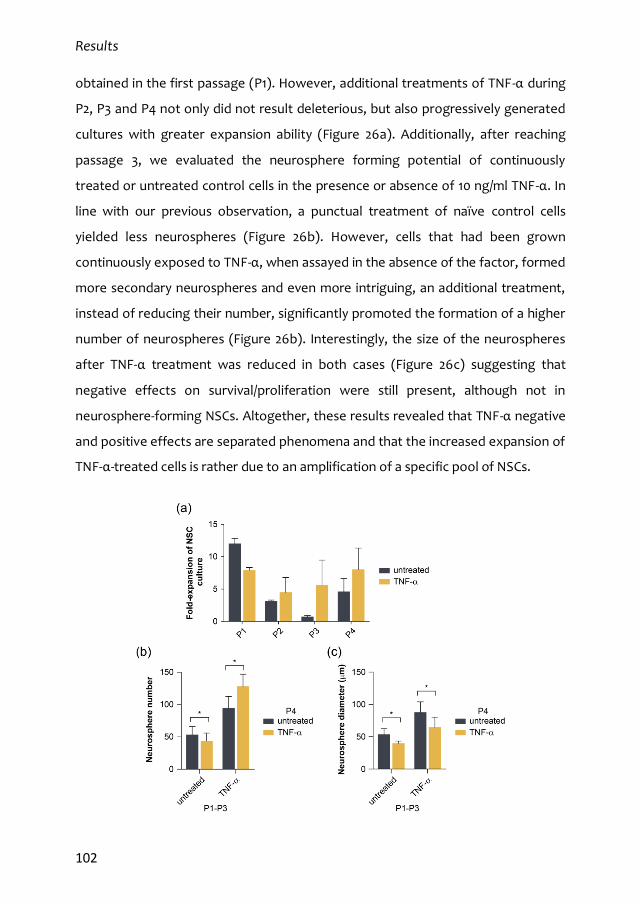
Results
102
obtained in the first passage (P1). However, additional treatments of TNF-α during
P2, P3 and P4 not only did not result deleterious, but also progressively generated
cultures with greater expansion ability (Figure 26a). Additionally, after reaching
passage 3, we evaluated the neurosphere forming potential of continuously
treated or untreated control cells in the presence or absence of 10 ng/ml TNF-α. In
line with our previous observation, a punctual treatment of naïve control cells
yielded less neurospheres (Figure 26b). However, cells that had been grown
continuously exposed to TNF-α, when assayed in the absence of the factor, formed
more secondary neurospheres and even more intriguing, an additional treatment,
instead of reducing their number, significantly promoted the formation of a higher
number of neurospheres (Figure 26b). Interestingly, the size of the neurospheres
after TNF-α treatment was reduced in both cases (Figure 26c) suggesting that
negative effects on survival/proliferation were still present, although not in
neurosphere-forming NSCs. Altogether, these results revealed that TNF-α negative
and positive effects are separated phenomena and that the increased expansion of
TNF-α-treated cells is rather due to an amplification of a specific pool of NSCs.
Results
103
Figure 26. Continuous exposure to TNF-α promotes the expansion of NSCs in neurosphere cultures. (a) Evaluation of the number of cells obtained after each cell passage (P1 to P4) referred to the initial number of plated cells in each passage. NSC cultures continuously treated with 10 ng/ml of TNF-α show increased expansion potential after 3 serial passages. (b) Scoring of the number of neurospheres obtained from untreated, punctually treated or continuously treated cells during 4 serial passages with 10 ng/ml TNF-α reflects an exacerbation of neurosphere formation after a TNF-α reiterative treatment. (c) Representation of the mean neurosphere diameter in untreated or TNF-α treated cells reveals a reduction of neurosphere size when TNF-α is present. (n=3)
In order to test if TNF-α produced by microglia had the same effect as the
recombinant one, we forced the acquisition of a pro-inflammatory state in the
microglia cell line N13 by stimulation with LPS. Then we cultured activated microglia
cells in neurosphere growth medium to obtain a medium conditioned by activated
microglia (MCM) that could be added afterwards to NSCs. We observed that NSCs
grown in the presence of MCM formed more neurospheres and that, when
disaggregated and plated again in regular medium, MCM-treated cells continued to
form more secondary neurospheres compared to MCM-untreated ones (Figure
27a,b). This result highlighted that activated microglia produce factors that
increase not only NSC proliferation and/or survival, but also the expansion of the
NSC pool through self-renewal.
Because activated microglia secrete several cytokines and modulators other
than TNF-α, to test its specific contribution to this process we eliminated this
cytokine from the MCM by immunoprecipitation with an excess of a TNF-α specific
antibody (Figure 27c). NSCs cultured in the presence of immunodepleted medium
or in medium immunoprecipitated with a non-related antibody of the same isotype
as a control, still formed more neurospheres than those on regular medium (Figure
27d). This result revealed that microglia secreted factors, other than TNF-α,
promote the proliferation and/or survival of NSCs in vitro. Nonetheless, when
dissociated and submitted to a sequential neurosphere assay in regular medium,
cells pre-treated with TNF-α immunodepleted medium did not show any increase in
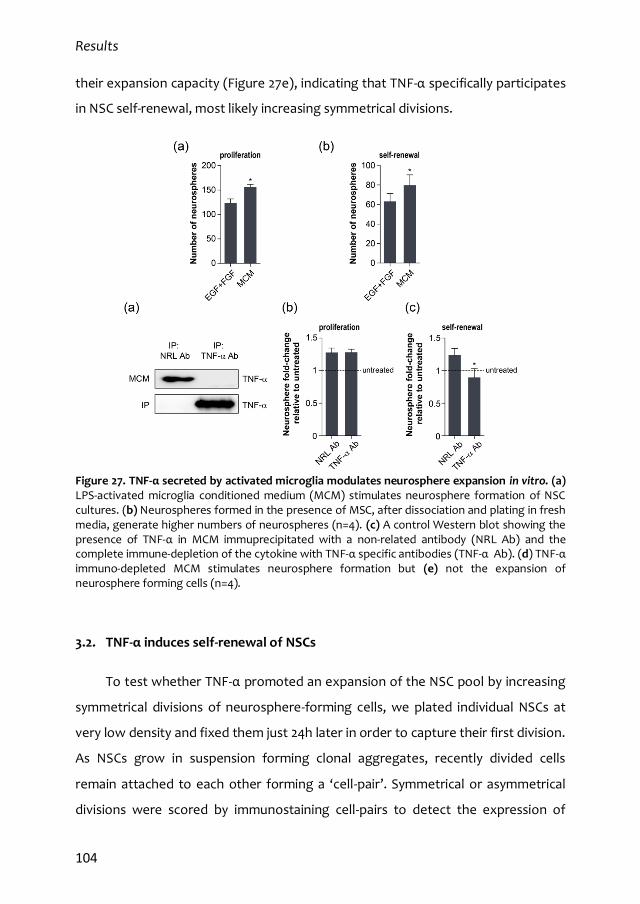
Results
104
their expansion capacity (Figure 27e), indicating that TNF-α specifically participates
in NSC self-renewal, most likely increasing symmetrical divisions.
Figure 27. TNF-α secreted by activated microglia modulates neurosphere expansion in vitro. (a) LPS-activated microglia conditioned medium (MCM) stimulates neurosphere formation of NSC cultures. (b) Neurospheres formed in the presence of MSC, after dissociation and plating in fresh media, generate higher numbers of neurospheres (n=4). (c) A control Western blot showing the presence of TNF-α in MCM immuprecipitated with a non-related antibody (NRL Ab) and the complete immune-depletion of the cytokine with TNF-α specific antibodies (TNF-α Ab). (d) TNF-α immuno-depleted MCM stimulates neurosphere formation but (e) not the expansion of neurosphere forming cells (n=4).
3.2. TNF-α induces self-renewal of NSCs
To test whether TNF-α promoted an expansion of the NSC pool by increasing
symmetrical divisions of neurosphere-forming cells, we plated individual NSCs at
very low density and fixed them just 24h later in order to capture their first division.
As NSCs grow in suspension forming clonal aggregates, recently divided cells
remain attached to each other forming a ‘cell-pair’. Symmetrical or asymmetrical
divisions were scored by immunostaining cell-pairs to detect the expression of
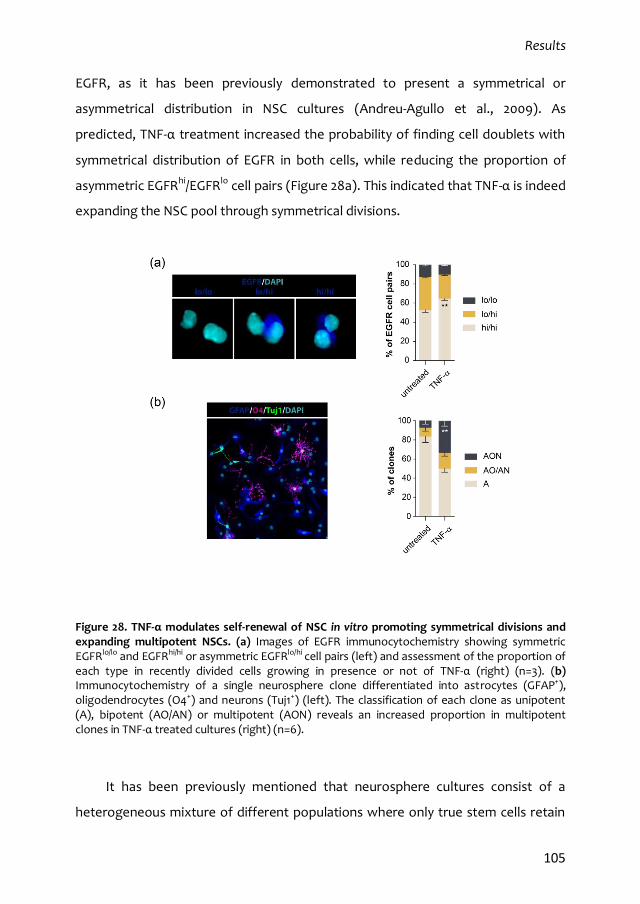
Results
105
EGFR, as it has been previously demonstrated to present a symmetrical or
asymmetrical distribution in NSC cultures (Andreu-Agullo et al., 2009). As
predicted, TNF-α treatment increased the probability of finding cell doublets with
symmetrical distribution of EGFR in both cells, while reducing the proportion of
asymmetric EGFRhi/EGFRlo cell pairs (Figure 28a). This indicated that TNF-α is indeed
expanding the NSC pool through symmetrical divisions.
Figure 28. TNF-α modulates self-renewal of NSC in vitro promoting symmetrical divisions and expanding multipotent NSCs. (a) Images of EGFR immunocytochemistry showing symmetric EGFRlo/lo and EGFRhi/hi or asymmetric EGFRlo/hi cell pairs (left) and assessment of the proportion of each type in recently divided cells growing in presence or not of TNF-α (right) (n=3). (b) Immunocytochemistry of a single neurosphere clone differentiated into astrocytes (GFAP+), oligodendrocytes (O4+) and neurons (Tuj1+) (left). The classification of each clone as unipotent (A), bipotent (AO/AN) or multipotent (AON) reveals an increased proportion in multipotent clones in TNF-α treated cultures (right) (n=6).
It has been previously mentioned that neurosphere cultures consist of a
heterogeneous mixture of different populations where only true stem cells retain
Results
106
the maximum potential (tripotency) while different progenitor cells will give rise to
one (unipotency) or two at most (bipotency) cell types. Therefore, we sought to
determine whether the augmented pool of NSCs induced by TNF-α retained its
potential. Neurospheres formed in the presence of TNF-α were dissociated and the
individual cells plated again at low density to allow them to generate new
neurospheres; the latter were then individually transferred to matrigel-coated
wells to start a differentiation protocol (Belenguer et al., 2016). After 7 days of
differentiation, immunostaining with markers of the three neural lineages (GFAP
for astrocytes -A-, Tuj1 for neurons -N-, and O4 for oligodendrocytes -O-) revealed
that neurospheres from TNF-α-treated cultures were enriched in cells with full NSC
potential (tripotent clones, AON) (Figure 28b), indicating that the observed
expansion of neurospheres after TNF-α treatment is the consequence of an
increase in self-renewing symmetric divisions of multipotent NSCs.
3.3. Differential effects TNF-α signalling are mediated by distinct receptors
We had found a combination of positive and negative effects of TNF-α on
NSCs. It is well known that TNF-α is a multifunctional cytokine that can exert its
functions binding to two different receptors, TNFR1 and TNFR2 (Cabal-Hierro and
Lazo, 2012; MacEwan, 2002). In order to test whether the different effects of TNF-α
on NSC behaviour were indeed mediated by different receptors, we established
NSC cultures from wild-type (WT), single knockout for each receptor (R1KO and
R2KO) and double knockout lacking both of them (DKO) mice, and treated them
with low (0.1 ng/ml) or high (10 ng/ml) concentrations of TNF-α for 5 days to study
neurosphere formation. Neither of the treatments had any influence on DKO cells
(Figure 29b,c), confirming that the observed effects were mediated exclusively by
these two receptors. However, when we analysed R1KO cells, instead of finding a
dual effect depending on the concentration as it happens with WT cells, both
concentrations of TNF-α promoted the formation of more neurospheres, either
when present or in the next passage after treatment (Figure 29b,c). These data
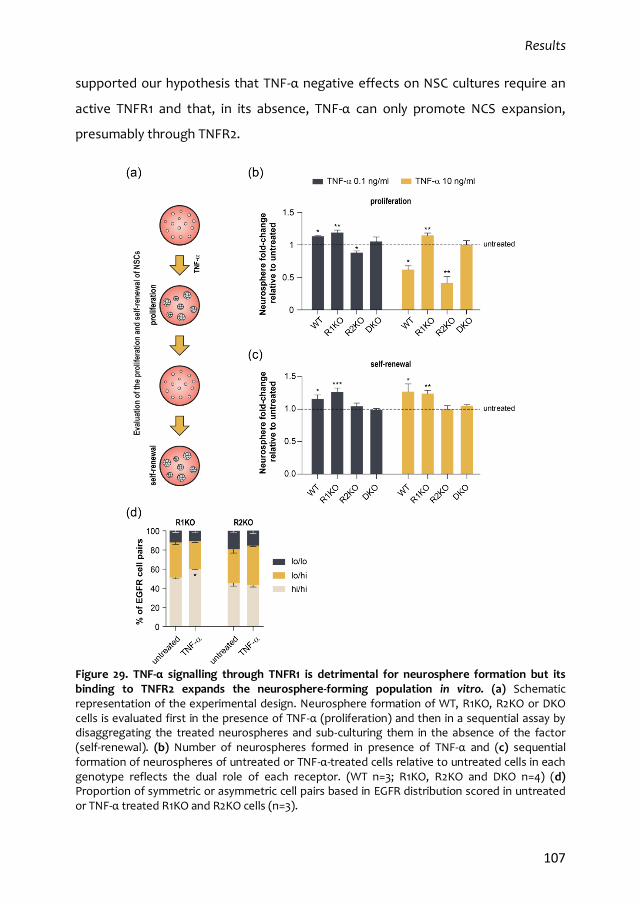
Results
107
supported our hypothesis that TNF-α negative effects on NSC cultures require an
active TNFR1 and that, in its absence, TNF-α can only promote NCS expansion,
presumably through TNFR2.
Figure 29. TNF-α signalling through TNFR1 is detrimental for neurosphere formation but its binding to TNFR2 expands the neurosphere-forming population in vitro. (a) Schematic representation of the experimental design. Neurosphere formation of WT, R1KO, R2KO or DKO cells is evaluated first in the presence of TNF-α (proliferation) and then in a sequential assay by disaggregating the treated neurospheres and sub-culturing them in the absence of the factor (self-renewal). (b) Number of neurospheres formed in presence of TNF-α and (c) sequential formation of neurospheres of untreated or TNF-α-treated cells relative to untreated cells in each genotype reflects the dual role of each receptor. (WT n=3; R1KO, R2KO and DKO n=4) (d) Proportion of symmetric or asymmetric cell pairs based in EGFR distribution scored in untreated or TNF-α treated R1KO and R2KO cells (n=3).
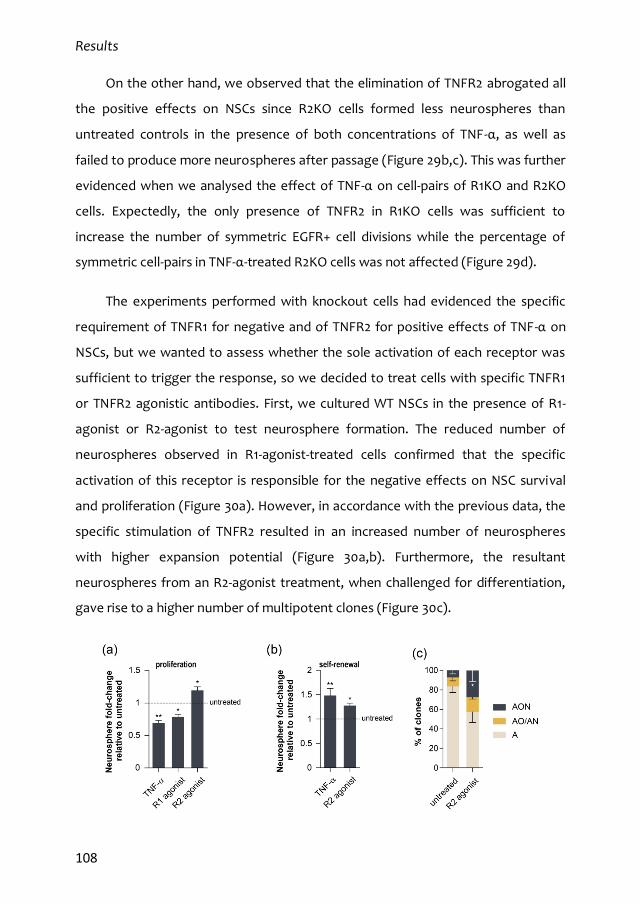
Results
108
On the other hand, we observed that the elimination of TNFR2 abrogated all
the positive effects on NSCs since R2KO cells formed less neurospheres than
untreated controls in the presence of both concentrations of TNF-α, as well as
failed to produce more neurospheres after passage (Figure 29b,c). This was further
evidenced when we analysed the effect of TNF-α on cell-pairs of R1KO and R2KO
cells. Expectedly, the only presence of TNFR2 in R1KO cells was sufficient to
increase the number of symmetric EGFR+ cell divisions while the percentage of
symmetric cell-pairs in TNF-α-treated R2KO cells was not affected (Figure 29d).
The experiments performed with knockout cells had evidenced the specific
requirement of TNFR1 for negative and of TNFR2 for positive effects of TNF-α on
NSCs, but we wanted to assess whether the sole activation of each receptor was
sufficient to trigger the response, so we decided to treat cells with specific TNFR1
or TNFR2 agonistic antibodies. First, we cultured WT NSCs in the presence of R1-
agonist or R2-agonist to test neurosphere formation. The reduced number of
neurospheres observed in R1-agonist-treated cells confirmed that the specific
activation of this receptor is responsible for the negative effects on NSC survival
and proliferation (Figure 30a). However, in accordance with the previous data, the
specific stimulation of TNFR2 resulted in an increased number of neurospheres
with higher expansion potential (Figure 30a,b). Furthermore, the resultant
neurospheres from an R2-agonist treatment, when challenged for differentiation,
gave rise to a higher number of multipotent clones (Figure 30c).
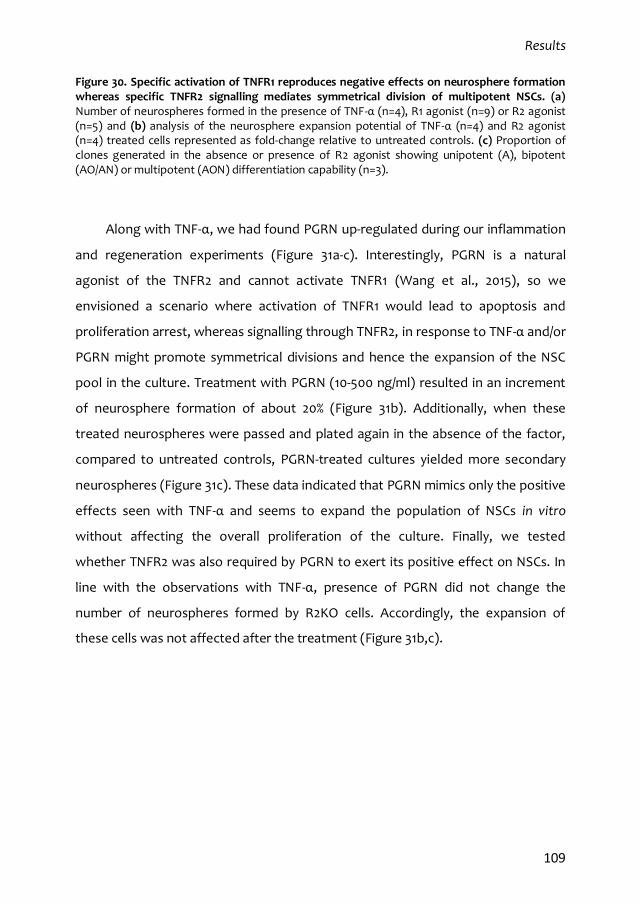
Results
109
Figure 30. Specific activation of TNFR1 reproduces negative effects on neurosphere formation whereas specific TNFR2 signalling mediates symmetrical division of multipotent NSCs. (a) Number of neurospheres formed in the presence of TNF-α (n=4), R1 agonist (n=9) or R2 agonist (n=5) and (b) analysis of the neurosphere expansion potential of TNF-α (n=4) and R2 agonist (n=4) treated cells represented as fold-change relative to untreated controls. (c) Proportion of clones generated in the absence or presence of R2 agonist showing unipotent (A), bipotent (AO/AN) or multipotent (AON) differentiation capability (n=3).
Along with TNF-α, we had found PGRN up-regulated during our inflammation
and regeneration experiments (Figure 31a-c). Interestingly, PGRN is a natural
agonist of the TNFR2 and cannot activate TNFR1 (Wang et al., 2015), so we
envisioned a scenario where activation of TNFR1 would lead to apoptosis and
proliferation arrest, whereas signalling through TNFR2, in response to TNF-α and/or
PGRN might promote symmetrical divisions and hence the expansion of the NSC
pool in the culture. Treatment with PGRN (10-500 ng/ml) resulted in an increment
of neurosphere formation of about 20% (Figure 31b). Additionally, when these
treated neurospheres were passed and plated again in the absence of the factor,
compared to untreated controls, PGRN-treated cultures yielded more secondary
neurospheres (Figure 31c). These data indicated that PGRN mimics only the positive
effects seen with TNF-α and seems to expand the population of NSCs in vitro
without affecting the overall proliferation of the culture. Finally, we tested
whether TNFR2 was also required by PGRN to exert its positive effect on NSCs. In
line with the observations with TNF-α, presence of PGRN did not change the
number of neurospheres formed by R2KO cells. Accordingly, the expansion of
these cells was not affected after the treatment (Figure 31b,c).
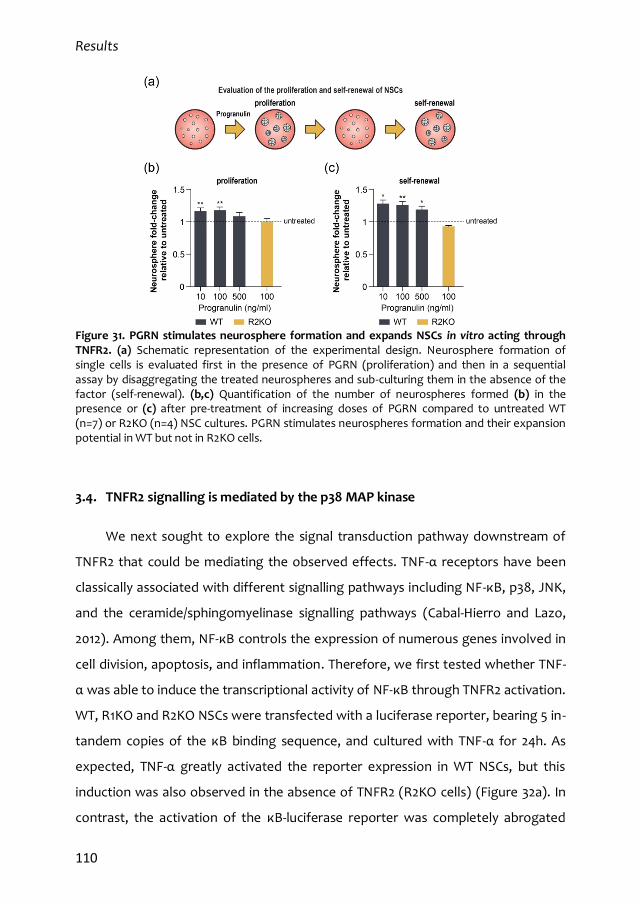
Results
110
Figure 31. PGRN stimulates neurosphere formation and expands NSCs in vitro acting through TNFR2. (a) Schematic representation of the experimental design. Neurosphere formation of single cells is evaluated first in the presence of PGRN (proliferation) and then in a sequential assay by disaggregating the treated neurospheres and sub-culturing them in the absence of the factor (self-renewal). (b,c) Quantification of the number of neurospheres formed (b) in the presence or (c) after pre-treatment of increasing doses of PGRN compared to untreated WT (n=7) or R2KO (n=4) NSC cultures. PGRN stimulates neurospheres formation and their expansion potential in WT but not in R2KO cells.
3.4. TNFR2 signalling is mediated by the p38 MAP kinase
We next sought to explore the signal transduction pathway downstream of
TNFR2 that could be mediating the observed effects. TNF-α receptors have been
classically associated with different signalling pathways including NF-κB, p38, JNK,
and the ceramide/sphingomyelinase signalling pathways (Cabal-Hierro and Lazo,
2012). Among them, NF-κB controls the expression of numerous genes involved in
cell division, apoptosis, and inflammation. Therefore, we first tested whether TNF-
α was able to induce the transcriptional activity of NF-κB through TNFR2 activation.
WT, R1KO and R2KO NSCs were transfected with a luciferase reporter, bearing 5 in-
tandem copies of the κB binding sequence, and cultured with TNF-α for 24h. As
expected, TNF-α greatly activated the reporter expression in WT NSCs, but this
induction was also observed in the absence of TNFR2 (R2KO cells) (Figure 32a). In
contrast, the activation of the κB-luciferase reporter was completely abrogated
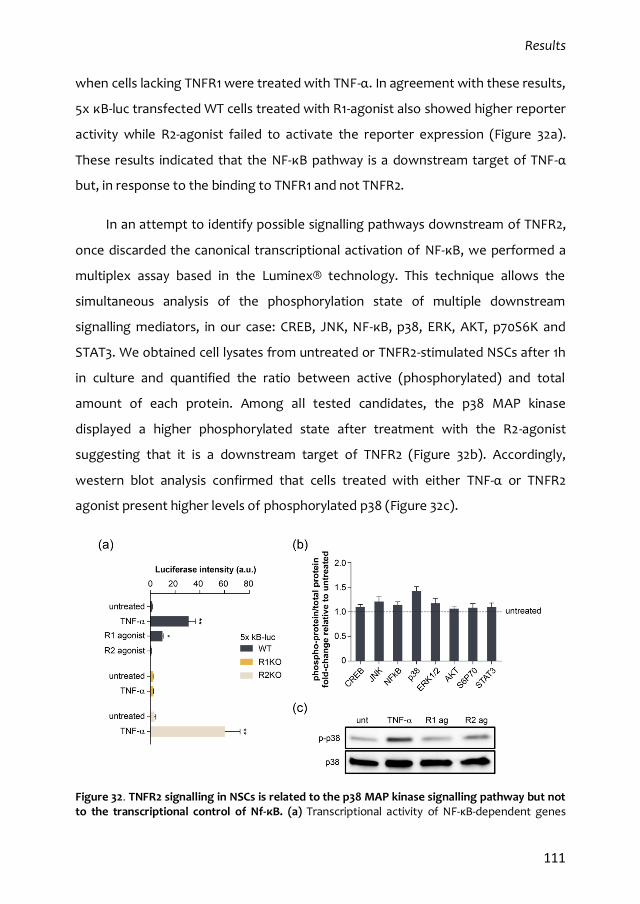
Results
111
when cells lacking TNFR1 were treated with TNF-α. In agreement with these results,
5x κB-luc transfected WT cells treated with R1-agonist also showed higher reporter
activity while R2-agonist failed to activate the reporter expression (Figure 32a).
These results indicated that the NF-κB pathway is a downstream target of TNF-α
but, in response to the binding to TNFR1 and not TNFR2.
In an attempt to identify possible signalling pathways downstream of TNFR2,
once discarded the canonical transcriptional activation of NF-κB, we performed a
multiplex assay based in the Luminex® technology. This technique allows the
simultaneous analysis of the phosphorylation state of multiple downstream
signalling mediators, in our case: CREB, JNK, NF-κB, p38, ERK, AKT, p70S6K and
STAT3. We obtained cell lysates from untreated or TNFR2-stimulated NSCs after 1h
in culture and quantified the ratio between active (phosphorylated) and total
amount of each protein. Among all tested candidates, the p38 MAP kinase
displayed a higher phosphorylated state after treatment with the R2-agonist
suggesting that it is a downstream target of TNFR2 (Figure 32b). Accordingly,
western blot analysis confirmed that cells treated with either TNF-α or TNFR2
agonist present higher levels of phosphorylated p38 (Figure 32c).
Figure 32. TNFR2 signalling in NSCs is related to the p38 MAP kinase signalling pathway but not to the transcriptional control of Nf-κB. (a) Transcriptional activity of NF-κB-dependent genes
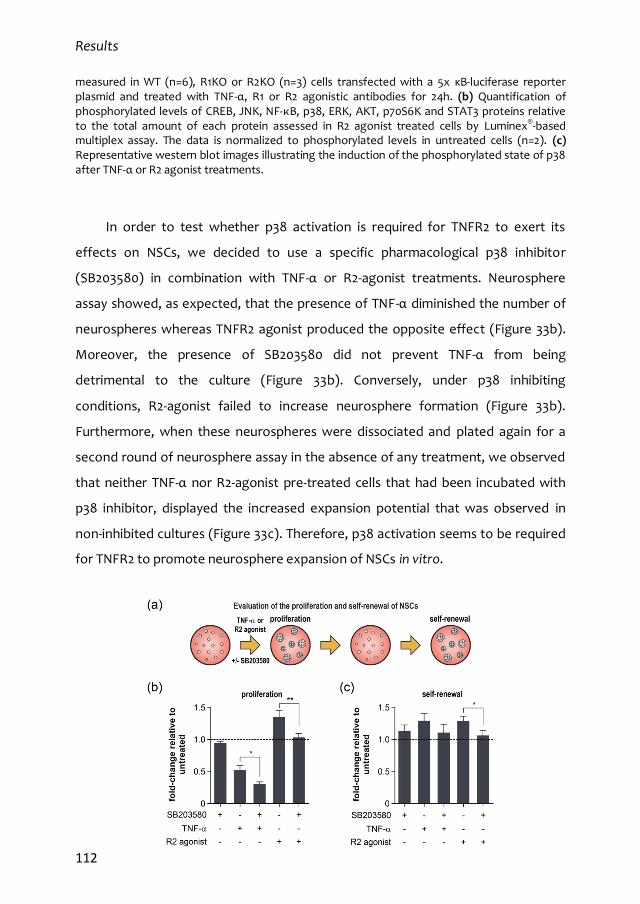
Results
112
measured in WT (n=6), R1KO or R2KO (n=3) cells transfected with a 5x κB-luciferase reporter plasmid and treated with TNF-α, R1 or R2 agonistic antibodies for 24h. (b) Quantification of phosphorylated levels of CREB, JNK, NF-κB, p38, ERK, AKT, p70S6K and STAT3 proteins relative to the total amount of each protein assessed in R2 agonist treated cells by Luminex®-based multiplex assay. The data is normalized to phosphorylated levels in untreated cells (n=2). (c) Representative western blot images illustrating the induction of the phosphorylated state of p38 after TNF-α or R2 agonist treatments.
In order to test whether p38 activation is required for TNFR2 to exert its
effects on NSCs, we decided to use a specific pharmacological p38 inhibitor
(SB203580) in combination with TNF-α or R2-agonist treatments. Neurosphere
assay showed, as expected, that the presence of TNF-α diminished the number of
neurospheres whereas TNFR2 agonist produced the opposite effect (Figure 33b).
Moreover, the presence of SB203580 did not prevent TNF-α from being
detrimental to the culture (Figure 33b). Conversely, under p38 inhibiting
conditions, R2-agonist failed to increase neurosphere formation (Figure 33b).
Furthermore, when these neurospheres were dissociated and plated again for a
second round of neurosphere assay in the absence of any treatment, we observed
that neither TNF-α nor R2-agonist pre-treated cells that had been incubated with
p38 inhibitor, displayed the increased expansion potential that was observed in
non-inhibited cultures (Figure 33c). Therefore, p38 activation seems to be required
for TNFR2 to promote neurosphere expansion of NSCs in vitro.
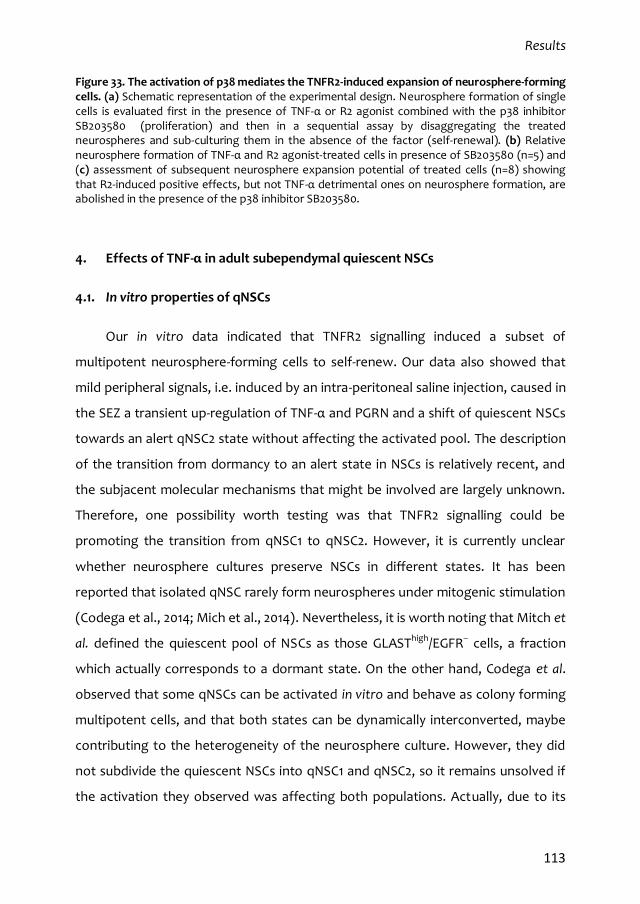
Results
113
Figure 33. The activation of p38 mediates the TNFR2-induced expansion of neurosphere-forming cells. (a) Schematic representation of the experimental design. Neurosphere formation of single cells is evaluated first in the presence of TNF-α or R2 agonist combined with the p38 inhibitor SB203580 (proliferation) and then in a sequential assay by disaggregating the treated neurospheres and sub-culturing them in the absence of the factor (self-renewal). (b) Relative neurosphere formation of TNF-α and R2 agonist-treated cells in presence of SB203580 (n=5) and (c) assessment of subsequent neurosphere expansion potential of treated cells (n=8) showing that R2-induced positive effects, but not TNF-α detrimental ones on neurosphere formation, are abolished in the presence of the p38 inhibitor SB203580.
4. Effects of TNF-α in adult subependymal quiescent NSCs
4.1. In vitro properties of qNSCs
Our in vitro data indicated that TNFR2 signalling induced a subset of
multipotent neurosphere-forming cells to self-renew. Our data also showed that
mild peripheral signals, i.e. induced by an intra-peritoneal saline injection, caused in
the SEZ a transient up-regulation of TNF-α and PGRN and a shift of quiescent NSCs
towards an alert qNSC2 state without affecting the activated pool. The description
of the transition from dormancy to an alert state in NSCs is relatively recent, and
the subjacent molecular mechanisms that might be involved are largely unknown.
Therefore, one possibility worth testing was that TNFR2 signalling could be
promoting the transition from qNSC1 to qNSC2. However, it is currently unclear
whether neurosphere cultures preserve NSCs in different states. It has been
reported that isolated qNSC rarely form neurospheres under mitogenic stimulation
(Codega et al., 2014; Mich et al., 2014). Nevertheless, it is worth noting that Mitch et
al. defined the quiescent pool of NSCs as those GLASThigh/EGFR– cells, a fraction
which actually corresponds to a dormant state. On the other hand, Codega et al.
observed that some qNSCs can be activated in vitro and behave as colony forming
multipotent cells, and that both states can be dynamically interconverted, maybe
contributing to the heterogeneity of the neurosphere culture. However, they did
not subdivide the quiescent NSCs into qNSC1 and qNSC2, so it remains unsolved if
the activation they observed was affecting both populations. Actually, due to its
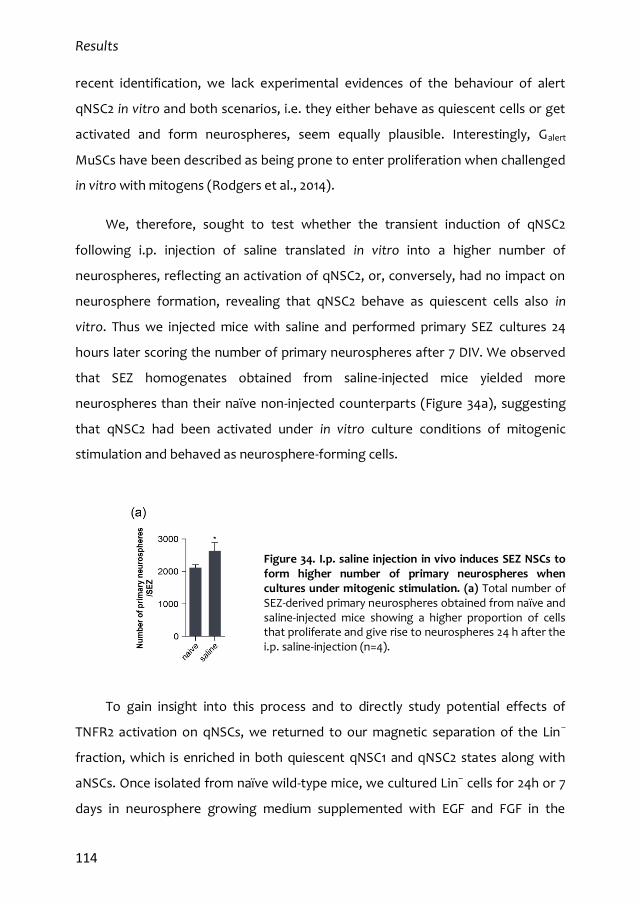
Results
114
recent identification, we lack experimental evidences of the behaviour of alert
qNSC2 in vitro and both scenarios, i.e. they either behave as quiescent cells or get
activated and form neurospheres, seem equally plausible. Interestingly, Galert
MuSCs have been described as being prone to enter proliferation when challenged
in vitro with mitogens (Rodgers et al., 2014).
We, therefore, sought to test whether the transient induction of qNSC2
following i.p. injection of saline translated in vitro into a higher number of
neurospheres, reflecting an activation of qNSC2, or, conversely, had no impact on
neurosphere formation, revealing that qNSC2 behave as quiescent cells also in
vitro. Thus we injected mice with saline and performed primary SEZ cultures 24
hours later scoring the number of primary neurospheres after 7 DIV. We observed
that SEZ homogenates obtained from saline-injected mice yielded more
neurospheres than their naïve non-injected counterparts (Figure 34a), suggesting
that qNSC2 had been activated under in vitro culture conditions of mitogenic
stimulation and behaved as neurosphere-forming cells.
Figure 34. I.p. saline injection in vivo induces SEZ NSCs to form higher number of primary neurospheres when cultures under mitogenic stimulation. (a) Total number of SEZ-derived primary neurospheres obtained from naïve and saline-injected mice showing a higher proportion of cells that proliferate and give rise to neurospheres 24 h after the i.p. saline-injection (n=4).
To gain insight into this process and to directly study potential effects of
TNFR2 activation on qNSCs, we returned to our magnetic separation of the Lin–
fraction, which is enriched in both quiescent qNSC1 and qNSC2 states along with
aNSCs. Once isolated from naïve wild-type mice, we cultured Lin– cells for 24h or 7
days in neurosphere growing medium supplemented with EGF and FGF in the
Results
115
presence or not of R2-agonist. After 24h in vitro, we could observe many Lin– cells
that had started to divide and were already forming 2-3 cell aggregates. In line with
our previous data, after 7 days in culture, we observed that treatment with R2-
agonist induced Lin–cells to generate a higher number of neurospheres (Figure
35b).
Figure 35. The specific stimulation of TNFR2 enhances neurosphere formation of isolated NSCs but culture conditions do not maintain the cell surface marker profile of SEZ NSCs. (a) Schematic representation of the experimental design. After dissociating SEZ samples, Lin– cells are magnetically isolated and cultured in the presence of TNFR2 agonist. Recently isolated Lin– or cultured under mitogenic stimulation for 24h or 7 days are analysed by flow cytometry and neurosphere formation. (b) The number of Lin–-derived primary neurospheres formed under culture conditions is increased in presence of R2 agonist (n=3). (c,d) Representative plots of Lin– cells showing the evolution of NSC cell surface markers (GLAST, CD9, EGFR and CD24) under culture conditions. Note that after 24h and 7 days in vitro, none of the Lin– cells maintains the expected marker expression profile displaying (c) homogeneous levels of GLAST and CD9, and (d) low but evident level of EGFR combined with high levels of CD24.
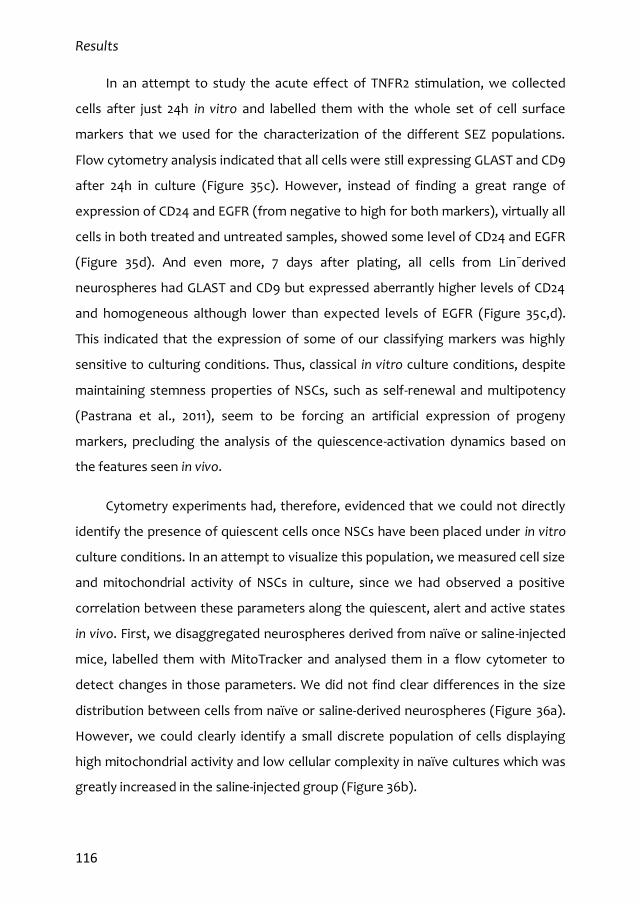
Results
116
In an attempt to study the acute effect of TNFR2 stimulation, we collected
cells after just 24h in vitro and labelled them with the whole set of cell surface
markers that we used for the characterization of the different SEZ populations.
Flow cytometry analysis indicated that all cells were still expressing GLAST and CD9
after 24h in culture (Figure 35c). However, instead of finding a great range of
expression of CD24 and EGFR (from negative to high for both markers), virtually all
cells in both treated and untreated samples, showed some level of CD24 and EGFR
(Figure 35d). And even more, 7 days after plating, all cells from Lin–derived
neurospheres had GLAST and CD9 but expressed aberrantly higher levels of CD24
and homogeneous although lower than expected levels of EGFR (Figure 35c,d).
This indicated that the expression of some of our classifying markers was highly
sensitive to culturing conditions. Thus, classical in vitro culture conditions, despite
maintaining stemness properties of NSCs, such as self-renewal and multipotency
(Pastrana et al., 2011), seem to be forcing an artificial expression of progeny
markers, precluding the analysis of the quiescence-activation dynamics based on
the features seen in vivo.
Cytometry experiments had, therefore, evidenced that we could not directly
identify the presence of quiescent cells once NSCs have been placed under in vitro
culture conditions. In an attempt to visualize this population, we measured cell size
and mitochondrial activity of NSCs in culture, since we had observed a positive
correlation between these parameters along the quiescent, alert and active states
in vivo. First, we disaggregated neurospheres derived from naïve or saline-injected
mice, labelled them with MitoTracker and analysed them in a flow cytometer to
detect changes in those parameters. We did not find clear differences in the size
distribution between cells from naïve or saline-derived neurospheres (Figure 36a).
However, we could clearly identify a small discrete population of cells displaying
high mitochondrial activity and low cellular complexity in naïve cultures which was
greatly increased in the saline-injected group (Figure 36b).
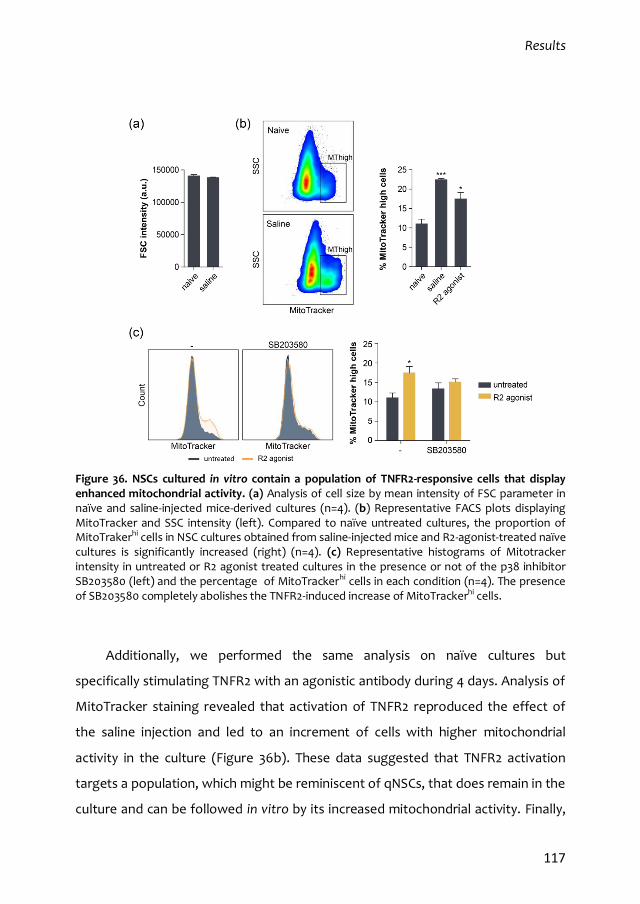
Results
117
Figure 36. NSCs cultured in vitro contain a population of TNFR2-responsive cells that display enhanced mitochondrial activity. (a) Analysis of cell size by mean intensity of FSC parameter in naïve and saline-injected mice-derived cultures (n=4). (b) Representative FACS plots displaying MitoTracker and SSC intensity (left). Compared to naïve untreated cultures, the proportion of MitoTrakerhi cells in NSC cultures obtained from saline-injected mice and R2-agonist-treated naïve cultures is significantly increased (right) (n=4). (c) Representative histograms of Mitotracker intensity in untreated or R2 agonist treated cultures in the presence or not of the p38 inhibitor SB203580 (left) and the percentage of MitoTrackerhi cells in each condition (n=4). The presence of SB203580 completely abolishes the TNFR2-induced increase of MitoTrackerhi cells.
Additionally, we performed the same analysis on naïve cultures but
specifically stimulating TNFR2 with an agonistic antibody during 4 days. Analysis of
MitoTracker staining revealed that activation of TNFR2 reproduced the effect of
the saline injection and led to an increment of cells with higher mitochondrial
activity in the culture (Figure 36b). These data suggested that TNFR2 activation
targets a population, which might be reminiscent of qNSCs, that does remain in the
culture and can be followed in vitro by its increased mitochondrial activity. Finally,

Results
118
we quantified the mitochondrial activity of R2-agonist-treated cells grown in
presence of SB203580. In line with the previous result, we could observe that the
increased number of cells with high mitochondrial activity promoted by the
treatment with the specific R2-agonist completely disappeared when p38 was
pharmacologically inhibited (Figure 36c). Although further characterization will be
needed to clearly identify all the molecular mediators downstream of TNFR2
transduction signal and their role in regulating the quiescence-alert cycle of NSCs,
our results demonstrate that p38 is an essential component of this pathway.
Previous experiments performed in our lab had evidenced that NSC cultures
display proliferative heterogeneity and that a small population of cells that divide
at an evident slower kinetics exists within the neurospheres. Interestingly, this
slow-cycling population seems to be responsible for the long-term expansion and
maintenance of the culture (S.R. Ferrón, unpublished data). Therefore, we decided
to test whether this population might be targeted by TNFR2 stimulation. In order
to track cells with different division kinetics, we used two different fluorescent
probes (Cell Trace Far Red DDAO-SE -DDAO- and Cell Trace Oregon Green 488
Carboxy-DFFDA SE -DFFDA-). These molecules can enter passively through the
plasma membrane of living cells, get retained intracellularly, and are progressively
diluted during the successive rounds of division through their homogeneous
distribution among daughter cells. SEZ dissociates were first loaded with the far
red DDAO cell tracer and plated for primary neurosphere formation. After 10 days
in vitro, the generated primary neurospheres were dissociated to analyse the
intensity of DDAO in each single cell by flow cytometry. Compared to the initial
load, all living cells displayed lower levels of DDAO evidencing that all cells had
divided at least a few times. However, we could observe a wide range of tracer
retention in the culture with cells displaying high levels of DDAO (close to the initial
load level) whereas others showed intermediate intensity or complete dilution of
the probe (Figure 37a). This situation reflected that, under culture conditions, most
Results
119
of the cells go through multiple rounds of cell division while others only cycle a few
times, despite the strong EGF-dependent mitogenic stimulation.
In this context, we decided to evaluate if TNFR2 stimulation targets the slow-
cycling population. Thus, we submitted DDAO primary neurospheres to a second
round of proliferation in the presence or not of TNFR2 agonistic antibody. To be
able to assess cell division during the second round of culture, we labelled cells
derived from DDAO neurospheres with green DFFDA, a second cell tracer
conjugated with a different fluorophore. Then, double labelled cells were cultured
for 3 days to allow dilution of both cell tracers in the presence or not of R2-agonist.
As expected, after 3 days in culture, we could see that all cells had proliferated and
had diluted to some extent the green DFFDA tracer (Figure 37b). Interestingly,
after 2 rounds of culture and 13 days under mitogenic stimulation, we could still
identify cells that retained different levels of the initial DDAO load (DDAO retaining-
cells, DRCs) (Figure 37a) that, according to their slow cycling dynamics, also
retained high levels of green DFFDA (Figure 37b). Of notice, R2-agonist treated
cultures presented a remarkable increase in DRCs (Figure 37c). This might be the
result of the treatment causing a proliferative arrest preventing the dilution of the
probe; however, the TNFR2 increased DRC pool retained lower levels of the second
cell tracer compared to the untreated DRCs (Figure 37d) revealing that TNFR2
activation had actually induced the proliferation of the DRC population, yet
maintaining their slow-cycling kinetics.
These data evidenced that, under in vitro culture conditions, TNFR2 activation
targets a subset of slow-cycling NSCs and promotes their expansion without
changing their cell division kinetics, supporting the idea that TNFR2 promotes a
quiescent state that, in vitro, behaves as a slow-proliferating cell.
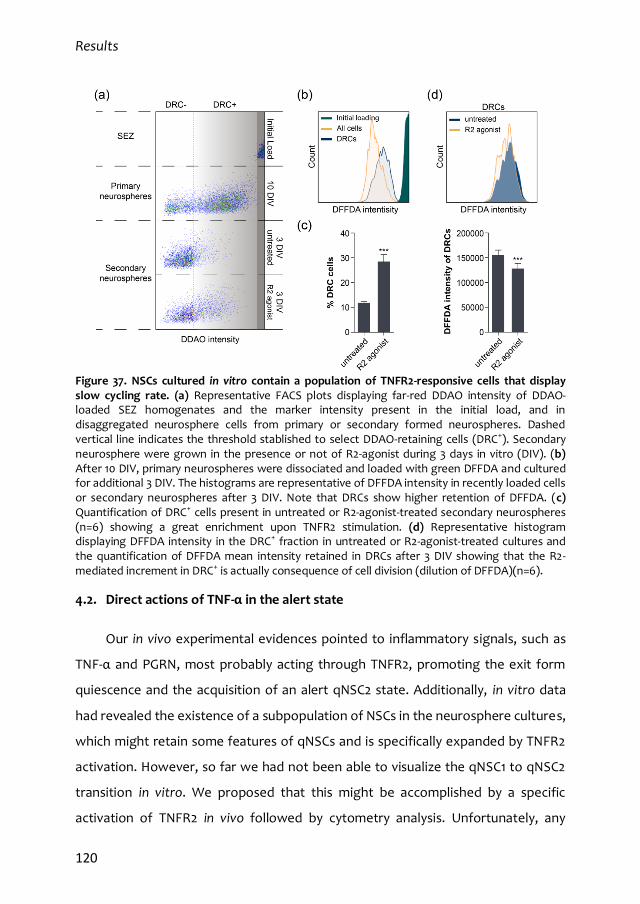
Results
120
Figure 37. NSCs cultured in vitro contain a population of TNFR2-responsive cells that display slow cycling rate. (a) Representative FACS plots displaying far-red DDAO intensity of DDAO-loaded SEZ homogenates and the marker intensity present in the initial load, and in disaggregated neurosphere cells from primary or secondary formed neurospheres. Dashed vertical line indicates the threshold stablished to select DDAO-retaining cells (DRC+). Secondary neurosphere were grown in the presence or not of R2-agonist during 3 days in vitro (DIV). (b) After 10 DIV, primary neurospheres were dissociated and loaded with green DFFDA and cultured for additional 3 DIV. The histograms are representative of DFFDA intensity in recently loaded cells or secondary neurospheres after 3 DIV. Note that DRCs show higher retention of DFFDA. (c) Quantification of DRC+ cells present in untreated or R2-agonist-treated secondary neurospheres (n=6) showing a great enrichment upon TNFR2 stimulation. (d) Representative histogram displaying DFFDA intensity in the DRC+ fraction in untreated or R2-agonist-treated cultures and the quantification of DFFDA mean intensity retained in DRCs after 3 DIV showing that the R2-mediated increment in DRC+ is actually consequence of cell division (dilution of DFFDA)(n=6).
4.2. Direct actions of TNF-α in the alert state
Our in vivo experimental evidences pointed to inflammatory signals, such as
TNF-α and PGRN, most probably acting through TNFR2, promoting the exit form
quiescence and the acquisition of an alert qNSC2 state. Additionally, in vitro data
had revealed the existence of a subpopulation of NSCs in the neurosphere cultures,
which might retain some features of qNSCs and is specifically expanded by TNFR2
activation. However, so far we had not been able to visualize the qNSC1 to qNSC2
transition in vitro. We proposed that this might be accomplished by a specific
activation of TNFR2 in vivo followed by cytometry analysis. Unfortunately, any
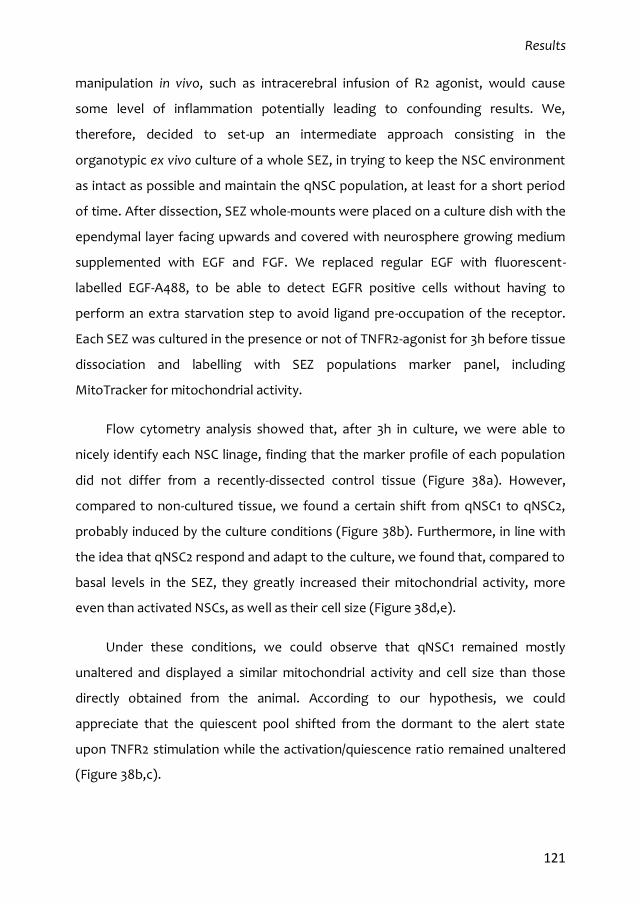
Results
121
manipulation in vivo, such as intracerebral infusion of R2 agonist, would cause
some level of inflammation potentially leading to confounding results. We,
therefore, decided to set-up an intermediate approach consisting in the
organotypic ex vivo culture of a whole SEZ, in trying to keep the NSC environment
as intact as possible and maintain the qNSC population, at least for a short period
of time. After dissection, SEZ whole-mounts were placed on a culture dish with the
ependymal layer facing upwards and covered with neurosphere growing medium
supplemented with EGF and FGF. We replaced regular EGF with fluorescent-
labelled EGF-A488, to be able to detect EGFR positive cells without having to
perform an extra starvation step to avoid ligand pre-occupation of the receptor.
Each SEZ was cultured in the presence or not of TNFR2-agonist for 3h before tissue
dissociation and labelling with SEZ populations marker panel, including
MitoTracker for mitochondrial activity.
Flow cytometry analysis showed that, after 3h in culture, we were able to
nicely identify each NSC linage, finding that the marker profile of each population
did not differ from a recently-dissected control tissue (Figure 38a). However,
compared to non-cultured tissue, we found a certain shift from qNSC1 to qNSC2,
probably induced by the culture conditions (Figure 38b). Furthermore, in line with
the idea that qNSC2 respond and adapt to the culture, we found that, compared to
basal levels in the SEZ, they greatly increased their mitochondrial activity, more
even than activated NSCs, as well as their cell size (Figure 38d,e).
Under these conditions, we could observe that qNSC1 remained mostly
unaltered and displayed a similar mitochondrial activity and cell size than those
directly obtained from the animal. According to our hypothesis, we could
appreciate that the quiescent pool shifted from the dormant to the alert state
upon TNFR2 stimulation while the activation/quiescence ratio remained unaltered
(Figure 38b,c).
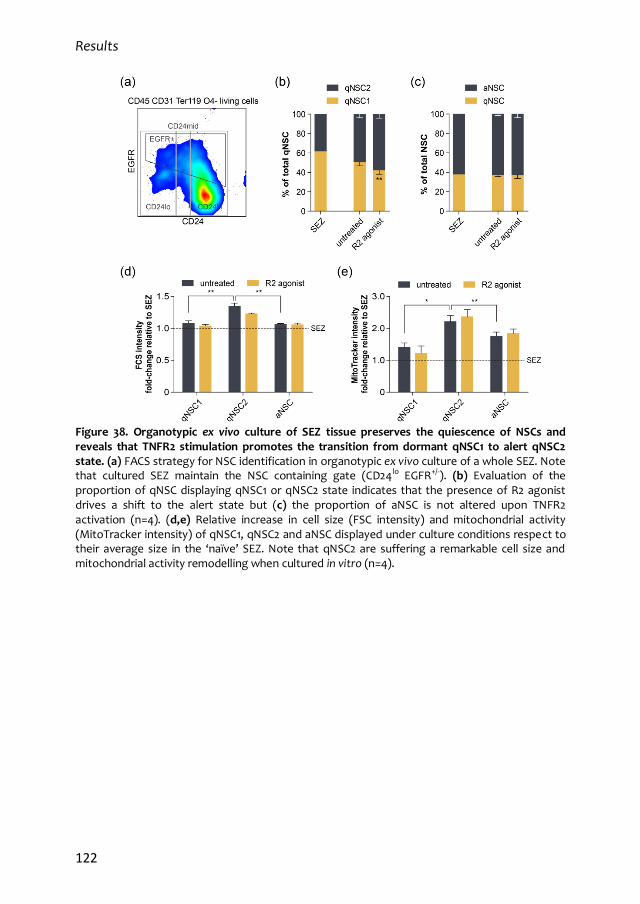
Results
122
Figure 38. Organotypic ex vivo culture of SEZ tissue preserves the quiescence of NSCs and reveals that TNFR2 stimulation promotes the transition from dormant qNSC1 to alert qNSC2 state. (a) FACS strategy for NSC identification in organotypic ex vivo culture of a whole SEZ. Note that cultured SEZ maintain the NSC containing gate (CD24lo EGFR+/-). (b) Evaluation of the proportion of qNSC displaying qNSC1 or qNSC2 state indicates that the presence of R2 agonist drives a shift to the alert state but (c) the proportion of aNSC is not altered upon TNFR2 activation (n=4). (d,e) Relative increase in cell size (FSC intensity) and mitochondrial activity (MitoTracker intensity) of qNSC1, qNSC2 and aNSC displayed under culture conditions respect to their average size in the ‘naïve’ SEZ. Note that qNSC2 are suffering a remarkable cell size and mitochondrial activity remodelling when cultured in vitro (n=4).

Discussion

Discussion
125
The two major findings of the present thesis are (1) that adult NSCs in the SEZ
niche can sense and respond to remote peripheral mild lesions and that (2) TNFR2
signalling is involved in this process and mediates positive effects of inflammation
on NSC behaviour. The first finding is in line with recent data indicating that adult
SCs of different systems can react to distant injuries, suggesting a homeostatic
control of their activity at the organismal level. The second one increases our
understanding of the role of inflammation in the neurogenic process. Although the
most accepted view is that acute or chronic inflammation plays a negative role in
neurogenesis, our data uncover concomitant beneficial effects of inflammatory
cytokines in at least a fraction of NSCs.
Additionally, we have found that responding to either peripheral signals or
acute inflammation, entails the transition of quiescent NSCs from a dormant to a
primed pre-activation state. This alert qNSC2 state had remained undetected within
the quiescent pool of NSCs until a couple of years ago, and very little is known
about its behaviour and regulation. Here we provide new data uncovering the
implication of TNFR2 signalling, most probably transduced intracellularly through
p38, in the regulation of these qNSC2 cells, their behaviour in vitro and their role
during regeneration and in response to injury. These previously undescribed effects
add another piece of knowledge to the incipient research of regulation of
quiescence/activation in NSCs.
The quest to find specific cell markers to unravel the unforeseen heterogeneity of
adult NSCs.
In the absence of unique distinctive markers, the heterogeneity of adult SCs
can only be revealed by the prospective isolation of the different proliferative
states and subpopulations with combinations of labels. Understanding the
heterogeneity of SCs has become in the last few years an obligated step in the
journey to unravel the behaviour and regulation of these cellular entities. This
heterogeneity comprises different levels of the SC biology, and has revealed that
Discussion
126
we must undertake their study without disregarding that, instead of a specific cell
type with singular characteristics, they behave as a dynamic network of
interchangeable states showing distinctive regional identity, lineage commitment,
self-renewal potential, gene expression programs and cell cycle dynamics (Biteau
et al., 2011; Chaker et al., 2016; Dykstra et al., 2007; Li and Clevers, 2010; Ousset et
al., 2012; Stange et al., 2013; Van Keymeulen et al., 2011). Therefore, the
development of lineage-tracing and molecular strategies that allow the
identification and isolation of all this variety of states and subpopulations is
essential for the proper advance of our knowledge about SCs.
As the leading field in SCs, the HSC lineage is probably the best characterized
SC system where several HSC types and intermediate states have been identified
(Goodell et al., 2015; Tian and Zhang, 2016). This success has heavily relied in the
availability of multiple surface markers that, in combination with FACS-based
technologies, has allowed the isolation of discrete populations with common
molecular features for their subsequent functional characterization (Tian and
Zhang, 2016). The NSC field, however, has been limited for many years by the
sparse availability of markers, especially cell surface proteins that would have
enabled their isolation and further characterization. NSCs were initially defined and
functionally characterized using in vitro criteria (Reynolds and Weiss, 1992) and
later by ultrastructural, morphological and functional in vivo features (Doetsch et
al., 1999a; Doetsch et al., 1997, 1999b). Since then, their identification has mainly
relied upon the expression of cytoskeletal proteins such as the glial marker GFAP or
Nestin, in combination with transcription factors such as Sox2 or proliferation
markers such as ki67 and/or retention of nucleoside analogues. Of notice, none of
these markers is compatible with the FACs separation of living cells, due to their
intracellular localization, which has imposed the search for alternative strategies to
circumvent this limitation.
Discussion
127
The use of reporter transgenic mice such as GFAP::GFP provided the first
reliable approach for FACS isolation of NSCs but, their glial nature required the
combination with other markers in order to discriminate neurogenic from non-
neurogenic astrocytes (Pastrana et al., 2009). It has not been until recently that a
few laboratories have successfully isolated SEZ cells that display SC features using
different combinations of both reporter expression mouse strains and/or surface
markers. Moreover, the application of either bulk or single cell global
transcriptomic assays to these isolated populations has led to the identification of
different quiescent and proliferative states among NSCs, broadening our vision of
their biology (Codega et al., 2014; Daynac et al., 2013; Giachino et al., 2014; Khatri et
al., 2014; Llorens-Bobadilla et al., 2015; Mich et al., 2014).
In this thesis, we have developed a new strategy, based exclusively on the
detection of surface markers, to allow the identification of SEZ NSCs at different
quiescent and proliferative states, along with their more committed progeny until
their transformation into OB neuroblasts. Analogously to the LSK-based strategy
for HSC identification, which is based on the exclusion of eight differentiation
markers (Lin+ cells) and the subsequent selection of c-Kit and Sca-1 positive HSC
(Tian and Zhang, 2016), we first excluded non-neurogenic lineages using CD45,
CD31, Ter119 and O4 to later perform a positive selection of CD9+ neurogenic,
GLAST+ astrocytes. Although GFAP has been for years the gold standard for the
identification of astroglial cells, the localization of GLAST in their membrane has
overcome the need for reporter mouse strains, allowing the identification of living
astrocytes in mice of any genetic background (Jungblut et al., 2012). However, both
GFAP and GLAST are also expressed by non-neurogenic astrocytes, so inclusion of
additional markers that distinguish NSCs from parenquimal astrocytes is
compulsory. Prominin (CD133) has been found in primary cilium of NSCs (Cesetti et
al., 2011; Pinto et al., 2008) and has been used in combination with GFAP to identify
this population (Beckervordersandforth et al., 2010; Mirzadeh et al., 2008).
Nonetheless, despite being quite specific, it appears to label only a subset of NSCs
Discussion
128
(Codega et al., 2014). Hence, taking advantage of the single-cell RNA-Seq
performed by Llorens-Bobadilla et al., we decided to include CD9, in combination
with GLAST, to identify neurogenic astrocytes (Llorens-Bobadilla et al., 2015). It is
worth noting that, despite the fact that its broad expression among different cell
types might make it unsuitable as specific marker, we could observe that SEZ NSCs
expressed much higher levels of this protein compared to non-neurogenic
astrocytes from other areas such as the cortex or the striatum.
Despite being initially alleged as a progenitor marker, EGFR is now widely
accepted as a marker of active NSCs (Codega et al., 2014; Daynac et al., 2013;
Giachino et al., 2014; Khatri et al., 2014; Llorens-Bobadilla et al., 2015; Mich et al.,
2014) that are consequently eliminated by anti-mitotic drugs. However, we found
slight discrepancies with previous reports that associated CD24 mainly with
neuroblasts, defining NSCs as a CD24 negative population (Codega et al., 2014;
Daynac et al., 2013; Llorens-Bobadilla et al., 2015; Mich et al., 2014). Our data
suggest instead that this marker starts being expressed in aNSCs and increases
with the progression through the neurogenic lineage becoming the highest in PSA-
NCAM+ neuroblasts. Of notice, single-cell RNA-seq analysis also supports this idea
and, similarly to Ascl1 expression that is already present in activated aNSCs,
presence of Cd24a mRNA is detected increasingly in aNSCs, TAPs and neuroblasts
(Llorens-Bobadilla et al., 2015). Similarly, the expression of GLAST in TAPs is also
under debate. While others define TAPs as GLAST+/EGFR+ cells (Llorens-Bobadilla et
al., 2015), we believe that CD24mid/EGFR+ TAPs are in the process of silencing
astroglial features and can still show residual levels of GLAST. It is worth noting
that the detection of surface markers is highly dependent on the chosen protocol
for the enzymatic dissociation of the SEZ tissue. Most of the strategies for the
disaggregation of neural tissue rely on a combination of mechanical dissociation
along with an enzymatic digestion with papain or trypsin. During the development
of our protocol, we could observe that GLAST and CD24 were highly sensitive to
papain. Similarly, although trypsin is clearly gentler with both markers, the amount
Discussion
129
of enzyme and the incubation time have a deep impact in the preservation of these
antigens in the cell membrane. Therefore, protocols slightly more aggressive with
these two markers might have led to the classification of low-expressing cells as
negative.
We are aware that the ultimate validation of our marker panel and gating
strategy will only be achieved by the molecular and cellular analysis of each FACS-
separated population. However, we strongly believe that we provide enough
evidences of its accuracy with the regeneration experiments, neurosphere
formation assays, and analysis of the expected morphological and metabolic
changes we performed over the course of this thesis.
The dilemma of being a quiescent cell in vitro
As previously mentioned, neurosphere cultures contain a heterogeneous
population of cells as NSCs coexist with their progeny (different types of more
committed progenitors and even differentiated cells). Moreover, NSCs unavoidably
produce cell progeny in vitro and some of the highly proliferative committed
progenitors or TAP cells appear also capable of forming neurospheres, albeit only
for a few passages (Doetsch et al., 2002a; Reynolds and Rietze, 2005) Nonetheless,
since neurospheres reproduce the defining characteristics of SC such as self-
renewal, clonal long-term expansion and multipotency, their cell division in the
culture must be self-maintaining and at least a small percentage of them should
remain somehow equivalent to the NSCs found in the niche in vivo.
General protocols for the in vitro culture of mammalian cells rely on the
presence in the culture medium of proliferative signals either in the form of
different kinds of serum or by defined growth factors that act as mitogens. This
fact imposes a strong pressure over the culture, selecting the most proliferative
cells as the culture is successively passaged. Therefore, any kind of non-
Discussion
130
proliferative cell will necessarily be negatively selected and under-represented or
removed from the culture.
NSCs are no exception to this rule, and commonly used protocols include
strong mitogenic stimulation with a combination of EFG and FGF2 (Belenguer et al.,
2016). Consequently, it is conceivable that the quiescent population that would be
initially present in the SEZ tissue homogenate might either be forced to activate
and adapt to the culture conditions, or, conversely, remain quiescent and be
progressively eliminated. As a matter of fact, it has been reported that isolated
qNSC rarely form neurospheres in vitro (Codega et al., 2014; Mich et al., 2014) but
that they can get activated contributing to the neurosphere forming pool of the
culture (Codega et al., 2014). On the other hand, a different scenario where NSCs
alternate between quiescent and active states during their time in vitro has also
been proposed (Codega et al., 2014) and would justify the presence of qNSCs in the
culture, even after several passages under strong mitogenic stimulation. This
phenomenon, though, remains controversial and the characterization of the
quiescent cells in the culture, if present, has not been done. Additionally, due to
their recent discovery, few data are available about the specific behaviour of
qNSC2 in vitro.
Most of the results we have obtained during this thesis can only be explained
by in vitro culture conditions driving NSCs, at least qNSC2, to exit quiescence, start
expressing EGFR and proliferate. This raises the question of whether these in vitro
activated qNSC2 are functionally different form the aNSCs already present in the
culture and if any of them retain the capacity of returning to quiescence. Be as it
may, we have found that in vitro culture conditions have a profound impact on the
expression of surface markers, specially GLAST, CD24 and EGFR, preventing us
from unequivocally identify quiescent cells in the culture, at least by our cytometry-
based assay. However, we could find evidences of heterogeneity among the NSC
population in vitro that might reflect the presence of an adapted form of quiescent
Discussion
131
NSC to the culture conditions or, alternatively, be the consequence of the returning
of aNSCs to a more quiescent state after a few rounds of cell division in each
passage. This is supported by the observation of a subset of cells displaying
differential mitochondrial activity and the fact that cells with considerably slower
cell cycle kinetics coexist in the culture among highly proliferative ones.
Additionally, these populations seem to be targeted by TNFR2 stimulation leading
to their expansion in the culture but without losing their particular characteristics.
Together these evidences have prompted us to hypothesise that the expansion of
the neurosphere forming cells that we observe after TNFR2 stimulation in vitro, is
actually a consequence of TNFR2 targeting a subpopulation of quiescent cells that
are adapted to the in vitro conditions and, hence, cannot behave as fully quiescent
cells. This hypothesis would conciliate our in vitro and in vivo observations because
TNFR2 seems to be promoting changes among the quiescent populations of NSCs
in vivo, without necessarily leading to their activation, whereas, in vitro,
incremented EGFR+ symmetrical divisions and enhanced neurosphere formation
rather suggest an activation signal.
The SEZ niche constitutes a complex environment where a great plethora of
signals that actively regulate NSC stemness, quiescence and activation (Porlan et
al., 2013b). Consequently, withdrawing them from their natural habitat and placing
them in vitro, no matter how optimised the culture medium might be, will
unquestionably affect their biology and behaviour. In line with this, the only
method that we found to maintain quiescent cells in vitro, at least for a short
period of time, was the organotypic ex vivo culture of the whole SEZ, and even so,
we could appreciate slight sings of emerging activation in the control explants. This
result evidences that key niche factors such as cell adhesion to components of the
niche (Porlan et al., 2014) and especially hypoxic environment (Mohyeldin et al.,
2010), among others, being absent from the culture conditions, might be necessary
for the full expression of quiescence in vitro.
Discussion
132
It is all about that alert quiescent state
Adult stem cells, regardless of their tissue localization, are known to alternate
between a quiescent non proliferative state and an active, progeny-producing one.
However, it has recently been reported that some adult quiescent SCs, such as
HSCs or MuSCs, are found in a primed or alert state, non-cycling but prone to
activation and that the probability of this state increases with mild and/or remote
insults (Rodgers et al., 2014; Rodgers et al., 2017). As mentioned before, the
potential existence of this intermediate state between quiescence and activation in
the SEZ niche remained undetected until a couple of years ago when single-cell
transcriptome analysis of isolated NSCs revealed their presence (Llorens-Bobadilla
et al., 2015).
Analogously to other SC systems, the alert state of NSCs was initially defined
molecularly as an intermediate state between dormancy and activation, suggesting
a prone-to-activation state. However, aside from their molecular identity, very little
is known about this pool of NSCs. For instance, although bioinformatics analysis
suggests a linear qNSC1-qNSC2-aNSC progression during the NSC activation
process, this has not been functionally tested and an alternative scenario where
qNSC2 correspond to an accessory population that is only recruited and activated
in the presence of specific signals, might also be plausible. Nevertheless, our data
indicate that dormant qNSCs, at least in the functional scenarios we have analysed,
acquire an intermediate alert qNSC2 phenotype before reaching full activation.
Additionally, we could see that the transition to an alert state under mild non-
pathological stimulation is a reversible process and primed qNSC2 can
progressively return to dormancy without reaching activation. We have not
explored all the variety of signals that might lead to NSC activation, but it would be
interesting to analyse whether perturbations distinct in nature, intensity and/or
duration might regulate differently the response of qNSCs. Additionally, it is not
known whether different types of injury would trigger specific signalling pathways
Discussion
133
and recruit specific subpopulations of qNSCs and if this will be reflected in the
generation of functionally different cohorts of qNSC2. Curiously, in a zebrafish
model, it has been observed that quiescent radial glia cells, equivalent to murine
SEZ qNSCs, get activated upon injury, but that different types of stimuli target
discrete subgroups of these cells (Than-Trong and Bally-Cuif, 2015). Similarly, the
existence of stimulus-specific subpopulations of qNSCs in the murine hippocampus
has also been described (Jhaveri et al., 2015). In the adult murine SEZ, NSCs display
regional heterogeneity and it has been demonstrated that specific subtypes of OB
neurons arise from definite subpopulations of NSCs with distinctive localization
along the lateral ventricle wall (Kelsch et al., 2007; Lopez-Juarez et al., 2013; Merkle
et al., 2014; Young et al., 2007). Although it has not been explored, it might be
possible that stimulus-specificity and regional heterogeneity be intrinsic
characteristics of dormant qNSC1 and that, once targeted for activation, transition
through an alert qNSC2 state might be a common cellular mechanism. We have
found that qNSC1 respond to inflammatory signals such as TNF-α and progranulin
through TNFR2, but it would be interesting to know if what we observed is a
general mechanism or if we just targeted a specific TNFR2 responsive
subpopulation of quiescent NSCs. Further work will be required to address all these
questions but the fact that MuSCs, HSCs, among other types of SCs, undergo a
transition from G0 to Galert state in response to multiple types of distant injuries
(Rodgers et al., 2014; Rodgers et al., 2017) suggests that this primed state might be
a general mediator in the response to any kind of injury.
On the other hand, we consistently found that around one third of the
quiescent NSCs in wild-type control SEZ tissue, were qNSC2. This might be the
consequence of multiple local and/or systemic potentially damaging signals being
constantly surveyed by qNSCs and/or other niche components such as microglia
and endothelial cells, anticipating the need of an eventual rapid response by
maintaining a pool of alert qNSC2. If that were the case, this would mean that the
qNSC2 population could be a reflection of the general systemic health of an
Discussion
134
individual at a specific moment. Conversely, the existence of a basal population of
qNSC2 might reflect that there is a homeostatic equilibrium between dormant and
active NSCs that entails the presence of a transitional pool of qNSC2. However, in
vivo tracing experiments suggested that active NSCs are short-lived and actively
divide generating multiple waves of progenitors before becoming exhausted
(Calzolari et al., 2015), what would explain the decline in neurogenesis that is
observed with aging (Shook et al., 2012). Although this work challenged the idea of
active NSCs returning to quiescence in vivo after a period of proliferation, their data
could not conclusively exclude the possible existence of a few GFAP+ neurogenic
cells that could do so. Moreover, they did not explore the possible role of qNSC2 in
this process. We speculate that, after reaching activation, NSCs might divide giving
rise to another active, proliferating aNSC and a daughter cell that might return to
dormancy through an intermediate qNSC2 state. Interestingly, it has been reported
that, although neurogenesis to the OB declines with age, and total number of
NSCs, pinwheel units and NSCs per pinwheel is reduced, the percentage of actively
mitotic NSCs increases (Shook et al., 2012). Therefore, it is tempting to hypothesise
that aging involves the impairment of the reversible quiescence/activation cycle
leading to the exhaustion of the quiescent NSC pool rather than the active one.
Although we did not explore the behaviour of qNSC2 in aged animals, it would be
really interesting to assess the role of these cells during aged-related neurogenesis
decline.
Remote insults: no matter how far, NSCs know what is going on
Tissue specific SC harbour the ability to sense and respond to pathological
situations, such as traumatic injury or ischemia, activating the production of
committed progenitors that migrate to the damaged area and contribute to the
reparation and return to homeostasis of the tissue (Kokaia and Lindvall, 2003,
2012). In the CNS, although regeneration is actively impaired by the formation of a
reactive glial scar (Ohtake and Li, 2015) and the inhibiting properties of central
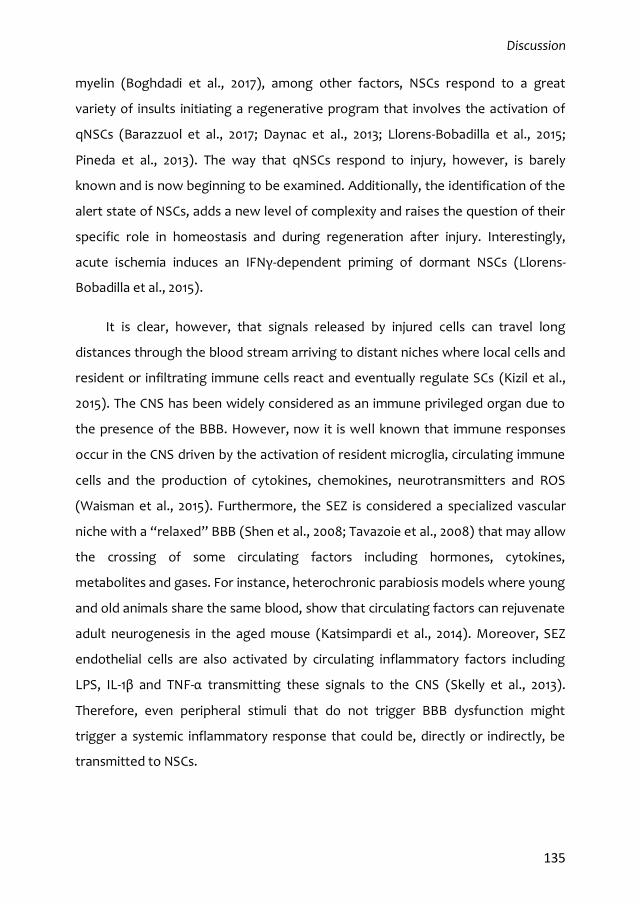
Discussion
135
myelin (Boghdadi et al., 2017), among other factors, NSCs respond to a great
variety of insults initiating a regenerative program that involves the activation of
qNSCs (Barazzuol et al., 2017; Daynac et al., 2013; Llorens-Bobadilla et al., 2015;
Pineda et al., 2013). The way that qNSCs respond to injury, however, is barely
known and is now beginning to be examined. Additionally, the identification of the
alert state of NSCs, adds a new level of complexity and raises the question of their
specific role in homeostasis and during regeneration after injury. Interestingly,
acute ischemia induces an IFNγ-dependent priming of dormant NSCs (Llorens-
Bobadilla et al., 2015).
It is clear, however, that signals released by injured cells can travel long
distances through the blood stream arriving to distant niches where local cells and
resident or infiltrating immune cells react and eventually regulate SCs (Kizil et al.,
2015). The CNS has been widely considered as an immune privileged organ due to
the presence of the BBB. However, now it is well known that immune responses
occur in the CNS driven by the activation of resident microglia, circulating immune
cells and the production of cytokines, chemokines, neurotransmitters and ROS
(Waisman et al., 2015). Furthermore, the SEZ is considered a specialized vascular
niche with a “relaxed” BBB (Shen et al., 2008; Tavazoie et al., 2008) that may allow
the crossing of some circulating factors including hormones, cytokines,
metabolites and gases. For instance, heterochronic parabiosis models where young
and old animals share the same blood, show that circulating factors can rejuvenate
adult neurogenesis in the aged mouse (Katsimpardi et al., 2014). Moreover, SEZ
endothelial cells are also activated by circulating inflammatory factors including
LPS, IL-1β and TNF-α transmitting these signals to the CNS (Skelly et al., 2013).
Therefore, even peripheral stimuli that do not trigger BBB dysfunction might
trigger a systemic inflammatory response that could be, directly or indirectly, be
transmitted to NSCs.
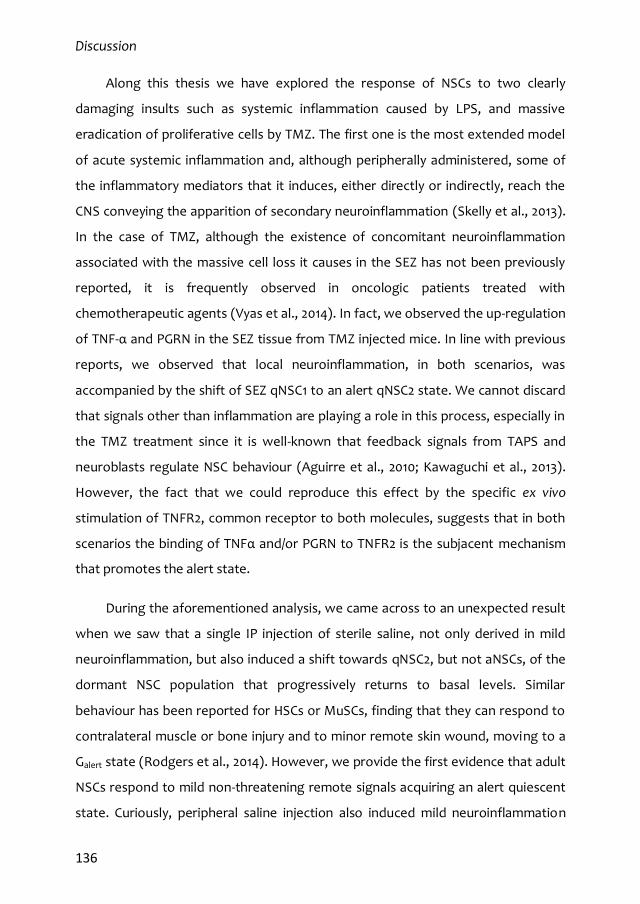
Discussion
136
Along this thesis we have explored the response of NSCs to two clearly
damaging insults such as systemic inflammation caused by LPS, and massive
eradication of proliferative cells by TMZ. The first one is the most extended model
of acute systemic inflammation and, although peripherally administered, some of
the inflammatory mediators that it induces, either directly or indirectly, reach the
CNS conveying the apparition of secondary neuroinflammation (Skelly et al., 2013).
In the case of TMZ, although the existence of concomitant neuroinflammation
associated with the massive cell loss it causes in the SEZ has not been previously
reported, it is frequently observed in oncologic patients treated with
chemotherapeutic agents (Vyas et al., 2014). In fact, we observed the up-regulation
of TNF-α and PGRN in the SEZ tissue from TMZ injected mice. In line with previous
reports, we observed that local neuroinflammation, in both scenarios, was
accompanied by the shift of SEZ qNSC1 to an alert qNSC2 state. We cannot discard
that signals other than inflammation are playing a role in this process, especially in
the TMZ treatment since it is well-known that feedback signals from TAPS and
neuroblasts regulate NSC behaviour (Aguirre et al., 2010; Kawaguchi et al., 2013).
However, the fact that we could reproduce this effect by the specific ex vivo
stimulation of TNFR2, common receptor to both molecules, suggests that in both
scenarios the binding of TNFα and/or PGRN to TNFR2 is the subjacent mechanism
that promotes the alert state.
During the aforementioned analysis, we came across to an unexpected result
when we saw that a single IP injection of sterile saline, not only derived in mild
neuroinflammation, but also induced a shift towards qNSC2, but not aNSCs, of the
dormant NSC population that progressively returns to basal levels. Similar
behaviour has been reported for HSCs or MuSCs, finding that they can respond to
contralateral muscle or bone injury and to minor remote skin wound, moving to a
Galert state (Rodgers et al., 2014). However, we provide the first evidence that adult
NSCs respond to mild non-threatening remote signals acquiring an alert quiescent
state. Curiously, peripheral saline injection also induced mild neuroinflammation
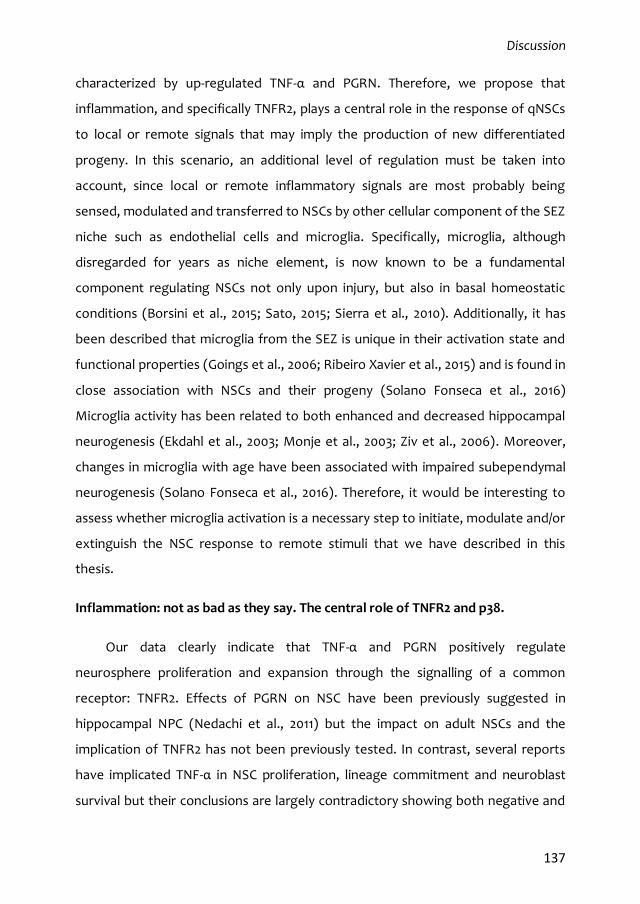
Discussion
137
characterized by up-regulated TNF-α and PGRN. Therefore, we propose that
inflammation, and specifically TNFR2, plays a central role in the response of qNSCs
to local or remote signals that may imply the production of new differentiated
progeny. In this scenario, an additional level of regulation must be taken into
account, since local or remote inflammatory signals are most probably being
sensed, modulated and transferred to NSCs by other cellular component of the SEZ
niche such as endothelial cells and microglia. Specifically, microglia, although
disregarded for years as niche element, is now known to be a fundamental
component regulating NSCs not only upon injury, but also in basal homeostatic
conditions (Borsini et al., 2015; Sato, 2015; Sierra et al., 2010). Additionally, it has
been described that microglia from the SEZ is unique in their activation state and
functional properties (Goings et al., 2006; Ribeiro Xavier et al., 2015) and is found in
close association with NSCs and their progeny (Solano Fonseca et al., 2016)
Microglia activity has been related to both enhanced and decreased hippocampal
neurogenesis (Ekdahl et al., 2003; Monje et al., 2003; Ziv et al., 2006). Moreover,
changes in microglia with age have been associated with impaired subependymal
neurogenesis (Solano Fonseca et al., 2016). Therefore, it would be interesting to
assess whether microglia activation is a necessary step to initiate, modulate and/or
extinguish the NSC response to remote stimuli that we have described in this
thesis.
Inflammation: not as bad as they say. The central role of TNFR2 and p38.
Our data clearly indicate that TNF-α and PGRN positively regulate
neurosphere proliferation and expansion through the signalling of a common
receptor: TNFR2. Effects of PGRN on NSC have been previously suggested in
hippocampal NPC (Nedachi et al., 2011) but the impact on adult NSCs and the
implication of TNFR2 has not been previously tested. In contrast, several reports
have implicated TNF-α in NSC proliferation, lineage commitment and neuroblast
survival but their conclusions are largely contradictory showing both negative and
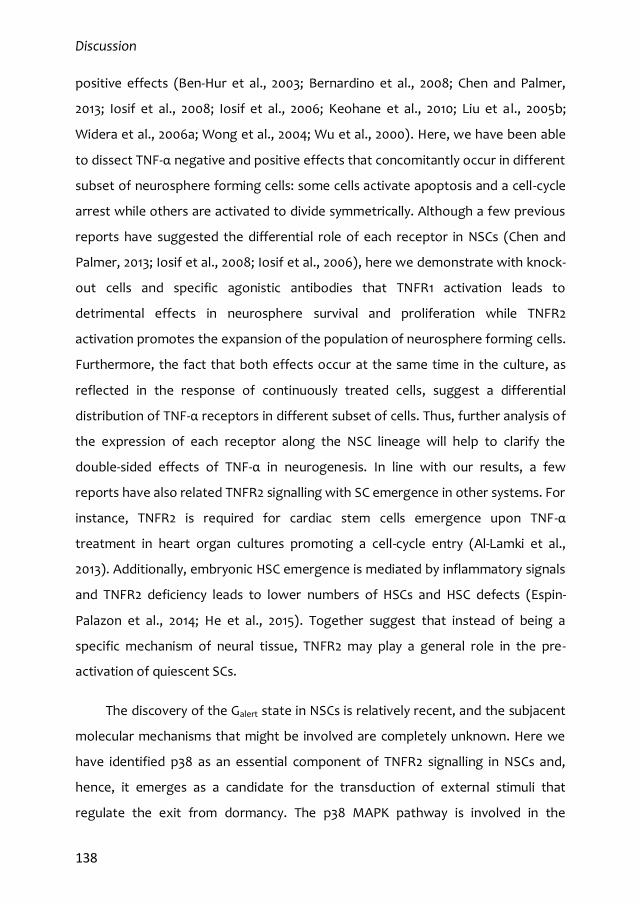
Discussion
138
positive effects (Ben-Hur et al., 2003; Bernardino et al., 2008; Chen and Palmer,
2013; Iosif et al., 2008; Iosif et al., 2006; Keohane et al., 2010; Liu et al., 2005b;
Widera et al., 2006a; Wong et al., 2004; Wu et al., 2000). Here, we have been able
to dissect TNF-α negative and positive effects that concomitantly occur in different
subset of neurosphere forming cells: some cells activate apoptosis and a cell-cycle
arrest while others are activated to divide symmetrically. Although a few previous
reports have suggested the differential role of each receptor in NSCs (Chen and
Palmer, 2013; Iosif et al., 2008; Iosif et al., 2006), here we demonstrate with knock-
out cells and specific agonistic antibodies that TNFR1 activation leads to
detrimental effects in neurosphere survival and proliferation while TNFR2
activation promotes the expansion of the population of neurosphere forming cells.
Furthermore, the fact that both effects occur at the same time in the culture, as
reflected in the response of continuously treated cells, suggest a differential
distribution of TNF-α receptors in different subset of cells. Thus, further analysis of
the expression of each receptor along the NSC lineage will help to clarify the
double-sided effects of TNF-α in neurogenesis. In line with our results, a few
reports have also related TNFR2 signalling with SC emergence in other systems. For
instance, TNFR2 is required for cardiac stem cells emergence upon TNF-α
treatment in heart organ cultures promoting a cell-cycle entry (Al-Lamki et al.,
2013). Additionally, embryonic HSC emergence is mediated by inflammatory signals
and TNFR2 deficiency leads to lower numbers of HSCs and HSC defects (Espin-
Palazon et al., 2014; He et al., 2015). Together suggest that instead of being a
specific mechanism of neural tissue, TNFR2 may play a general role in the pre-
activation of quiescent SCs.
The discovery of the Galert state in NSCs is relatively recent, and the subjacent
molecular mechanisms that might be involved are completely unknown. Here we
have identified p38 as an essential component of TNFR2 signalling in NSCs and,
hence, it emerges as a candidate for the transduction of external stimuli that
regulate the exit from dormancy. The p38 MAPK pathway is involved in the
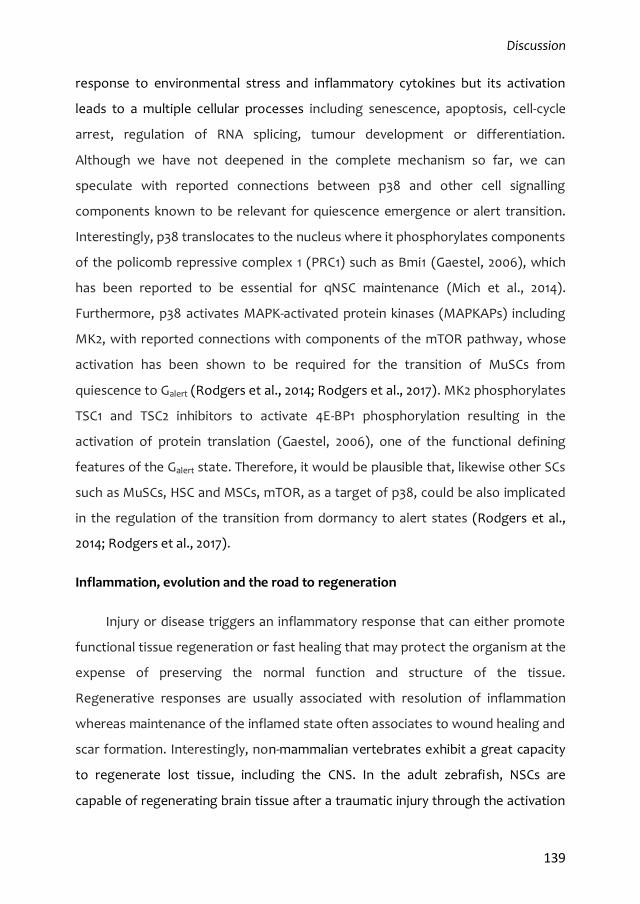
Discussion
139
response to environmental stress and inflammatory cytokines but its activation
leads to a multiple cellular processes including senescence, apoptosis, cell-cycle
arrest, regulation of RNA splicing, tumour development or differentiation.
Although we have not deepened in the complete mechanism so far, we can
speculate with reported connections between p38 and other cell signalling
components known to be relevant for quiescence emergence or alert transition.
Interestingly, p38 translocates to the nucleus where it phosphorylates components
of the policomb repressive complex 1 (PRC1) such as Bmi1 (Gaestel, 2006), which
has been reported to be essential for qNSC maintenance (Mich et al., 2014).
Furthermore, p38 activates MAPK-activated protein kinases (MAPKAPs) including
MK2, with reported connections with components of the mTOR pathway, whose
activation has been shown to be required for the transition of MuSCs from
quiescence to Galert (Rodgers et al., 2014; Rodgers et al., 2017). MK2 phosphorylates
TSC1 and TSC2 inhibitors to activate 4E-BP1 phosphorylation resulting in the
activation of protein translation (Gaestel, 2006), one of the functional defining
features of the Galert state. Therefore, it would be plausible that, likewise other SCs
such as MuSCs, HSC and MSCs, mTOR, as a target of p38, could be also implicated
in the regulation of the transition from dormancy to alert states (Rodgers et al.,
2014; Rodgers et al., 2017).
Inflammation, evolution and the road to regeneration
Injury or disease triggers an inflammatory response that can either promote
functional tissue regeneration or fast healing that may protect the organism at the
expense of preserving the normal function and structure of the tissue.
Regenerative responses are usually associated with resolution of inflammation
whereas maintenance of the inflamed state often associates to wound healing and
scar formation. Interestingly, non-mammalian vertebrates exhibit a great capacity
to regenerate lost tissue, including the CNS. In the adult zebrafish, NSCs are
capable of regenerating brain tissue after a traumatic injury through the activation
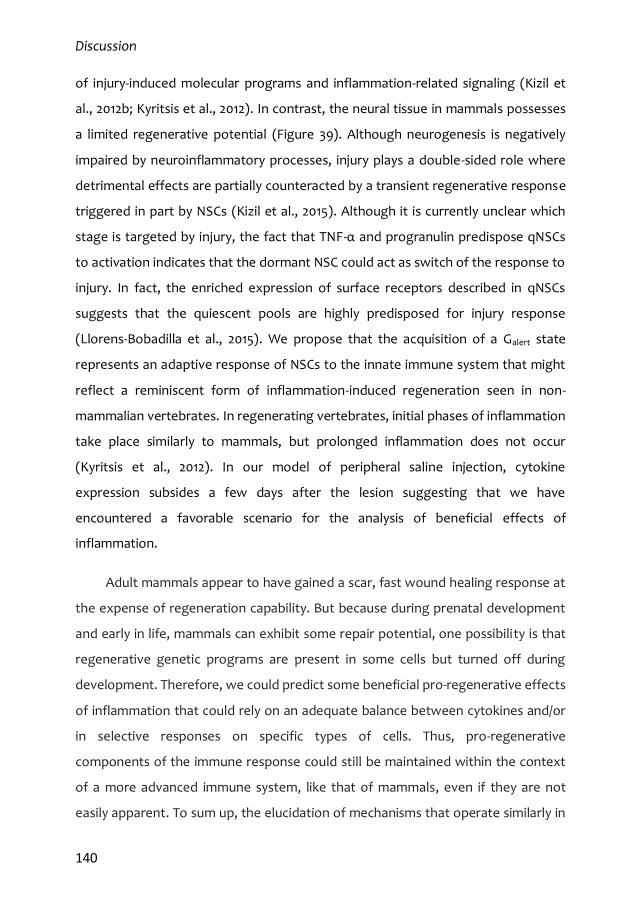
Discussion
140
of injury-induced molecular programs and inflammation-related signaling (Kizil et
al., 2012b; Kyritsis et al., 2012). In contrast, the neural tissue in mammals possesses
a limited regenerative potential (Figure 39). Although neurogenesis is negatively
impaired by neuroinflammatory processes, injury plays a double-sided role where
detrimental effects are partially counteracted by a transient regenerative response
triggered in part by NSCs (Kizil et al., 2015). Although it is currently unclear which
stage is targeted by injury, the fact that TNF-α and progranulin predispose qNSCs
to activation indicates that the dormant NSC could act as switch of the response to
injury. In fact, the enriched expression of surface receptors described in qNSCs
suggests that the quiescent pools are highly predisposed for injury response
(Llorens-Bobadilla et al., 2015). We propose that the acquisition of a Galert state
represents an adaptive response of NSCs to the innate immune system that might
reflect a reminiscent form of inflammation-induced regeneration seen in non-
mammalian vertebrates. In regenerating vertebrates, initial phases of inflammation
take place similarly to mammals, but prolonged inflammation does not occur
(Kyritsis et al., 2012). In our model of peripheral saline injection, cytokine
expression subsides a few days after the lesion suggesting that we have
encountered a favorable scenario for the analysis of beneficial effects of
inflammation.
Adult mammals appear to have gained a scar, fast wound healing response at
the expense of regeneration capability. But because during prenatal development
and early in life, mammals can exhibit some repair potential, one possibility is that
regenerative genetic programs are present in some cells but turned off during
development. Therefore, we could predict some beneficial pro-regenerative effects
of inflammation that could rely on an adequate balance between cytokines and/or
in selective responses on specific types of cells. Thus, pro-regenerative
components of the immune response could still be maintained within the context
of a more advanced immune system, like that of mammals, even if they are not
easily apparent. To sum up, the elucidation of mechanisms that operate similarly in
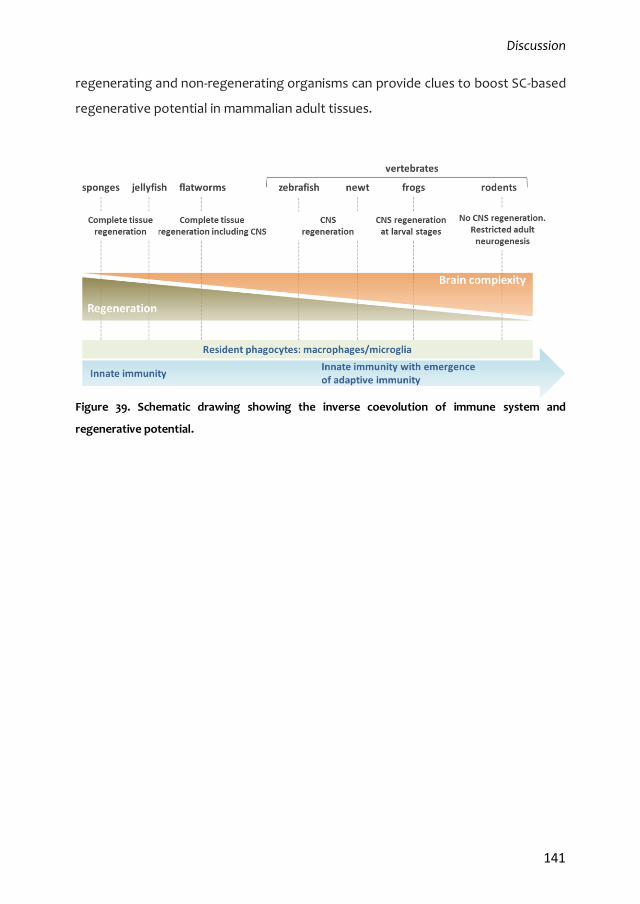
Discussion
141
regenerating and non-regenerating organisms can provide clues to boost SC-based
regenerative potential in mammalian adult tissues.
Figure 39. Schematic drawing showing the inverse coevolution of immune system and
regenerative potential.


Conclusions

Conclusions
145
1. We have developed and tested in different scenarios, a new cytometry panel,
based exclusively on the detection of surface markers, for the identification of
SEZ NSCs in different quiescent (qNSC1 and qNSC2) and proliferative states,
along with their more committed progeny.
2. In the adult SEZ, inflammatory signals such as TNF-α and progranulin drive
dormant qNSC1 to exit quiescence but, before reaching full activation, they
acquire a transient quiescent yet prone-to-activation alert qNSC2 state.
3. Mild peripheral insults, such as an intraperitoneal injection of sterile saline,
induce the expression of inflammatory signals in the SEZ promoting the
transition from qNSC1 to an alert qNSC2 that progressively returns to dormancy
upon resolution of neuroinflammation.
4. TNF-α, acting through TNFR1, causes detrimental effects on NSC proliferation
and survival whereas TNF-α and PGRN expand the population of multipotent
NSCs in vitro maintaining stemness, through their binding to TNFR2.
5. TNFR2 signalling, most probably transduced intracellularly through p38, targets
qNSC1 and prompts them to switch to an alert qNSC2.
6. In vitro culture conditions unavoidably force qNSCs to activation; however, a
small fraction of cells in the culture that can be expanded by TNFR2 stimulation,
retain some features reminiscent of the quiescent state found in vivo.


Bibliography


Bibliography
149
1. Adolf, B., Chapouton, P., Lam, C.S., Topp, S., Tannhauser, B., Strahle, U., Gotz, M., Bally-Cuif, L. (2006). 'Conserved and acquired features of adult neurogenesis in the zebrafish telencephalon'. Dev Biol 295, 278-293.
2. Aggarwal, B.B. (2000). 'Tumour necrosis factors receptor associated signalling molecules and their role in activation of apoptosis, JNK and NF-kappaB'. Annals of the rheumatic diseases 59 Suppl 1, i6-16.
3. Aggarwal, B.B., Gupta, S.C., Kim, J.H. (2012). 'Historical perspectives on tumor necrosis factor and its superfamily: 25 years later, a golden journey'. Blood 119, 651-665.
4. Aguirre, A., Rubio, M.E., Gallo, V. (2010). 'Notch and EGFR pathway interaction regulates neural stem cell number and self-renewal'. Nature 467, 323-327.
5. Aguzzi, A., Barres, B.A., Bennett, M.L. (2013). 'Microglia: scapegoat, saboteur, or something else?'. Science 339, 156-161.
6. Ahn, S., Joyner, A.L. (2005). 'In vivo analysis of quiescent adult neural stem cells responding to Sonic hedgehog'. Nature 437, 894-897.
7. Al-Lamki, R.S., Lu, W., Wang, J., Yang, J., Sargeant, T.J., Wells, R., Suo, C., Wright, P., Goddard, M., Huang, Q., Lebastchi, A.H., Tellides, G., Huang, Y., Min, W., Pober, J.S., Bradley, J.R. (2013). 'TNF, acting through inducibly expressed TNFR2, drives activation and cell cycle entry of c-Kit+ cardiac stem cells in ischemic heart disease'. Stem Cells 31, 1881-1892.
8. Alcantara Llaguno, S., Chen, J., Kwon, C.H., Jackson, E.L., Li, Y., Burns, D.K., Alvarez-Buylla, A., Parada, L.F. (2009). 'Malignant astrocytomas originate from neural stem/progenitor cells in a somatic tumor suppressor mouse model'. Cancer cell 15, 45-56.
9. Altman, J., Das, G.D. (1965). 'Autoradiographic and histological evidence of postnatal hippocampal neurogenesis in rats'. J Comp Neurol 124, 319-335.
10. Andreu-Agullo, C., Morante-Redolat, J.M., Delgado, A.C., Farinas, I. (2009). 'Vascular niche factor PEDF modulates Notch-dependent stemness in the adult subependymal zone'. Nature neuroscience 12, 1514-1523.
11. Anthony, T.E., Klein, C., Fishell, G., Heintz, N. (2004). 'Radial glia serve as neuronal progenitors in all regions of the central nervous system'. Neuron 41, 881-890.
12. Aurora, A.B., Olson, E.N. (2014). 'Immune modulation of stem cells and regeneration'. Cell stem cell 15, 14-25.
13. Banks, W.A., Erickson, M.A. (2010). 'The blood-brain barrier and immune function and dysfunction'. Neurobiol Dis 37, 26-32.
14. Barazzuol, L., Ju, L., Jeggo, P.A. (2017). 'A coordinated DNA damage response promotes adult quiescent neural stem cell activation'. PLoS biology 15, e2001264.
Bibliography
150
15. Barker, N., Bartfeld, S., Clevers, H. (2010). 'Tissue-resident adult stem cell populations of rapidly self-renewing organs'. Cell stem cell 7, 656-670.
16. Barker, N., Ridgway, R.A., van Es, J.H., van de Wetering, M., Begthel, H., van den Born, M., Danenberg, E., Clarke, A.R., Sansom, O.J., Clevers, H. (2009). 'Crypt stem cells as the cells-of-origin of intestinal cancer'. Nature 457, 608-611.
17. Bateman, A., Bennett, H.P. (2009). 'The granulin gene family: from cancer to dementia'. Bioessays 31, 1245-1254.
18. Bautch, V.L. (2011). 'Stem cells and the vasculature'. Nature medicine 17, 1437-1443.
19. Beckervordersandforth, R., Tripathi, P., Ninkovic, J., Bayam, E., Lepier, A., Stempfhuber, B., Kirchhoff, F., Hirrlinger, J., Haslinger, A., Lie, D.C., Beckers, J., Yoder, B., Irmler, M., Gotz, M. (2010). 'In vivo fate mapping and expression analysis reveals molecular hallmarks of prospectively isolated adult neural stem cells'. Cell stem cell 7, 744-758.
20. Belenguer, G., Domingo-Muelas, A., Ferron, S.R., Morante-Redolat, J.M., Farinas, I. (2016). 'Isolation, culture and analysis of adult subependymal neural stem cells'. Differentiation; research in biological diversity 91, 28-41.
21. Ben-Hur, T., Ben-Menachem, O., Furer, V., Einstein, O., Mizrachi-Kol, R., Grigoriadis, N. (2003). 'Effects of proinflammatory cytokines on the growth, fate, and motility of multipotential neural precursor cells'. Mol Cell Neurosci 24, 623-631.
22. Benner, E.J., Luciano, D., Jo, R., Abdi, K., Paez-Gonzalez, P., Sheng, H., Warner, D.S., Liu, C., Eroglu, C., Kuo, C.T. (2013). 'Protective astrogenesis from the SVZ niche after injury is controlled by Notch modulator Thbs4'. Nature 497, 369-373.
23. Berg, D.A., Belnoue, L., Song, H., Simon, A. (2013). 'Neurotransmitter-mediated control of neurogenesis in the adult vertebrate brain'. Development 140, 2548-2561.
24. Bernardino, L., Agasse, F., Silva, B., Ferreira, R., Grade, S., Malva, J.O. (2008). 'Tumor necrosis factor-alpha modulates survival, proliferation, and neuronal differentiation in neonatal subventricular zone cell cultures'. Stem Cells 26, 2361-2371.
25. Biteau, B., Hochmuth, C.E., Jasper, H. (2011). 'Maintaining tissue homeostasis: dynamic control of somatic stem cell activity'. Cell stem cell 9, 402-411.
26. Bjornsson, C.S., Apostolopoulou, M., Tian, Y., Temple, S. (2015). 'It takes a village: constructing the neurogenic niche'. Developmental cell 32, 435-446.
Bibliography
151
27. Boghdadi, A.G., Teo, L., Bourne, J.A. (2017). 'The Involvement of the Myelin-Associated Inhibitors and Their Receptors in CNS Plasticity and Injury'. Molecular neurobiology.
28. Bogoyevitch, M.A., Ngoei, K.R., Zhao, T.T., Yeap, Y.Y., Ng, D.C. (2010). 'c-Jun N-terminal kinase (JNK) signaling: recent advances and challenges'. Biochimica et biophysica acta 1804, 463-475.
29. Bond, A.M., Ming, G.L., Song, H. (2015). 'Adult Mammalian Neural Stem Cells and Neurogenesis: Five Decades Later'. Cell stem cell 17, 385-395.
30. Borsini, A., Zunszain, P.A., Thuret, S., Pariante, C.M. (2015). 'The role of inflammatory cytokines as key modulators of neurogenesis'. Trends in neurosciences 38, 145-157.
31. Brancho, D., Tanaka, N., Jaeschke, A., Ventura, J.J., Kelkar, N., Tanaka, Y., Kyuuma, M., Takeshita, T., Flavell, R.A., Davis, R.J. (2003). 'Mechanism of p38 MAP kinase activation in vivo'. Genes & development 17, 1969-1978.
32. Brinster, R.L., Zimmermann, J.W. (1994). 'Spermatogenesis following male germ-cell transplantation'. Proceedings of the National Academy of Sciences of the United States of America 91, 11298-11302.
33. Brouwers, N., Sleegers, K., Engelborghs, S., Maurer-Stroh, S., Gijselinck, I., van der Zee, J., Pickut, B.A., Van den Broeck, M., Mattheijssens, M., Peeters, K., Schymkowitz, J., Rousseau, F., Martin, J.J., Cruts, M., De Deyn, P.P., Van Broeckhoven, C. (2008). 'Genetic variability in progranulin contributes to risk for clinically diagnosed Alzheimer disease'. Neurology 71, 656-664.
34. Butovsky, O., Ziv, Y., Schwartz, A., Landa, G., Talpalar, A.E., Pluchino, S., Martino, G., Schwartz, M. (2006). 'Microglia activated by IL-4 or IFN-gamma differentially induce neurogenesis and oligodendrogenesis from adult stem/progenitor cells'. Mol Cell Neurosci 31, 149-160.
35. Cabal-Hierro, L., Lazo, P.S. (2012). 'Signal transduction by tumor necrosis factor receptors'. Cellular signalling 24, 1297-1305.
36. Calzolari, F., Michel, J., Baumgart, E.V., Theis, F., Gotz, M., Ninkovic, J. (2015). 'Fast clonal expansion and limited neural stem cell self-renewal in the adult subependymal zone'. Nature neuroscience 18, 490-492.
37. Candelario, K.M., Shuttleworth, C.W., Cunningham, L.A. (2013). 'Neural stem/progenitor cells display a low requirement for oxidative metabolism independent of hypoxia inducible factor-1alpha expression'. J Neurochem 125, 420-429.
38. Carpentier, P.A., Palmer, T.D. (2009). 'Immune influence on adult neural stem cell regulation and function'. Neuron 64, 79-92.
39. Carswell, E.A., Old, L.J., Kassel, R.L., Green, S., Fiore, N., Williamson, B. (1975). 'An endotoxin-induced serum factor that causes necrosis of tumors'.
Bibliography
152
Proceedings of the National Academy of Sciences of the United States of America 72, 3666-3670.
40. Cesetti, T., Fila, T., Obernier, K., Bengtson, C.P., Li, Y., Mandl, C., Holzl-Wenig, G., Ciccolini, F. (2011). 'GABAA receptor signaling induces osmotic swelling and cell cycle activation of neonatal prominin+ precursors'. Stem Cells 29, 307-319.
41. Codega, P., Silva-Vargas, V., Paul, A., Maldonado-Soto, A.R., Deleo, A.M., Pastrana, E., Doetsch, F. (2014). 'Prospective identification and purification of quiescent adult neural stem cells from their in vivo niche'. Neuron 82, 545-559.
42. Colak, D., Mori, T., Brill, M.S., Pfeifer, A., Falk, S., Deng, C., Monteiro, R., Mummery, C., Sommer, L., Gotz, M. (2008). 'Adult neurogenesis requires Smad4-mediated bone morphogenic protein signaling in stem cells'. The Journal of neuroscience : the official journal of the Society for Neuroscience 28, 434-446.
43. Conboy, I.M., Rando, T.A. (2012). 'Heterochronic parabiosis for the study of the effects of aging on stem cells and their niches'. Cell Cycle 11, 2260-2267.
44. Chaker, Z., Aid, S., Berry, H., Holzenberger, M. (2015). 'Suppression of IGF-I signals in neural stem cells enhances neurogenesis and olfactory function during aging'. Aging Cell 14, 847-856.
45. Chaker, Z., Codega, P., Doetsch, F. (2016). 'A mosaic world: puzzles revealed by adult neural stem cell heterogeneity'. Wiley interdisciplinary reviews. Developmental biology 5, 640-658.
46. Chang, L., Karin, M. (2001). 'Mammalian MAP kinase signalling cascades'. Nature 410, 37-40.
47. Chen, Z., Palmer, T.D. (2013). 'Differential roles of TNFR1 and TNFR2 signaling in adult hippocampal neurogenesis'. Brain, behavior, and immunity 30, 45-53.
48. Choi, H.R., Byun, S.Y., Kwon, S.H., Park, K.C. (2015). 'Niche interactions in epidermal stem cells'. World journal of stem cells 7, 495-501.
49. Daniel, R., He, Z., Carmichael, K.P., Halper, J., Bateman, A. (2000). 'Cellular localization of gene expression for progranulin'. J Histochem Cytochem 48, 999-1009.
50. Daynac, M., Chicheportiche, A., Pineda, J.R., Gauthier, L.R., Boussin, F.D., Mouthon, M.A. (2013). 'Quiescent neural stem cells exit dormancy upon alteration of GABAAR signaling following radiation damage'. Stem Cell Res 11, 516-528.
51. Daynac, M., Tirou, L., Faure, H., Mouthon, M.A., Gauthier, L.R., Hahn, H., Boussin, F.D., Ruat, M. (2016). 'Hedgehog Controls Quiescence and Activation of Neural Stem Cells in the Adult Ventricular-Subventricular Zone'. Stem cell reports 7, 735-748.
Bibliography
153
52. De Muynck, L., Van Damme, P. (2011). 'Cellular effects of progranulin in health and disease'. J Mol Neurosci 45, 549-560.
53. Deierborg, T., Roybon, L., Inacio, A.R., Pesic, J., Brundin, P. (2010). 'Brain injury activates microglia that induce neural stem cell proliferation ex vivo and promote differentiation of neurosphere-derived cells into neurons and oligodendrocytes'. Neuroscience 171, 1386-1396.
54. del Toro, R., Mendez-Ferrer, S. (2013). 'Autonomic regulation of hematopoiesis and cancer'. Haematologica 98, 1663-1666.
55. Delgado, A.C., Ferron, S.R., Vicente, D., Porlan, E., Perez-Villalba, A., Trujillo, C.M., D'Ocon, P., Farinas, I. (2014). 'Endothelial NT-3 delivered by vasculature and CSF promotes quiescence of subependymal neural stem cells through nitric oxide induction'. Neuron 83, 572-585.
56. Denis-Donini, S., Caprini, A., Frassoni, C., Grilli, M. (2005). 'Members of the NF-kappaB family expressed in zones of active neurogenesis in the postnatal and adult mouse brain'. Brain research. Developmental brain research 154, 81-89.
57. Dexter, T.M., Moore, M.A., Sheridan, A.P. (1977). 'Maintenance of hemopoietic stem cells and production of differentiated progeny in allogeneic and semiallogeneic bone marrow chimeras in vitro'. The Journal of experimental medicine 145, 1612-1616.
58. Dhawan, J., Rando, T.A. (2005). 'Stem cells in postnatal myogenesis: molecular mechanisms of satellite cell quiescence, activation and replenishment'. Trends in cell biology 15, 666-673.
59. Doetsch, F. (2003). 'The glial identity of neural stem cells'. Nature neuroscience 6, 1127-1134.
60. Doetsch, F., Alvarez-Buylla, A. (1996). 'Network of tangential pathways for neuronal migration in adult mammalian brain'. Proceedings of the National Academy of Sciences of the United States of America 93, 14895-14900.
61. Doetsch, F., Caille, I., Lim, D.A., Garcia-Verdugo, J.M., Alvarez-Buylla, A. (1999a). 'Subventricular zone astrocytes are neural stem cells in the adult mammalian brain'. Cell 97, 703-716.
62. Doetsch, F., Garcia-Verdugo, J.M., Alvarez-Buylla, A. (1997). 'Cellular composition and three-dimensional organization of the subventricular germinal zone in the adult mammalian brain'. The Journal of neuroscience : the official journal of the Society for Neuroscience 17, 5046-5061.
63. Doetsch, F., Garcia-Verdugo, J.M., Alvarez-Buylla, A. (1999b). 'Regeneration of a germinal layer in the adult mammalian brain'. Proceedings of the National Academy of Sciences of the United States of America 96, 11619-11624.
Bibliography
154
64. Doetsch, F., Petreanu, L., Caille, I., Garcia-Verdugo, J.M., Alvarez-Buylla, A. (2002a). 'EGF converts transit-amplifying neurogenic precursors in the adult brain into multipotent stem cells'. Neuron 36, 1021-1034.
65. Doetsch, F., Verdugo, J.M., Caille, I., Alvarez-Buylla, A., Chao, M.V., Casaccia-Bonnefil, P. (2002b). 'Lack of the cell-cycle inhibitor p27Kip1 results in selective increase of transit-amplifying cells for adult neurogenesis'. The Journal of neuroscience : the official journal of the Society for Neuroscience 22, 2255-2264.
66. Dykstra, B., Kent, D., Bowie, M., McCaffrey, L., Hamilton, M., Lyons, K., Lee, S.J., Brinkman, R., Eaves, C. (2007). 'Long-term propagation of distinct hematopoietic differentiation programs in vivo'. Cell stem cell 1, 218-229.
67. Ekdahl, C.T., Claasen, J.H., Bonde, S., Kokaia, Z., Lindvall, O. (2003). 'Inflammation is detrimental for neurogenesis in adult brain'. Proceedings of the National Academy of Sciences of the United States of America 100, 13632-13637.
68. Ellis, P., Fagan, B.M., Magness, S.T., Hutton, S., Taranova, O., Hayashi, S., McMahon, A., Rao, M., Pevny, L. (2004). 'SOX2, a persistent marker for multipotential neural stem cells derived from embryonic stem cells, the embryo or the adult'. Dev Neurosci 26, 148-165.
69. Escos, A., Risco, A., Alsina-Beauchamp, D., Cuenda, A. (2016). 'p38gamma and p38delta Mitogen Activated Protein Kinases (MAPKs), New Stars in the MAPK Galaxy'. Frontiers in cell and developmental biology 4, 31.
70. Espin-Palazon, R., Stachura, D.L., Campbell, C.A., Garcia-Moreno, D., Del Cid, N., Kim, A.D., Candel, S., Meseguer, J., Mulero, V., Traver, D. (2014). 'Proinflammatory signaling regulates hematopoietic stem cell emergence'. Cell 159, 1070-1085.
71. Faustman, D.L., Davis, M. (2013). 'TNF Receptor 2 and Disease: Autoimmunity and Regenerative Medicine'. Frontiers in immunology 4, 478.
72. Ferri, A.L., Cavallaro, M., Braida, D., Di Cristofano, A., Canta, A., Vezzani, A., Ottolenghi, S., Pandolfi, P.P., Sala, M., DeBiasi, S., Nicolis, S.K. (2004). 'Sox2 deficiency causes neurodegeneration and impaired neurogenesis in the adult mouse brain'. Development 131, 3805-3819.
73. Ferron, S.R., Charalambous, M., Radford, E., McEwen, K., Wildner, H., Hind, E., Morante-Redolat, J.M., Laborda, J., Guillemot, F., Bauer, S.R., Farinas, I., Ferguson-Smith, A.C. (2011). 'Postnatal loss of Dlk1 imprinting in stem cells and niche astrocytes regulates neurogenesis'. Nature 475, 381-385.
74. Fleming, H.E., Janzen, V., Lo Celso, C., Guo, J., Leahy, K.M., Kronenberg, H.M., Scadden, D.T. (2008). 'Wnt signaling in the niche enforces hematopoietic stem cell quiescence and is necessary to preserve self-renewal in vivo'. Cell stem cell 2, 274-283.

Bibliography
155
75. Fuchs, E., Tumbar, T., Guasch, G. (2004). 'Socializing with the neighbors: stem cells and their niche'. Cell 116, 769-778.
76. Fuentealba, L.C., Rompani, S.B., Parraguez, J.I., Obernier, K., Romero, R., Cepko, C.L., Alvarez-Buylla, A. (2015). 'Embryonic Origin of Postnatal Neural Stem Cells'. Cell 161, 1644-1655.
77. Furutachi, S., Matsumoto, A., Nakayama, K.I., Gotoh, Y. (2013). 'p57 controls adult neural stem cell quiescence and modulates the pace of lifelong neurogenesis'. EMBO J 32, 970-981.
78. Furutachi, S., Miya, H., Watanabe, T., Kawai, H., Yamasaki, N., Harada, Y., Imayoshi, I., Nelson, M., Nakayama, K.I., Hirabayashi, Y., Gotoh, Y. (2015). 'Slowly dividing neural progenitors are an embryonic origin of adult neural stem cells'. Nature neuroscience 18, 657-665.
79. Gaestel, M. (2006). 'MAPKAP kinases - MKs - two's company, three's a crowd'. Nature reviews. Molecular cell biology 7, 120-130.
80. Gaestel, M. (2015). 'MAPK-Activated Protein Kinases (MKs): Novel Insights and Challenges'. Frontiers in cell and developmental biology 3, 88.
81. Giachino, C., Basak, O., Lugert, S., Knuckles, P., Obernier, K., Fiorelli, R., Frank, S., Raineteau, O., Alvarez-Buylla, A., Taylor, V. (2014). 'Molecular diversity subdivides the adult forebrain neural stem cell population'. Stem Cells 32, 70-84.
82. Ginhoux, F., Greter, M., Leboeuf, M., Nandi, S., See, P., Gokhan, S., Mehler, M.F., Conway, S.J., Ng, L.G., Stanley, E.R., Samokhvalov, I.M., Merad, M. (2010). 'Fate mapping analysis reveals that adult microglia derive from primitive macrophages'. Science 330, 841-845.
83. Godbout, J.P., Chen, J., Abraham, J., Richwine, A.F., Berg, B.M., Kelley, K.W., Johnson, R.W. (2005). 'Exaggerated neuroinflammation and sickness behavior in aged mice following activation of the peripheral innate immune system'. FASEB J 19, 1329-1331.
84. Goings, G.E., Kozlowski, D.A., Szele, F.G. (2006). 'Differential activation of microglia in neurogenic versus non-neurogenic regions of the forebrain'. Glia 54, 329-342.
85. Gonzalez-Perez, O., Quinones-Hinojosa, A., Garcia-Verdugo, J.M. (2010). 'Immunological control of adult neural stem cells'. Journal of stem cells 5, 23-31.
86. Goodell, M.A., Nguyen, H., Shroyer, N. (2015). 'Somatic stem cell heterogeneity: diversity in the blood, skin and intestinal stem cell compartments'. Nature reviews. Molecular cell biology 16, 299-309.
Bibliography
156
87. He, Q., Zhang, C., Wang, L., Zhang, P., Ma, D., Lv, J., Liu, F. (2015). 'Inflammatory signaling regulates hematopoietic stem and progenitor cell emergence in vertebrates'. Blood 125, 1098-1106.
88. He, Z., Ong, C.H., Halper, J., Bateman, A. (2003). 'Progranulin is a mediator of the wound response'. Nature medicine 9, 225-229.
89. Hoglinger, G.U., Rizk, P., Muriel, M.P., Duyckaerts, C., Oertel, W.H., Caille, I., Hirsch, E.C. (2004). 'Dopamine depletion impairs precursor cell proliferation in Parkinson disease'. Nature neuroscience 7, 726-735.
90. Hsieh, J. (2012). 'Orchestrating transcriptional control of adult neurogenesis'. Genes & development 26, 1010-1021.
91. Imayoshi, I., Sakamoto, M., Ohtsuka, T., Takao, K., Miyakawa, T., Yamaguchi, M., Mori, K., Ikeda, T., Itohara, S., Kageyama, R. (2008). 'Roles of continuous neurogenesis in the structural and functional integrity of the adult forebrain'. Nature neuroscience 11, 1153-1161.
92. Iosif, R.E., Ahlenius, H., Ekdahl, C.T., Darsalia, V., Thored, P., Jovinge, S., Kokaia, Z., Lindvall, O. (2008). 'Suppression of stroke-induced progenitor proliferation in adult subventricular zone by tumor necrosis factor receptor 1'. Journal of cerebral blood flow and metabolism : official journal of the International Society of Cerebral Blood Flow and Metabolism 28, 1574-1587.
93. Iosif, R.E., Ekdahl, C.T., Ahlenius, H., Pronk, C.J., Bonde, S., Kokaia, Z., Jacobsen, S.E., Lindvall, O. (2006). 'Tumor necrosis factor receptor 1 is a negative regulator of progenitor proliferation in adult hippocampal neurogenesis'. The Journal of neuroscience : the official journal of the Society for Neuroscience 26, 9703-9712.
94. Jakubs, K., Bonde, S., Iosif, R.E., Ekdahl, C.T., Kokaia, Z., Kokaia, M., Lindvall, O. (2008). 'Inflammation regulates functional integration of neurons born in adult brain'. The Journal of neuroscience : the official journal of the Society for Neuroscience 28, 12477-12488.
95. Jhaveri, D.J., O'Keeffe, I., Robinson, G.J., Zhao, Q.Y., Zhang, Z.H., Nink, V., Narayanan, R.K., Osborne, G.W., Wray, N.R., Bartlett, P.F. (2015). 'Purification of neural precursor cells reveals the presence of distinct, stimulus-specific subpopulations of quiescent precursors in the adult mouse hippocampus'. The Journal of neuroscience : the official journal of the Society for Neuroscience 35, 8132-8144.
96. Jungblut, M., Tiveron, M.C., Barral, S., Abrahamsen, B., Knobel, S., Pennartz, S., Schmitz, J., Perraut, M., Pfrieger, F.W., Stoffel, W., Cremer, H., Bosio, A. (2012). 'Isolation and characterization of living primary astroglial cells using the new GLAST-specific monoclonal antibody ACSA-1'. Glia 60, 894-907.
97. Kang, W., Hebert, J.M. (2012). 'A Sox2 BAC transgenic approach for targeting adult neural stem cells'. PloS one 7, e49038.
Bibliography
157
98. Katsimpardi, L., Litterman, N.K., Schein, P.A., Miller, C.M., Loffredo, F.S., Wojtkiewicz, G.R., Chen, J.W., Lee, R.T., Wagers, A.J., Rubin, L.L. (2014). 'Vascular and neurogenic rejuvenation of the aging mouse brain by young systemic factors'. Science 344, 630-634.
99. Kawaguchi, D., Furutachi, S., Kawai, H., Hozumi, K., Gotoh, Y. (2013). 'Dll1 maintains quiescence of adult neural stem cells and segregates asymmetrically during mitosis'. Nat Commun 4, 1880.
100. Kelsch, W., Mosley, C.P., Lin, C.W., Lois, C. (2007). 'Distinct mammalian precursors are committed to generate neurons with defined dendritic projection patterns'. PLoS biology 5, e300.
101. Keohane, A., Ryan, S., Maloney, E., Sullivan, A.M., Nolan, Y.M. (2010). 'Tumour necrosis factor-alpha impairs neuronal differentiation but not proliferation of hippocampal neural precursor cells: Role of Hes1'. Mol Cell Neurosci 43, 127-135.
102. Kessenbrock, K., Frohlich, L., Sixt, M., Lammermann, T., Pfister, H., Bateman, A., Belaaouaj, A., Ring, J., Ollert, M., Fassler, R., Jenne, D.E. (2008). 'Proteinase 3 and neutrophil elastase enhance inflammation in mice by inactivating antiinflammatory progranulin'. The Journal of clinical investigation 118, 2438-2447.
103. Khatri, P., Obernier, K., Simeonova, I.K., Hellwig, A., Holzl-Wenig, G., Mandl, C., Scholl, C., Wolfl, S., Winkler, J., Gaspar, J.A., Sachinidis, A., Ciccolini, F. (2014). 'Proliferation and cilia dynamics in neural stem cells prospectively isolated from the SEZ'. Scientific reports 4, 3803.
104. Kim, E.J., Ables, J.L., Dickel, L.K., Eisch, A.J., Johnson, J.E. (2011). 'Ascl1 (Mash1) defines cells with long-term neurogenic potential in subgranular and subventricular zones in adult mouse brain'. PloS one 6, e18472.
105. Kim, E.J., Leung, C.T., Reed, R.R., Johnson, J.E. (2007). 'In vivo analysis of Ascl1 defined progenitors reveals distinct developmental dynamics during adult neurogenesis and gliogenesis'. The Journal of neuroscience : the official journal of the Society for Neuroscience 27, 12764-12774.
106. Kimura, W., Xiao, F., Canseco, D.C., Muralidhar, S., Thet, S., Zhang, H.M., Abderrahman, Y., Chen, R., Garcia, J.A., Shelton, J.M., Richardson, J.A., Ashour, A.M., Asaithamby, A., Liang, H., Xing, C., Lu, Z., Zhang, C.C., Sadek, H.A. (2015). 'Hypoxia fate mapping identifies cycling cardiomyocytes in the adult heart'. Nature 523, 226-230.
107. Kippin, T.E., Kapur, S., van der Kooy, D. (2005a). 'Dopamine specifically inhibits forebrain neural stem cell proliferation, suggesting a novel effect of antipsychotic drugs'. The Journal of neuroscience : the official journal of the Society for Neuroscience 25, 5815-5823.
Bibliography
158
108. Kippin, T.E., Martens, D.J., van der Kooy, D. (2005b). 'p21 loss compromises the relative quiescence of forebrain stem cell proliferation leading to exhaustion of their proliferation capacity'. Genes & development 19, 756-767.
109. Kizil, C., Kaslin, J., Kroehne, V., Brand, M. (2012a). 'Adult neurogenesis and brain regeneration in zebrafish'. Developmental neurobiology 72, 429-461.
110. Kizil, C., Kyritsis, N., Brand, M. (2015). 'Effects of inflammation on stem cells: together they strive?'. EMBO Rep 16, 416-426.
111. Kizil, C., Kyritsis, N., Dudczig, S., Kroehne, V., Freudenreich, D., Kaslin, J., Brand, M. (2012b). 'Regenerative neurogenesis from neural progenitor cells requires injury-induced expression of Gata3'. Developmental cell 23, 1230-1237.
112. Knobloch, M., Jessberger, S. (2017). 'Metabolism and neurogenesis'. Current opinion in neurobiology 42, 45-52.
113. Kokaia, Z., Lindvall, O. (2003). 'Neurogenesis after ischaemic brain insults'. Current opinion in neurobiology 13, 127-132.
114. Kokaia, Z., Lindvall, O. (2012). 'Stem cell repair of striatal ischemia'. Progress in brain research 201, 35-53.
115. Kokovay, E., Goderie, S., Wang, Y., Lotz, S., Lin, G., Sun, Y., Roysam, B., Shen, Q., Temple, S. (2010). 'Adult SVZ lineage cells home to and leave the vascular niche via differential responses to SDF1/CXCR4 signaling'. Cell stem cell 7, 163-173.
116. Kokovay, E., Wang, Y., Kusek, G., Wurster, R., Lederman, P., Lowry, N., Shen, Q., Temple, S. (2012). 'VCAM1 is essential to maintain the structure of the SVZ niche and acts as an environmental sensor to regulate SVZ lineage progression'. Cell stem cell 11, 220-230.
117. Kriegstein, A., Alvarez-Buylla, A. (2009). 'The glial nature of embryonic and adult neural stem cells'. Annual review of neuroscience 32, 149-184.
118. Kuhn, H.G., Eisch, A.J., Spalding, K., Peterson, D.A. (2016). 'Detection and Phenotypic Characterization of Adult Neurogenesis'. Cold Spring Harbor perspectives in biology 8, a025981.
119. Kyritsis, N., Kizil, C., Brand, M. (2014). 'Neuroinflammation and central nervous system regeneration in vertebrates'. Trends in cell biology 24, 128-135.
120. Kyritsis, N., Kizil, C., Zocher, S., Kroehne, V., Kaslin, J., Freudenreich, D., Iltzsche, A., Brand, M. (2012). 'Acute inflammation initiates the regenerative response in the adult zebrafish brain'. Science 338, 1353-1356.
121. Lalli, G. (2014). 'Extracellular signals controlling neuroblast migration in the postnatal brain'. Adv Exp Med Biol 800, 149-180.
122. Lapouge, G., Youssef, K.K., Vokaer, B., Achouri, Y., Michaux, C., Sotiropoulou, P.A., Blanpain, C. (2011). 'Identifying the cellular origin of squamous skin
Bibliography
159
tumors'. Proceedings of the National Academy of Sciences of the United States of America 108, 7431-7436.
123. Lee, S.Y., Reichlin, A., Santana, A., Sokol, K.A., Nussenzweig, M.C., Choi, Y. (1997). 'TRAF2 is essential for JNK but not NF-kappaB activation and regulates lymphocyte proliferation and survival'. Immunity 7, 703-713.
124. Li, L., Candelario, K.M., Thomas, K., Wang, R., Wright, K., Messier, A., Cunningham, L.A. (2014). 'Hypoxia inducible factor-1alpha (HIF-1alpha) is required for neural stem cell maintenance and vascular stability in the adult mouse SVZ'. The Journal of neuroscience : the official journal of the Society for Neuroscience 34, 16713-16719.
125. Li, L., Clevers, H. (2010). 'Coexistence of quiescent and active adult stem cells in mammals'. Science 327, 542-545.
126. Li, L., Xie, T. (2005). 'Stem cell niche: structure and function'. Annual review of cell and developmental biology 21, 605-631.
127. Lim, D.A., Tramontin, A.D., Trevejo, J.M., Herrera, D.G., Garcia-Verdugo, J.M., Alvarez-Buylla, A. (2000). 'Noggin antagonizes BMP signaling to create a niche for adult neurogenesis'. Neuron 28, 713-726.
128. Liu, H.K., Belz, T., Bock, D., Takacs, A., Wu, H., Lichter, P., Chai, M., Schutz, G. (2008). 'The nuclear receptor tailless is required for neurogenesis in the adult subventricular zone'. Genes & development 22, 2473-2478.
129. Liu, X., Wang, Q., Haydar, T.F., Bordey, A. (2005a). 'Nonsynaptic GABA signaling in postnatal subventricular zone controls proliferation of GFAP-expressing progenitors'. Nature neuroscience 8, 1179-1187.
130. Liu, Y.P., Lin, H.I., Tzeng, S.F. (2005b). 'Tumor necrosis factor-alpha and interleukin-18 modulate neuronal cell fate in embryonic neural progenitor culture'. Brain Res 1054, 152-158.
131. Livneh, Y., Adam, Y., Mizrahi, A. (2014). 'Odor processing by adult-born neurons'. Neuron 81, 1097-1110.
132. London, A., Cohen, M., Schwartz, M. (2013). 'Microglia and monocyte-derived macrophages: functionally distinct populations that act in concert in CNS plasticity and repair'. Frontiers in cellular neuroscience 7, 34.
133. Lopez-Juarez, A., Howard, J., Ullom, K., Howard, L., Grande, A., Pardo, A., Waclaw, R., Sun, Y.Y., Yang, D., Kuan, C.Y., Campbell, K., Nakafuku, M. (2013). 'Gsx2 controls region-specific activation of neural stem cells and injury-induced neurogenesis in the adult subventricular zone'. Genes & development 27, 1272-1287.
134. Lun, M.P., Monuki, E.S., Lehtinen, M.K. (2015). 'Development and functions of the choroid plexus-cerebrospinal fluid system'. Nat Rev Neurosci 16, 445-457.
Bibliography
160
135. Lledo, P.M., Valley, M. (2016). 'Adult Olfactory Bulb Neurogenesis'. Cold Spring Harbor perspectives in biology 8.
136. Llorens-Bobadilla, E., Martin-Villalba, A. (2016). 'Adult NSC diversity and plasticity: the role of the niche'. Current opinion in neurobiology 42, 68-74.
137. Llorens-Bobadilla, E., Zhao, S., Baser, A., Saiz-Castro, G., Zwadlo, K., Martin-Villalba, A. (2015). 'Single-Cell Transcriptomics Reveals a Population of Dormant Neural Stem Cells that Become Activated upon Brain Injury'. Cell stem cell 17, 329-340.
138. MacEwan, D.J. (2002). 'TNF receptor subtype signalling: differences and cellular consequences'. Cellular signalling 14, 477-492.
139. Malatesta, P., Hartfuss, E., Gotz, M. (2000). 'Isolation of radial glial cells by fluorescent-activated cell sorting reveals a neuronal lineage'. Development 127, 5253-5263.
140. Marchetti, L., Klein, M., Schlett, K., Pfizenmaier, K., Eisel, U.L. (2004). 'Tumor necrosis factor (TNF)-mediated neuroprotection against glutamate-induced excitotoxicity is enhanced by N-methyl-D-aspartate receptor activation. Essential role of a TNF receptor 2-mediated phosphatidylinositol 3-kinase-dependent NF-kappa B pathway'. The Journal of biological chemistry 279, 32869-32881.
141. Marques-Torrejon, M.A., Porlan, E., Banito, A., Gomez-Ibarlucea, E., Lopez-Contreras, A.J., Fernandez-Capetillo, O., Vidal, A., Gil, J., Torres, J., Farinas, I. (2013). 'Cyclin-dependent kinase inhibitor p21 controls adult neural stem cell expansion by regulating Sox2 gene expression'. Cell stem cell 12, 88-100.
142. Marshall, C.A., Novitch, B.G., Goldman, J.E. (2005). 'Olig2 directs astrocyte and oligodendrocyte formation in postnatal subventricular zone cells'. The Journal of neuroscience : the official journal of the Society for Neuroscience 25, 7289-7298.
143. McKhann, G.M., Albert, M.S., Grossman, M., Miller, B., Dickson, D., Trojanowski, J.Q., Work Group on Frontotemporal, D., Pick's, D. (2001). 'Clinical and pathological diagnosis of frontotemporal dementia: report of the Work Group on Frontotemporal Dementia and Pick's Disease'. Arch Neurol 58, 1803-1809.
144. Menn, B., Garcia-Verdugo, J.M., Yaschine, C., Gonzalez-Perez, O., Rowitch, D., Alvarez-Buylla, A. (2006). 'Origin of oligodendrocytes in the subventricular zone of the adult brain'. The Journal of neuroscience : the official journal of the Society for Neuroscience 26, 7907-7918.
145. Mercier, F. (2016). 'Fractones: extracellular matrix niche controlling stem cell fate and growth factor activity in the brain in health and disease'. Cellular and molecular life sciences : CMLS 73, 4661-4674.
Bibliography
161
146. Merkle, F.T., Fuentealba, L.C., Sanders, T.A., Magno, L., Kessaris, N., Alvarez-Buylla, A. (2014). 'Adult neural stem cells in distinct microdomains generate previously unknown interneuron types'. Nature neuroscience 17, 207-214.
147. Merkle, F.T., Tramontin, A.D., Garcia-Verdugo, J.M., Alvarez-Buylla, A. (2004). 'Radial glia give rise to adult neural stem cells in the subventricular zone'. Proceedings of the National Academy of Sciences of the United States of America 101, 17528-17532.
148. Mich, J.K., Signer, R.A., Nakada, D., Pineda, A., Burgess, R.J., Vue, T.Y., Johnson, J.E., Morrison, S.J. (2014). 'Prospective identification of functionally distinct stem cells and neurosphere-initiating cells in adult mouse forebrain'. eLife 3, e02669.
149. Mirzadeh, Z., Merkle, F.T., Soriano-Navarro, M., Garcia-Verdugo, J.M., Alvarez-Buylla, A. (2008). 'Neural stem cells confer unique pinwheel architecture to the ventricular surface in neurogenic regions of the adult brain'. Cell stem cell 3, 265-278.
150. Miyata, T., Kawaguchi, A., Okano, H., Ogawa, M. (2001). 'Asymmetric inheritance of radial glial fibers by cortical neurons'. Neuron 31, 727-741.
151. Mohyeldin, A., Garzon-Muvdi, T., Quinones-Hinojosa, A. (2010). 'Oxygen in stem cell biology: a critical component of the stem cell niche'. Cell stem cell 7, 150-161.
152. Molofsky, A.V., Pardal, R., Iwashita, T., Park, I.K., Clarke, M.F., Morrison, S.J. (2003). 'Bmi-1 dependence distinguishes neural stem cell self-renewal from progenitor proliferation'. Nature 425, 962-967.
153. Molofsky, A.V., Slutsky, S.G., Joseph, N.M., He, S., Pardal, R., Krishnamurthy, J., Sharpless, N.E., Morrison, S.J. (2006). 'Increasing p16INK4a expression decreases forebrain progenitors and neurogenesis during ageing'. Nature 443, 448-452.
154. Monje, M.L., Toda, H., Palmer, T.D. (2003). 'Inflammatory blockade restores adult hippocampal neurogenesis'. Science 302, 1760-1765.
155. Montgomery, S.L., Bowers, W.J. (2012). 'Tumor necrosis factor-alpha and the roles it plays in homeostatic and degenerative processes within the central nervous system'. Journal of neuroimmune pharmacology : the official journal of the Society on NeuroImmune Pharmacology 7, 42-59.
156. Moore, K.A., Ema, H., Lemischka, I.R. (1997). 'In vitro maintenance of highly purified, transplantable hematopoietic stem cells'. Blood 89, 4337-4347.
157. Moreno-Estelles, M., Diaz-Moreno, M., Gonzalez-Gomez, P., Andreu, Z., Mira, H. (2012). 'Single and dual birthdating procedures for assessing the response of adult neural stem cells to the infusion of a soluble factor using halogenated thymidine analogs'. Current protocols in stem cell biology Chapter 2, Unit 2D 10.
Bibliography
162
158. Morrens, J., Van Den Broeck, W., Kempermann, G. (2012). 'Glial cells in adult neurogenesis'. Glia 60, 159-174.
159. Morrison, S.J., Spradling, A.C. (2008). 'Stem cells and niches: mechanisms that promote stem cell maintenance throughout life'. Cell 132, 598-611.
160. Murayama, A., Matsuzaki, Y., Kawaguchi, A., Shimazaki, T., Okano, H. (2002). 'Flow cytometric analysis of neural stem cells in the developing and adult mouse brain'. Journal of neuroscience research 69, 837-847.
161. Nait-Oumesmar, B., Decker, L., Lachapelle, F., Avellana-Adalid, V., Bachelin, C., Baron-Van Evercooren, A. (1999). 'Progenitor cells of the adult mouse subventricular zone proliferate, migrate and differentiate into oligodendrocytes after demyelination'. Eur J Neurosci 11, 4357-4366.
162. Nam, H.S., Benezra, R. (2009). 'High levels of Id1 expression define B1 type adult neural stem cells'. Cell stem cell 5, 515-526.
163. Nedachi, T., Kawai, T., Matsuwaki, T., Yamanouchi, K., Nishihara, M. (2011). 'Progranulin enhances neural progenitor cell proliferation through glycogen synthase kinase 3beta phosphorylation'. Neuroscience 185, 106-115.
164. Nimmerjahn, A., Kirchhoff, F., Helmchen, F. (2005). 'Resting microglial cells are highly dynamic surveillants of brain parenchyma in vivo'. Science 308, 1314-1318.
165. Noctor, S.C., Flint, A.C., Weissman, T.A., Dammerman, R.S., Kriegstein, A.R. (2001). 'Neurons derived from radial glial cells establish radial units in neocortex'. Nature 409, 714-720.
166. Ohtake, Y., Li, S. (2015). 'Molecular mechanisms of scar-sourced axon growth inhibitors'. Brain Res 1619, 22-35.
167. Orford, K.W., Scadden, D.T. (2008). 'Deconstructing stem cell self-renewal: genetic insights into cell-cycle regulation'. Nature reviews. Genetics 9, 115-128.
168. Ortega, F., Berninger, B., Costa, M.R. (2013a). 'Primary culture and live imaging of adult neural stem cells and their progeny'. Methods Mol Biol 1052, 1-11.
169. Ortega, F., Gascon, S., Masserdotti, G., Deshpande, A., Simon, C., Fischer, J., Dimou, L., Chichung Lie, D., Schroeder, T., Berninger, B. (2013b). 'Oligodendrogliogenic and neurogenic adult subependymal zone neural stem cells constitute distinct lineages and exhibit differential responsiveness to Wnt signalling'. Nature cell biology 15, 602-613.
170. Ottone, C., Krusche, B., Whitby, A., Clements, M., Quadrato, G., Pitulescu, M.E., Adams, R.H., Parrinello, S. (2014). 'Direct cell-cell contact with the vascular niche maintains quiescent neural stem cells'. Nature cell biology 16, 1045-1056.
171. Ousset, M., Van Keymeulen, A., Bouvencourt, G., Sharma, N., Achouri, Y., Simons, B.D., Blanpain, C. (2012). 'Multipotent and unipotent progenitors
Bibliography
163
contribute to prostate postnatal development'. Nature cell biology 14, 1131-1138.
172. Paez-Gonzalez, P., Asrican, B., Rodriguez, E., Kuo, C.T. (2014). 'Identification of distinct ChAT(+) neurons and activity-dependent control of postnatal SVZ neurogenesis'. Nature neuroscience 17, 934-942.
173. Parras, C.M., Galli, R., Britz, O., Soares, S., Galichet, C., Battiste, J., Johnson, J.E., Nakafuku, M., Vescovi, A., Guillemot, F. (2004). 'Mash1 specifies neurons and oligodendrocytes in the postnatal brain'. EMBO J 23, 4495-4505.
174. Pastrana, E., Cheng, L.C., Doetsch, F. (2009). 'Simultaneous prospective purification of adult subventricular zone neural stem cells and their progeny'. Proceedings of the National Academy of Sciences of the United States of America 106, 6387-6392.
175. Pastrana, E., Silva-Vargas, V., Doetsch, F. (2011). 'Eyes wide open: a critical review of sphere-formation as an assay for stem cells'. Cell stem cell 8, 486-498.
176. Petkau, T.L., Neal, S.J., Orban, P.C., MacDonald, J.L., Hill, A.M., Lu, G., Feldman, H.H., Mackenzie, I.R., Leavitt, B.R. (2010). 'Progranulin expression in the developing and adult murine brain'. J Comp Neurol 518, 3931-3947.
177. Philips, T., De Muynck, L., Thu, H.N., Weynants, B., Vanacker, P., Dhondt, J., Sleegers, K., Schelhaas, H.J., Verbeek, M., Vandenberghe, R., Sciot, R., Van Broeckhoven, C., Lambrechts, D., Van Leuven, F., Van Den Bosch, L., Robberecht, W., Van Damme, P. (2010). 'Microglial upregulation of progranulin as a marker of motor neuron degeneration'. J Neuropathol Exp Neurol 69, 1191-1200.
178. Picard-Riera, N., Decker, L., Delarasse, C., Goude, K., Nait-Oumesmar, B., Liblau, R., Pham-Dinh, D., Baron-Van Evercooren, A. (2002). 'Experimental autoimmune encephalomyelitis mobilizes neural progenitors from the subventricular zone to undergo oligodendrogenesis in adult mice'. Proceedings of the National Academy of Sciences of the United States of America 99, 13211-13216.
179. Pineda, J.R., Daynac, M., Chicheportiche, A., Cebrian-Silla, A., Sii Felice, K., Garcia-Verdugo, J.M., Boussin, F.D., Mouthon, M.A. (2013). 'Vascular-derived TGF-beta increases in the stem cell niche and perturbs neurogenesis during aging and following irradiation in the adult mouse brain'. EMBO molecular medicine 5, 548-562.
180. Pinto, L., Mader, M.T., Irmler, M., Gentilini, M., Santoni, F., Drechsel, D., Blum, R., Stahl, R., Bulfone, A., Malatesta, P., Beckers, J., Gotz, M. (2008). 'Prospective isolation of functionally distinct radial glial subtypes--lineage and transcriptome analysis'. Mol Cell Neurosci 38, 15-42.
Bibliography
164
181. Pluchino, S., Muzio, L., Imitola, J., Deleidi, M., Alfaro-Cervello, C., Salani, G., Porcheri, C., Brambilla, E., Cavasinni, F., Bergamaschi, A., Garcia-Verdugo, J.M., Comi, G., Khoury, S.J., Martino, G. (2008). 'Persistent inflammation alters the function of the endogenous brain stem cell compartment'. Brain 131, 2564-2578.
182. Ponti, G., Obernier, K., Guinto, C., Jose, L., Bonfanti, L., Alvarez-Buylla, A. (2013). 'Cell cycle and lineage progression of neural progenitors in the ventricular-subventricular zones of adult mice'. Proceedings of the National Academy of Sciences of the United States of America 110, E1045-1054.
183. Porlan, E., Marti-Prado, B., Morante-Redolat, J.M., Consiglio, A., Delgado, A.C., Kypta, R., Lopez-Otin, C., Kirstein, M., Farinas, I. (2014). 'MT5-MMP regulates adult neural stem cell functional quiescence through the cleavage of N-cadherin'. Nature cell biology 16, 629-638.
184. Porlan, E., Morante-Redolat, J.M., Marques-Torrejon, M.A., Andreu-Agullo, C., Carneiro, C., Gomez-Ibarlucea, E., Soto, A., Vidal, A., Ferron, S.R., Farinas, I. (2013a). 'Transcriptional repression of Bmp2 by p21(Waf1/Cip1) links quiescence to neural stem cell maintenance'. Nature neuroscience 16, 1567-1575.
185. Porlan, E., Perez-Villalba, A., Delgado, A.C., Ferron, S.R. (2013b). 'Paracrine regulation of neural stem cells in the subependymal zone'. Archives of biochemistry and biophysics 534, 11-19.
186. Qin, L., Wu, X., Block, M.L., Liu, Y., Breese, G.R., Hong, J.S., Knapp, D.J., Crews, F.T. (2007). 'Systemic LPS causes chronic neuroinflammation and progressive neurodegeneration'. Glia 55, 453-462.
187. Rafii, S., Butler, J.M., Ding, B.S. (2016). 'Angiocrine functions of organ-specific endothelial cells'. Nature 529, 316-325.
188. Ramirez-Castillejo, C., Sanchez-Sanchez, F., Andreu-Agullo, C., Ferron, S.R., Aroca-Aguilar, J.D., Sanchez, P., Mira, H., Escribano, J., Farinas, I. (2006). 'Pigment epithelium-derived factor is a niche signal for neural stem cell renewal'. Nature neuroscience 9, 331-339.
189. Redzic, Z.B., Preston, J.E., Duncan, J.A., Chodobski, A., Szmydynger-Chodobska, J. (2005). 'The choroid plexus-cerebrospinal fluid system: from development to aging'. Curr Top Dev Biol 71, 1-52.
190. Reynolds, B.A., Rietze, R.L. (2005). 'Neural stem cells and neurospheres--re-evaluating the relationship'. Nat Methods 2, 333-336.
191. Reynolds, B.A., Weiss, S. (1992). 'Generation of neurons and astrocytes from isolated cells of the adult mammalian central nervous system'. Science 255, 1707-1710.
Bibliography
165
192. Ribeiro Xavier, A.L., Kress, B.T., Goldman, S.A., Lacerda de Menezes, J.R., Nedergaard, M. (2015). 'A Distinct Population of Microglia Supports Adult Neurogenesis in the Subventricular Zone'. The Journal of neuroscience : the official journal of the Society for Neuroscience 35, 11848-11861.
193. Rios, M., Williams, D.A. (1990). 'Systematic analysis of the ability of stromal cell lines derived from different murine adult tissues to support maintenance of hematopoietic stem cells in vitro'. Journal of cellular physiology 145, 434-443.
194. Rodgers, J.T., King, K.Y., Brett, J.O., Cromie, M.J., Charville, G.W., Maguire, K.K., Brunson, C., Mastey, N., Liu, L., Tsai, C.R., Goodell, M.A., Rando, T.A. (2014). 'mTORC1 controls the adaptive transition of quiescent stem cells from G0 to G(Alert)'. Nature 510, 393-396.
195. Rodgers, J.T., Schroeder, M.D., Ma, C., Rando, T.A. (2017). 'HGFA Is an Injury-Regulated Systemic Factor that Induces the Transition of Stem Cells into GAlert'. Cell reports 19, 479-486.
196. Romero-Grimaldi, C., Moreno-Lopez, B., Estrada, C. (2008). 'Age-dependent effect of nitric oxide on subventricular zone and olfactory bulb neural precursor proliferation'. J Comp Neurol 506, 339-346.
197. Rossi, L., Lin, K.K., Boles, N.C., Yang, L., King, K.Y., Jeong, M., Mayle, A., Goodell, M.A. (2012). 'Less is more: unveiling the functional core of hematopoietic stem cells through knockout mice'. Cell stem cell 11, 302-317.
198. Rumman, M., Dhawan, J., Kassem, M. (2015). 'Concise Review: Quiescence in Adult Stem Cells: Biological Significance and Relevance to Tissue Regeneration'. Stem Cells 33, 2903-2912.
199. Sabio, G., Davis, R.J. (2014). 'TNF and MAP kinase signalling pathways'. Seminars in immunology 26, 237-245.
200. Sato, K. (2015). 'Effects of Microglia on Neurogenesis'. Glia 63, 1394-1405.
201. Sawamoto, K., Wichterle, H., Gonzalez-Perez, O., Cholfin, J.A., Yamada, M., Spassky, N., Murcia, N.S., Garcia-Verdugo, J.M., Marin, O., Rubenstein, J.L., Tessier-Lavigne, M., Okano, H., Alvarez-Buylla, A. (2006). 'New neurons follow the flow of cerebrospinal fluid in the adult brain'. Science 311, 629-632.
202. Schofield, R. (1978). 'The relationship between the spleen colony-forming cell and the haemopoietic stem cell'. Blood cells 4, 7-25.
203. Schwartz, M. (2010). '"Tissue-repairing" blood-derived macrophages are essential for healing of the injured spinal cord: from skin-activated macrophages to infiltrating blood-derived cells?'. Brain, behavior, and immunity 24, 1054-1057.
Bibliography
166
204. Schwartz, M., London, A., Shechter, R. (2009). 'Boosting T-cell immunity as a therapeutic approach for neurodegenerative conditions: the role of innate immunity'. Neuroscience 158, 1133-1142.
205. Schwartz, M., Shechter, R. (2010). 'Systemic inflammatory cells fight off neurodegenerative disease'. Nature reviews. Neurology 6, 405-410.
206. Seri, B., Garcia-Verdugo, J.M., McEwen, B.S., Alvarez-Buylla, A. (2001). 'Astrocytes give rise to new neurons in the adult mammalian hippocampus'. The Journal of neuroscience : the official journal of the Society for Neuroscience 21, 7153-7160.
207. Sethi, G., Sung, B., Aggarwal, B.B. (2008). 'TNF: a master switch for inflammation to cancer'. Frontiers in bioscience : a journal and virtual library 13, 5094-5107.
208. Shaulian, E., Karin, M. (2002). 'AP-1 as a regulator of cell life and death'. Nature cell biology 4, E131-136.
209. Shen, Q., Goderie, S.K., Jin, L., Karanth, N., Sun, Y., Abramova, N., Vincent, P., Pumiglia, K., Temple, S. (2004). 'Endothelial cells stimulate self-renewal and expand neurogenesis of neural stem cells'. Science 304, 1338-1340.
210. Shen, Q., Wang, Y., Kokovay, E., Lin, G., Chuang, S.M., Goderie, S.K., Roysam, B., Temple, S. (2008). 'Adult SVZ stem cells lie in a vascular niche: a quantitative analysis of niche cell-cell interactions'. Cell stem cell 3, 289-300.
211. Shin, J., Berg, D.A., Zhu, Y., Shin, J.Y., Song, J., Bonaguidi, M.A., Enikolopov, G., Nauen, D.W., Christian, K.M., Ming, G.L., Song, H. (2015). 'Single-Cell RNA-Seq with Waterfall Reveals Molecular Cascades underlying Adult Neurogenesis'. Cell stem cell 17, 360-372.
212. Shook, B.A., Manz, D.H., Peters, J.J., Kang, S., Conover, J.C. (2012). 'Spatiotemporal changes to the subventricular zone stem cell pool through aging'. The Journal of neuroscience : the official journal of the Society for Neuroscience 32, 6947-6956.
213. Sierra, A., Encinas, J.M., Deudero, J.J., Chancey, J.H., Enikolopov, G., Overstreet-Wadiche, L.S., Tsirka, S.E., Maletic-Savatic, M. (2010). 'Microglia shape adult hippocampal neurogenesis through apoptosis-coupled phagocytosis'. Cell stem cell 7, 483-495.
214. Silva-Vargas, V., Maldonado-Soto, A.R., Mizrak, D., Codega, P., Doetsch, F. (2016). 'Age-Dependent Niche Signals from the Choroid Plexus Regulate Adult Neural Stem Cells'. Cell stem cell 19, 643-652.
215. Skelly, D.T., Hennessy, E., Dansereau, M.A., Cunningham, C. (2013). 'A systematic analysis of the peripheral and CNS effects of systemic LPS, IL-1beta, [corrected] TNF-alpha and IL-6 challenges in C57BL/6 mice'. PloS one 8, e69123.
Bibliography
167
216. Smith, K.R., Damiano, J., Franceschetti, S., Carpenter, S., Canafoglia, L., Morbin, M., Rossi, G., Pareyson, D., Mole, S.E., Staropoli, J.F., Sims, K.B., Lewis, J., Lin, W.L., Dickson, D.W., Dahl, H.H., Bahlo, M., Berkovic, S.F. (2012). 'Strikingly different clinicopathological phenotypes determined by progranulin-mutation dosage'. Am J Hum Genet 90, 1102-1107.
217. Sohn, J., Orosco, L., Guo, F., Chung, S.H., Bannerman, P., Mills Ko, E., Zarbalis, K., Deng, W., Pleasure, D. (2015). 'The subventricular zone continues to generate corpus callosum and rostral migratory stream astroglia in normal adult mice'. The Journal of neuroscience : the official journal of the Society for Neuroscience 35, 3756-3763.
218. Solano Fonseca, R., Mahesula, S., Apple, D.M., Raghunathan, R., Dugan, A., Cardona, A., O'Connor, J., Kokovay, E. (2016). 'Neurogenic Niche Microglia Undergo Positional Remodeling and Progressive Activation Contributing to Age-Associated Reductions in Neurogenesis'. Stem cells and development 25, 542-555.
219. Spassky, N., Merkle, F.T., Flames, N., Tramontin, A.D., Garcia-Verdugo, J.M., Alvarez-Buylla, A. (2005). 'Adult ependymal cells are postmitotic and are derived from radial glial cells during embryogenesis'. The Journal of neuroscience : the official journal of the Society for Neuroscience 25, 10-18.
220. Stange, D.E., Koo, B.K., Huch, M., Sibbel, G., Basak, O., Lyubimova, A., Kujala, P., Bartfeld, S., Koster, J., Geahlen, J.H., Peters, P.J., van Es, J.H., van de Wetering, M., Mills, J.C., Clevers, H. (2013). 'Differentiated Troy+ chief cells act as reserve stem cells to generate all lineages of the stomach epithelium'. Cell 155, 357-368.
221. Stolp, H.B., Turnquist, C., Dziegielewska, K.M., Saunders, N.R., Anthony, D.C., Molnar, Z. (2011). 'Reduced ventricular proliferation in the foetal cortex following maternal inflammation in the mouse'. Brain 134, 3236-3248.
222. Takeda, H., Koso, H., Tessarollo, L., Copeland, N.G., Jenkins, N.A. (2013). 'Musashi1-CreER(T2) : a new cre line for conditional mutagenesis in neural stem cells'. Genesis 51, 128-134.
223. Tavazoie, M., Van der Veken, L., Silva-Vargas, V., Louissaint, M., Colonna, L., Zaidi, B., Garcia-Verdugo, J.M., Doetsch, F. (2008). 'A specialized vascular niche for adult neural stem cells'. Cell stem cell 3, 279-288.
224. Tesz, G.J., Guilherme, A., Guntur, K.V., Hubbard, A.C., Tang, X., Chawla, A., Czech, M.P. (2007). 'Tumor necrosis factor alpha (TNFalpha) stimulates Map4k4 expression through TNFalpha receptor 1 signaling to c-Jun and activating transcription factor 2'. The Journal of biological chemistry 282, 19302-19312.
225. Than-Trong, E., Bally-Cuif, L. (2015). 'Radial glia and neural progenitors in the adult zebrafish central nervous system'. Glia 63, 1406-1428.
Bibliography
168
226. Thomas, K., Engler, A.J., Meyer, G.A. (2015). 'Extracellular matrix regulation in the muscle satellite cell niche'. Connective tissue research 56, 1-8.
227. Tian, C., Zhang, Y. (2016). 'Purification of hematopoietic stem cells from bone marrow'. Annals of hematology 95, 543-547.
228. Tian, H., Biehs, B., Warming, S., Leong, K.G., Rangell, L., Klein, O.D., de Sauvage, F.J. (2011). 'A reserve stem cell population in small intestine renders Lgr5-positive cells dispensable'. Nature 478, 255-259.
229. Till, J.E., Mc, C.E. (1961). 'A direct measurement of the radiation sensitivity of normal mouse bone marrow cells'. Radiation research 14, 213-222.
230. Tong, C.K., Chen, J., Cebrian-Silla, A., Mirzadeh, Z., Obernier, K., Guinto, C.D., Tecott, L.H., Garcia-Verdugo, J.M., Kriegstein, A., Alvarez-Buylla, A. (2014). 'Axonal control of the adult neural stem cell niche'. Cell stem cell 14, 500-511.
231. Tournier, C., Dong, C., Turner, T.K., Jones, S.N., Flavell, R.A., Davis, R.J. (2001). 'MKK7 is an essential component of the JNK signal transduction pathway activated by proinflammatory cytokines'. Genes & development 15, 1419-1426.
232. Tramontin, A.D., Garcia-Verdugo, J.M., Lim, D.A., Alvarez-Buylla, A. (2003). 'Postnatal development of radial glia and the ventricular zone (VZ): a continuum of the neural stem cell compartment'. Cereb Cortex 13, 580-587.
233. Turrin, N.P., Gayle, D., Ilyin, S.E., Flynn, M.C., Langhans, W., Schwartz, G.J., Plata-Salaman, C.R. (2001). 'Pro-inflammatory and anti-inflammatory cytokine mRNA induction in the periphery and brain following intraperitoneal administration of bacterial lipopolysaccharide'. Brain Res Bull 54, 443-453.
234. Urban, N., van den Berg, D.L., Forget, A., Andersen, J., Demmers, J.A., Hunt, C., Ayrault, O., Guillemot, F. (2016). 'Return to quiescence of mouse neural stem cells by degradation of a proactivation protein'. Science 353, 292-295.
235. Van Damme, P., Van Hoecke, A., Lambrechts, D., Vanacker, P., Bogaert, E., van Swieten, J., Carmeliet, P., Van Den Bosch, L., Robberecht, W. (2008). 'Progranulin functions as a neurotrophic factor to regulate neurite outgrowth and enhance neuronal survival'. J Cell Biol 181, 37-41.
236. Van Keymeulen, A., Rocha, A.S., Ousset, M., Beck, B., Bouvencourt, G., Rock, J., Sharma, N., Dekoninck, S., Blanpain, C. (2011). 'Distinct stem cells contribute to mammary gland development and maintenance'. Nature 479, 189-193.
237. Venere, M., Han, Y.G., Bell, R., Song, J.S., Alvarez-Buylla, A., Blelloch, R. (2012). 'Sox1 marks an activated neural stem/progenitor cell in the hippocampus'. Development 139, 3938-3949.
238. Voog, J., Jones, D.L. (2010). 'Stem cells and the niche: a dynamic duo'. Cell stem cell 6, 103-115.
Bibliography
169
239. Vyas, D., Laput, G., Vyas, A.K. (2014). 'Chemotherapy-enhanced inflammation may lead to the failure of therapy and metastasis'. OncoTargets and therapy 7, 1015-1023.
240. Wagers, A.J. (2012). 'The stem cell niche in regenerative medicine'. Cell stem cell 10, 362-369.
241. Waisman, A., Liblau, R.S., Becher, B. (2015). 'Innate and adaptive immune responses in the CNS'. The Lancet. Neurology 14, 945-955.
242. Wajant, H., Pfizenmaier, K., Scheurich, P. (2003). 'Tumor necrosis factor signaling'. Cell death and differentiation 10, 45-65.
243. Wang, B.C., Liu, H., Talwar, A., Jian, J. (2015). 'New discovery rarely runs smooth: an update on progranulin/TNFR interactions'. Protein & cell 6, 792-803.
244. Weissman, I.L. (2000). 'Stem cells: units of development, units of regeneration, and units in evolution'. Cell 100, 157-168.
245. Widera, D., Mikenberg, I., Elvers, M., Kaltschmidt, C., Kaltschmidt, B. (2006a). 'Tumor necrosis factor alpha triggers proliferation of adult neural stem cells via IKK/NF-kappaB signaling'. BMC Neurosci 7, 64.
246. Widera, D., Mikenberg, I., Kaltschmidt, B., Kaltschmidt, C. (2006b). 'Potential role of NF-kappaB in adult neural stem cells: the underrated steersman?'. International journal of developmental neuroscience : the official journal of the International Society for Developmental Neuroscience 24, 91-102.
247. Wolf, S.A., Steiner, B., Wengner, A., Lipp, M., Kammertoens, T., Kempermann, G. (2009). 'Adaptive peripheral immune response increases proliferation of neural precursor cells in the adult hippocampus'. FASEB J 23, 3121-3128.
248. Wong, G., Goldshmit, Y., Turnley, A.M. (2004). 'Interferon-gamma but not TNF alpha promotes neuronal differentiation and neurite outgrowth of murine adult neural stem cells'. Experimental neurology 187, 171-177.
249. Wu, H., Coskun, V., Tao, J., Xie, W., Ge, W., Yoshikawa, K., Li, E., Zhang, Y., Sun, Y.E. (2010). 'Dnmt3a-dependent nonpromoter DNA methylation facilitates transcription of neurogenic genes'. Science 329, 444-448.
250. Wu, J.P., Kuo, J.S., Liu, Y.L., Tzeng, S.F. (2000). 'Tumor necrosis factor-alpha modulates the proliferation of neural progenitors in the subventricular/ventricular zone of adult rat brain'. Neuroscience letters 292, 203-206.
251. Yeh, W.C., Shahinian, A., Speiser, D., Kraunus, J., Billia, F., Wakeham, A., de la Pompa, J.L., Ferrick, D., Hum, B., Iscove, N., Ohashi, P., Rothe, M., Goeddel, D.V., Mak, T.W. (1997). 'Early lethality, functional NF-kappaB activation, and increased sensitivity to TNF-induced cell death in TRAF2-deficient mice'. Immunity 7, 715-725.
Bibliography
170
252. Young, K.M., Fogarty, M., Kessaris, N., Richardson, W.D. (2007). 'Subventricular zone stem cells are heterogeneous with respect to their embryonic origins and neurogenic fates in the adult olfactory bulb'. The Journal of neuroscience : the official journal of the Society for Neuroscience 27, 8286-8296.
253. Young, K.M., Mitsumori, T., Pringle, N., Grist, M., Kessaris, N., Richardson, W.D. (2010). 'An Fgfr3-iCreER(T2) transgenic mouse line for studies of neural stem cells and astrocytes'. Glia 58, 943-953.
254. Youssef, K.K., Van Keymeulen, A., Lapouge, G., Beck, B., Michaux, C., Achouri, Y., Sotiropoulou, P.A., Blanpain, C. (2010). 'Identification of the cell lineage at the origin of basal cell carcinoma'. Nature cell biology 12, 299-305.
255. Zhang, J.M., An, J. (2007). 'Cytokines, inflammation, and pain'. International anesthesiology clinics 45, 27-37.
256. Zheng, W., Nowakowski, R.S., Vaccarino, F.M. (2004). 'Fibroblast growth factor 2 is required for maintaining the neural stem cell pool in the mouse brain subventricular zone'. Dev Neurosci 26, 181-196.
257. Zhu, J., Nathan, C., Jin, W., Sim, D., Ashcroft, G.S., Wahl, S.M., Lacomis, L., Erdjument-Bromage, H., Tempst, P., Wright, C.D., Ding, A. (2002). 'Conversion of proepithelin to epithelins: roles of SLPI and elastase in host defense and wound repair'. Cell 111, 867-878.
258. Ziegler, A.N., Schneider, J.S., Qin, M., Tyler, W.A., Pintar, J.E., Fraidenraich, D., Wood, T.L., Levison, S.W. (2012). 'IGF-II promotes stemness of neural restricted precursors'. Stem Cells 30, 1265-1276.
259. Ziv, Y., Ron, N., Butovsky, O., Landa, G., Sudai, E., Greenberg, N., Cohen, H., Kipnis, J., Schwartz, M. (2006). 'Immune cells contribute to the maintenance of neurogenesis and spatial learning abilities in adulthood'. Nature neuroscience 9, 268-275.
260. Zonis, S., Pechnick, R.N., Ljubimov, V.A., Mahgerefteh, M., Wawrowsky, K., Michelsen, K.S., Chesnokova, V. (2015). 'Chronic intestinal inflammation alters hippocampal neurogenesis'. J Neuroinflammation 12, 65.

Resumen

Resumen
173
Introducción
Células madre adultas: unidades funcionales de la homeostasis y la reparación
tisular. Las células madre (SCs, del inglés Stem Cell) adultas son células únicas con
capacidad de perpetuarse (auto-renovación) mientras producen nuevas células
diferenciadas propias de cada tejido (multipotencia) y representan el componente
esencial para el mantenimiento de la homeostasis y la reparación de tejidos en
organismos multicelulares. En condiciones homeostáticas, las SCs son células
relativamente quiescentes que se dividen infrecuentemente para producir nuevas
SCs y células de ciclo rápido no auto-renovantes, o progenitores de rápida
amplificación (TAPs, del inglés Transit Amplifying Cells) que proliferarán durante un
número discreto de ciclos para terminar diferenciandose en células funcionales de
cada tejido en particular. Este proceso requiere un equilibrio finamente regulado
entre auto-renovación, proliferación y diferenciación celular para garantizar el
correcto reemplazo de células dañadas y al mismo tiempo limitar situaciones
patológicas como el cáncer.
En las últimas décadas, se han identificado multitud de poblaciones de SCs
residiendo en muy diversos tejidos y su caracterización ha puesto de manifiesto la
existencia de una notable diversidad en cuanto a los marcadores de identificación,
el grado de multipotencialidad o su dinámica proliferativa. En realidad, las SCs
representan un conjunto de células individuales en diferentes estados
proliferativos (quiescentes o activos) con distintas predisposiciones en la respuesta
a estímulos externos.
La quiescencia es un estado del ciclo celular no proliferativo reversible (G0) y, a
diferencia de células post-mitóticas, las SCs quiescentes mantienen la capacidad de
re-entrar en ciclo y proliferar. Actualmente se conoce que esta condición no es un
proceso celular inactivo por defecto sino que más bien representa un estado
activamente regulado por multiples señales del nicho que les rodea. Además, en
distintos tejidos, se ha visto que después de una lesión esta población es capaz de
Resumen
174
aumenta drásticamente su proliferación mostrando una enorme capacidad
regenerativa. Recientemente se ha descrito en músculo y en tejido
hematopoyetico que las SCs quiescentes son capaces de responder a una lesión
distante mostrando propiedades de un estado pre-activado. Este estado
quiescente en alerta (Galert), como se ha definido, y comparado con el estado
inactivo (G0), muestra una mayor predisposición a entrar en proliferación, una
entrada acelerada en el ciclo celular, una mayor actividad mitocondrial y un tamaño
ligeramente más grande. Además, los perfiles globales de transcripción sugieren
que representa un estado intermedio entre G0 y las SC activas. Estas poblaciones
de SCs parecen adoptar este estado en respuesta a las lesiones remotas cuyo
impacto en la fisiología del tejido no es suficiente para promover su activación.
Estos datos han demostrado que las SCs también experimentan transiciones
dinámicas entre las distintas fases funcionales de quiescencia e indican que las SCs
quiescentes adoptan un estado adaptativo en respuesta a señales que pueden ser
producidas en regiones remotas del organismo, sugiriendo la existencia de un
control homeostático global de las SCs adultas. Sin embargo, la relevancia de la
regulación de esta transición en homeostasis y regeneración tisular o la naturaleza
de los reguladores que controlan la adquisición de un estado alerta o un estado
inactivo no se conocen todavía.
Células madre neurales (NSCs) subependimales y neurogénesis adulta. En el
cerebro adulto de los mamíferos se detecta neurogénesis en dos “nichos
neurogénicos”: el giro dentado (SGZ) y la zona subependimaria o ventricular-
subventricular (SEZ o V-SVZ). Las células madre neurales (NSCs, del inglés Neural
Stem Cells) de la SEZ y su progenie están distribuidos a lo largo de las paredes
laterales delos ventrículos laterales y son responsables de la producción continua
de nuevas neuronas destinadas al bulbo olfactorio (OB). Este proceso sigue una
progresión jerárquica en la que las NSCs multipotentes, identificadas inicialmente
como células de tipo B1, tras activarse, dan lugar a TAPs o células de tipo C que se
Resumen
175
dividen unas pocas veces más antes de convertirse en neuroblastos migratorios o
células de tipo A.
Las NSCs adultas o células tipo B1 son células gliales derivadas de la glia radial
embrionaria que comparten características ultraestructurales y moleculares con
otros astrocitos cerebrales como la expresión de los marcadores GFAP, GLAST y
BLBP. Una vez aisladas de la SEZ, las NSCs pueden ser cultivadas in vitro en
presencia de factor de crecimiento epidérmico (EGF) o fibroblástico básico (FGF2).
En estas condiciones, las NSCs proliferan activamente y pueden ser cultivadas de
forma prácticamente ilimitada. Además son capaces de diferenciarse a neuronas,
oligodendrocitos y astrocitos, lo que demuestra su multipotencialidad.
En los últimos años, varios trabajos han demostrado la co-existencia de NSCs que
difieren en el grado de actividad dentro de su relativa quiescencia encontrándose
NSCs en estado “durmiente” (G0) o NSCs quiescentes (qNSCs) y, por otra parte,
NSCs en estado “activado” (aNSCs, en ciclo activo, aunque lento). Además, el
análisis del perfil de expresión de NSCs a nivel individual, tanto en condiciones
homeostáticas como en condiciones de daño cerebral, han sugerido la existencia
de células quiescentes en un estado ‘alerta’ (qNSC2) o competentes para la
activación en respuesta a distintas señales, diferenciándose del resto de
quiescentes en estado durmiente (qNSC1). Sin embargo, todavía se desconoce si la
transición al estado alerta es reversible y cuál es su posible implicación en el
mantenimiento del reservorio de NSCs. Una adecuada renovación tisular, tanto en
homeostasis como tras una lesión, depende de un equilibrio finamente regulado
entre quiescencia y activación, auto-renovación, proliferación y diferenciación de
las SCs. En los nichos neurogénicos adultos se han descrito múltiples factores,
tanto determinantes intrínsecos de las propias NSCs como señales externas
provenientes del nicho, que participan en el control la función de las NSCs, como
son interacciones directas con células mesenquimales, vasculares, neuronales,
Resumen
176
gliales o inflamatorias, factores solubles producidos por éstas, señales de la matriz
extracelular o parámetros físicos como la disponibilidad de oxígeno.
Regulación de las NSCs adultas por el sistema inmune innato. Actualmente no
existe duda de que la neuroinflamación, tanto en situaciones agudas como
crónicas, afecta de múltiples maneras a las NSCs. Las SCs adultas en distintos
tejidos pueden ser activadas por lesión para producir progenie y contribuir a la
reparación del tejido, aunque actualmente se desconoce en profundidad cuáles son
los factores desencadenantes y los reguladores moleculares de esta activación. Los
organismos vivos están constantemente expuestos a una variedad de estímulos
internos y externos y algunos de ellos pueden clasificarse como señales de peligro.
Cuando se detectan tales señales, se pone en marcha una respuesta compleja que
está dirigida por un lado a eliminar dichas señales de peligro y, por otro, a restaurar
la homeostasis de los tejidos. Esta respuesta se conoce como inflamación y es
parte del sistema inmune innato presente en todos los metazoos. En vertebrados,
la activación del sistema inmune en respuesta a una lesión ha evolucionado para
promover el sellado de heridas y cicatrices protegiendo el tejido dañado de
mamíferos homeotermos adultos de la invasión de patógenos de una manera muy
rápida y eficiente. Sin embargo, esta refinada respuesta inmune adaptativa
conlleva la pérdida de regeneración epimórfica característica de los vertebrados de
sangre fría. A pesar de esta pérdida de capacidad regenerativa, las SCs residentes
en los tejidos de mamíferos adultos mantienen cierto recambio celular a través de
la producción de nuevas células y podrían, por lo tanto, ser consideradas como
contrapartidas naturales de las células implicadas en la regeneración previa a la
evolución.
Las células madre adultas son sensibles a su nicho ya que se comportan integrando
acciones de reguladores intrínsecos en respuesta a las señales que emanan tanto
de su microambiente más inmediato así como de la circulación. Se ha demostrado
que la inflamación es capaz de actuar sobre varios nichos de SCs, pero la
Resumen
177
observación tanto de efectos perjudiciales como beneficiosos mantiene en
controversia el papel preciso de la inflamación en el mantenimiento y la
regeneración de los tejidos. En el caso del sistema nervioso central, en particular,
existe evidencia experimental acumulada en la última década que indica que la
inflamación puede desempeñar un papel negativo en la neurogénesis de
mamíferos adultos. En cambio, en el cerebro de vertebrados no mamíferos existen
NSCs que son capaces de regenerar el tejido cerebral después de una lesión
traumática a través de la activación de programas moleculares inducidos por la
propia lesión y la señalización relacionada con inflamación.
El factor de necrosis tumoral alfa (TNF-α, del inglés Tumor Necrosis Factor alpha) y
progranulina (PGRN): TNF-α es una proteína caracterizada inicialmente como
citoquina pro-inflamatoria implicada en la respuesta inmune innata. Sin embargo,
en los últimos años se ha descrito que es una proteína multifuncional con múltiples
actividades en diferentes sistemas. En el cerebro adulto, TNF-α es producida por
microglía y macrofagos infiltrantes pero también por astrocitos y neuronas tras un
proceso de daño. Se expresa inicialmente en forma de proteína precursora
transmembrana de tipo II (tm-TNF-α o pro-TNF-α) la cual es cortada
proteolíticamente en la membrana celular por la metaloproteasa TACE (del inglés
TNF-α Converting Enzyme) para dar lugar a la forma soluble homotrimerica sTNF-α.
Ambos ligandos son biológicamente activos e interaccionan con dos receptores
trans-membrana glicosilados, TNF-Receptor 1 (TNFR1) and TNF-Receptor 2 (TNFR2).
La unión de TNF-alfa con TNFR1 generalmente induce apoptosis y citotoxicidad
mientras que la activación de TNFR2 se ha asociado con protección celular y
proliferación. TNFR1, a diferencia de TNFR2, presenta un dominio de muerte celular
(TRADD, del inglés TNF Receptor-Asociated Death Domain) el cual permite el
reclutamiento de caspasas y la consiguiente inducción de apoptosis. Además, la
unión del Factor Asociado a Receptor TNF 2 en ambos receptores (TRAF2, del
inglés TNF Receptor-Asociated Factor 2) resulta en la activación de RIP (del inglés
Resumen
178
Receptor Interacting Protein) y la inducción de las vías de señalización NFkB, p38,
JNK y ceramida/esfingomielinasa.
TNFR2 puede ser activado también por progranulina (PGRN), una glicoproteína de
secreción que, en el sistema nervioso central adulto, está presente en neuronas y
microglía. Además, la expresión de PGRN aumenta dramáticamente cuando la
microglía se activa por lesión. Una vez es secretada, PGRN puede ser cortada en
siete péptidos de granulina (GRN) y una paragranulina que contiene una mitad de
la granulina por metaloproteinasas tales como MMP-9, MMP-14 y ADAMTS-7, o las
proteasas de serina como elastasa y proteinasa 3. Curiosamente, tanto PGRN como
las GRNs constituyentes muestran actividad biológica; PGRN actúa como factor
anti-inflamatorio y antagoniza los efectos del TNF-α a través de TNFR2 mientras
que las GRN liberadas promueven inflamación.
Objetivos
En la mayoría de los tejidos, las células madre adultas parecen coexistir en dos
estados de activación, pero la transición entre estos estados, así como su
regulación, siguen siendo ampliamente desconocidas. Además, algunas células
madre adultas parecen responder a lesiones remotas de maneras que no se
entienden completamente. En este trabajo se propone la hipótesis de que las NSCs
adultas reaccionan a señales inflamatorias generadas en la periferia mediante la
modificación de su estado de activación dentro del ciclo de quiescencia de células
madre.
Los objetivos específicos propuestos para probar esta hipótesis son:
1.- Desarrollo de un protocolo basado en citometría de flujo para la identificación y
análisis de NSCs de la zona subependimaria así como de su progenie.
2.- Caracterización del ciclo celular quiescente en NSCs durante regeneración y en
respuesta a inflamación.
Resumen
179
3.- Análisis de los efectos de los mediadores inflamatorios TNF-α y progranulina y su
receptor común TNFR2 en NSCs.
Metodología
Cepas: se han utilizado ratones como modelo de experimentación para la
obtención y estudio de las NSCs de la SEZ. A lo largo del trabajo se han usado cepas
de varios fondos genéticos: C57Bl6 (silvestre o Wild-type), tnfrsf1a-/- (TNFR1 KO),
tnfrsf1b-/- (TNFR2 KO) y tnfrsf1a-/-;tnfrsf1b-/- (TNFR DKO).
Inmunohistoquímica y análisis in vivo: para realizar las detecciones de retención de
análogos de timidina en células de división lenta en el cerebro adulto (LRCs), los
ratones recibieron siete inyecciones intraperitoneales de CldU a una dosis de 50
μg/g de peso corporal del animal cada dos horas, y se sacrificaron 28 días después.
1h antes del sacrificio, se inyectó también intraperitonealmente una dosis de 10
mg/ml de IdU para la detección de células en proliferación. Posteriormente, los
ratones se perfundieron intracardíacamente con paraformaldehído 4% (PFA) en
tampón fosfato 0.1M, pH 7.4 (PB). Después de toda la noche en PFA, los cerebros
se lavaron con PB durante 2 horas y el tejido se procesó en un vibratomo. La
detección de CldU e IdU se realizó mediante inmunofluorescencia con anticuerpos
específicos. Para la detección de células GFAP+, EGFR+ o Ki67+ se usaron
anticuerpos primarios específicos y posteriormente se utilizaron los secundarios
fluorescentes correspondientes. Para el análisis de cadenas de DCX en
wholemount, el tejido fresco recién diseccionado se fijó en PFA 4% durante 24h.
Tras permeabilizar y bloquear con 10% FBS y 0.5% TX-100, las cadenas de
neuroblastos se analizaron mediante inmuhistoquímica con un anticuerpo
específico para DCX y sus correspondientes anticuerpos secundarios.
Citometría de flujo en muestras de SEZ: para el estudio de los distintos estados de
las NSCs y su progenie se ha puesto a punto un protocolo de detección por
citometría de flujo. Tras disección de la SEZ, el tejido se disgregó primero
Resumen
180
enzimáticamente con Tripsina/EDTA y después mecánicamente con pipeta de vidrio
pulida. El homogenado de tejido se filtró por 40 μm y se incubó con el kit de
eliminación de muerte celular (Miltenyi). Tras separación magnética con columnas
MS (Miltenyi), la fracción eluida se incubó con anticuerpos primarios marcados
para la detección de las distintas poblaciones residentes en la SEZ: CD45-BUV395,
CD31-BUV395, Ter119-BUV395, CD24-PerCP-Cy5.5 (BD), O4-biotin, Glast-APC, CD9-
Vio770 (Miltenyi) y EGF-Alexa488 (Invitrogen). Las células muertas se descartaron
por la incorporación de Dapi. Las muestras marcadas se analizaron en un equipo
LSR Fortessa (BD).
Separación magnética de células Lin– (MACS®): por otra parte se ha puesto a punto
la obtención de muestras de tejido enriquecidas en NSCs. Previamente, tras
disociar las muestras de SEZ y filtrarlas, las muestras se incubaron con anticuerpos
biotinilados contra CD45, CD31, Ter119, CD24 y O4. Posteriormente, las muestras se
incubaron con 30 μl de micropartículas magnéticas anti-biotina (Miltenyi). Las
muestras marcadas magnéticamente se cargaron en una columna MS previamente
equilibrada en un separador magnético OctoMACS®. La fracción eluida se recogió
como fracción Lin– y la fracción retenida Lin+ se eluyó una vez separada la columna
del imán.
Inducción de inflamación: para la activación de inflamación sistémica se inyectaron
intraperitonealmente 5mg/kg de LPS (Sigma-Aldrich). A distintos tiempos se
sacrificaron un grupo de animales para el análisis del proceso de inflamación
cerebral en tejido mediante la expresión de citoquinas pro-inflamatorias
(extracción de mRNA). Para el análisis in vivo de la neurogénesis se realizaron
técnicas inmunohistoquímicas y de análisis por citometría 24h después de la
inyección de LPS. Como control se utilizaron ratones pinchados con suero salino
0.9% y ratones no inyectados (naive). Además, ratones pinchados con suero salino
esteril y naive se analizaron a los 3 y 6 días por citometría para analizar el estado
NSCs quiescentes al resolverse la inflamación periférica.
Resumen
181
Paradigma de regeneración: para la estimulación de la regeneración de la SEZ se
inyectó el antimitótico temozolomida (TMZ) a 100 mg/kg/día en salino al 25% DMSO
o vehículo durante 3 días de manera consecutiva. A los 3 y a los 35 días se evaluó
los efectos de la lesión en SEZ y la reaparición de las distintas poblaciones mediante
citometría, formación de esferas primarias y la presencia de cadenas de
neuroblastos (DCX+) por inmunohistoquímica en wholemounts.
Cultivo y ensayos celulares en NSCs: ver metodología del grupo de investigación
detallada en Belenguer et al., 2016. A partir del establecimiento de cultivos
primarios de NSCs, se realizaron ensayos de proliferación y auto-renovación
mediante ensayo de neuroesferas, además de estudios de ciclo celular por tinción
con ioduro de propidio y de viabilidad celular mediante ensayo enzimático MTS o
detección de la actividad caspasa 3 por inmunocitoquímica. La expansión de NSCs
en cultivo se analizó mediante inmunocitoquímica para EGFR en células recién
divididas y mediante el análisis de la capacidad diferenciativa de clones aislados.
Durante los experimentos con cultivos de NSCs, se han utilizado distintos reactivos
como TNF-α recombinante murino (R&D) y anticuerpos agonistas específicos para
TNFR1 (R&D) y TNFR2 (Hycult Biotech). Además, para ensayos de rutas de
señalización se ha utilizado el inhibidor específico de la ruta de p38, SB203580.
Medios condicionados por microglía activada: se han utilizado células de la línea de
microglía para el acondicionamiento del medio de NSCs. Previamente, se
estimularon las células a un estado pro-inflamatorio M0 con 250 ng / ml de LPS. El
medio de NSCs condicionado por microglía se incubó con 2,5 μg / ml de anticuerpo
anti-TNF-α o con un anticuerpo no relacionado a la misma concentración para la
inmunodepleción específica de TNF-α mediante la unión a Dynabeads® magnéticas
acopladas a Protein G y separación usando un imán DYNAL® (Invitrogen). El medio
condicionado resultante se diluyó 1: 4 en medio NSCs fresco para el tratamiento de
cultivos de NSCs en un ensayo de neuroesferas.
Resumen
182
Evaluación de la dinámica de proliferación celular por dilución de marcadores
fluorescentes: homogenados celulares obtenidos a partir la SEZ se marcaron el
trazador fluorescente permeable DDAO-SE (Thermo Fischer, nº cat. C34553).
Después de 10 días, las neurosferas primarias resultantes fueron disociadas para
una segunda ronda de carga usando el trazador fluorescente Oregon Green 488
Carboxy- DFFDA-SE (Thermo Fischer, cat. C34555 ). Después de 3 días en cultivo, se
disociaron las neurosferas secundarias y se midió la intensidad de fluorescencia de
cada marcador celular en un citómetro de flujo FACS Fortessa (BD).
Medida de actividad mitocondrial: células individuales se tiñeron con la sonda
fluorescente MitoTrackerTM Orange CM-H2TMRos y la actividad mitocondrial se
determinó mediante análisis de la intensidad fluorescente por citometría de flujo
en FACS Fortessa (BD).
Análisis de expresión génica por ARN: se obtuvieron muestras de ARN a partir de
SEZ o de células aisladas utilizando el Kit de Tejido de ARN simple Maxwell® 16 LEV
(Promega, nº de cat. AS1280) y se convirtió a ADNc por RT-PCR utilizando el kit
PrimeScript™ RT-PCR Kit (Clontech, cat. no. RR014B). El análisis de expresión génica
se evaluó mediante PCR en tiempo real usando 5-10 ng de ADNc, sondas Taqman
específicas (Applied Biosystems) y el kit de amplificación Premix Ex TaqTM (Probe
qPCR) (Clontech, nº de cat. RR390A). La PCR en tiempo real se realizó en un
dispositivo Step One Plus (Applied Biosystems). El nivel de expresión de cada gen
se obtuvo por cuantificación relativa (2e-ΔΔCt) utilizando la expresión constitutiva
de genes Gapdh y 18S como controles endógenos.
Ensayos de activación de la vía de NFκB: se introdujo en las células un plásmido
reportero de luciferasa de la vía NFκB (5xkB-luc) junto con un reportero control de
luciferasa de Renila, mediante electroporación con un Nucleofector (II)® (Amaxa
Biosystems) y el Kit de Nucleofección de NSCs de ratón (Mouse NSC Nucleofector
Kit; Amaxa Biosystems). Para las determinaciones, tras la estimulación con el factor
TNF-alfa o agonistas específicos para cada receptor, se lisaron las células y se
Resumen
183
analizó la expresión del reportero mediante el Dual Luciferase Assay System Kit, de
Promega. Los extractos celulares se obtuvieron mediante lisis en Passive Lysis
Buffer (Promega). La actividad luciferasa se determinó mediante un equipo
Victor®3 (Perkin Elmer) en placas de 96 con 20 μl del lisado celular por pocillo, tras
añadir solución Stop & Glo (Promega) y usando la actividad luciferasa de Renila
como control positivo.
Determinaciones de la actividad de vías de señalización mediante western blot y
Milliplex®: se realizaron extracciones de proteínas de NSCs en cultivo crecidas
durante 1h utilizando el tampón de lisis MILLIPLEX MAP (Millipore, cat no. 43-040).
Por una parte se midió el estado fosforilado y la cantidad total de CREB, JNK, NF-
κB, p38, AKT, p70S6K y STAT3 con el kit de señalización de multiplex MILLIPLEX®
MAP 9-plex Phosphoprotein (Millipore, nº de cat .: 48- 680MAG) y el kit de
señalización MILLIPLEX® MAP 9-plex Multi-Path Magnetic Bead Signaling Total
(Millipore, nº de catálogo: 48-681MAG) siguiendo las instrucciones del fabricante.
Además se realizó una detección por western blot de la actividad de p38 utilizando
anticuerpos específicos de las formas totales y fosforiladas y anticuerpos
secundarios conjugados con HRP y el sistema de detección quimioluminiscente
(ECL; Amersham).
Resultados
Este trabajo ha abordado la posibilidad de que las células madre neurales adultas
del cerebro de roedor puedan responder positivamente a ciertas señales
inflamatorias, una reacción que parece ser oscurecida por los efectos perjudiciales
más dramáticos de las citoquinas inflamatorias en la neurogénesis.
Para ello, previamente hemos puesto a punto y validado una estrategia de
identificación de NSCs y su progenie en la SEZ y en el OB mediante la utilización de
marcadores de superficie. Tras una exclusión de marcadores CD45, CD31, Ter119,
CD24 y O4, las NSC, los TAPs y neuroblastos son identificados en base a GLAST, CD9
Resumen
184
y CD24. Hemos encontrado, en concordancia con un trabajo anterior, que la
elevada expresión de CD9 distingue las NSCs de astrocitos no neurogénicos dentro
de la población GLAST+. Por otro lado, contrariamente a lo que se había descrito,
observamos que las NSCs pueden mostrar un cierto nivel de expresión de CD24,
marcador que siempre se había asociado a neuroblastos. Proponemos que durante
la transición de NSCs hacia neuroblasto, las células comienzan a expresar CD24,
incrementando progresivamente su expresión en al convertirse en TAPs, llegando a
la máxima expresión en neurobñastos. Finalmente, la presencia de EGFR dentro de
la población de NSCs GLAST+/CD9+ permite diferenciar entre estados activados y
quiescentes.
La identificación de distintos estados quiescentes (qNSC1 y qNSC2) nos ha
permitido además determinar que el estado alerta de las qNSCs representa un
estado intermedio reversible entre latencia y activación. Además, este estado
muestra propiedades de pre-activación como son un mayor tamaño, la
predisposición a formar neuroesferas y el aumento de actividad mitocondrial
cuando son cultivadas in vitro. En este trabajo hemos observado que las NSCs
adquieren este estado incluso tras un pinchazo intraperitoneal de suero salino
estéril pero, a diferencia de una inflamación sistémica mediada por LPS o durante
un proceso de regeneración inducida por TMZ, donde las NSCs sufren además un
proceso de activación, en este caso las qNSC2 no llegan a activarse volviendo
progresivamente a su estado basal. Curiosamente, en respuesta a estos estímulos
que tienen en común la movilización del reservorio de qNSCs, ya sea para activarse
(inyecciones de TMZ y LPS) o simplemente para adquirir un fenotipo alerta
transitorio (inyección salina), se observa un aumento de los mediadores
inflamatorios TNF-α y PGRN en la SEZ sugiriendo que ambos podrían actuar como
factores de nicho regulando estos procesos.
Ensayos en cultivos de NSCs muestran que TNF-α, a través de su unión a TNFR1,
reduce la proliferación y viabilidad de las NSCs. Sin embargo, la unión tanto de TNF-
Resumen
185
α como de progranulina a TNFR2 modula la auto-renovación de las NSCs,
promoviendo divisiones simétricas y expandiendo una población de NSCs
multipotentes que mantienen propiedades de ciclo lento y una actividad
mitocondrial alta. Además, esta señalización de TNFR2 en NSCs está relacionada
con la vía de señalización p38 MAP quinasa, pero no con el control transcripcional
de Nf-κB, y dicha activación media la expansión de NSCs inducida por TNFR2. Sin
embargo, análisis de cultivos organotípicos de SEZ ex vivo, el cual hemos
descubierto que preserva la quiescencia de NSCs, revela que la estimulación TNFR2
promueve la transición de un estado qNSC1 latente a un estado qNSC2 de alerta.
En este trabajo hemos encontrado que las NSCs pueden detectar y responder a las
lesiones periféricas remotas y que la señalización TNFR2, en respuesta a las
citoquinas TNF-α y progranulina, participa en este proceso y media efectos
positivos de la inflamación en el comportamiento de las NSCs y la neurogenesis. El
primer hallazgo es congruente con datos recientes que indican que las células
madre adultas de diferentes sistemas pueden reaccionar a lesiones lejanas, lo que
sugiere un control homeostático de su actividad a nivel organizacional. El segundo
aumenta nuestra comprensión del papel de la inflamación en el proceso
neurogénico. Aunque la opinión más aceptada es que la inflamación aguda o
crónica juega un papel negativo en la neurogénesis, nuestros datos revelan efectos
beneficiosos concomitantes de citoquinas inflamatorias en al menos una fracción
de células madre neurales.
Además, hemos encontrado que la respuesta a señales periféricas o inflamación
aguda, implica la transición de NSC quiescentes de un estado inactivo a un estado
de pre-activación. Este estado de alarma qNSC2 no se conocía hasta hace un par de
años, y por lo tanto, se sabe muy poco sobre su comportamiento y regulación. En
este trabajo se proporcionan nuevos datos que revelan la implicación de la
señalización de TNFR2, muy probablemente a través de la transducción intracelular
de p38, en la regulación de estas células qNSC2, su comportamiento in vitro y su
Resumen
186
papel durante la regeneración y en respuesta a lesión. Estos efectos previamente
desconocidos añaden una pieza más a la incipiente investigación de la regulación
de la quiescencia / activación en NSCs.
Conclusiones
1. Hemos desarrollado y probado en diferentes escenarios, un nuevo panel de
citometría de flujo, basado exclusivamente en la detección de marcadores de
superficie, para la identificación de células madre neurales de la zona
subependimaria en diferentes estados de quiescencia (qNSC1 y qNSC2) y
proliferación, así como de su progenie más comprometida.
2. En la zona subependimaria adulta, señales inflamatorias tales como TNF-α y
progranulina promueven una salida del estado quiescente qNSC1 pero, como paso
previo a la activación completa, adquieren un estado transitorio de alerta qNSC2
que presenta mayor predisposición a la activación.
3. Daños periféricos leves, como una inyección intraperitoneal de solución salina
estéril, inducen la expresión de señales inflamatorias en la zona subependimaria
promoviendo la transición de un estado durmiente qNSC1 a un estado alerta
qNSC2, el cual regresa progresivamente al estado latente tras la resolución de la
neuroinflamación.
4. TNF-α, a través de TNFR1, produce efectos perjudiciales sobre la proliferación y
supervivencia de las células madre neurales, mientras que TNF-α y PGRN expanden
la población de células madre neurales multipotentes in vitro, manteniendo sus
propiedades, a través de su unión a TNFR2.
5. La señalización mediada por TNFR2, muy probablemente a través de la
transducción intracelular por p38, actúa sobre las células madre neurales en estado
qNSC1 promoviendo un cambio al estado alerta qNSC2.

Resumen
187
6. Las condiciones del cultivo in vitro promueven la activación forzosa de las qNSCs;
sin embargo, una pequeña fracción de células del cultivo, la cual puede expandirse
mediante la estimulación de TNFR2, conserva algunas características que recuerdan
al estado quiescente encontrado in vivo.


![Aula 06 Bactérias...outra e se agregam para formar corpos de frutificação de até 500 micrômetros de comprimento e contendo aproximadamente 100 000 células bacterianas.[56] Nesses](https://static.fdocument.org/doc/165x107/607c951f7c9836513576c59b/aula-06-bactrias-outra-e-se-agregam-para-formar-corpos-de-frutificao-de.jpg)

![Proteínas.ppt [Modo de compatibilidad] - Quimica plegamiento para formar la estructura terciaria no es inmediato, primero se agrupan o combinan conformaciones α-héliceyβ-plegadaconformandoloque](https://static.fdocument.org/doc/165x107/5b0244137f8b9a6a2e8f85e4/modo-de-compatibilidad-quimica-plegamiento-para-formar-la-estructura-terciaria.jpg)