Relating hygroscopicity and optical properties to chemical ...
20
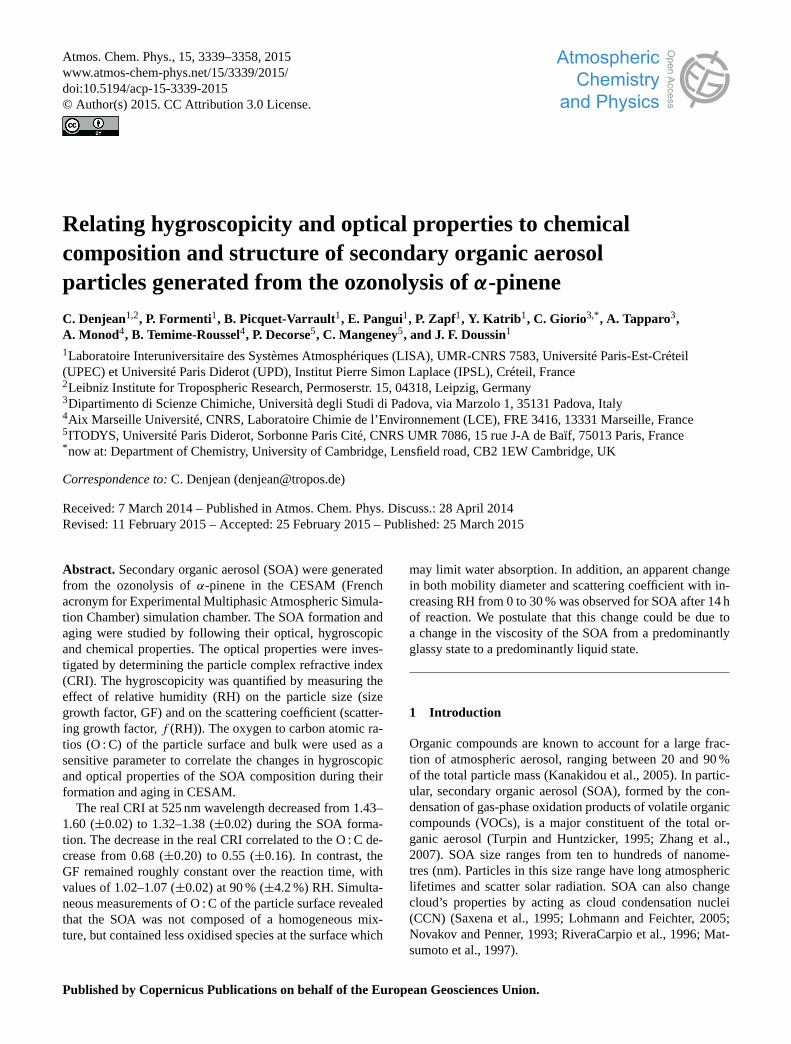
Atmos. Chem. Phys., 15, 3339–3358, 2015 www.atmos-chem-phys.net/15/3339/2015/ doi:10.5194/acp-15-3339-2015 © Author(s) 2015. CC Attribution 3.0 License. Relating hygroscopicity and optical properties to chemical composition and structure of secondary organic aerosol particles generated from the ozonolysis of α -pinene C. Denjean 1,2 , P. Formenti 1 , B. Picquet-Varrault 1 , E. Pangui 1 , P. Zapf 1 , Y. Katrib 1 , C. Giorio 3,* , A. Tapparo 3 , A. Monod 4 , B. Temime-Roussel 4 , P. Decorse 5 , C. Mangeney 5 , and J. F. Doussin 1 1 Laboratoire Interuniversitaire des Systèmes Atmosphériques (LISA), UMR-CNRS 7583, Université Paris-Est-Créteil (UPEC) et Université Paris Diderot (UPD), Institut Pierre Simon Laplace (IPSL), Créteil, France 2 Leibniz Institute for Tropospheric Research, Permoserstr. 15, 04318, Leipzig, Germany 3 Dipartimento di Scienze Chimiche, Università degli Studi di Padova, via Marzolo 1, 35131 Padova, Italy 4 Aix Marseille Université, CNRS, Laboratoire Chimie de l’Environnement (LCE), FRE 3416, 13331 Marseille, France 5 ITODYS, Université Paris Diderot, Sorbonne Paris Cité, CNRS UMR 7086, 15 rue J-A de Baïf, 75013 Paris, France * now at: Department of Chemistry, University of Cambridge, Lensfield road, CB2 1EW Cambridge, UK Correspondence to: C. Denjean ([email protected]) Received: 7 March 2014 – Published in Atmos. Chem. Phys. Discuss.: 28 April 2014 Revised: 11 February 2015 – Accepted: 25 February 2015 – Published: 25 March 2015 Abstract. Secondary organic aerosol (SOA) were generated from the ozonolysis of α-pinene in the CESAM (French acronym for Experimental Multiphasic Atmospheric Simula- tion Chamber) simulation chamber. The SOA formation and aging were studied by following their optical, hygroscopic and chemical properties. The optical properties were inves- tigated by determining the particle complex refractive index (CRI). The hygroscopicity was quantified by measuring the effect of relative humidity (RH) on the particle size (size growth factor, GF) and on the scattering coefficient (scatter- ing growth factor, f (RH)). The oxygen to carbon atomic ra- tios (O : C) of the particle surface and bulk were used as a sensitive parameter to correlate the changes in hygroscopic and optical properties of the SOA composition during their formation and aging in CESAM. The real CRI at 525 nm wavelength decreased from 1.43– 1.60 (±0.02) to 1.32–1.38 (±0.02) during the SOA forma- tion. The decrease in the real CRI correlated to the O : C de- crease from 0.68 (±0.20) to 0.55 (±0.16). In contrast, the GF remained roughly constant over the reaction time, with values of 1.02–1.07 (±0.02) at 90 % (±4.2 %) RH. Simulta- neous measurements of O : C of the particle surface revealed that the SOA was not composed of a homogeneous mix- ture, but contained less oxidised species at the surface which may limit water absorption. In addition, an apparent change in both mobility diameter and scattering coefficient with in- creasing RH from 0 to 30 % was observed for SOA after 14 h of reaction. We postulate that this change could be due to a change in the viscosity of the SOA from a predominantly glassy state to a predominantly liquid state. 1 Introduction Organic compounds are known to account for a large frac- tion of atmospheric aerosol, ranging between 20 and 90 % of the total particle mass (Kanakidou et al., 2005). In partic- ular, secondary organic aerosol (SOA), formed by the con- densation of gas-phase oxidation products of volatile organic compounds (VOCs), is a major constituent of the total or- ganic aerosol (Turpin and Huntzicker, 1995; Zhang et al., 2007). SOA size ranges from ten to hundreds of nanome- tres (nm). Particles in this size range have long atmospheric lifetimes and scatter solar radiation. SOA can also change cloud’s properties by acting as cloud condensation nuclei (CCN) (Saxena et al., 1995; Lohmann and Feichter, 2005; Novakov and Penner, 1993; RiveraCarpio et al., 1996; Mat- sumoto et al., 1997). Published by Copernicus Publications on behalf of the European Geosciences Union.
Transcript of Relating hygroscopicity and optical properties to chemical ...
Atmos. Chem. Phys., 15, 3339–3358, 2015
www.atmos-chem-phys.net/15/3339/2015/
doi:10.5194/acp-15-3339-2015
© Author(s) 2015. CC Attribution 3.0 License.
Relating hygroscopicity and optical properties to chemical
composition and structure of secondary organic aerosol
particles generated from the ozonolysis of α-pinene
C. Denjean1,2, P. Formenti1, B. Picquet-Varrault1, E. Pangui1, P. Zapf1, Y. Katrib1, C. Giorio3,*, A. Tapparo3,
A. Monod4, B. Temime-Roussel4, P. Decorse5, C. Mangeney5, and J. F. Doussin1
1Laboratoire Interuniversitaire des Systèmes Atmosphériques (LISA), UMR-CNRS 7583, Université Paris-Est-Créteil
(UPEC) et Université Paris Diderot (UPD), Institut Pierre Simon Laplace (IPSL), Créteil, France2Leibniz Institute for Tropospheric Research, Permoserstr. 15, 04318, Leipzig, Germany3Dipartimento di Scienze Chimiche, Università degli Studi di Padova, via Marzolo 1, 35131 Padova, Italy4Aix Marseille Université, CNRS, Laboratoire Chimie de l’Environnement (LCE), FRE 3416, 13331 Marseille, France5ITODYS, Université Paris Diderot, Sorbonne Paris Cité, CNRS UMR 7086, 15 rue J-A de Baïf, 75013 Paris, France*now at: Department of Chemistry, University of Cambridge, Lensfield road, CB2 1EW Cambridge, UK
Correspondence to: C. Denjean ([email protected])
Received: 7 March 2014 – Published in Atmos. Chem. Phys. Discuss.: 28 April 2014
Revised: 11 February 2015 – Accepted: 25 February 2015 – Published: 25 March 2015
Abstract. Secondary organic aerosol (SOA) were generated
from the ozonolysis of α-pinene in the CESAM (French
acronym for Experimental Multiphasic Atmospheric Simula-
tion Chamber) simulation chamber. The SOA formation and
aging were studied by following their optical, hygroscopic
and chemical properties. The optical properties were inves-
tigated by determining the particle complex refractive index
(CRI). The hygroscopicity was quantified by measuring the
effect of relative humidity (RH) on the particle size (size
growth factor, GF) and on the scattering coefficient (scatter-
ing growth factor, f (RH)). The oxygen to carbon atomic ra-
tios (O : C) of the particle surface and bulk were used as a
sensitive parameter to correlate the changes in hygroscopic
and optical properties of the SOA composition during their
formation and aging in CESAM.
The real CRI at 525 nm wavelength decreased from 1.43–
1.60 (±0.02) to 1.32–1.38 (±0.02) during the SOA forma-
tion. The decrease in the real CRI correlated to the O : C de-
crease from 0.68 (±0.20) to 0.55 (±0.16). In contrast, the
GF remained roughly constant over the reaction time, with
values of 1.02–1.07 (±0.02) at 90 % (±4.2 %) RH. Simulta-
neous measurements of O : C of the particle surface revealed
that the SOA was not composed of a homogeneous mix-
ture, but contained less oxidised species at the surface which
may limit water absorption. In addition, an apparent change
in both mobility diameter and scattering coefficient with in-
creasing RH from 0 to 30 % was observed for SOA after 14 h
of reaction. We postulate that this change could be due to
a change in the viscosity of the SOA from a predominantly
glassy state to a predominantly liquid state.
1 Introduction
Organic compounds are known to account for a large frac-
tion of atmospheric aerosol, ranging between 20 and 90 %
of the total particle mass (Kanakidou et al., 2005). In partic-
ular, secondary organic aerosol (SOA), formed by the con-
densation of gas-phase oxidation products of volatile organic
compounds (VOCs), is a major constituent of the total or-
ganic aerosol (Turpin and Huntzicker, 1995; Zhang et al.,
2007). SOA size ranges from ten to hundreds of nanome-
tres (nm). Particles in this size range have long atmospheric
lifetimes and scatter solar radiation. SOA can also change
cloud’s properties by acting as cloud condensation nuclei
(CCN) (Saxena et al., 1995; Lohmann and Feichter, 2005;
Novakov and Penner, 1993; RiveraCarpio et al., 1996; Mat-
sumoto et al., 1997).
Published by Copernicus Publications on behalf of the European Geosciences Union.
3340 C. Denjean et al.: Relating hygroscopicity and optical properties
There are large uncertainties in estimating the impact of
SOA on climate due to their complexity and the limited range
of measurements available (Kanakidou et al., 2005). SOA
precursors produce a large number of oxidation products
(Goldstein and Galbally, 2009), resulting in many possible
chemical reaction pathways (de Gouw et al., 2005; Hallquist
et al., 2009). In addition, during their lifetime in the atmo-
sphere, SOA may undergo several physical and chemical ag-
ing processes altering their chemical composition (Kalberer
et al., 2004; Baltensperger, 2005; Yasmeen et al., 2012) and
size distribution (Andreae, 2009). As a result, atmospheric
SOA contains many organic compounds with a large vari-
ety of structures, chain lengths, functionalities and degrees
of oxidation (Kroll and Seinfeld, 2008; Jimenez et al., 2009).
Therefore, SOA possess a wide range of hygroscopic and op-
tical properties (Lambe et al., 2013; Suda et al., 2012).
In global climate models, the direct radiative effect of SOA
is currently described by adopting a constant complex refrac-
tive index (CRI) and a single size growth factor (GF). De-
pending on the model, the adopted real part of the CRI at
visible wavelengths ranges from 1.45 to 1.60 (Kinne et al.,
2003; Pere et al., 2011; Zaveri et al., 2010). Some models
assume that SOA weakly absorbs solar radiation, and set the
imaginary part of the CRI near 0.006, while others ignore
the absorption by SOA. Concerning hygroscopic properties,
a size GF of SOA derived from limited available data is used
(O’Donnell et al., 2011; Hoyle et al., 2009). However, field
measurements shows that the hygroscopic and optical prop-
erties of SOA are not static and depend on their origin and
transport in the atmosphere (Duplissy et al., 2010; Jimenez et
al., 2009; Chang et al., 2010; Dinar et al., 2008). As a conse-
quence, laboratory investigations have started to explore the
change of SOA properties during their lifetime. The ozonol-
ysis of α-pinene ozonolysis is one of the most well-studied
SOA systems (α-pinene–O3 SOA), as α-pinene is a signifi-
cant biogenic VOC in many regions, and its ozonolysis plays
an important role in SOA formation (Hallquist et al., 2009;
Griffin et al., 1999; Yu et al., 1999; Kavouras et al., 1998,
1999). α-Pinene–O3 SOA is also generally considered as a
model for many biogenic VOCs containing an endocyclic
double bond (Guenther et al., 1995). Saathoff et al. (2003)
conducted experiments of α-pinene–O3 SOA in a simulation
chamber and observed an increase of the GF at 90 % rela-
tive humidity (RH) from 1.080 to 1.106. Cocker et al. (2001)
also reported an increase of the GF at 85 % RH from 1.065
to 1.11 within 6 h. In contrast, Warren et al. (2009) and Qi et
al. (2010) reported a constant GF at 90 % RH for α-pinene–
O3 SOA over 6 h of reaction. Finally, an increase of the real
CRI from 1.39 to 1.52 at λ= 532 nm during the formation of
the α-pinene–O3 SOA was reported by Kim et al. (2013). To
date, none of the previous studies have simultaneously deter-
mined the hygroscopic and optical properties, and their evo-
lution with the particle chemical composition during SOA
formation and ageing.
To accurately quantify the SOA impacts on climate, it is
critical to determine the hygroscopic behaviour of both the
size distribution and optical properties as well as the depen-
dence of these properties on the chemical composition. At-
mospheric simulation chambers are powerful tools to study
the physical, chemical, optical and hygroscopic properties of
SOA and follow their changes along their life cycle by simu-
lating their formation and aging due to oxidation and photol-
ysis in the atmosphere (Meyer et al., 2008; Henry and Don-
ahue, 2012; Tritscher et al., 2011). In this work, we take ad-
vantage of the long aerosol lifetime in the CESAM chamber
(French acronym for Experimental Multiphasic Atmospheric
Simulation Chamber; Wang et al., 2011) to set up formation
and aging experiments of α-pinene–O3 SOA in order to char-
acterise the evolution of both the SOA optical properties and
hygroscopicity. The objective is to examine the evolution of
these physical properties and to relate them to the aerosol
chemical composition.
2 Methods
Measurements have been conducted in the humidity-
controlled simulation chamber CESAM (Wang et al., 2011),
which permits the study of the formation and aging of SOA
over long periods of time, and under various relevant atmo-
spheric conditions (temperature, relative humidity, pressure,
gas-phase concentration, etc.).
Experiments were conducted to simultaneously measure
different parameters:
– CRI at λ=525 nm, a specific wavelength in the mid-
visible; the complex refractive index (CRI, m= n− ik)
is an important parameter to link the physical and chem-
ical properties of the SOA and its ability to interact with
radiation, allowing a description of the scattering and
absorbing characteristics of SOA.
– GF, size growth factor, the ratio of the particle diameter
at a given RH to the particle diameter at low RH, for
one selected size of particles; this parameter is used to
characterise the hygroscopic properties of the SOA and
thus it is an indicator of its ability to act as CCN.
– f (RH), scattering growth factor, the ratio of the scatter-
ing coefficient (σscat) at high RH to the σscat at low RH,
for the entire size distribution; this parameter allows the
study of the effect of water absorption on the scattering
properties of SOA.
– O : C, the oxygen-to-carbon ratio, for both the bulk and
the surface composition of the SOA; it is well known
that particle composition, in particular that of the sur-
face, strongly influences the water uptake ability of the
particle and its CCN potential (McFiggans et al., 2006;
Dusek et al., 2006; Hatch et al., 2008; Moussa et al.,
2009; McIntire et al., 2010; Semeniuk et al., 2007;
Atmos. Chem. Phys., 15, 3339–3358, 2015 www.atmos-chem-phys.net/15/3339/2015/
C. Denjean et al.: Relating hygroscopicity and optical properties 3341
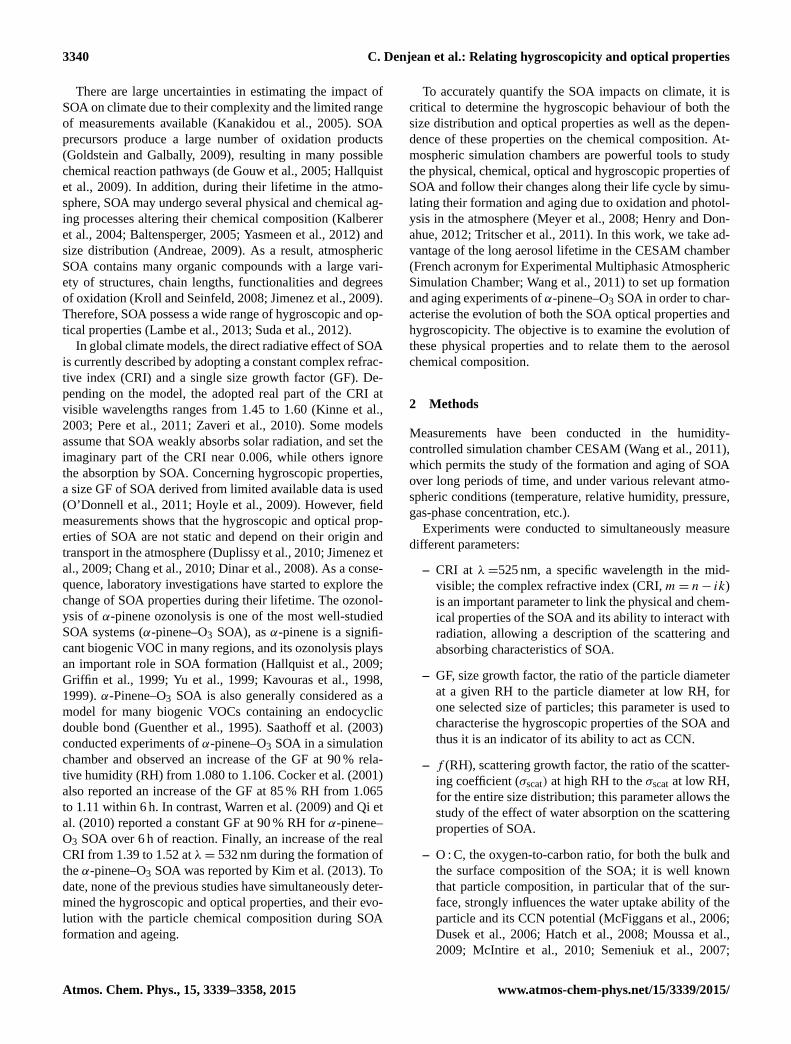
Figure 1. Experimental set-up of the CESAM chamber used to mea-
sure aerosol chemical, hygroscopic and optical properties.
Lamb et al., 2011; Wong et al., 2011; Mei et al., 2013;
Rickards et al., 2013). To encompass the difficulty of
representing the full molecular composition, the O : C of
SOA has been included in global climate models to pro-
vide a description of the aerosol aging (Tost and Pringle,
2012). Furthermore, a number of recent studies have
reported a positive correlation between hygroscopicity
and bulk O : C for both laboratory and ambient SOA
(Massoli et al., 2010; Jimenez et al., 2009; Chang et al.,
2010; Duplissy et al., 2011).
2.1 Simulation chamber and associated instruments
CESAM is a 4.2 m3 cylindrical stainless steel chamber which
has been designed to investigate both atmospheric gas-
phase and aerosol-phase chemistry. As described by Wang
et al. (2011), the wall properties and ventilation system guar-
antee a lifetime for long sub-micron particles and enable the
study of aerosol aging for more than 20 h. Water vapour can
be directly injected in CESAM and thus the RH of the reac-
tion mixture can be varied in situ from 0 to 100 %.
The basic experimental set-up and a schematic view of the
CESAM chamber are shown in Fig. 1. Temperature and rel-
ative humidity in the chamber are monitored using a Vaisala
transmitter equipped with a capacitive thin-film HUMICAP
sensor. The sensor was calibrated prior to each experiment.
The accuracy of RH was ±1.9 up to 90 % RH and the tem-
perature accuracy was ±0.1 ◦C at 20 ◦C.
α-Pinene, ozone and their reaction products were contin-
uously monitored by a Fourier transform infrared spectrom-
eter (FTIR) from Bruker GmbH (Ettlingen, Germany) cou-
pled to a multi-reflection cell allowing an optical path of
192 m. Additionally, ozone was monitored by a commercial
HORIBA APOA 370 instrument (Kyoto, Japan) with a de-
tection limit of 0.5 ppb and a precision of 0.1 ppb.
The particle number size distribution was measured using
a scanning mobility particle sizer (SMPS including a differ-
ential mobility analyzer (DMA) 3080 and condensation par-
ticle counter (CPC) 3010, TSI). The SMPS was operated at
flow rates 3/0.3 L min−1 (sheath flow/aerosol sample flow).
The aerosol flow was diluted with filtered air before enter-
ing the CPC, in order to maintain the nominal flow rate at
1 L min−1 in the CPC. The dilution air flow was sucked from
the simulation chamber to avoid any pressure gradient in
the SMPS. The SMPS scanning time was 2 min 15 s in to-
tal. The resulting measured size distribution ranged from 14
to 505 nm. The size calibration of the SMPS was performed
using monodisperse PolyStyrene Latex spheres (PSL, Duke
Scientific). PSL spheres, with diameters ranging from 100
to 500 nm, were nebulised with a constant output atomiser
(TSI model 3076). The measured diameters were found to
be larger than the PSL certified diameters (by about 10 %
for 100 nm PSL spheres); therefore, a correction factor was
applied. Size distributions were corrected by the SMPS soft-
ware for both the loss by diffusion of particles in the SMPS
tubing, the contribution of multi-charged particles and the di-
lution of the aerosol flow before entering the CPC.
2.2 Optical properties measurements
The aerosol scattering coefficient (σscat) was measured us-
ing an integrating nephelometer (model M9003, Ecotech).
The nephelometer operates at 525 nm wavelength and mea-
sures light scattered from particles at angles between 10 and
170◦. It also measures temperature at both the sample inlet
and within its cell with an accuracy of ±0.6 ◦C, and the RH
within its cell with an accuracy of ±3 %. Prior to each se-
ries of experiments, the nephelometer was calibrated using
particle-free air and CO2.
The particle light absorption coefficient (σabs) was deter-
mined by means of an aethalometer (model AE31, Magee
Scientific) operated with several light sources at seven wave-
lengths, covering the near-ultraviolet to the near-infrared
wavelength range (λ= 370, 470, 520, 590, 660, 880 and
950 nm). The aethalometer measures the attenuation of the
transmitted light through a quartz fibre filter with increas-
ing particle loading. This measurement can suffer from arte-
facts associated with reactions with oxidants occurring on
particles deposited on the surface of the filter and desorp-
tion of gaseous compounds from the filter (Weintgartner et
al., 2003). Thus, a charcoal denuder was installed upstream
of the aethalometer to remove ozone and VOCs. It has also
been observed that the aethalometer can suffer from biases at
high RH as a result of the filter taking up water and scattering
more light compared to the reference measurement (Cappa
et al., 2008; Arnott et al., 2005). Therefore, the aethalometer
was not used when the chamber RH was higher than 1 %.
The spectral attenuation coefficient (σattn) resulting from
the attenuation of light through the sampled aerosol on the
filter was obtained using Eq. (1):
σattn(λ,m)=A
Q
1attn
1t, (1)
www.atmos-chem-phys.net/15/3339/2015/ Atmos. Chem. Phys., 15, 3339–3358, 2015
3342 C. Denjean et al.: Relating hygroscopicity and optical properties
where A is the spot area, Q is the volumetric flow rate
and 1attn is the change in light attenuation during the time
interval 1t . It is well known that σattn obtained with an
aethalometer is higher than true σabs (Arnott et al., 2005;
Bond et al., 1999; Bond and Bergstrom, 2006; Cappa et al.,
2008; Collaud Coen et al., 2010; Weingartner et al., 2003).
Various systematic errors need to be corrected. The detailed
description of the method used to correct σattn is shown in the
Supplement.
The details of the calculations of CRI of SOA under dry
conditions (RH < 1 %) were given in Denjean et al. (2014).
The CRI was determined by optical closure experiments in-
volving scattering and absorption coefficients (σscat and σabs,
respectively) measured at 525 nm and the number size dis-
tribution. Briefly, σscat and σabs were calculated according to
Eq. (2)
σscat, abs(λ,m)=
∫Qscat, abs(Dp,λ,m)
π
4D2
p (2)(dN
dlogDp
)dlogDp,
where Dp is the geometrical particle diameter, dNdlogDp
is the number size distribution and Qscat, abs(Dp,λ,m)
represent both the scattering and absorption efficiencies.
Qscat,abs(Dp,λ,m) were calculated using Mie scattering cal-
culations described by Bohren and Huffman (1983).
The values of σscat and σabs of SOA were simultaneously
measured and compared with those calculated based on the
Mie theory. To allow this comparison, all measured σscat
were corrected from the sample temperature and pressure
and from the angular truncation error examined for the neph-
elometer. The best-guess CRI was determined by minimising
the difference between measured σscat and σabs and those ob-
tained using Mie calculations.
2.3 Hygroscopic properties measurements
The hygroscopic properties of SOA were investigated using
two complementary approaches as described in detail in Den-
jean et al. (2014). Briefly, (1) a hygroscopic tandem differen-
tial mobility analyzer (H-TDMA) was used to measure the
RH dependency of the particles diameter for single size par-
ticles and (2) in situ experiments within the CESAM cham-
ber allowed for the measurement of σscat changes after water
uptake for polydisperse aerosol size distribution.
The hygroscopic behaviour of monodisperse SOA was
measured with a H-TDMA. The instrument is composed of
a DMA (TSI, 3080) that selects an initial mobility diame-
ter under dry conditions Dp,m(RHdry), an aerosol humidifier
with a controlled higher RH and a DMA (TSI, 3080) coupled
to a CPC (TSI, 3010) to measure the wet size distribution
over mobility diameter Dp,m (RH). The total sampling line
used for H-TDMA measurements ranged between 10 and
20 cm. Both DMAs of the H-TDMA were calibrated using
monodisperse PSL particles (Duke Scientific) ranging from
100 to 500 nm. A size shift was observed for both DMAs.
The particles residence time for humidification is 15 s and
corresponds to the residence time in the aerosol humidifier
plus the transit time in the second DMA. In this study, the H-
TDMA was typically operated at a constant high RH (±1 %)
of 90 %. The hygroscopic size growth factor (GF) describes
the relative increase in the geometric diameter of particles
due to water uptake at a specific RH according to Eq. (3):
GF(RH)=Dp,m(RH)
Dp,m(40 % RH). (3)
Due to possible changes in SOA viscosities (i.e. Sect. 4.2.),
RH= 40 % was considered dry in this study. GF at 40 %
RH was measured at the beginning and the end of each se-
ries of H-TDMA measurements. Dry and humidified mobil-
ity diameters were obtained by assuming that the size distri-
butions exhibited a log-normal profile. H-TDMA measure-
ments were validated by measuring the humidogram of lab-
oratory generated ammonium sulfate particles. The GF was
found to agree with values calculated using the Köhler model
(Denjean et al., 2014).
In addition to H-TDMA measurements, the hygroscopic
behaviour of polydisperse SOA was measured by exposing
the particles in situ to increasing humidity in the CESAM
chamber. Water vapour produced from a small glass vessel
filled with ultrapure water (18.2 M�, ELGA Maxima) was
injected into the chamber and mixed therein by the chamber’s
stainless steel fan. The RH in the chamber increased linearly
from 0 to 100 % within approximately 1 h. The change in
σscat due to hygroscopic growth of the overall particle size
distribution was monitored by the nephelometer. The scatter-
ing growth factor, f (RH) is the ratio between the scattering
coefficient at a specific RH, σscat(RH), and the dry scattering
coefficient, σscat(dry) (Eq. 4):
f (RH)=σscat(RH)
σscat(40 % RH). (4)
During humidification, RH was monitored within the
chamber and at the inlet of the nephelometer. Using this ap-
proach, the residence time for particle humidification was a
few minutes thus significantly longer than during H-TDMA
measurements. It has been previously shown (Denjean et al.,
2014) that the two approaches of hygroscopicity measure-
ments could lead to different results, giving information on
water transfer dynamics, possible particles reorganisation or
phase transfer equilibrium.
2.4 Aerosol sampling and chemical composition
analysis
A high-resolution time-of-flight aerosol mass spectrometer
(AMS, Aerodyne) (DeCarlo et al., 2006) was used to deter-
mine the bulk composition of organic aerosols (Aiken et al.,
Atmos. Chem. Phys., 15, 3339–3358, 2015 www.atmos-chem-phys.net/15/3339/2015/
C. Denjean et al.: Relating hygroscopicity and optical properties 3343
2007, 2008). The instrument was used under standard condi-
tions (vaporiser at 600◦ C and electron ionisation at 70 eV).
Standard AMS calibration procedures using NH4NO3 parti-
cles were performed throughout the campaign and included
ionisation efficiency (IE) calibration using the brute force
single particle (BFSP) method at 350 nm particle mobility di-
ameter as well as size calibration using DMA-selected dried
particle sizes over the range of interest, i.e. 100–350 nm. Sin-
gle ion calibration as well as baseline and threshold were
analysed prior each experiment.
The AMS was operated during three experiments. The
instrument was switched between two modalities: a single-
reflectron configuration (V-mode) which offers a higher sen-
sitivity and lower resolving power (up to∼ 2100 atm/z 200)
and a double-reflectron configuration (W-mode) which pro-
vides a higher resolving power (up to ∼ 4300 at m/z 200)
but lower sensitivity (De Carlo et al., 2006). Data were taken
with a time resolution of 8 min. In V-mode, data were col-
lected in the mass spectrum (MS) mode for 5 min, for aerosol
quantification, and in the particle time-of-flight (PToF) mode
for 1 min for size distribution measurement (De Carlo et al.,
2006, Canagaratna et al., 2007). Only MS data were recorded
in the W-mode (2 min).
The AMS data were analysed using Squirrel (ToF-AMS
Analysis 1.51B) and Pika (ToF-AMS high-resolution (HR)
Analysis 1.10B) packages for the software Igor Pro 6.21
(Wavemetrics, Inc., Portland, OR, USA). Default collection
efficiencies (CE) and relative ionisation efficiencies (RIE)
were used for quantification of SOA. Air interferences were
removed by adjusting the fragmentation table (Aiken et al.,
2008; Allan et al., 2004). High-resolution analyses (De Carlo
et al., 2006) were performed on V-mode data by integrating
each CxHyOzion in the mass range 12–180m/z, while W-
mode data were used only to check for possible interferences.
Elemental ratios (O : C and H : C) were calculated according
to the procedure described by Aiken et al. (2007, 2008). Mea-
surement uncertainties were estimated to be±30 %, as deter-
mined by Aiken et al. (2008).
Further chemical analyses were performed by collect-
ing SOA on polytetrafluoroethylene (PTFE) filters (Zefluor,
47 mm diameter, 2 µm pore size, Pall Life Sciences), which
were cut to the size of the collector using ceramic scissors.
A stainless steel support was used for sampling and con-
centrating the particles in a small filter area (0.9 mm2). An
active charcoal denuder was installed upstream of the filter
to remove ozone and VOCs. Before sampling, filters were
extracted 3 times for 10 min with dichloromethane (99.8 %,
HPLC grade) in an ultrasonic bath and baked for 5 h at
250◦ C. Filter samplings were performed in the chamber at
different reaction times from 30 min to 17 h at a nominal
flow rate of 2 L min−1 for a sampling time varying between
30 min to 2 h, depending on the total SOA volume concen-
tration.
X-ray photoelectron spectrometry (XPS) was used to
quantify the O : C of the SOA surface to a depth less
than 10 nm. Measurements were performed on a VG ES-
CALAB 250 instrument using monochromatic Al Kα radia-
tion (1486.6 eV). The X-ray spot size was 500 µm. The anal-
ysis chamber of the instrument was maintained at pressures
ranging between 10−8 and 10−11 mbar. Survey spectra of
SOA were measured over an 1100 eV range at a resolution of
1 eV per step and 100 eV pass energy (Fig. S1a in the Supple-
ment). All peaks were referred to the C1s binding energy at
285.0 eV. The high-resolution C1s spectrum showed the pres-
ence of C, O and F. The deconvolution of the C1s signal was
performed in peaks corresponding to the –CO2 (indicative of
carboxylic acids, peroxides), C–O (alcohols, aldehydes, car-
boxylic acids, peroxides, ethers), C–C/C–H (aliphatic func-
tional groups) and the C–F bonds of the PTFE filter in order
to optimise the fit (Fig. S1b). Quantification of the O : C was
performed using the integrated peak areas of O1s spectra, the
peaks area of the –CO2, C–O and C–C/C–H from the C1s
spectra and the manufacturer’s sensitivity factors.
To exclude biases in the comparison of the surface and
bulk O : C ratios by different experimental methods, a control
experiment was performed on pinic acid which is a pure ho-
mogeneous compound containing multiple carbon–oxygen
bonds and which is representative of α-pinene–O3 SOA (the-
oretical O : C value of 0.44). 0.003 M pinic acid solution
(Santai Labs, purity by 1HNMR of > 95 %) was atomised us-
ing a constant output atomiser (TSI, model 3076) and then
passed through a Nafion tube, which reduced the RH below
35 %. Particles were analysed with the AMS and simultane-
ously collected on PTFE filters for XPS analysis. The O : C
values obtained experimentally from this single measure-
ment by AMS and XPS were 0.34 (±0.10) and 0.37 (±0.08),
respectively, as expected for particles of homogeneous com-
position. In addition, both methods reproduced the expected
molecular O : C of pinic acid within the uncertainty range.
This control experiment sets the reference case for the joint
use of XPS and AMS to resolve compositional differences in
non-homogenous SOA.
2.5 Experimental protocol
Experiments were carried out without any seed particles
or OH radical scavenger. Prior to each experiment, the
CESAM chamber was evacuated overnight to typically
4× 10⁻⁴ mbar. The chamber was then filled to atmospheric
pressure with a mixture of 200 mbar of oxygen (Air Liquide,
Alphagaz class 1, purity 99.9 %) and 800 mbar of nitrogen
produced from the evaporation of a pressurised liquid nitro-
gen tank (Messer, purity > 99.995 %, H2O < 5 ppm). Table 1
shows the experimental conditions of this study. Ozone was
generated by a Corona discharge in pure O2 using a com-
mercial dielectric ozone generator (MBT 802N, Messtech-
nik GmbH, Stahnsdorf, Germany). After ozone concentra-
tion stabilisation around 250 ppb in the chamber, approxi-
mately 200 ppb of α-pinene was introduced. This injection
was performed by flushing into the chamber (in an O2 flow)
www.atmos-chem-phys.net/15/3339/2015/ Atmos. Chem. Phys., 15, 3339–3358, 2015
3344 C. Denjean et al.: Relating hygroscopicity and optical properties
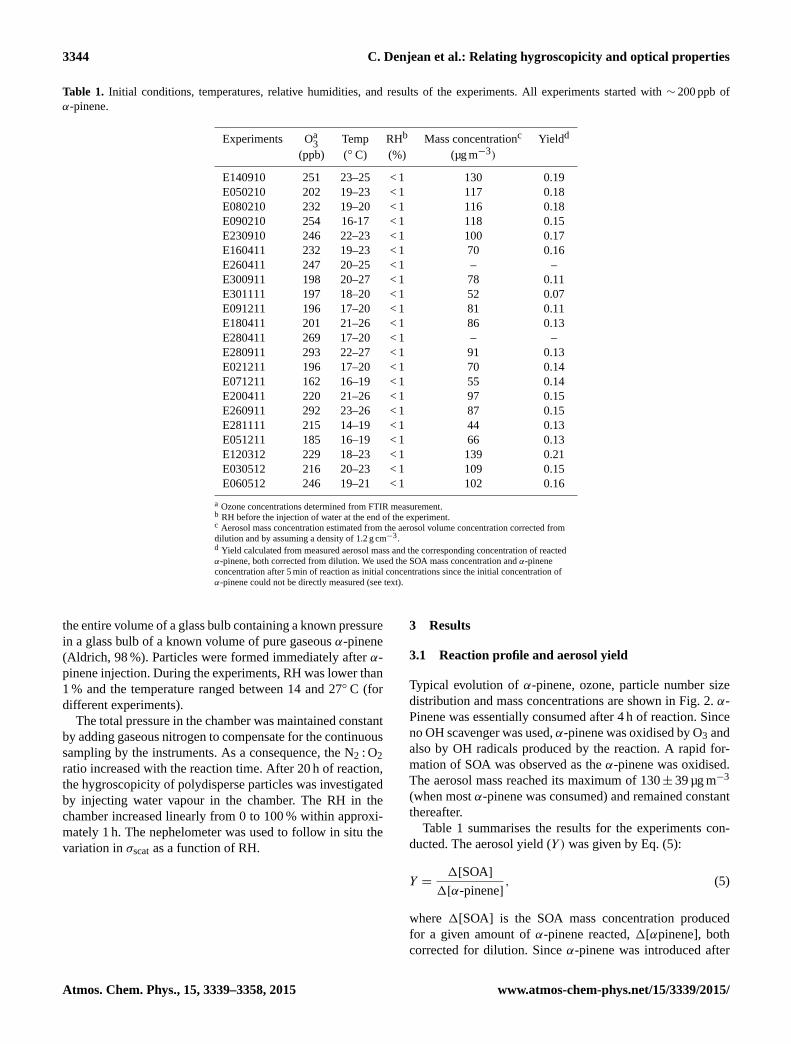
Table 1. Initial conditions, temperatures, relative humidities, and results of the experiments. All experiments started with ∼ 200 ppb of
α-pinene.
Experiments Oa3
Temp RHb Mass concentrationc Yieldd
(ppb) (◦ C) (%) (µg m−3)
E140910 251 23–25 < 1 130 0.19
E050210 202 19–23 < 1 117 0.18
E080210 232 19–20 < 1 116 0.18
E090210 254 16-17 < 1 118 0.15
E230910 246 22–23 < 1 100 0.17
E160411 232 19–23 < 1 70 0.16
E260411 247 20–25 < 1 – –
E300911 198 20–27 < 1 78 0.11
E301111 197 18–20 < 1 52 0.07
E091211 196 17–20 < 1 81 0.11
E180411 201 21–26 < 1 86 0.13
E280411 269 17–20 < 1 – –
E280911 293 22–27 < 1 91 0.13
E021211 196 17–20 < 1 70 0.14
E071211 162 16–19 < 1 55 0.14
E200411 220 21–26 < 1 97 0.15
E260911 292 23–26 < 1 87 0.15
E281111 215 14–19 < 1 44 0.13
E051211 185 16–19 < 1 66 0.13
E120312 229 18–23 < 1 139 0.21
E030512 216 20–23 < 1 109 0.15
E060512 246 19–21 < 1 102 0.16
a Ozone concentrations determined from FTIR measurement.b RH before the injection of water at the end of the experiment.c Aerosol mass concentration estimated from the aerosol volume concentration corrected from
dilution and by assuming a density of 1.2 g cm−3.d Yield calculated from measured aerosol mass and the corresponding concentration of reacted
α-pinene, both corrected from dilution. We used the SOA mass concentration and α-pinene
concentration after 5 min of reaction as initial concentrations since the initial concentration of
α-pinene could not be directly measured (see text).
the entire volume of a glass bulb containing a known pressure
in a glass bulb of a known volume of pure gaseous α-pinene
(Aldrich, 98 %). Particles were formed immediately after α-
pinene injection. During the experiments, RH was lower than
1 % and the temperature ranged between 14 and 27◦ C (for
different experiments).
The total pressure in the chamber was maintained constant
by adding gaseous nitrogen to compensate for the continuous
sampling by the instruments. As a consequence, the N2 : O2
ratio increased with the reaction time. After 20 h of reaction,
the hygroscopicity of polydisperse particles was investigated
by injecting water vapour in the chamber. The RH in the
chamber increased linearly from 0 to 100 % within approxi-
mately 1 h. The nephelometer was used to follow in situ the
variation in σscat as a function of RH.
3 Results
3.1 Reaction profile and aerosol yield
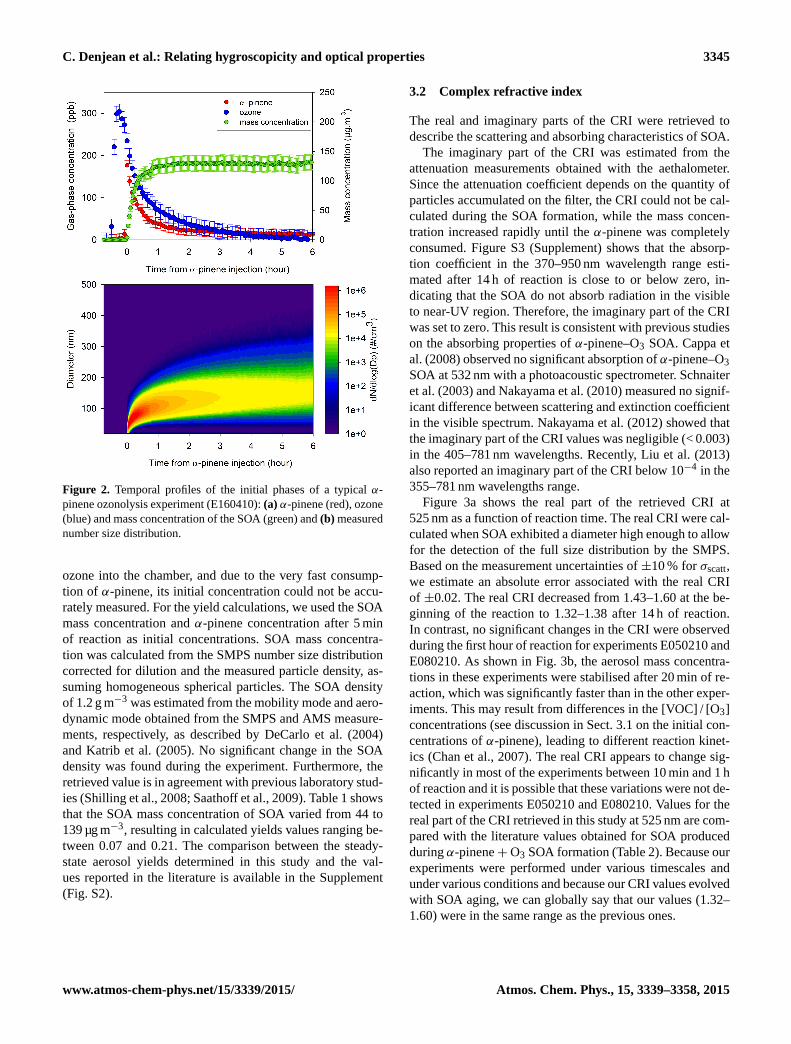
Typical evolution of α-pinene, ozone, particle number size
distribution and mass concentrations are shown in Fig. 2. α-
Pinene was essentially consumed after 4 h of reaction. Since
no OH scavenger was used, α-pinene was oxidised by O3 and
also by OH radicals produced by the reaction. A rapid for-
mation of SOA was observed as the α-pinene was oxidised.
The aerosol mass reached its maximum of 130± 39 µg m−3
(when most α-pinene was consumed) and remained constant
thereafter.
Table 1 summarises the results for the experiments con-
ducted. The aerosol yield (Y ) was given by Eq. (5):
Y =1[SOA]
1[α-pinene], (5)
where 1[SOA] is the SOA mass concentration produced
for a given amount of α-pinene reacted, 1[αpinene], both
corrected for dilution. Since α-pinene was introduced after
Atmos. Chem. Phys., 15, 3339–3358, 2015 www.atmos-chem-phys.net/15/3339/2015/
C. Denjean et al.: Relating hygroscopicity and optical properties 3345
Figure 2. Temporal profiles of the initial phases of a typical α-
pinene ozonolysis experiment (E160410): (a) α-pinene (red), ozone
(blue) and mass concentration of the SOA (green) and (b) measured
number size distribution.
ozone into the chamber, and due to the very fast consump-
tion of α-pinene, its initial concentration could not be accu-
rately measured. For the yield calculations, we used the SOA
mass concentration and α-pinene concentration after 5 min
of reaction as initial concentrations. SOA mass concentra-
tion was calculated from the SMPS number size distribution
corrected for dilution and the measured particle density, as-
suming homogeneous spherical particles. The SOA density
of 1.2 g m−3 was estimated from the mobility mode and aero-
dynamic mode obtained from the SMPS and AMS measure-
ments, respectively, as described by DeCarlo et al. (2004)
and Katrib et al. (2005). No significant change in the SOA
density was found during the experiment. Furthermore, the
retrieved value is in agreement with previous laboratory stud-
ies (Shilling et al., 2008; Saathoff et al., 2009). Table 1 shows
that the SOA mass concentration of SOA varied from 44 to
139 µg m−3, resulting in calculated yields values ranging be-
tween 0.07 and 0.21. The comparison between the steady-
state aerosol yields determined in this study and the val-
ues reported in the literature is available in the Supplement
(Fig. S2).
3.2 Complex refractive index
The real and imaginary parts of the CRI were retrieved to
describe the scattering and absorbing characteristics of SOA.
The imaginary part of the CRI was estimated from the
attenuation measurements obtained with the aethalometer.
Since the attenuation coefficient depends on the quantity of
particles accumulated on the filter, the CRI could not be cal-
culated during the SOA formation, while the mass concen-
tration increased rapidly until the α-pinene was completely
consumed. Figure S3 (Supplement) shows that the absorp-
tion coefficient in the 370–950 nm wavelength range esti-
mated after 14 h of reaction is close to or below zero, in-
dicating that the SOA do not absorb radiation in the visible
to near-UV region. Therefore, the imaginary part of the CRI
was set to zero. This result is consistent with previous studies
on the absorbing properties of α-pinene–O3 SOA. Cappa et
al. (2008) observed no significant absorption of α-pinene–O3
SOA at 532 nm with a photoacoustic spectrometer. Schnaiter
et al. (2003) and Nakayama et al. (2010) measured no signif-
icant difference between scattering and extinction coefficient
in the visible spectrum. Nakayama et al. (2012) showed that
the imaginary part of the CRI values was negligible (< 0.003)
in the 405–781 nm wavelengths. Recently, Liu et al. (2013)
also reported an imaginary part of the CRI below 10−4 in the
355–781 nm wavelengths range.
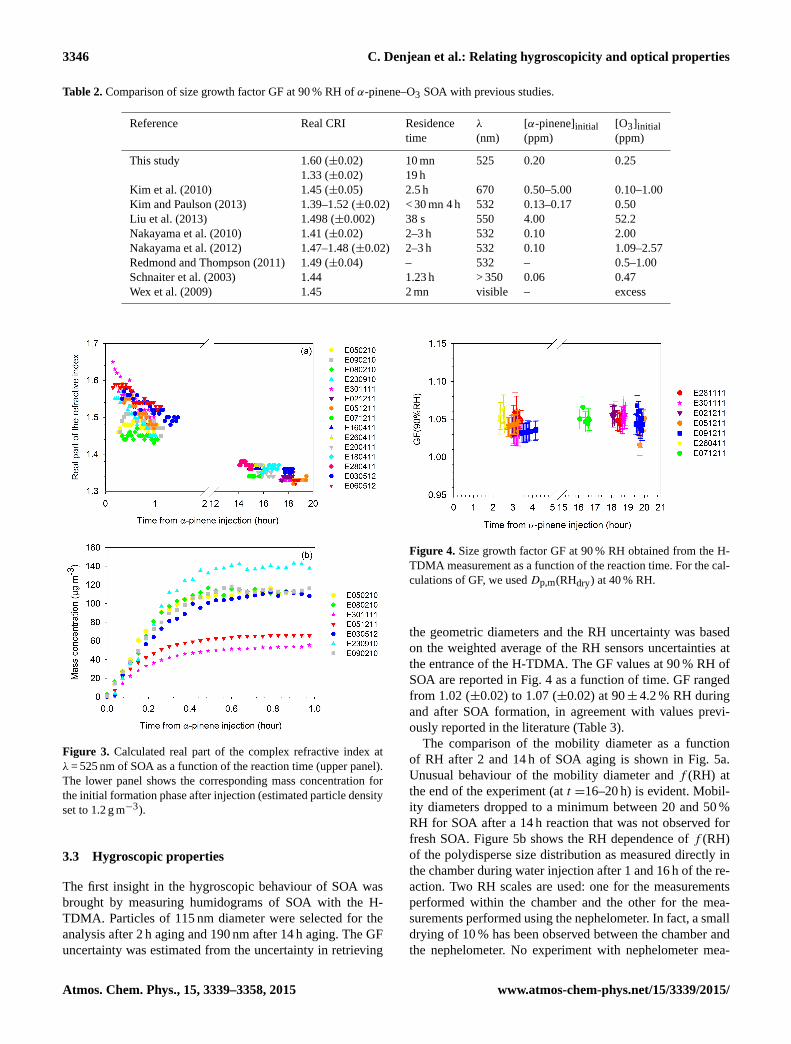
Figure 3a shows the real part of the retrieved CRI at
525 nm as a function of reaction time. The real CRI were cal-
culated when SOA exhibited a diameter high enough to allow
for the detection of the full size distribution by the SMPS.
Based on the measurement uncertainties of ±10 % for σscatt,
we estimate an absolute error associated with the real CRI
of ±0.02. The real CRI decreased from 1.43–1.60 at the be-
ginning of the reaction to 1.32–1.38 after 14 h of reaction.
In contrast, no significant changes in the CRI were observed
during the first hour of reaction for experiments E050210 and
E080210. As shown in Fig. 3b, the aerosol mass concentra-
tions in these experiments were stabilised after 20 min of re-
action, which was significantly faster than in the other exper-
iments. This may result from differences in the [VOC] / [O3]
concentrations (see discussion in Sect. 3.1 on the initial con-
centrations of α-pinene), leading to different reaction kinet-
ics (Chan et al., 2007). The real CRI appears to change sig-
nificantly in most of the experiments between 10 min and 1 h
of reaction and it is possible that these variations were not de-
tected in experiments E050210 and E080210. Values for the
real part of the CRI retrieved in this study at 525 nm are com-
pared with the literature values obtained for SOA produced
during α-pinene+O3 SOA formation (Table 2). Because our
experiments were performed under various timescales and
under various conditions and because our CRI values evolved
with SOA aging, we can globally say that our values (1.32–
1.60) were in the same range as the previous ones.
www.atmos-chem-phys.net/15/3339/2015/ Atmos. Chem. Phys., 15, 3339–3358, 2015
3346 C. Denjean et al.: Relating hygroscopicity and optical properties
Table 2. Comparison of size growth factor GF at 90 % RH of α-pinene–O3 SOA with previous studies.
Reference Real CRI Residence λ [α-pinene]initial [O3]initial
time (nm) (ppm) (ppm)
This study 1.60 (±0.02) 10 mn 525 0.20 0.25
1.33 (±0.02) 19 h
Kim et al. (2010) 1.45 (±0.05) 2.5 h 670 0.50–5.00 0.10–1.00
Kim and Paulson (2013) 1.39–1.52 (±0.02) < 30 mn 4 h 532 0.13–0.17 0.50
Liu et al. (2013) 1.498 (±0.002) 38 s 550 4.00 52.2
Nakayama et al. (2010) 1.41 (±0.02) 2–3 h 532 0.10 2.00
Nakayama et al. (2012) 1.47–1.48 (±0.02) 2–3 h 532 0.10 1.09–2.57
Redmond and Thompson (2011) 1.49 (±0.04) – 532 – 0.5–1.00
Schnaiter et al. (2003) 1.44 1.23 h > 350 0.06 0.47
Wex et al. (2009) 1.45 2 mn visible – excess
Figure 3. Calculated real part of the complex refractive index at
λ= 525 nm of SOA as a function of the reaction time (upper panel).
The lower panel shows the corresponding mass concentration for
the initial formation phase after injection (estimated particle density
set to 1.2 g m−3).
3.3 Hygroscopic properties
The first insight in the hygroscopic behaviour of SOA was
brought by measuring humidograms of SOA with the H-
TDMA. Particles of 115 nm diameter were selected for the
analysis after 2 h aging and 190 nm after 14 h aging. The GF
uncertainty was estimated from the uncertainty in retrieving
Figure 4. Size growth factor GF at 90 % RH obtained from the H-
TDMA measurement as a function of the reaction time. For the cal-
culations of GF, we used Dp,m(RHdry) at 40 % RH.
the geometric diameters and the RH uncertainty was based
on the weighted average of the RH sensors uncertainties at
the entrance of the H-TDMA. The GF values at 90 % RH of
SOA are reported in Fig. 4 as a function of time. GF ranged
from 1.02 (±0.02) to 1.07 (±0.02) at 90± 4.2 % RH during
and after SOA formation, in agreement with values previ-
ously reported in the literature (Table 3).
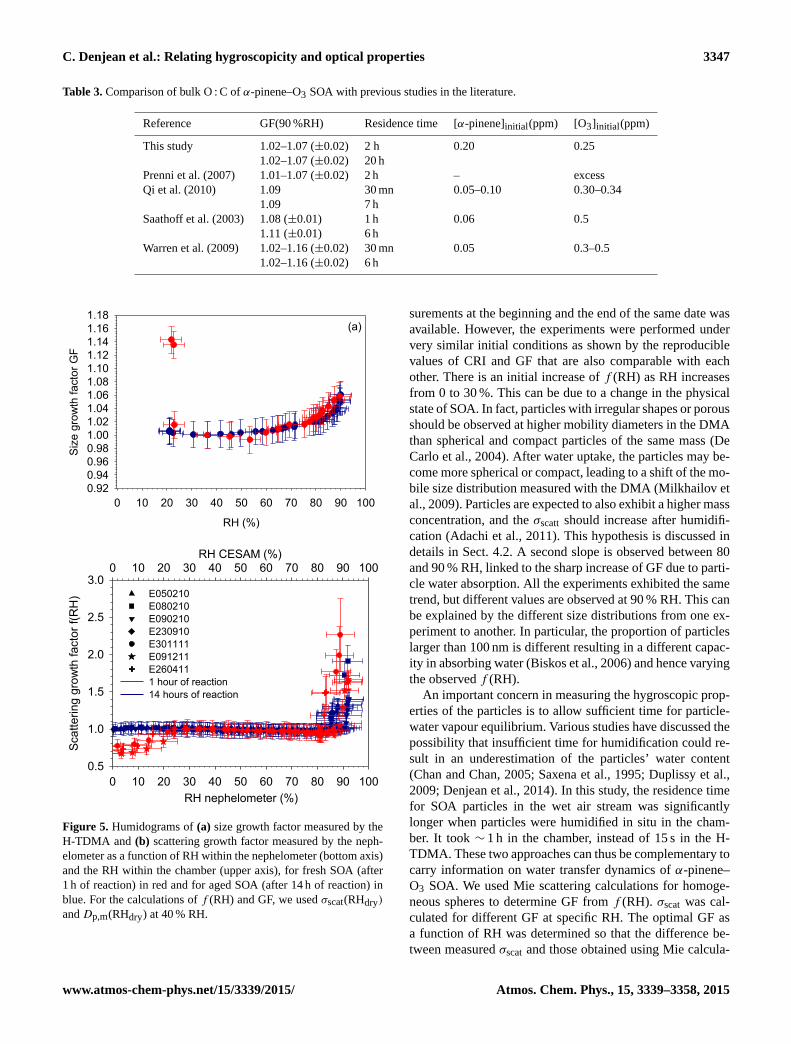
The comparison of the mobility diameter as a function
of RH after 2 and 14 h of SOA aging is shown in Fig. 5a.
Unusual behaviour of the mobility diameter and f (RH) at
the end of the experiment (at t =16–20 h) is evident. Mobil-
ity diameters dropped to a minimum between 20 and 50 %
RH for SOA after a 14 h reaction that was not observed for
fresh SOA. Figure 5b shows the RH dependence of f (RH)
of the polydisperse size distribution as measured directly in
the chamber during water injection after 1 and 16 h of the re-
action. Two RH scales are used: one for the measurements
performed within the chamber and the other for the mea-
surements performed using the nephelometer. In fact, a small
drying of 10 % has been observed between the chamber and
the nephelometer. No experiment with nephelometer mea-
Atmos. Chem. Phys., 15, 3339–3358, 2015 www.atmos-chem-phys.net/15/3339/2015/
C. Denjean et al.: Relating hygroscopicity and optical properties 3347
Table 3. Comparison of bulk O : C of α-pinene–O3 SOA with previous studies in the literature.
Reference GF(90 %RH) Residence time [α-pinene]initial(ppm) [O3]initial(ppm)
This study 1.02–1.07 (±0.02) 2 h 0.20 0.25
1.02–1.07 (±0.02) 20 h
Prenni et al. (2007) 1.01–1.07 (±0.02) 2 h – excess
Qi et al. (2010) 1.09 30 mn 0.05–0.10 0.30–0.34
1.09 7 h
Saathoff et al. (2003) 1.08 (±0.01) 1 h 0.06 0.5
1.11 (±0.01) 6 h
Warren et al. (2009) 1.02–1.16 (±0.02) 30 mn 0.05 0.3–0.5
1.02–1.16 (±0.02) 6 h
RH (%)
0 10 20 30 40 50 60 70 80 90 100
Siz
e g
row
th facto
r G
F
0.92
0.94
0.96
0.98
1.00
1.02
1.04
1.06
1.08
1.10
1.12
1.14
1.16
1.18(a)
E050210
E080210
E090210
E230910
E301111
E091211
E260411
1 hour of reaction
14 hours of reaction
RH CESAM (%)0 10 20 30 40 50 60 70 80 90 100
f(H
R)
0.8
1.0
1.2
1.4
1.6
1.8
2.0
2.2
05/02/2010
08/02/2010
09/02/2010
29/09/2010
RH nephelometer (%)
0 10 20 30 40 50 60 70 80 90 100
Scatterin
g g
row
th facto
r f(
RH
)
0.5
1.0
1.5
2.0
2.5
3.0
Figure 5. Humidograms of (a) size growth factor measured by the
H-TDMA and (b) scattering growth factor measured by the neph-
elometer as a function of RH within the nephelometer (bottom axis)
and the RH within the chamber (upper axis), for fresh SOA (after
1 h of reaction) in red and for aged SOA (after 14 h of reaction) in
blue. For the calculations of f (RH) and GF, we used σscat(RHdry)
and Dp,m(RHdry) at 40 % RH.
surements at the beginning and the end of the same date was
available. However, the experiments were performed under
very similar initial conditions as shown by the reproducible
values of CRI and GF that are also comparable with each
other. There is an initial increase of f (RH) as RH increases
from 0 to 30 %. This can be due to a change in the physical
state of SOA. In fact, particles with irregular shapes or porous
should be observed at higher mobility diameters in the DMA
than spherical and compact particles of the same mass (De
Carlo et al., 2004). After water uptake, the particles may be-
come more spherical or compact, leading to a shift of the mo-
bile size distribution measured with the DMA (Milkhailov et
al., 2009). Particles are expected to also exhibit a higher mass
concentration, and the σscatt should increase after humidifi-
cation (Adachi et al., 2011). This hypothesis is discussed in
details in Sect. 4.2. A second slope is observed between 80
and 90 % RH, linked to the sharp increase of GF due to parti-
cle water absorption. All the experiments exhibited the same
trend, but different values are observed at 90 % RH. This can
be explained by the different size distributions from one ex-
periment to another. In particular, the proportion of particles
larger than 100 nm is different resulting in a different capac-
ity in absorbing water (Biskos et al., 2006) and hence varying
the observed f (RH).
An important concern in measuring the hygroscopic prop-
erties of the particles is to allow sufficient time for particle-
water vapour equilibrium. Various studies have discussed the
possibility that insufficient time for humidification could re-
sult in an underestimation of the particles’ water content
(Chan and Chan, 2005; Saxena et al., 1995; Duplissy et al.,
2009; Denjean et al., 2014). In this study, the residence time
for SOA particles in the wet air stream was significantly
longer when particles were humidified in situ in the cham-
ber. It took ∼ 1 h in the chamber, instead of 15 s in the H-
TDMA. These two approaches can thus be complementary to
carry information on water transfer dynamics of α-pinene–
O3 SOA. We used Mie scattering calculations for homoge-
neous spheres to determine GF from f (RH). σscat was cal-
culated for different GF at specific RH. The optimal GF as
a function of RH was determined so that the difference be-
tween measured σscat and those obtained using Mie calcula-
www.atmos-chem-phys.net/15/3339/2015/ Atmos. Chem. Phys., 15, 3339–3358, 2015
3348 C. Denjean et al.: Relating hygroscopicity and optical properties
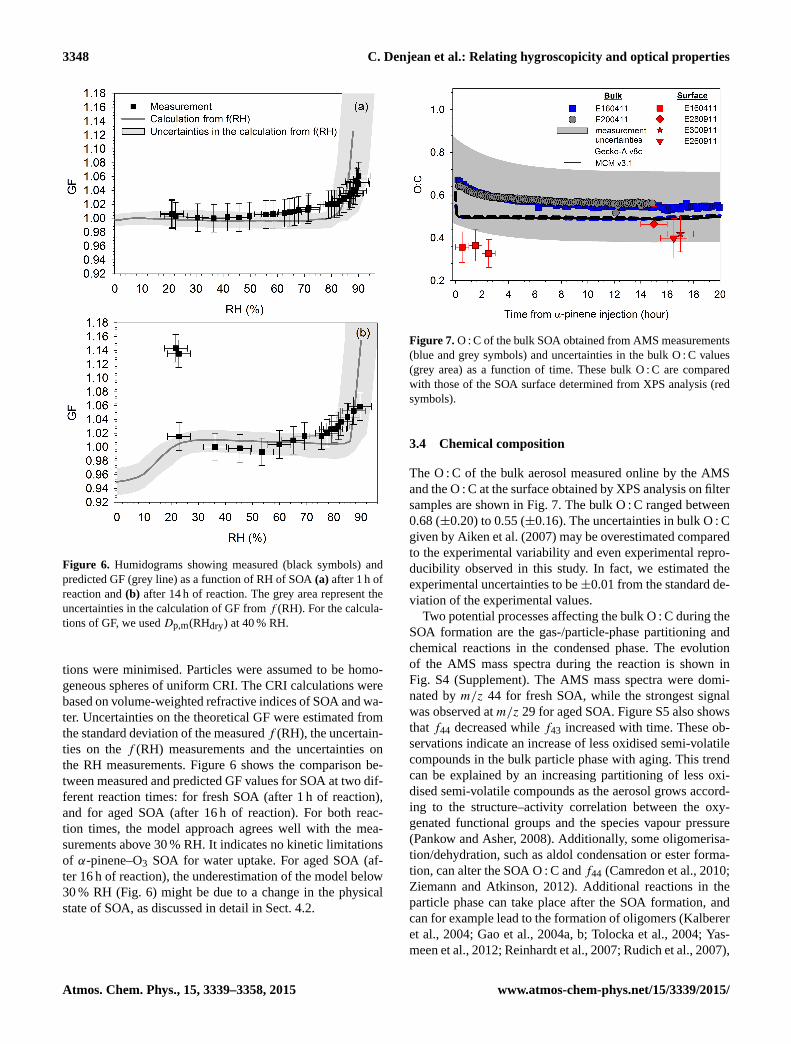
Figure 6. Humidograms showing measured (black symbols) and
predicted GF (grey line) as a function of RH of SOA (a) after 1 h of
reaction and (b) after 14 h of reaction. The grey area represent the
uncertainties in the calculation of GF from f (RH). For the calcula-
tions of GF, we used Dp,m(RHdry) at 40 % RH.
tions were minimised. Particles were assumed to be homo-
geneous spheres of uniform CRI. The CRI calculations were
based on volume-weighted refractive indices of SOA and wa-
ter. Uncertainties on the theoretical GF were estimated from
the standard deviation of the measured f (RH), the uncertain-
ties on the f (RH) measurements and the uncertainties on
the RH measurements. Figure 6 shows the comparison be-
tween measured and predicted GF values for SOA at two dif-
ferent reaction times: for fresh SOA (after 1 h of reaction),
and for aged SOA (after 16 h of reaction). For both reac-
tion times, the model approach agrees well with the mea-
surements above 30 % RH. It indicates no kinetic limitations
of α-pinene–O3 SOA for water uptake. For aged SOA (af-
ter 16 h of reaction), the underestimation of the model below
30 % RH (Fig. 6) might be due to a change in the physical
state of SOA, as discussed in detail in Sect. 4.2.
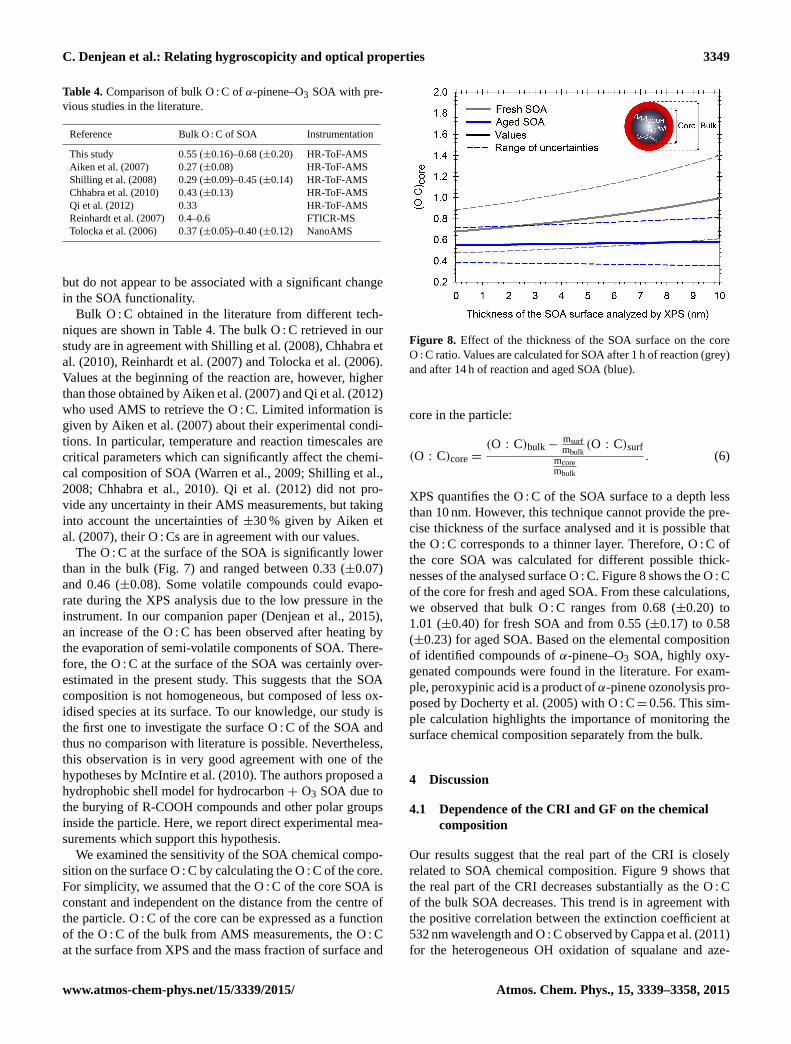
Figure 7. O : C of the bulk SOA obtained from AMS measurements
(blue and grey symbols) and uncertainties in the bulk O : C values
(grey area) as a function of time. These bulk O : C are compared
with those of the SOA surface determined from XPS analysis (red
symbols).
3.4 Chemical composition
The O : C of the bulk aerosol measured online by the AMS
and the O : C at the surface obtained by XPS analysis on filter
samples are shown in Fig. 7. The bulk O : C ranged between
0.68 (±0.20) to 0.55 (±0.16). The uncertainties in bulk O : C
given by Aiken et al. (2007) may be overestimated compared
to the experimental variability and even experimental repro-
ducibility observed in this study. In fact, we estimated the
experimental uncertainties to be±0.01 from the standard de-
viation of the experimental values.
Two potential processes affecting the bulk O : C during the
SOA formation are the gas-/particle-phase partitioning and
chemical reactions in the condensed phase. The evolution
of the AMS mass spectra during the reaction is shown in
Fig. S4 (Supplement). The AMS mass spectra were domi-
nated by m/z 44 for fresh SOA, while the strongest signal
was observed at m/z 29 for aged SOA. Figure S5 also shows
that f44 decreased while f43 increased with time. These ob-
servations indicate an increase of less oxidised semi-volatile
compounds in the bulk particle phase with aging. This trend
can be explained by an increasing partitioning of less oxi-
dised semi-volatile compounds as the aerosol grows accord-
ing to the structure–activity correlation between the oxy-
genated functional groups and the species vapour pressure
(Pankow and Asher, 2008). Additionally, some oligomerisa-
tion/dehydration, such as aldol condensation or ester forma-
tion, can alter the SOA O : C and f44 (Camredon et al., 2010;
Ziemann and Atkinson, 2012). Additional reactions in the
particle phase can take place after the SOA formation, and
can for example lead to the formation of oligomers (Kalberer
et al., 2004; Gao et al., 2004a, b; Tolocka et al., 2004; Yas-
meen et al., 2012; Reinhardt et al., 2007; Rudich et al., 2007),
Atmos. Chem. Phys., 15, 3339–3358, 2015 www.atmos-chem-phys.net/15/3339/2015/
C. Denjean et al.: Relating hygroscopicity and optical properties 3349
Table 4. Comparison of bulk O : C of α-pinene–O3 SOA with pre-
vious studies in the literature.
Reference Bulk O : C of SOA Instrumentation
This study 0.55 (±0.16)–0.68 (±0.20) HR-ToF-AMS
Aiken et al. (2007) 0.27 (±0.08) HR-ToF-AMS
Shilling et al. (2008) 0.29 (±0.09)–0.45 (±0.14) HR-ToF-AMS
Chhabra et al. (2010) 0.43 (±0.13) HR-ToF-AMS
Qi et al. (2012) 0.33 HR-ToF-AMS
Reinhardt et al. (2007) 0.4–0.6 FTICR-MS
Tolocka et al. (2006) 0.37 (±0.05)–0.40 (±0.12) NanoAMS
but do not appear to be associated with a significant change
in the SOA functionality.
Bulk O : C obtained in the literature from different tech-
niques are shown in Table 4. The bulk O : C retrieved in our
study are in agreement with Shilling et al. (2008), Chhabra et
al. (2010), Reinhardt et al. (2007) and Tolocka et al. (2006).
Values at the beginning of the reaction are, however, higher
than those obtained by Aiken et al. (2007) and Qi et al. (2012)
who used AMS to retrieve the O : C. Limited information is
given by Aiken et al. (2007) about their experimental condi-
tions. In particular, temperature and reaction timescales are
critical parameters which can significantly affect the chemi-
cal composition of SOA (Warren et al., 2009; Shilling et al.,
2008; Chhabra et al., 2010). Qi et al. (2012) did not pro-
vide any uncertainty in their AMS measurements, but taking
into account the uncertainties of ±30 % given by Aiken et
al. (2007), their O : Cs are in agreement with our values.
The O : C at the surface of the SOA is significantly lower
than in the bulk (Fig. 7) and ranged between 0.33 (±0.07)
and 0.46 (±0.08). Some volatile compounds could evapo-
rate during the XPS analysis due to the low pressure in the
instrument. In our companion paper (Denjean et al., 2015),
an increase of the O : C has been observed after heating by
the evaporation of semi-volatile components of SOA. There-
fore, the O : C at the surface of the SOA was certainly over-
estimated in the present study. This suggests that the SOA
composition is not homogeneous, but composed of less ox-
idised species at its surface. To our knowledge, our study is
the first one to investigate the surface O : C of the SOA and
thus no comparison with literature is possible. Nevertheless,
this observation is in very good agreement with one of the
hypotheses by McIntire et al. (2010). The authors proposed a
hydrophobic shell model for hydrocarbon + O3 SOA due to
the burying of R-COOH compounds and other polar groups
inside the particle. Here, we report direct experimental mea-
surements which support this hypothesis.
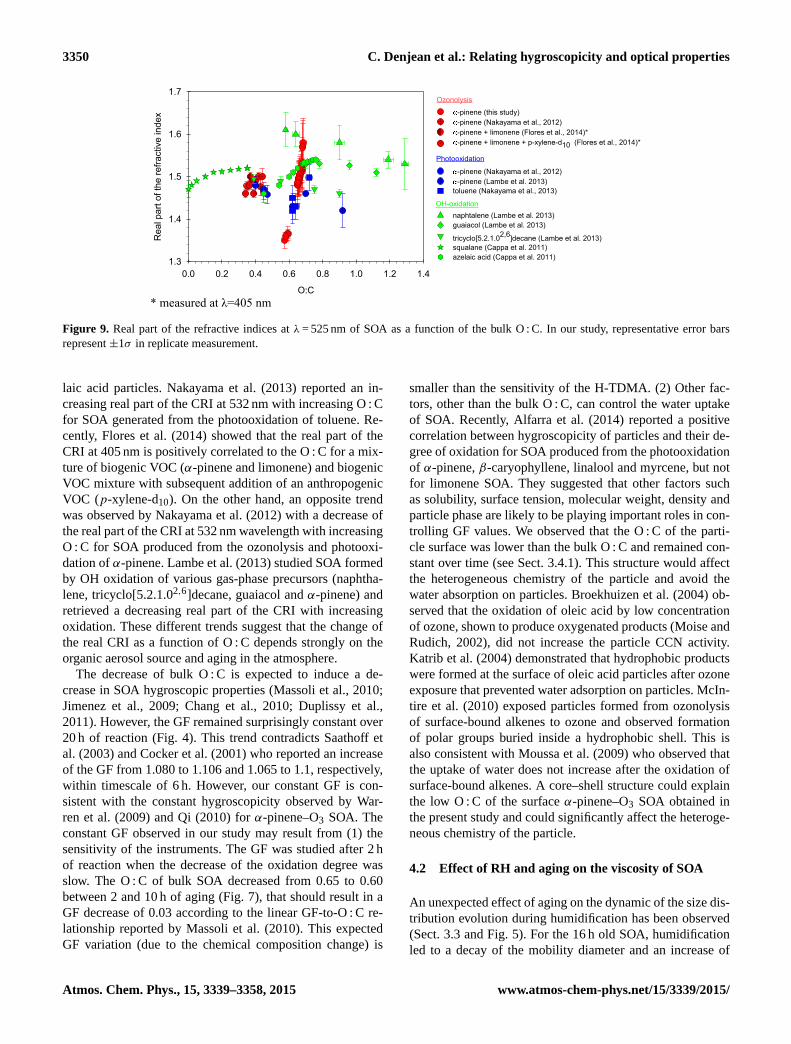
We examined the sensitivity of the SOA chemical compo-
sition on the surface O : C by calculating the O : C of the core.
For simplicity, we assumed that the O : C of the core SOA is
constant and independent on the distance from the centre of
the particle. O : C of the core can be expressed as a function
of the O : C of the bulk from AMS measurements, the O : C
at the surface from XPS and the mass fraction of surface and
Figure 8. Effect of the thickness of the SOA surface on the core
O : C ratio. Values are calculated for SOA after 1 h of reaction (grey)
and after 14 h of reaction and aged SOA (blue).
core in the particle:
(O : C)core =(O : C)bulk−
msurf
mbulk(O : C)surf
mcore
mbulk
. (6)
XPS quantifies the O : C of the SOA surface to a depth less
than 10 nm. However, this technique cannot provide the pre-
cise thickness of the surface analysed and it is possible that
the O : C corresponds to a thinner layer. Therefore, O : C of
the core SOA was calculated for different possible thick-
nesses of the analysed surface O : C. Figure 8 shows the O : C
of the core for fresh and aged SOA. From these calculations,
we observed that bulk O : C ranges from 0.68 (±0.20) to
1.01 (±0.40) for fresh SOA and from 0.55 (±0.17) to 0.58
(±0.23) for aged SOA. Based on the elemental composition
of identified compounds of α-pinene–O3 SOA, highly oxy-
genated compounds were found in the literature. For exam-
ple, peroxypinic acid is a product of α-pinene ozonolysis pro-
posed by Docherty et al. (2005) with O : C= 0.56. This sim-
ple calculation highlights the importance of monitoring the
surface chemical composition separately from the bulk.
4 Discussion
4.1 Dependence of the CRI and GF on the chemical
composition
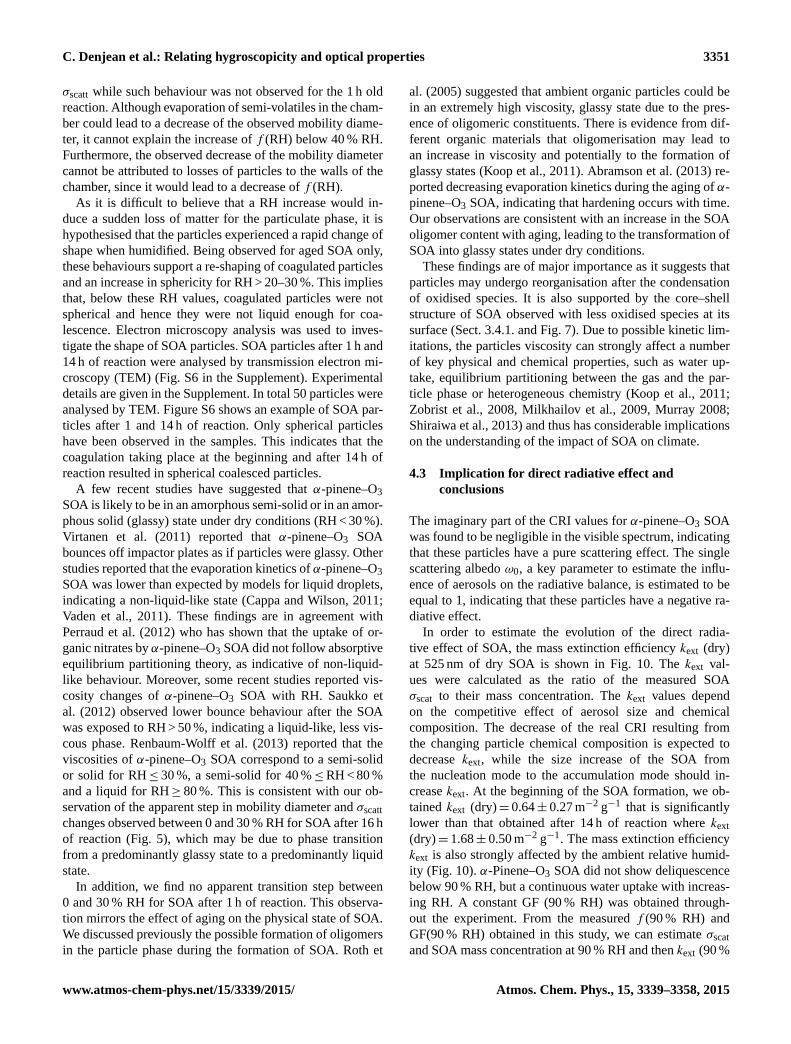
Our results suggest that the real part of the CRI is closely
related to SOA chemical composition. Figure 9 shows that
the real part of the CRI decreases substantially as the O : C
of the bulk SOA decreases. This trend is in agreement with
the positive correlation between the extinction coefficient at
532 nm wavelength and O : C observed by Cappa et al. (2011)
for the heterogeneous OH oxidation of squalane and aze-
www.atmos-chem-phys.net/15/3339/2015/ Atmos. Chem. Phys., 15, 3339–3358, 2015
3350 C. Denjean et al.: Relating hygroscopicity and optical properties
* measured at λ=405 nm O:C
0.0 0.2 0.4 0.6 0.8 1.0 1.2 1.4
Real part
of th
e r
efr
active index
1.3
1.4
1.5
1.6
1.7
-pinene (this study)
-pinene (Nakayama et al., 2012)
-pinene + limonene (Flores et al., 2014)*
-pinene + limonene + p-xylene-d10 (Flores et al., 2014)*
-pinene (Nakayama et al., 2012)
-pinene (Lambe et al. 2013)
toluene (Nakayama et al., 2013)
1naphtalene (Lambe et al. 2013)
guaiacol (Lambe et al. 2013)
tricyclo[5.2.1.02,6
]decane (Lambe et al. 2013)
squalane (Cappa et al. 2011)
azelaic acid (Cappa et al. 2011)
Photooxidation
Ozonolysis
OH-oxidation
Figure 9. Real part of the refractive indices at λ= 525 nm of SOA as a function of the bulk O : C. In our study, representative error bars
represent ±1σ in replicate measurement.
laic acid particles. Nakayama et al. (2013) reported an in-
creasing real part of the CRI at 532 nm with increasing O : C
for SOA generated from the photooxidation of toluene. Re-
cently, Flores et al. (2014) showed that the real part of the
CRI at 405 nm is positively correlated to the O : C for a mix-
ture of biogenic VOC (α-pinene and limonene) and biogenic
VOC mixture with subsequent addition of an anthropogenic
VOC (p-xylene-d10). On the other hand, an opposite trend
was observed by Nakayama et al. (2012) with a decrease of
the real part of the CRI at 532 nm wavelength with increasing
O : C for SOA produced from the ozonolysis and photooxi-
dation of α-pinene. Lambe et al. (2013) studied SOA formed
by OH oxidation of various gas-phase precursors (naphtha-
lene, tricyclo[5.2.1.02,6]decane, guaiacol and α-pinene) and
retrieved a decreasing real part of the CRI with increasing
oxidation. These different trends suggest that the change of
the real CRI as a function of O : C depends strongly on the
organic aerosol source and aging in the atmosphere.
The decrease of bulk O : C is expected to induce a de-
crease in SOA hygroscopic properties (Massoli et al., 2010;
Jimenez et al., 2009; Chang et al., 2010; Duplissy et al.,
2011). However, the GF remained surprisingly constant over
20 h of reaction (Fig. 4). This trend contradicts Saathoff et
al. (2003) and Cocker et al. (2001) who reported an increase
of the GF from 1.080 to 1.106 and 1.065 to 1.1, respectively,
within timescale of 6 h. However, our constant GF is con-
sistent with the constant hygroscopicity observed by War-
ren et al. (2009) and Qi (2010) for α-pinene–O3 SOA. The
constant GF observed in our study may result from (1) the
sensitivity of the instruments. The GF was studied after 2 h
of reaction when the decrease of the oxidation degree was
slow. The O : C of bulk SOA decreased from 0.65 to 0.60
between 2 and 10 h of aging (Fig. 7), that should result in a
GF decrease of 0.03 according to the linear GF-to-O : C re-
lationship reported by Massoli et al. (2010). This expected
GF variation (due to the chemical composition change) is
smaller than the sensitivity of the H-TDMA. (2) Other fac-
tors, other than the bulk O : C, can control the water uptake
of SOA. Recently, Alfarra et al. (2014) reported a positive
correlation between hygroscopicity of particles and their de-
gree of oxidation for SOA produced from the photooxidation
of α-pinene, β-caryophyllene, linalool and myrcene, but not
for limonene SOA. They suggested that other factors such
as solubility, surface tension, molecular weight, density and
particle phase are likely to be playing important roles in con-
trolling GF values. We observed that the O : C of the parti-
cle surface was lower than the bulk O : C and remained con-
stant over time (see Sect. 3.4.1). This structure would affect
the heterogeneous chemistry of the particle and avoid the
water absorption on particles. Broekhuizen et al. (2004) ob-
served that the oxidation of oleic acid by low concentration
of ozone, shown to produce oxygenated products (Moise and
Rudich, 2002), did not increase the particle CCN activity.
Katrib et al. (2004) demonstrated that hydrophobic products
were formed at the surface of oleic acid particles after ozone
exposure that prevented water adsorption on particles. McIn-
tire et al. (2010) exposed particles formed from ozonolysis
of surface-bound alkenes to ozone and observed formation
of polar groups buried inside a hydrophobic shell. This is
also consistent with Moussa et al. (2009) who observed that
the uptake of water does not increase after the oxidation of
surface-bound alkenes. A core–shell structure could explain
the low O : C of the surface α-pinene–O3 SOA obtained in
the present study and could significantly affect the heteroge-
neous chemistry of the particle.
4.2 Effect of RH and aging on the viscosity of SOA
An unexpected effect of aging on the dynamic of the size dis-
tribution evolution during humidification has been observed
(Sect. 3.3 and Fig. 5). For the 16 h old SOA, humidification
led to a decay of the mobility diameter and an increase of
Atmos. Chem. Phys., 15, 3339–3358, 2015 www.atmos-chem-phys.net/15/3339/2015/
C. Denjean et al.: Relating hygroscopicity and optical properties 3351
σscatt while such behaviour was not observed for the 1 h old
reaction. Although evaporation of semi-volatiles in the cham-
ber could lead to a decrease of the observed mobility diame-
ter, it cannot explain the increase of f (RH) below 40 % RH.
Furthermore, the observed decrease of the mobility diameter
cannot be attributed to losses of particles to the walls of the
chamber, since it would lead to a decrease of f (RH).
As it is difficult to believe that a RH increase would in-
duce a sudden loss of matter for the particulate phase, it is
hypothesised that the particles experienced a rapid change of
shape when humidified. Being observed for aged SOA only,
these behaviours support a re-shaping of coagulated particles
and an increase in sphericity for RH > 20–30 %. This implies
that, below these RH values, coagulated particles were not
spherical and hence they were not liquid enough for coa-
lescence. Electron microscopy analysis was used to inves-
tigate the shape of SOA particles. SOA particles after 1 h and
14 h of reaction were analysed by transmission electron mi-
croscopy (TEM) (Fig. S6 in the Supplement). Experimental
details are given in the Supplement. In total 50 particles were
analysed by TEM. Figure S6 shows an example of SOA par-
ticles after 1 and 14 h of reaction. Only spherical particles
have been observed in the samples. This indicates that the
coagulation taking place at the beginning and after 14 h of
reaction resulted in spherical coalesced particles.
A few recent studies have suggested that α-pinene–O3
SOA is likely to be in an amorphous semi-solid or in an amor-
phous solid (glassy) state under dry conditions (RH < 30 %).
Virtanen et al. (2011) reported that α-pinene–O3 SOA
bounces off impactor plates as if particles were glassy. Other
studies reported that the evaporation kinetics of α-pinene–O3
SOA was lower than expected by models for liquid droplets,
indicating a non-liquid-like state (Cappa and Wilson, 2011;
Vaden et al., 2011). These findings are in agreement with
Perraud et al. (2012) who has shown that the uptake of or-
ganic nitrates by α-pinene–O3 SOA did not follow absorptive
equilibrium partitioning theory, as indicative of non-liquid-
like behaviour. Moreover, some recent studies reported vis-
cosity changes of α-pinene–O3 SOA with RH. Saukko et
al. (2012) observed lower bounce behaviour after the SOA
was exposed to RH > 50 %, indicating a liquid-like, less vis-
cous phase. Renbaum-Wolff et al. (2013) reported that the
viscosities of α-pinene–O3 SOA correspond to a semi-solid
or solid for RH≤ 30 %, a semi-solid for 40 %≤RH < 80 %
and a liquid for RH≥ 80 %. This is consistent with our ob-
servation of the apparent step in mobility diameter and σscatt
changes observed between 0 and 30 % RH for SOA after 16 h
of reaction (Fig. 5), which may be due to phase transition
from a predominantly glassy state to a predominantly liquid
state.
In addition, we find no apparent transition step between
0 and 30 % RH for SOA after 1 h of reaction. This observa-
tion mirrors the effect of aging on the physical state of SOA.
We discussed previously the possible formation of oligomers
in the particle phase during the formation of SOA. Roth et
al. (2005) suggested that ambient organic particles could be
in an extremely high viscosity, glassy state due to the pres-
ence of oligomeric constituents. There is evidence from dif-
ferent organic materials that oligomerisation may lead to
an increase in viscosity and potentially to the formation of
glassy states (Koop et al., 2011). Abramson et al. (2013) re-
ported decreasing evaporation kinetics during the aging of α-
pinene–O3 SOA, indicating that hardening occurs with time.
Our observations are consistent with an increase in the SOA
oligomer content with aging, leading to the transformation of
SOA into glassy states under dry conditions.
These findings are of major importance as it suggests that
particles may undergo reorganisation after the condensation
of oxidised species. It is also supported by the core–shell
structure of SOA observed with less oxidised species at its
surface (Sect. 3.4.1. and Fig. 7). Due to possible kinetic lim-
itations, the particles viscosity can strongly affect a number
of key physical and chemical properties, such as water up-
take, equilibrium partitioning between the gas and the par-
ticle phase or heterogeneous chemistry (Koop et al., 2011;
Zobrist et al., 2008, Milkhailov et al., 2009, Murray 2008;
Shiraiwa et al., 2013) and thus has considerable implications
on the understanding of the impact of SOA on climate.
4.3 Implication for direct radiative effect and
conclusions
The imaginary part of the CRI values for α-pinene–O3 SOA
was found to be negligible in the visible spectrum, indicating
that these particles have a pure scattering effect. The single
scattering albedo ω0, a key parameter to estimate the influ-
ence of aerosols on the radiative balance, is estimated to be
equal to 1, indicating that these particles have a negative ra-
diative effect.
In order to estimate the evolution of the direct radia-
tive effect of SOA, the mass extinction efficiency kext (dry)
at 525 nm of dry SOA is shown in Fig. 10. The kext val-
ues were calculated as the ratio of the measured SOA
σscat to their mass concentration. The kext values depend
on the competitive effect of aerosol size and chemical
composition. The decrease of the real CRI resulting from
the changing particle chemical composition is expected to
decrease kext, while the size increase of the SOA from
the nucleation mode to the accumulation mode should in-
crease kext. At the beginning of the SOA formation, we ob-
tained kext (dry)= 0.64± 0.27 m−2 g−1 that is significantly
lower than that obtained after 14 h of reaction where kext
(dry)= 1.68± 0.50 m−2 g−1. The mass extinction efficiency
kext is also strongly affected by the ambient relative humid-
ity (Fig. 10). α-Pinene–O3 SOA did not show deliquescence
below 90 % RH, but a continuous water uptake with increas-
ing RH. A constant GF (90 % RH) was obtained through-
out the experiment. From the measured f (90 % RH) and
GF(90 % RH) obtained in this study, we can estimate σscat
and SOA mass concentration at 90 % RH and then kext (90 %
www.atmos-chem-phys.net/15/3339/2015/ Atmos. Chem. Phys., 15, 3339–3358, 2015
3352 C. Denjean et al.: Relating hygroscopicity and optical properties
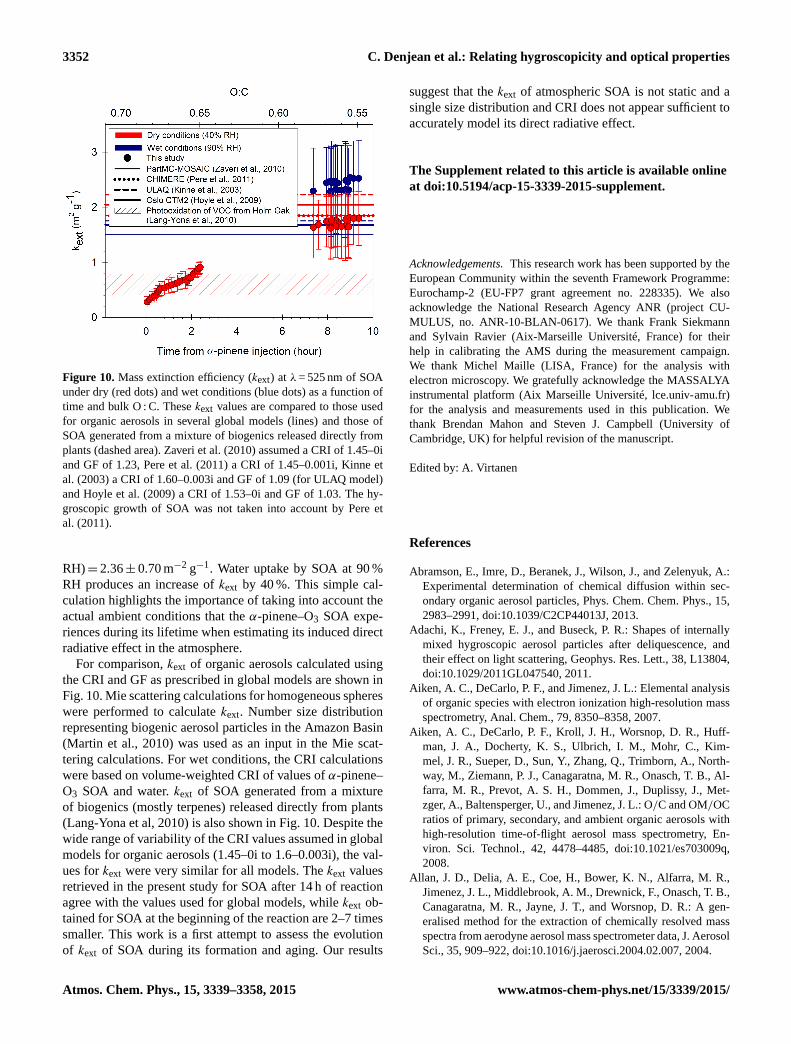
Figure 10. Mass extinction efficiency (kext) at λ= 525 nm of SOA
under dry (red dots) and wet conditions (blue dots) as a function of
time and bulk O : C. These kext values are compared to those used
for organic aerosols in several global models (lines) and those of
SOA generated from a mixture of biogenics released directly from
plants (dashed area). Zaveri et al. (2010) assumed a CRI of 1.45–0i
and GF of 1.23, Pere et al. (2011) a CRI of 1.45–0.001i, Kinne et
al. (2003) a CRI of 1.60–0.003i and GF of 1.09 (for ULAQ model)
and Hoyle et al. (2009) a CRI of 1.53–0i and GF of 1.03. The hy-
groscopic growth of SOA was not taken into account by Pere et
al. (2011).
RH)= 2.36± 0.70 m−2 g−1. Water uptake by SOA at 90 %
RH produces an increase of kext by 40 %. This simple cal-
culation highlights the importance of taking into account the
actual ambient conditions that the α-pinene–O3 SOA expe-
riences during its lifetime when estimating its induced direct
radiative effect in the atmosphere.
For comparison, kext of organic aerosols calculated using
the CRI and GF as prescribed in global models are shown in
Fig. 10. Mie scattering calculations for homogeneous spheres
were performed to calculate kext. Number size distribution
representing biogenic aerosol particles in the Amazon Basin
(Martin et al., 2010) was used as an input in the Mie scat-
tering calculations. For wet conditions, the CRI calculations
were based on volume-weighted CRI of values of α-pinene–
O3 SOA and water. kext of SOA generated from a mixture
of biogenics (mostly terpenes) released directly from plants
(Lang-Yona et al, 2010) is also shown in Fig. 10. Despite the
wide range of variability of the CRI values assumed in global
models for organic aerosols (1.45–0i to 1.6–0.003i), the val-
ues for kext were very similar for all models. The kext values
retrieved in the present study for SOA after 14 h of reaction
agree with the values used for global models, while kext ob-
tained for SOA at the beginning of the reaction are 2–7 times
smaller. This work is a first attempt to assess the evolution
of kext of SOA during its formation and aging. Our results
suggest that the kext of atmospheric SOA is not static and a
single size distribution and CRI does not appear sufficient to
accurately model its direct radiative effect.
The Supplement related to this article is available online
at doi:10.5194/acp-15-3339-2015-supplement.
Acknowledgements. This research work has been supported by the
European Community within the seventh Framework Programme:
Eurochamp-2 (EU-FP7 grant agreement no. 228335). We also
acknowledge the National Research Agency ANR (project CU-
MULUS, no. ANR-10-BLAN-0617). We thank Frank Siekmann
and Sylvain Ravier (Aix-Marseille Université, France) for their
help in calibrating the AMS during the measurement campaign.
We thank Michel Maille (LISA, France) for the analysis with
electron microscopy. We gratefully acknowledge the MASSALYA
instrumental platform (Aix Marseille Université, lce.univ-amu.fr)
for the analysis and measurements used in this publication. We
thank Brendan Mahon and Steven J. Campbell (University of
Cambridge, UK) for helpful revision of the manuscript.
Edited by: A. Virtanen
References
Abramson, E., Imre, D., Beranek, J., Wilson, J., and Zelenyuk, A.:
Experimental determination of chemical diffusion within sec-
ondary organic aerosol particles, Phys. Chem. Chem. Phys., 15,
2983–2991, doi:10.1039/C2CP44013J, 2013.
Adachi, K., Freney, E. J., and Buseck, P. R.: Shapes of internally
mixed hygroscopic aerosol particles after deliquescence, and
their effect on light scattering, Geophys. Res. Lett., 38, L13804,
doi:10.1029/2011GL047540, 2011.
Aiken, A. C., DeCarlo, P. F., and Jimenez, J. L.: Elemental analysis
of organic species with electron ionization high-resolution mass
spectrometry, Anal. Chem., 79, 8350–8358, 2007.
Aiken, A. C., DeCarlo, P. F., Kroll, J. H., Worsnop, D. R., Huff-
man, J. A., Docherty, K. S., Ulbrich, I. M., Mohr, C., Kim-
mel, J. R., Sueper, D., Sun, Y., Zhang, Q., Trimborn, A., North-
way, M., Ziemann, P. J., Canagaratna, M. R., Onasch, T. B., Al-
farra, M. R., Prevot, A. S. H., Dommen, J., Duplissy, J., Met-
zger, A., Baltensperger, U., and Jimenez, J. L.: O/C and OM/OC
ratios of primary, secondary, and ambient organic aerosols with
high-resolution time-of-flight aerosol mass spectrometry, En-
viron. Sci. Technol., 42, 4478–4485, doi:10.1021/es703009q,
2008.
Allan, J. D., Delia, A. E., Coe, H., Bower, K. N., Alfarra, M. R.,
Jimenez, J. L., Middlebrook, A. M., Drewnick, F., Onasch, T. B.,
Canagaratna, M. R., Jayne, J. T., and Worsnop, D. R.: A gen-
eralised method for the extraction of chemically resolved mass
spectra from aerodyne aerosol mass spectrometer data, J. Aerosol
Sci., 35, 909–922, doi:10.1016/j.jaerosci.2004.02.007, 2004.
Atmos. Chem. Phys., 15, 3339–3358, 2015 www.atmos-chem-phys.net/15/3339/2015/
C. Denjean et al.: Relating hygroscopicity and optical properties 3353
Andreae, M. O.: A new look at aging aerosols, Science, 326, 1493–
1494, doi:10.1126/science.1183158, 2009.
Arnott, W. P., Hamasha, K., Moosmuller, H., Sheridan, P. J., and
Ogren, J. A.: Towards aerosol light-absorption measurements
with a 7-wavelength Aethalometer: evaluation with a photoa-
coustic instrument and 3-wavelength nephelometer, Aerosol Sci.
Tech., 39, 17–29, doi:10.1080/027868290901972, 2005.
Baltensperger, U.: Secondary organic aerosols from anthropogenic
and biogenic precursors, Roy. Soc. Ch., 130, 265–278, 2005.
Biskos, G., Russell, L. M., Buseck, P. R., and Martin, S. T.: Nano-
size effect on the hygroscopic growth factor of aerosol particles,
Geophys. Res. Lett., 33, L07801, doi:10.1029/2005GL025199,
2006.
Bohren, C. F. and Huffman, D. R.: Absorption and Scattering of
Light by Small Particles, Wiley, New York, 1983.
Bond, T. C. and Bergstrom, R. W.: Light absorption by carbona-
ceous particles: an investigative review, Aerosol Sci. Tech., 40,
27–67, doi:10.1080/02786820500421521, 2006.
Bond, T. C., Anderson, T. L., and Campbell, D.: Calibration
and intercomparison of filter-based measurements of visible
light absorption by aerosols, Aerosol Sci. Tech., 30, 582–600,
doi:10.1080/027868299304435, 1999.
Broekhuizen, K. E., Thornberry, T., Kumar, P. P., and Abbatt, J.
P. D.: Formation of cloud condensation nuclei by oxidative pro-
cessing: Unsaturated fatty acids, J. Geophys. Res.-Atmos., 109,
D24206, doi:10.1029/2004JD005298, 2004.
Camredon, M., Hamilton, J. F., Alam, M. S., Wyche, K. P., Carr, T.,
White, I. R., Monks, P. S., Rickard, A. R., and Bloss, W. J.: Dis-
tribution of gaseous and particulate organic composition during
dark α-pinene ozonolysis, Atmos. Chem. Phys., 10, 2893–2917,
doi:10.5194/acp-10-2893-2010, 2010.
Canagaratna, M. R., Jayne, J. T., Jimenez, J. L., Allan, J. D., Al-
farra, M. R., Zhang, Q., Onasch, T. B., Drewnick, F., Coe, H.,
Middlebrook, A., Delia, A., Williams, L. R., Trimborn, A. M.,
Northway, M. J., DeCarlo, P. F., Kolb, C. E., Davidovits, P., and
Worsnop, D. R.: Chemical and microphysical characterization
of ambient aerosols with the aerodyne aerosol mass spectrome-
ter, Mass Spectrom. Rev., 26, 185–222, doi:10.1002/mas.20115,
2007.
Cappa, C. D. and Wilson, K. R.: Evolution of organic aerosol mass
spectra upon heating: implications for OA phase and partitioning
behavior, Atmos. Chem. Phys., 11, 1895–1911, doi:10.5194/acp-
11-1895-2011, 2011.
Cappa, C. D., Lack, D. A., Burkholder, J. B., and Ravis-
hankara, A. R.: Bias in filter-based aerosol light absorption mea-
surements due to organic aerosol loading: evidence from labora-
tory measurements, Aerosol Sci. Tech., 42, 1022–1032, 2008.
Cappa, C. D., Che, D. L., Kessler, S. H., Kroll, J. H., and Wil-
son, K. R.: Variations in organic aerosol optical and hygroscopic
properties upon heterogeneous OH oxidation, J. Geophys. Res.,
116, D15204, doi:10.1029/2011JD015918, 2011.
Carrico, C. M., Kreidenweis, S. M., Malm, W. C., Day, D. E.,
Lee, T., Carrillo, J., McMeeking, G. R., and Collett Jr., J. L.:
Hygroscopic growth behavior of a carbon-dominated aerosol in
Yosemite National Park, Atmos. Environ., 39, 1393–1404, 2005.
Chan, M. N. and Chan, C. K.: Mass transfer effects in hygro-
scopic measurements of aerosol particles, Atmos. Chem. Phys.,
5, 2703–2712, doi:10.5194/acp-5-2703-2005, 2005.
Chan, A. W. H., Kroll, J. H., Ng, N. L., and Seinfeld, J. H.: Ki-
netic modeling of secondary organic aerosol formation: effects
of particle- and gas-phase reactions of semivolatile products, At-
mos. Chem. Phys., 7, 4135–4147, doi:10.5194/acp-7-4135-2007,
2007.
Chang, R. Y.-W., Slowik, J. G., Shantz, N. C., Vlasenko, A., Lig-
gio, J., Sjostedt, S. J., Leaitch, W. R., and Abbatt, J. P. D.: The hy-
groscopicity parameter (κ) of ambient organic aerosol at a field
site subject to biogenic and anthropogenic influences: relation-
ship to degree of aerosol oxidation, Atmos. Chem. Phys., 10,
5047–5064, doi:10.5194/acp-10-5047-2010, 2010.
Charlson, R. J., Schwartz, S. E., Hales, J. M., Cess, R. D.,
Coakley, J. A., Hansen, J. E., and Hofmann, D. J.: Climate
forcing by anthropogenic aerosols, Science, 255, 423–430,
doi:10.1126/science.255.5043.423, 1992.
Chen, Q., Liu, Y. J., Donahue, N. M., Shilling, J. E., and Mar-
tin, S. T.: Particle-phase chemistry of secondary organic mate-
rial: modeled compared to measured O : C and H : C elemental ra-
tios provide constraints, Environ. Sci. Technol., 45, 4763–4770,
doi:10.1021/es104398s, 2011.
Chhabra, P. S., Flagan, R. C., and Seinfeld, J. H.: Elemental analysis
of chamber organic aerosol using an aerodyne high-resolution
aerosol mass spectrometer, Atmos. Chem. Phys., 10, 4111–4131,
doi:10.5194/acp-10-4111-2010, 2010.
Chung, S. H. and Seinfeld, J. H.: Global distribution and climate
forcing of carbonaceous aerosols, J. Geophys. Res., 107, 4407,
doi:10.1029/2001JD001397, 2002.
Cocker, D. R., Mader, B. T., Kalberer, M., Flagan, R. C., and
Seinfeld, J. H.: The effect of water on gas-particle partition-
ing of secondary organic aerosol: II. M-xylene and 1,3,5-
trimethylbenzene photooxidation systems, Atmos. Environ., 35,
6073–6085, doi:10.1016/s1352-2310(01)00405-8, 2001.
Collaud Coen, M., Weingartner, E., Apituley, A., Ceburnis, D.,
Fierz-Schmidhauser, R., Flentje, H., Henzing, J. S., Jen-
nings, S. G., Moerman, M., Petzold, A., Schmid, O., and Bal-
tensperger, U.: Minimizing light absorption measurement arti-
facts of the Aethalometer: evaluation of five correction algo-
rithms, Atmos. Meas. Tech., 3, 457–474, doi:10.5194/amt-3-
457-2010, 2010.
DeCarlo, P. F., Kimmel, J. R., Trimborn, A., Northway, M. J.,
Jayne, J. T., Aiken, A. C., Gonin, M., Fuhrer, K., Horvath, T.,
Docherty, K. S., Worsnop, D. R., and Jimenez, J. L.: Field-
deployable, high-resolution, time-of-flight aerosol mass spec-
trometer, Anal. Chem., 78, 8281–8289, doi:10.1021/ac061249n,
2006.
de Gouw, J. A., Middlebrook, A. M., Warneke, C., Goldan, P. D.,
Kuster, W. C., Roberts, J. M., Fehsenfeld, F. C., Worsnop, D. R.,
Canagaratna, M. R., Pszenny, A. A. P., Keene, W. C.,
Marchewka, M., Bertman, S. B., and Bates, T. S.: Budget of
organic carbon in a polluted atmosphere: results from the New
England Air Quality Study in 2002, J. Geophys. Res.-Atmos.,
110, D16305, doi:10.1029/2004jd005623, 2005.
Denjean, C., Formenti, P., Picquet-Varrault, B., Katrib, Y., Pan-
gui, E., Zapf, P., and Doussin, J. F.: A new experimental approach
to study the hygroscopic and optical properties of aerosols: ap-
plication to ammonium sulfate particles, Atmos. Meas. Tech., 7,
183–197, doi:10.5194/amt-7-183-2014, 2014.
Denjean, C., Formenti, P., Picquet-Varrault, B., Camredon, M., Pan-
gui, E., Zapf, P., Katrib, Y., Giorio, C., Tapparo, A., Temime-
www.atmos-chem-phys.net/15/3339/2015/ Atmos. Chem. Phys., 15, 3339–3358, 2015
3354 C. Denjean et al.: Relating hygroscopicity and optical properties
Roussel, B., Monod, A., Aumont, B., and Doussin, J. F.: Aging
of secondary organic aerosol generated from the ozonolysis of
α-pinene: effects of ozone, light and temperature, Atmos. Chem.
Phys., 15, 883–897, doi:10.5194/acp-15-883-2015, 2015.
Dinar, E., Riziq, A. A., Spindler, C., Erlick, C., Kiss, G., and
Rudich, Y.: The complex refractive index of atmospheric and
model humic-like substances (HULIS) retrieved by a cavity ring
down aerosol spectrometer (CRD-AS), Faraday Discuss., 137,
279–295, doi:10.1039/b703111d, 2008.
Docherty, K. S., Wu, W., Lim, Y. B., and Ziemann, P. J.: Contri-
butions of organic peroxides to secondary aerosol formed from
reactions of monoterpenes with O3, Environ. Sci. Technol., 39,
4049–4059, doi:10.1021/es050228s, 2005.
Donahue, N. M., Henry, K. M., Mentel, T. F., Kiendler-Scharr, A.,
Spindler, C., Bohn, B., Brauers, T., Dorn, H. P., Fuchs, H., Till-
mann, R., Wahner, A., Saathoff, H., Naumann, K. H., Mohler, O.,
Leisner, T., Muller, L., Reinnig, M. C., Hoffmann, T., Salo, K.,
Hallquist, M., Frosch, M., Bilde, M., Tritscher, T., Barmet, P.,
Praplan, A. P., DeCarlo, P. F., Dommen, J., Prevot, A. S. H., and
Baltensperger, U.: Aging of biogenic secondary organic aerosol
via gas-phase OH radical reactions, P. Natl. Acad. Sci. USA, 109,
13503–13508, doi:10.1073/pnas.1115186109, 2012.
Duplissy, J., DeCarlo, P. F., Dommen, J., Alfarra, M. R., Met-
zger, A., Barmpadimos, I., Prevot, A. S. H., Weingartner, E.,
Tritscher, T., Gysel, M., Aiken, A. C., Jimenez, J. L., Cana-
garatna, M. R., Worsnop, D. R., Collins, D. R., Tomlinson, J.,
and Baltensperger, U.: Relating hygroscopicity and composition
of organic aerosol particulate matter, Atmos. Chem. Phys., 11,
1155–1165, doi:10.5194/acp-11-1155-2011, 2011.
Dusek, U., Reischl, G. P., and Hitzenberger, R.: CCN activation of
pure and coated carbon black particles, Environ. Sci. Technol.,
40, 1223–1230, 2006.
Flores, J. M., Zhao, D. F., Segev, L., Schlag, P., Kiendler-Scharr, A.,
Fuchs, H., Watne, Å. K., Bluvshtein, N., Mentel, Th. F., Hal-
lquist, M., and Rudich, Y.: Evolution of the complex refractive
index in the near UV spectral region in ageing secondary or-
ganic aerosol, Atmos. Chem. Phys. Discuss., 14, 4149–4187,
doi:10.5194/acpd-14-4149-2014, 2014.
Gao, S., Keywood, M., Ng, N. L., Surratt, J., Varutbangkul, V.,
Bahreini, R., Flagan, R. C., and Seinfeld, J. H.: Low-molecular-
weight and oligomeric components in secondary organic aerosol
from the ozonolysis of cycloalkenes and alpha-pinene, J. Phys.
Chem. A, 108, 10147–10164, doi:10.1021/jp047466e, 2004a.
Gao, S., Ng, N. L., Keywood, M., Varutbangkul, V., Bahreini, R.,
Nenes, A., He, J., Yoo, K. Y., Beauchamp, J. L., Hodyss, R. P.,
Flagan, R. C., and Seinfeld, J. H.: Particle phase acidity and
oligomer formation in secondary organic aerosol, Environ. Sci.
Technol., 38, 6582–6589, 2004b.
George, I. J. and Abbatt, J. P. D.: Chemical evolution of secondary
organic aerosol from OH-initiated heterogeneous oxidation, At-
mos. Chem. Phys., 10, 5551–5563, doi:10.5194/acp-10-5551-
2010, 2010.
Goldstein, A. H. and Galbally, I. E.: Known and unexplored organic
constituents in the Earth’s atmosphere, Geochim. Cosmochim.
Ac., 73, A449–A449, 2009.
Griffin, R. J., Cocker III, D. R., Seinfeld, J. H., and Dabdub, D.:
Estimate of global atmospheric organic aerosol from oxidation
of biogenic hydrocarbons, Geophys. Res. Lett., 26, 2721–2724,
1999.
Guenther, A., Hewitt, C. N., Erickson, D., Fall, R., Geron, C.,
Graedel, T., Harley, P., Klinger, L., Lerdau, M., Mckay, W. A.,
Pierce, T., Scholes, B., Steinbrecher, R., Tallamraju, R., Tay-
lor, J., and Zimmerman, P.: A global model of natural volatile
organic compound emissions, J. Geophys. Res., 100, 8873–8892,
1995.
Hallquist, M., Wenger, J. C., Baltensperger, U., Rudich, Y., Simp-
son, D., Claeys, M., Dommen, J., Donahue, N. M., George, C.,
Goldstein, A. H., Hamilton, J. F., Herrmann, H., Hoffmann, T.,
Iinuma, Y., Jang, M., Jenkin, M. E., Jimenez, J. L., Kiendler-
Scharr, A., Maenhaut, W., McFiggans, G., Mentel, Th. F.,
Monod, A., Prévôt, A. S. H., Seinfeld, J. H., Surratt, J. D.,
Szmigielski, R., and Wildt, J.: The formation, properties and im-
pact of secondary organic aerosol: current and emerging issues,
Atmos. Chem. Phys., 9, 5155–5236, doi:10.5194/acp-9-5155-
2009, 2009.
Hatch, C. D., Gierlus, K. M., Schuttlefield, J. D., and Gras-
sian, V. H.: Water adsorption and cloud condensation nu-
clei activity of calcite and calcite coated with model hu-
mic and fulvic acids, Atmos. Environ., 42, 5672–5684,
doi:10.1016/j.atmosenv.2008.03.005, 2008.
Haywood, J. M. and Ramaswamy, V.: Global sensitivity studies
of the direct radiative forcing due to anthropogenic sulfate and
black carbon aerosols, J. Geophys. Res., 103, 6043–6058, 1998.
Hegg, D., Larson, T., and Yuen, P. F.: A theoretical-study of
the effect of relative-humidity on light-scattering by tropo-
spheric aerosols, J. Geophys. Res.-Atmos., 98, 18435–18439,
doi:10.1029/93jd01928, 1993.
Henry, K. M. and Donahue, N. M.: Photochemical aging of
α-pinene secondary organic aerosol: effects of OH radical
sources and photolysis, J. Phys. Chem. A, 116, 5932–5940,
doi:10.1021/jp210288s, 2012.
Hoyle, C. R., Myhre, G., Berntsen, T. K., and Isaksen, I. S. A.: An-
thropogenic influence on SOA and the resulting radiative forcing,
Atmos. Chem. Phys., 9, 2715–2728, doi:10.5194/acp-9-2715-
2009, 2009.
Jang, M. and Kamens, R. M.: A thermodynamic approach for mod-
eling partitioning of semivolatile organic compounds on atmo-
spheric particulate matter: humidity effects, Environ. Sci. Tech-
nol., 32, 1237–1243, doi:10.1021/es970773w, 1998.
Jimenez, J. L., Canagaratna, M. R., Donahue, N. M., Prevot, A. S.
H., Zhang, Q., Kroll, J. H., DeCarlo, P. F., Allan, J. D., Coe,
H., Ng, N. L., Aiken, A. C., Docherty, K. S., Ulbrich, I. M.,
Grieshop, A. P., Robinson, A. L., Duplissy, J., Smith, J. D., Wil-
son, K. R., Lanz, V. A., Hueglin, C., Sun, Y. L., Tian, J., Laak-
sonen, A., Raatikainen, T., Rautiainen, J., Vaattovaara, P., Ehn,
M., Kulmala, M., Tomlinson, J. M., Collins, D. R., Cubison, M.
J., E., Dunlea, J., Huffman, J. A., Onasch, T. B., Alfarra, M. R.,
Williams, P. I., Bower, K., Kondo, Y., Schneider, J., Drewnick,
F., Borrmann, S., Weimer, S., Demerjian, K., Salcedo, D., Cot-
trell, L., Griffin, R., Takami, A., Miyoshi, T., Hatakeyama, S.,
Shimono, A., Sun, J. Y., Zhang, Y. M., Dzepina, K., Kimmel,
J. R., Sueper, D., Jayne, J. T., Herndon, S. C., Trimborn, A.
M., Williams, L. R., Wood, E. C., Middlebrook, A. M., Kolb,
C. E., Baltensperger, U., and Worsnop, D. R.: Evolution of Or-
ganic Aerosols in the Atmosphere, Science, 326, 1525–1529,
doi:10.1126/science.1180353, 2009.
Kanakidou, M., Seinfeld, J. H., Pandis, S. N., Barnes, I., Den-
tener, F. J., Facchini, M. C., Van Dingenen, R., Ervens, B.,
Atmos. Chem. Phys., 15, 3339–3358, 2015 www.atmos-chem-phys.net/15/3339/2015/
C. Denjean et al.: Relating hygroscopicity and optical properties 3355
Nenes, A., Nielsen, C. J., Swietlicki, E., Putaud, J. P., Balkan-
ski, Y., Fuzzi, S., Horth, J., Moortgat, G. K., Winterhalter, R.,
Myhre, C. E. L., Tsigaridis, K., Vignati, E., Stephanou, E. G.,
and Wilson, J.: Organic aerosol and global climate modelling: a
review, Atmos. Chem. Phys., 5, 1053–1123, doi:10.5194/acp-5-
1053-2005, 2005.
Kannosto, J., Yli-Pirila, P., Hao, L. Q., Leskinen, J., Jokiniemi, J.,
Makela, J. M., Joutsensaari, J., Laaksonen, A., Worsnop, D. R.,
Keskinen, J., and Virtanen, A.: Bounce characteristics of α-
pinene-derived SOA particles with implications to physical
phase, Boreal Environ. Res., 18, 329–340, 2013.
Katrib, Y., Martin, S. T., Rudich, Y., Davidovits, P., Jayne, J. T.,
and Worsnop, D. R.: Density changes of aerosol particles as a
result of chemical reaction, Atmos. Chem. Phys., 5, 275–291,
doi:10.5194/acp-5-275-2005, 2005.
Kavouras, I. G., Mihalopoulos, N., and Stephanou, E. G.: Formation
of atmospheric particles from organic acids produced by forests,
Nature, 395, 683–686, 1998.
Kavouras, I. G., Mihalopoulos, N., and Stephanou, E. G.: For-
mation and gas/particle partitioning of monoterpenes photo-
oxidation products over forests, Geophys. Res. Lett., 26, 55–58,
doi:10.1029/1998gl900251, 1999.
Kim, H. and Paulson, S. E.: Real refractive indices and volatility
of secondary organic aerosol generated from photooxidation and
ozonolysis of limonene, α-pinene and toluene, Atmos. Chem.
Phys., 13, 7711–7723, doi:10.5194/acp-13-7711-2013, 2013.
Kim, H., Barkey, B., and Paulson, S. E.: Real refractive indices of
α- and β-pinene and toluene secondary organic aerosols gener-
ated from ozonolysis and photo-oxidation, J. Geophys. Res., 115,
D24212, doi:10.1029/2010JD014549, 2010.
Kinne, S., Lohmann, U., Feichter, J., Schulz, M., Timmreck, C.,
Ghan, S., Easter, R., Chin, M., Ginoux, P., Takemura, T.,
Tegen, I., Koch, D., Herzog, M., Penner, J., Pitari, G., Hol-
ben, B., Eck, T., Smirnov, A., Dubovik, O., Slutsker, I.,
Tanre, D., Torres, O., Mishchenko, M., Geogdzhayev, I.,
Chu, D. A., and Kaufman, Y.: Monthly averages of aerosol prop-
erties: a global comparison among models, satellite data, and
AERONET ground data, J. Geophys. Res.-Atmos., 108, 4634,
doi:10.1029/2001jd001253, 2003.
Koop, T., Bookhold, J., Shiraiwa, M., and Pöschl, U.: Glass tran-
sition and phase state of organic compounds: dependency on
molecular properties and implications for secondary organic
aerosols in the atmosphere, Phys. Chem. Chem. Phys., 13,
19238–19255, doi:10.1039/C1CP22617G, 2011.
Kroll, J. H. and Seinfeld, J. H.: Chemistry of secondary or-
ganic aerosol: formation and evolution of low-volatility or-
ganics in the atmosphere, Atmos. Environ., 42, 3593–3624,
doi:10.1016/j.atmosenv.2008.01.003, 2008.
Lambe, A. T., Onasch, T. B., Massoli, P., Croasdale, D. R., Wright,
J. P., Ahern, A. T., Williams, L. R., Worsnop, D. R., Brune, W. H.,
and Davidovits, P.: Laboratory studies of the chemical composi-
tion and cloud condensation nuclei (CCN) activity of secondary
organic aerosol (SOA) and oxidized primary organic aerosol
(OPOA), Atmos. Chem. Phys., 11, 8913–8928, doi:10.5194/acp-
11-8913-2011, 2011.
Lambe, A. T., Cappa, C. D., Massoli, P., Onasch, T. B.,
Forestieri, S. D., Martin, A. T., Cummings, M. J., Croas-
dale, D. R., Brune, W. H., Worsnop, D. R., and Davidovits, P.:
Relationship between oxidation level and optical properties of
secondary organic aerosol, Environ. Sci. Technol., 47, 6349–
6357, doi:10.1021/es401043j, 2013.
Lang-Yona, N., Rudich, Y., Mentel, Th. F., Bohne, A., Buchholz, A.,
Kiendler-Scharr, A., Kleist, E., Spindler, C., Tillmann, R., and
Wildt, J.: The chemical and microphysical properties of sec-
ondary organic aerosols from Holm Oak emissions, Atmos.
Chem. Phys., 10, 7253–7265, doi:10.5194/acp-10-7253-2010,
2010.
Liu, P., Zhang, Y., and Martin, S. T.: Complex refractive indices
of thin films of secondary organic materials by spectroscopic
ellipsometry from 220 to 1200 nm, Environ. Sci. Technol., 47,
13594–13601, doi:10.1021/es403411e, 2013.
Liu, Y. G. and Daum, P. H.: Relationship of refractive index to mass
density and self-consistency of mixing rules for multicomponent
mixtures like ambient aerosols, J. Aerosol Sci., 39, 974–986,
doi:10.1016/j.jaerosci.2008.06.006, 2008.
Lohmann, U. and Feichter, J.: Global indirect aerosol effects: a re-
view, Atmos. Chem. Phys., 5, 715–737, doi:10.5194/acp-5-715-
2005, 2005.
Martin, S. T.: Phase transitions of aqueous atmospheric particles,
Chem. Rev., 100, 3403–3453, doi:10.1021/cr990034t, 2000.
Martin, S. T., Andreae, M. O., Althausen, D., Artaxo, P., Baars, H.,
Borrmann, S., Chen, Q., Farmer, D. K., Guenther, A., Gunthe,
S. S., Jimenez, J. L., Karl, T., Longo, K., Manzi, A., Müller, T.,
Pauliquevis, T., Petters, M. D., Prenni, A. J., Pöschl, U., Rizzo,
L. V., Schneider, J., Smith, J. N., Swietlicki, E., Tota, J., Wang,
J., Wiedensohler, A., and Zorn, S. R.: An overview of the Ama-
zonian Aerosol Characterization Experiment 2008 (AMAZE-
08), Atmos. Chem. Phys., 10, 11415–11438, doi:10.5194/acp-
10-11415-2010, 2010.
Massoli, P., Lambe, A. T., Ahern, A. T., Williams, L. R., Ehn, M.,
Mikkilä, J., Canagaratna, M. R., Brune, W. H., Onasch, T. B.,
Jayne, J. T., Petäjä, T., Kulmala, M., Laaksonen, A., Kolb, C. E.,
Davidovits, P., and Worsnop, D. R.: Relationship between
aerosol oxidation level and hygroscopic properties of laboratory
generated secondary organic aerosol (SOA) particles, Geophys.
Res. Lett., 37, L24801, doi:10.1029/2010GL045258, 2010.
Matsumoto, K., Tanaka, H., Nagao, I., and Ishizaka, Y.: Contribu-
tion of particulate sulfate and organic carbon to cloud conden-
sation nuclei in the marine atmosphere, Geophys. Res. Lett., 24,
655–658, doi:10.1029/97gl00541, 1997.
McFiggans, G., Artaxo, P., Baltensperger, U., Coe, H., Fac-
chini, M. C., Feingold, G., Fuzzi, S., Gysel, M., Laaksonen, A.,
Lohmann, U., Mentel, T. F., Murphy, D. M., O’Dowd, C. D.,
Snider, J. R., and Weingartner, E.: The effect of physical and
chemical aerosol properties on warm cloud droplet activation,
Atmos. Chem. Phys., 6, 2593–2649, doi:10.5194/acp-6-2593-
2006, 2006.
McIntire, T. M., Ryder, O. S., Gassman, P. L., Zhu, Z., Ghosal, S.,
and Finlayson-Pitts, B. J.: Why ozonolysis may not increase
the hydrophilicity of particles, Atmos. Environ., 44, 939–944,
doi:10.1016/j.atmosenv.2009.11.009, 2010.
Mei, F., Setyan, A., Zhang, Q., and Wang, J.: CCN activ-
ity of organic aerosols observed downwind of urban emis-
sions during CARES, Atmos. Chem. Phys., 13, 12155–12169,
doi:10.5194/acp-13-12155-2013, 2013.
Meyer, N. K., Duplissy, J., Gysel, M., Metzger, A., Dommen, J.,
Weingartner, E., Alfarra, M. R., Prevot, A. S. H., Fletcher, C.,
Good, N., McFiggans, G., Jonsson, Å. M., Hallquist, M., Bal-
www.atmos-chem-phys.net/15/3339/2015/ Atmos. Chem. Phys., 15, 3339–3358, 2015
3356 C. Denjean et al.: Relating hygroscopicity and optical properties
tensperger, U., and Ristovski, Z. D.: Analysis of the hygro-
scopic and volatile properties of ammonium sulphate seeded
and unseeded SOA particles, Atmos. Chem. Phys., 9, 721–732,
doi:10.5194/acp-9-721-2009, 2009.
Mikhailov, E., Vlasenko, S., Martin, S. T., Koop, T., and Pöschl, U.:
Amorphous and crystalline aerosol particles interacting with
water vapor: conceptual framework and experimental evidence
for restructuring, phase transitions and kinetic limitations, At-
mos. Chem. Phys., 9, 9491–9522, doi:10.5194/acp-9-9491-2009,
2009.
Moise, T. and Rudich, Y.: Reactive uptake of ozone by
aerosol-associated unsaturated fatty acids: kinetics, mecha-
nism, and products, J. Phys. Chem. A, 106, 6469–6476,
doi:10.1021/jp025597e, 2002.
Moussa, S. G., McIntire, T. M., Szori, M., Roeselová, M., To-
bias, D. J., Grimm, R. L., Hemminger, J. C., and Finlayson-
Pitts, B. J.: Experimental and theoretical characterization of ad-
sorbed water on self-assembled monolayers: understanding the
interaction of water with atmospherically relevant surfaces†, J.
Phys. Chem. A, 113, 2060–2069, doi:10.1021/jp808710n, 2009.
Müller, T., Laborde, M., Kassell, G., and Wiedensohler, A.: Design
and performance of a three-wavelength LED-based total scatter
and backscatter integrating nephelometer, Atmos. Meas. Tech.,
4, 1291–1303, doi:10.5194/amt-4-1291-2011, 2011.
Müller, L., Reinnig, M.-C., Naumann, K. H., Saathoff, H.,
Mentel, T. F., Donahue, N. M., and Hoffmann, T.: Formation
of 3-methyl-1,2,3-butanetricarboxylic acid via gas phase oxida-
tion of pinonic acid – a mass spectrometric study of SOA aging,
Atmos. Chem. Phys., 12, 1483–1496, doi:10.5194/acp-12-1483-
2012, 2012.
Murray, B. J.: Inhibition of ice crystallisation in highly viscous
aqueous organic acid droplets, Atmos. Chem. Phys., 8, 5423–
5433, doi:10.5194/acp-8-5423-2008, 2008.
Nakayama, T., Matsumi, Y., Sato, K., Imamura, T., Yamazaki, A.,
and Uchiyama, A.: Laboratory studies on optical properties of
secondary organic aerosols generated during the photooxidation
of toluene and the ozonolysis of alpha-pinene, J. Geophys. Res.-
Atmos., 115, D24204, doi:10.1029/2010jd014387, 2010.
Nakayama, T., Sato, K., Matsumi, Y., Imamura, T., Yamazaki, A.,
and Uchiyama, A.: Wavelength dependence of refractive in-
dex of secondary organic aerosols generated during the
ozonolysis and photooxidation of α-pinene, Sola, 8, 119–123,
doi:10.2151/sola.2012-030, 2012.
Nakayama, T., Sato, K., Matsumi, Y., Imamura, T., Yamazaki, A.,
and Uchiyama, A.: Wavelength and NOx dependent complex re-
fractive index of SOAs generated from the photooxidation of
toluene, Atmos. Chem. Phys., 13, 531–545, doi:10.5194/acp-13-
531-2013, 2013.
Nemesure, S., Wagener, R., and Schwartz, S. E.: Direct shortwave
forcing of climate by the anthropogenic sulfate aerosol: sensitiv-
ity to particle size, composition, and relative humidity, J. Geo-
phys. Res.-Atmos., 100, 26105–26116, doi:10.1029/95jd02897,
1995.
Ng, N. L., Canagaratna, M. R., Zhang, Q., Jimenez, J. L., Tian, J.,
Ulbrich, I. M., Kroll, J. H., Docherty, K. S., Chhabra, P. S.,
Bahreini, R., Murphy, S. M., Seinfeld, J. H., Hildebrandt, L.,
Donahue, N. M., DeCarlo, P. F., Lanz, V. A., Prévôt, A. S. H.,
Dinar, E., Rudich, Y., and Worsnop, D. R.: Organic aerosol
components observed in Northern Hemispheric datasets from
Aerosol Mass Spectrometry, Atmos. Chem. Phys., 10, 4625–
4641, doi:10.5194/acp-10-4625-2010, 2010.
Novakov, T. and Penner, J. E.: Large contribution of organic
aerosols to cloud-condensation-nuclei, Nature, 365, 823–826,
doi:10.1038/365823a0, 1993.
O’Donnell, D., Tsigaridis, K., and Feichter, J.: Estimating the
direct and indirect effects of secondary organic aerosols us-
ing ECHAM5-HAM, Atmos. Chem. Phys., 11, 8635–8659,
doi:10.5194/acp-11-8635-2011, 2011.
Orr Jr., C., Hurd, F. K., and Corbett, W. J.: Aerosol size and
relative humidity, J. Coll. Sci. Imp. U. Tok., 13, 472–482,
doi:10.1016/0095-8522(58)90055-2, 1958.
Pajunoja, A., Malila, J., Hao, L. Q., Joutsensaari, J., Lehti-
nen, K. E. J., and Virtanen, A.: Estimating the viscosity range
of SOA particles based on their coalescence time, Aerosol Sci.
Tech., 48, I–IV, doi:10.1080/02786826.2013.870325, 2014.
Pankow, J. F., Storey, J. M. E., and Yamasaki, H.: Effects of relative-
humidity on gas-particle partitioning of semivolatile organic-
compounds to urban particulate matter, Environ. Sci. Technol.,
27, 2220–2226, doi:10.1021/es00047a032, 1993.
Pankow, J. F. and Asher, W. E.: SIMPOL.1: a simple group
contribution method for predicting vapor pressures and en-
thalpies of vaporization of multifunctional organic compounds,
Atmos. Chem. Phys., 8, 2773–2796, doi:10.5194/acp-8-2773-
2008, 2008.
Paulson, S. E., Chung, M., Sen, A. D., and Orzechowska, G.: Mea-
surement of OH radical formation from the reaction of ozone
with several biogenic alkenes, J. Geophys. Res.-Atmos., 103,
25533–25539, doi:10.1029/98jd01951, 1998.
Pere, J. C., Mallet, M., Pont, V., and Bessagnet, B.: Impact of
aerosol direct radiative forcing on the radiative budget, surface
heat fluxes, and atmospheric dynamics during the heat wave of
summer 2003 over western Europe: a modeling study, J. Geo-
phys. Res.-Atmos., 116, D23119, doi:10.1029/2011jd016240,
2011.
Perraud, V., Bruns, E. A., Ezell, M. J., Johnson, S. N., Yu, Y.,
Alexander, M. L., Zelenyuk, A., Imre, D., Chang, W. L.,
Dabdub, D., Pankow, J. F., and Finlayson-Pitts, B. J.:
Nonequilibrium atmospheric secondary organic aerosol forma-
tion and growth, P. Natl. Acad. Sci. USA, 109, 2836–2841,
doi:10.1073/pnas.1119909109, 2012.
Petters, M. D. and Kreidenweis, S. M.: A single parameter repre-
sentation of hygroscopic growth and cloud condensation nucleus
activity, Atmos. Chem. Phys., 7, 1961–1971, doi:10.5194/acp-7-
1961-2007, 2007.
Prenni, A. J., DeMott, P. J., and Kreidenweis, S. M.: Water uptake
of internally mixed particles containing ammonium sulfate and
dicarboxylic acids, Atmos. Environ., 37, 4243–4251, 2003.
Qi, L.: Can secondary organic aerosol formed in an atmospheric
simulation chamber continuously age?, Atmos. Environ., 44,
2990–2996, 2010.
Qi, L., Nakao, S., and Cocker, D. R.: Aging of secondary or-
ganic aerosol from α-pinene ozonolysis: roles of hydroxyl
and nitrate radicals, J. Air Waste Manage., 62, 1359–1369,
doi:10.1080/10962247.2012.712082, 2012.
Redmond, H. and Thompson, J. E.: Evaluation of a quan-
titative structure–property relationship (QSPR) for pre-
dicting mid-visible refractive index of secondary organic
Atmos. Chem. Phys., 15, 3339–3358, 2015 www.atmos-chem-phys.net/15/3339/2015/
C. Denjean et al.: Relating hygroscopicity and optical properties 3357
aerosol (SOA), Phys. Chem. Chem. Phys., 13, 6872–6882,
doi:10.1039/c0cp02270e, 2011.
Reinhardt, A., Emmenegger, C., Gerrits, B., Panse, C., Dommen, J.,
Baltensperger, U., Zenobi, R., and Kalberer, M.: Ultrahigh mass
resolution and accurate mass measurements as a tool to charac-
terize oligomers in secondary organic aerosols, Anal. Chem., 79,
4074–4082, doi:10.1021/ac062425v, 2007.
Renbaum-Wolff, L., Grayson, J. W., Bateman, A. P., Kuwata, M.,
Sellier, M., Murray, B. J., Shilling, J. E., Martin, S. T., and
Bertram, A. K.: Viscosity of α-pinene secondary organic material
and implications for particle growth and reactivity, P. Natl. Acad.
Sci. USA, 110, 8014–8019, doi:10.1073/pnas.1219548110,
2013.
Rickards, A. M. J., Miles, R. E. H., Davies, J. F., Marshall, F. H., and
Reid, J. P.: Measurements of the Sensitivity of Aerosol Hygro-
scopicity and the κ Parameter to the O/C Ratio, J. Phys. Chem.
A, 117, 14120–14131, doi:10.1021/jp407991n, 2013.
RiveraCarpio, C. A., Corrigan, C. E., Novakov, T., Penner, J. E.,
Rogers, C. F., and Chow, J. C.: Derivation of contributions of
sulfate and carbonaceous aerosols to cloud condensation nu-
clei from mass size distributions, J. Geophys. Res.-Atmos., 101,
19483–19493, doi:10.1029/95jd01077, 1996.
Roth, C. M., Goss, K. U., and Schwarzenbach, R. P.: Sorption of
a diverse set of organic vapors to urban aerosols, Environ. Sci.
Technol., 39, 6638–6643, doi:10.1021/es0503837, 2005.
Rudich, Y., Donahue, N. M., and Mentel, T. F.: Aging of organic
aerosol: bridging the gap between laboratory and field studies,
Annu. Rev. Phys. Chem., Annual Reviews, Palo Alto, 321–352,
2007.
Saathoff, H., Naumann, K.-H., Schnaiter, M., Schöck, W., Möh-
ler, O., Schurath, U., Weingartner, E., Gysel, M., and Bal-
tensperger, U.: Coating of soot and (NH4)2SO4 particles by
ozonolysis products of [α]-pinene, J. Aerosol Sci., 34, 1297–
1321, 2003.
Saathoff, H., Naumann, K.-H., Möhler, O., Jonsson, Å. M., Hal-
lquist, M., Kiendler-Scharr, A., Mentel, Th. F., Tillmann, R., and
Schurath, U.: Temperature dependence of yields of secondary or-
ganic aerosols from the ozonolysis of α-pinene and limonene,
Atmos. Chem. Phys., 9, 1551–1577, doi:10.5194/acp-9-1551-
2009, 2009.
Sato, K., Takami, A., Kato, Y., Seta, T., Fujitani, Y., Hikida, T., Shi-
mono, A., and Imamura, T.: AMS and LC/MS analyses of SOA
from the photooxidation of benzene and 1,3,5-trimethylbenzene
in the presence of NOx: effects of chemical structure on SOA
aging, Atmos. Chem. Phys., 12, 4667–4682, doi:10.5194/acp-12-
4667-2012, 2012.
Saukko, E., Lambe, A. T., Massoli, P., Koop, T., Wright, J. P., Croas-
dale, D. R., Pedernera, D. A., Onasch, T. B., Laaksonen, A.,
Davidovits, P., Worsnop, D. R., and Virtanen, A.: Humidity-
dependent phase state of SOA particles from biogenic and an-
thropogenic precursors, Atmos. Chem. Phys., 12, 7517–7529,
doi:10.5194/acp-12-7517-2012, 2012.
Saunders, S. M., Jenkin, M. E., Derwent, R. G., and Pilling, M. J.:
Protocol for the development of the Master Chemical Mech-
anism, MCM v3 (Part A): tropospheric degradation of non-
aromatic volatile organic compounds, Atmos. Chem. Phys., 3,
161–180, doi:10.5194/acp-3-161-2003, 2003.
Saxena, P., Hildemann, L. M., McMurry, P. H., and Seinfeld, J. H.:
Organics alter hygroscopic behavior of atmospheric particles, J.
Geophys. Res., 100, 18755–18770, 1995.
Schnaiter, M., Horvath, H., Möhler, O., Naumann, K.-H.,
Saathoff, H., and Schöck, O. W.: UV-VIS-NIR spectral optical
properties of soot and soot-containing aerosols, J. Aerosol Sci.,
34, 1421–1444, 2003.
Semeniuk, T. A., Wise, M. E., Martin, S. T., Russell, L. M., and
Buseck, P. R.: Water uptake characteristics of individual atmo-
spheric particles having coatings, Atmos. Environ., 41, 6225–
6235, 2007.
Shilling, J. E., Chen, Q., King, S. M., Rosenoern, T., Kroll, J. H.,
Worsnop, D. R., McKinney, K. A., and Martin, S. T.: Particle
mass yield in secondary organic aerosol formed by the dark
ozonolysis of α-pinene, Atmos. Chem. Phys., 8, 2073–2088,
doi:10.5194/acp-8-2073-2008, 2008.
Shiraiwa, M., Yee, L. D., Schilling, K. A., Loza, C. L., Craven, J. S.,
Zuend, A., Ziemann, P. J., and Seinfeld, J. H.: Size dis-
tribution dynamics reveal particle-phase chemistry in organic
aerosol formation, P. Natl. Acad. Sci. USA, 110, 11746–11750,
doi:10.1073/pnas.1307501110, 2013.
Suda, S. R., Petters, M. D., Matsunaga, A., Sullivan, R. C., Zie-
mann, P. J., and Kreidenweis, S. M.: Hygroscopicity frequency
distributions of secondary organic aerosols, J. Geophys. Res.-
Atmos., 117, D04207, doi:10.1029/2011jd016823, 2012.
Tolocka, M. P., Jang, M., Ginter, J. M., Cox, F. J., Ka-
mens, R. M., and Johnston, M. V.: Formation of oligomers in sec-
ondary organic aerosol, Environ. Sci. Technol., 38, 1428–1434,
doi:10.1021/es035030r, 2004.
Tolocka, M. P., Heaton, K. J., Dreyfus, M. A., Wang, S. Y., Zor-
dan, C. A., Saul, T. D., and Johnston, M. V.: Chemistry of particle
inception and growth during alpha-pinene ozonolysis, Environ.
Sci. Technol., 40, 1843–1848, doi:10.1021/es051926f, 2006.
Tost, H. and Pringle, K. J.: Improvements of organic aerosol rep-
resentations and their effects in large-scale atmospheric models,
Atmos. Chem. Phys., 12, 8687–8709, doi:10.5194/acp-12-8687-
2012, 2012.
Tritscher, T., Dommen, J., DeCarlo, P. F., Gysel, M., Barmet, P. B.,
Praplan, A. P., Weingartner, E., Prévôt, A. S. H., Riipinen, I.,
Donahue, N. M., and Baltensperger, U.: Volatility and hygro-
scopicity of aging secondary organic aerosol in a smog cham-
ber, Atmos. Chem. Phys., 11, 11477–11496, doi:10.5194/acp-11-
11477-2011, 2011.
Turpin, B. J. and Huntzicker, J. J.: Identification of secondary or-
ganic aerosol episodes and quantitation of primary and secondary
organic aerosol concentrations during scaqs, Atmos. Environ.,
29, 3527–3544, doi:10.1016/1352-2310(94)00276-q, 1995.
Vaden, T. D., Song, C., Zaveri, R. A., Imre, D., and Zelenyuk, A.:
Morphology of mixed primary and secondary organic par-
ticles and the adsorption of spectator organic gases during
aerosol formation, P. Natl. Acad. Sci. USA, 107, 6658–6663,
doi:10.1073/pnas.0911206107, 2010.
Vaden, T. D., Imre, D., Beránek, J., Shrivastava, M., and Ze-
lenyuk, A.: Evaporation kinetics and phase of laboratory and am-
bient secondary organic aerosol, P. Natl. Acad. Sci. USA, 108,
2190–2195, doi:10.1073/pnas.1013391108, 2011.
Virtanen, A., Kannosto, J., Kuuluvainen, H., Arffman, A., Jout-
sensaari, J., Saukko, E., Hao, L., Yli-Pirilä, P., Tiitta, P.,
Holopainen, J. K., Keskinen, J., Worsnop, D. R., Smith, J. N.,
www.atmos-chem-phys.net/15/3339/2015/ Atmos. Chem. Phys., 15, 3339–3358, 2015
3358 C. Denjean et al.: Relating hygroscopicity and optical properties
and Laaksonen, A.: Bounce behavior of freshly nucleated bio-
genic secondary organic aerosol particles, Atmos. Chem. Phys.,
11, 8759–8766, doi:10.5194/acp-11-8759-2011, 2011.
Wang, J., Doussin, J. F., Perrier, S., Perraudin, E., Katrib, Y., Pan-
gui, E., and Picquet-Varrault, B.: Design of a new multi-phase
experimental simulation chamber for atmospheric photosmog,
aerosol and cloud chemistry research, Atmos. Meas. Tech., 4,
2465–2494, doi:10.5194/amt-4-2465-2011, 2011.
Warren, B., Austin, R. L., and Cocker III, D. R.: Temperature depen-
dence of secondary organic aerosol, Atmos. Environ., 43, 3548–
3555, 2009.
Weingartner, E., Saathoff, H., Schnaiter, M., Streit, N., Bitnar, B.,
and Baltensperger, U.: Absorption of light by soot particles: de-
termination of the absorption coefficient by means of aethalome-
ters, J. Aerosol Sci., 34, 1445–1463, 2003.
Wex, H., Petters, M. D., Carrico, C. M., Hallbauer, E., Massling, A.,
McMeeking, G. R., Poulain, L., Wu, Z., Kreidenweis, S. M.,
and Stratmann, F.: Towards closing the gap between hygroscopic
growth and activation for secondary organic aerosol: Part 1 – Ev-
idence from measurements, Atmos. Chem. Phys., 9, 3987–3997,
doi:10.5194/acp-9-3987-2009, 2009.
Wong, J. P. S., Lee, A. K. Y., Slowik, J. G., Cziczo, D. J., Leaitch,
W. R., Macdonald, A., and Abbatt, J. P. D.: Oxidation of ambient
biogenic secondary organic aerosol by hydroxyl radicals: Effects
on cloud condensation nuclei activity, Geophys. Res. Lett., 38,
L22805, 10.1029/2011GL049351, 2011.
Yasmeen, F., Vermeylen, R., Maurin, N., Perraudin, E., Doussin,
J. F., and Claeys, M.: Characterisation of tracers for aging of
alpha-pinene secondary organic aerosol using liquid chromatog-
raphy/negative ion electrospray ionisation mass spectrometry,
Environ. Chem., 9, 236–246, doi:10.1071/en11148, 2012.
Yu, J. Z., Griffin, R. J., Cocker, D. R., Flagan, R. C., Seinfeld, J. H.,
and Blanchard, P.: Observation of gaseous and particulate prod-
ucts of monoterpene oxidation in forest atmospheres, Geophys.
Res. Lett., 26, 1145–1148, doi:10.1029/1999gl900169, 1999.
Zaveri, R. A., Barnard, J. C., Easter, R. C., Riemer, N.,
and West, M.: Particle-resolved simulation of aerosol size,
composition, mixing state, and the associated optical and
cloud condensation nuclei activation properties in an evolv-
ing urban plume, J. Geophys. Res.-Atmos., 115, D17210,
doi:10.1029/2009jd013616, 2010.
Zelenyuk, A., Yang, J., Song, C., Zaveri, R. A., and Imre, D.:
A new real-time method for determining particles’ sphericity
and density: application to secondary organic aerosol formed by
ozonolysis of α-pinene, Environ. Sci. Technol., 42, 8033–8038,
doi:10.1021/es8013562, 2008.
Zhang, Q., Jimenez, J. L., Canagaratna, M. R., Allan, J. D.,
Coe, H., Ulbrich, I., Alfarra, M. R., Takami, A., Middle-
brook, A. M., Sun, Y. L., Dzepina, K., Dunlea, E., Docherty, K.,
DeCarlo, P. F., Salcedo, D., Onasch, T., Jayne, J. T., Miyoshi, T.,
Shimono, A., Hatakeyama, S., Takegawa, N., Kondo, Y., Schnei-
der, J., Drewnick, F., Borrmann, S., Weimer, S., Demer-
jian, K., Williams, P., Bower, K., Bahreini, R., Cottrell, L.,
Griffin, R. J., Rautiainen, J., Sun, J. Y., Zhang, Y. M., and
Worsnop, D. R.: Ubiquity and dominance of oxygenated species
in organic aerosols in anthropogenically-influenced Northern
Hemisphere midlatitudes, Geophys. Res. Lett., 34, L13801,
doi:10.1029/2007gl029979, 2007.
Ziemann, P. J. and Atkinson, R.: Kinetics, products, and mecha-
nisms of secondary organic aerosol formation, Chem. Soc. Rev.,
41, 6582–6605, doi:10.1039/C2CS35122F, 2012.
Zobrist, B., Soonsin, V., Luo, B. P., Krieger, U. K., Marcolli, C.,
Peter, T., and Koop, T.: Ultra-slow water diffusion in aque-
ous sucrose glasses, Phys. Chem. Chem. Phys., 13, 3514–3526,
doi:10.1039/c0cp01273d, 2011.
Atmos. Chem. Phys., 15, 3339–3358, 2015 www.atmos-chem-phys.net/15/3339/2015/