QUT Digital Repository: · 2 immobilized on SiO2 and subjected to thermal decomposition, the POSSh...
29
QUT Digital Repository: http://eprints.qut.edu.au/ Bianchini, Daniela and Butler, Ian S. and Barsan, Mirela M. and Martens, Wayde N. and Frost, Ray L. and Galland, Griselda B. and dos Santos, Joao Henrique Z. (2008) Thermal decomposition studies of the polyhedral oligomeric silsesquioxane, POSSh, and when it is impregnated with the metallocene bis(η5- cyclopentadienyl)zirconium(IV) dichloride or immobilized on silica . Spectrochimica Acta Part A: Molecular and Biomolecular Spectroscopy 71(1):pp. 45-52. © Copyright 2008 Elsevier
Transcript of QUT Digital Repository: · 2 immobilized on SiO2 and subjected to thermal decomposition, the POSSh...
QUT Digital Repository: http://eprints.qut.edu.au/
Bianchini, Daniela and Butler, Ian S. and Barsan, Mirela M. and Martens, Wayde N. and Frost, Ray L. and Galland, Griselda B. and dos Santos, Joao Henrique Z. (2008) Thermal decomposition studies of the polyhedral oligomeric silsesquioxane, POSSh, and when it is impregnated with the metallocene bis(η5-cyclopentadienyl)zirconium(IV) dichloride or immobilized on silica . Spectrochimica Acta Part A: Molecular and Biomolecular Spectroscopy 71(1):pp. 45-52.
© Copyright 2008 Elsevier
1
Thermal decomposition studies of the polyhedral oligomeric silsesquioxane, POSSh,
and when it is impregnated with the metallocene bis(η5-
cyclopentadienyl)zirconium(IV) dichloride or immobilized on silica
D. Bianchinic, I.S. Butlera,1, M.M Barsana, W. Martensb, R.L. Frostb, G.B. Gallandc,
J.H.Z. dos Santosc
a McGill University, Department of Chemistry, 801 Sherbrooke St. West, Montréal, Québec, H3A
2K6, Canada
b Queensland University of Technology, Inorganic Materials Research Program, School of
Physical and Chemical Sciences, GPO Box 2434, Brisbane, Queensland 4001, Australia
c Universidade Federal do Rio Grande do Sul, Instituto de Química, Av. Bento Gonçalves 9500,
91501-970, Porto Alegre, Rio Grande do Sul, Brazil
Abstract
Thermal decomposition studies of the free polyhedral oligomeric silsesquioxane, POSSh, and
when this species has been impregnated with Cp2ZrCl2 (Cp = η5-C5H5) or immobilized on SiO2
were conducted using infrared emission spectroscopy (IES) over a 100-1000 oC temperature
range and by thermogravimetric analysis (TGA). The organic groups in POSSh apparently
decompose thermally into Si-CH3, Si-H and other fragments. Upon impregnation with Cp2ZrCl2
however, a different thermal decomposition pathway was followed and new infrared emission
bands appeared in the 1000-900 cm-1 region suggesting the formation of Si-O-Zr moieties. When
1 Corresponding author: I.S. Butler; Tel: +1-514-398-6910; fax +1-514-398-3797; e-mail address: [email protected]
2
immobilized on SiO2 and subjected to thermal decomposition, the POSSh species lost its organic
groups and the inorganic structure remaining was incorporated into the SiO2 framework.
Keywords: Polyhedral oligomeric silsesquioxane, Cp2ZrCl2, SiO2, Infrared emission
spectroscopy, Thermogravimetric analysis
1. Introduction
Metallocene catalysts, such as Cp2ZrCl2 (Cp = η5-C5H5), have recently become increasingly
important as catalytic precursors in the polymerization of α-olefins. Catalytic systems produced
by combining metallocenes with a co-catalyst (usually, methylaluminoxane) are highly active and
the properties of the resulting polymer can be readily tailored to fit specific needs. The
commercial success of metallocene-based catalytic systems in α-olefin polymerizations is,
however, dependent on their ability to function efficiently in currently operating industrial
polymerization plants. These plants utilize slurry or gas-phase processes based on heterogeneous
Ziegler-Natta catalysts. The soluble metallocenes often have to be modified appreciably before
they can be used in the production of polyolefins on an industrial scale. Another way in which
metallocene catalysts can be employed in such processes is to immobilize them on supports such
as SiO2 [1]. Unfortunately, owing to the activation temperatures of the supports and the
immobilization methods used, unwanted inactive species are formed on the catalytic surfaces
leading to diminished activity. Earlier research on metallocene catalysts immobilized on
methylaluminoxane or organosilane-modified silicas [2]-[4] has led to a marked improvement in
catalytic activity. In particular, immobilization of metallocene catalysts on polyhedral oligomeric
3
silsesquioxane (POSS)-modified silica surfaces [5] enhances catalytic activity significantly when
compared to immobilization on SiO2 itself.
POSS structures are based on tetrahedral arrangements (T) consisting of a Si atom bound to three
O atoms and an organic moiety (R). These tetrahedral units form either condensed or non-
condensed polyhedral structures [6]. Usually, POSS species are a mixture of octahedral (T8),
nonahedral [T9(OH)] and decahedral (T10) condensed structures. The POSS species used in the
present study, POSSh, has (β-hydroxyl)-tertiary amines as R groups and the metallocene
investigated was Cp2ZrCl2. In attempting to understand the role of POSSh in enhancing the
catalytic activity of Cp2ZrCl2 immobilized on POSS-modified silica, characterization of
Cp2ZrCl2:POSSh and POSSh:SiO2 is crucial. The thermal stabilities of these systems are of
particular interest since the catalyst will be subjected to high temperatures during the α-olefin
polymerization reactions. In our previous work [7], we presented evidence for interactions
between Cp2ZrCl2 and two POSS systems, POSSh and POSSu. The focus of the present paper is
an investigation of the thermal stabilities of Cp2ZrCl2:POSSh and POSSh:SiO2 by infrared
emission spectroscopy (IES) and thermogravimetric analysis (TGA).
2. Experimental
2.1. Materials
POSSh was synthesized according to the literature method [5]. Silica (SiO2) Grace 948 (255 m2
g-1) was activated under vacuum (< 10-4 mbar) at 450oC for 16 h. The Cp2ZrCl2 catalyst (99%
purity) was purchased from Strem Chemical Co. (USA) and was used without further
purification. Purum-grade toluene was obtained from EMD (USA) and was dried by standard
4
techniques prior to utilization. All the experimental procedures described belowwere performed
under a N2 atmosphere
2.2. Sample preparation
2.2.1. POSSh impregnated with Cp2ZrCl2
The POSSh species was impregnated with the Cp2ZrCl2 catalyst in a 1:3 mass ratio. POSSh and
Cp2ZrCl2 were dissolved separately in distilled toluene in Schlenk tubes. The catalyst solution
was then added to the POSSh one and the mixture was stirred at room temperature for 30 min.
The solvent was removed under vacuum and the solid remaining was dried completely under
vacuum for 8 h.
2.2.2. POSSh immobilized on SiO2
A sample of POSSh was dissolved in distilled toluene and the solution was added to a Schlenk
tube containing activated silica in a 1:10 POSSh:SiO2 mass ratio. The mixture was allowed to
interact at room temperature for 30 min. The resulting slurry was filtered through a fritted disk
and the solid residue was washed with toluene (15 x 2.0 mL) and dried under vacuum for 8 h.
2.3. Sample characterization
2.3.1. Infrared emission spectroscopy
Infrared emission spectra were obtained using a Nicolet Nexus 870 FT-IR spectrometer equipped
with a liquid N2-cooled TGS detector. The spectrometer had been modified by replacing the
infrared source with a home-built emission cell. A small amount of the sample was placed on a 6-
mm diameter Pt surface and held in an inert atmosphere within a N2-purged cell during heating
process. The spectra were recorded at 50oC intervals in the 100-1000 oC range [8] and different
5
numbers of scans were collected depending on the temperature actually being investigated. All
spectral manipulations, including baseline correction, smoothing and normalization, were
performed using the software package GRAMS®(Galactic Industries Corporation, Salem, NH,
USA). The band component analysis was achieved using PeakFit software (Jandel Scientific, CA,
USA).
2.3.2. Thermogravimetric analysis
Thermal decomposition of the samples was performed using a TA® Instrument equipped with a
high-resolution thermogravimetric analyzer (Q-500). The samples (~5-9 mg) were loaded in a Pt
pan. Runs were performed at rate of 20 oC min-1, under a N2 atmosphere at temperatures ranging
from room temperature to 550 oC and under extra-dry air from 550-700 oC.
3. Results and discussion
3.1. Thermal decomposition of POSSh
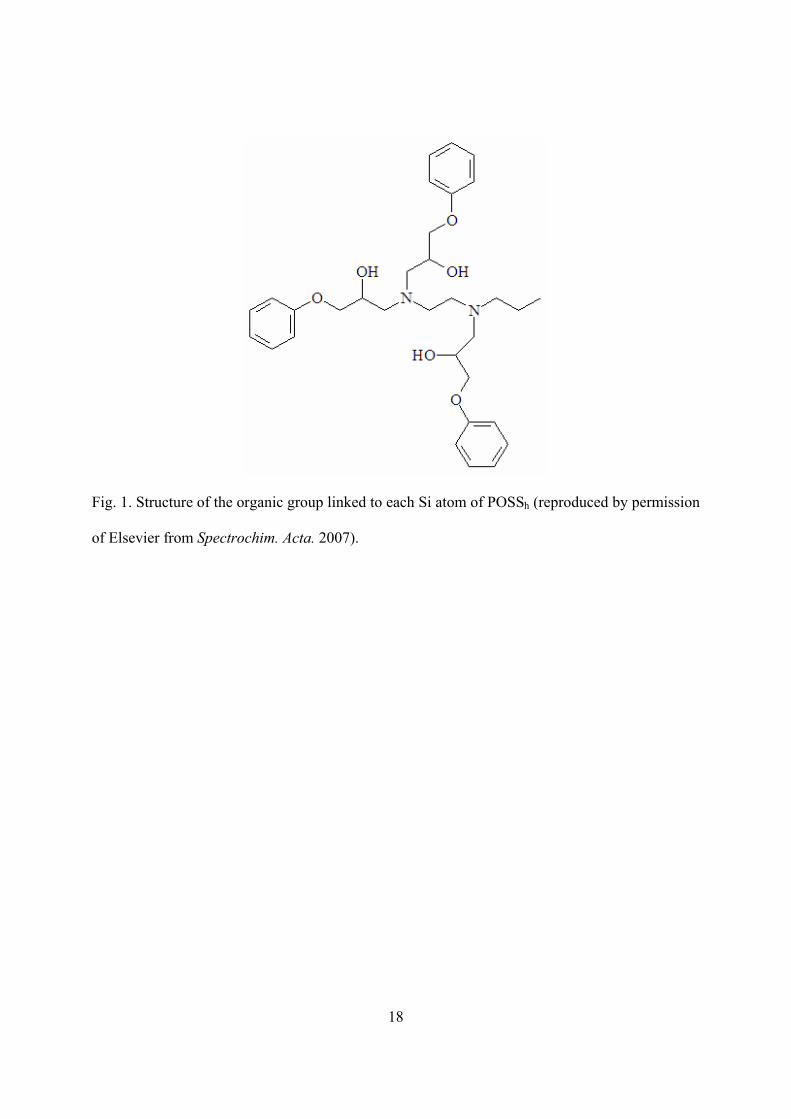
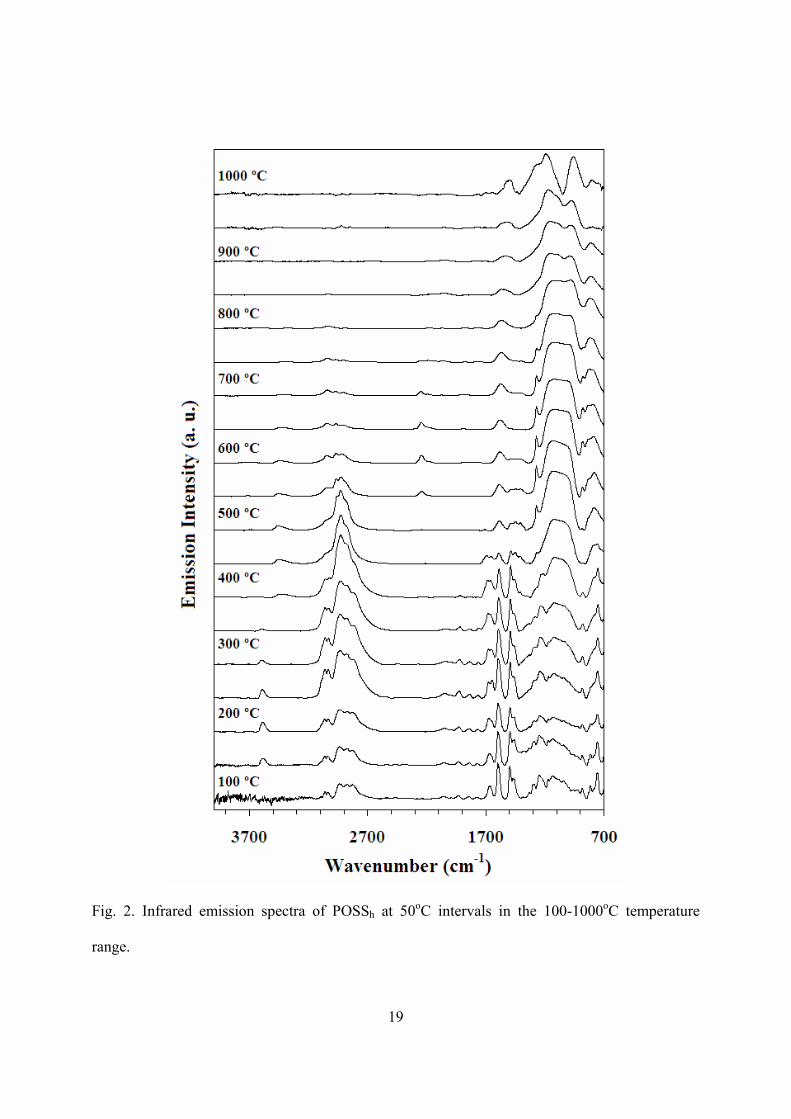
The structure of the R groups present in POSSh is shown in Fig. 1. The infrared emission spectra
of POSSh obtained at 50 oC intervals in the 100 -1000oC temperature range, are illustrated in Fig.
2. Upon steadily increasing the temperature, some of the infrared emission bands associated with
the R groups become weaker or disappear (viz., those located at 3060, 3035, 2000-1700, 1598,
1586, 1496, 1246, 812 and 755 cm-1), leading to an easier observation of the spectroscopic
features corresponding to the inorganic framework at 1350-900 and 782 cm-1. The infrared
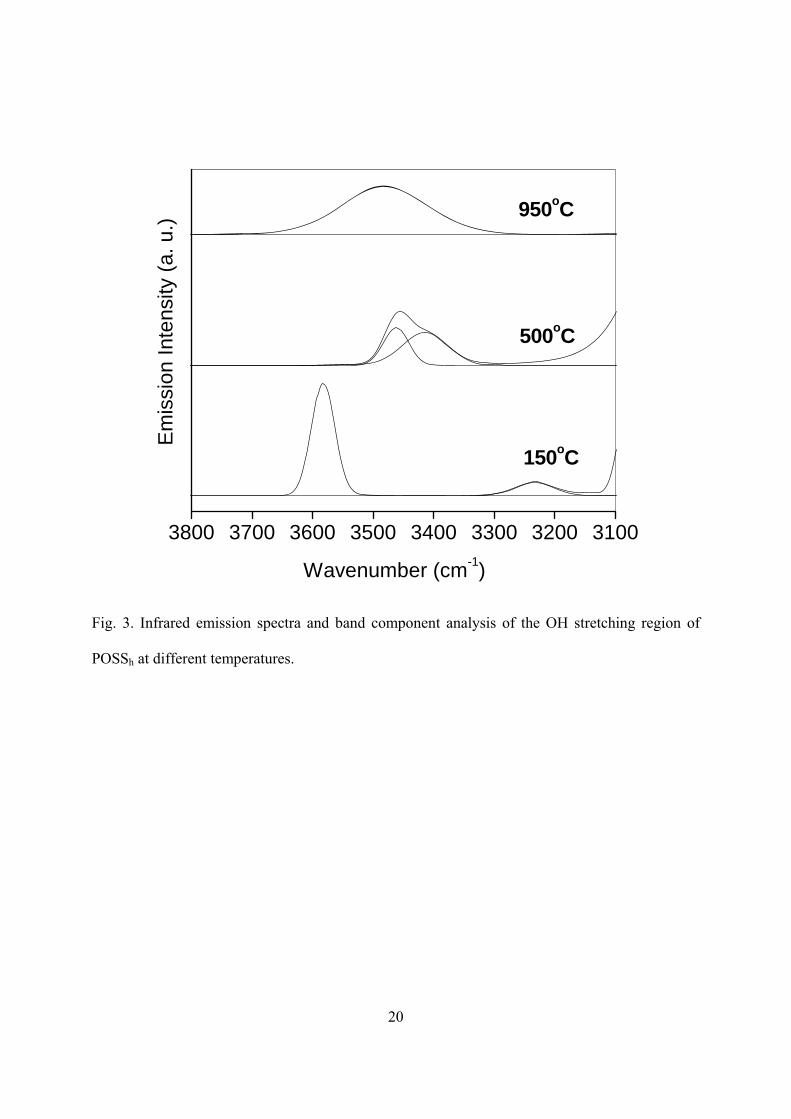
emission spectra in the OH stretching region at 150, 500 and 950 oC are shown in Fig. 3. The
150oC emission spectrum displays features at 3583 and 3234 cm-1. In an earlier study [7], the
weak Raman peak at 3579 cm-1, as well as the strong, broad photoacoustic infrared band at 3262
6
cm-1, were assigned to OH stretching modes. In IES measurements, the usual vibrational
selection rules break down and both infrared and Raman-active features will be observed [9]. For
temperatures between 150 and 400 oC, only one band near 3580 cm-1 is detected. However,
beginning at 400 oC, this band becomes broader and shifts to ~3450 cm-1. These observations
indicate that the OH groups are strongly H-bonded. According to Colthup et al. [10], the free OH
stretching modes for alcohols are expected as sharp, weak band near 3640 cm-1. At 500 oC, the
infrared emission spectrum exhibits a broad, asymmetric band in the OH stretching region, which
can be deconvoluted into two components centered at 3462 and 3415 cm-1. These bands are no
longer visible at 850 and 900 oC, and only one very broad, symmetric feature, located at 3480
cm-1, is observed at 950 oC. These results suggest that OH groups can be regenerated at higher
temperatures most probably from rearrangements of heteroaromatic groups. In addition, it is
possible that the Si-O bonds of POSSh structure have undergone scission at higher temperatures
leading to the formation of Si-OH groups. Upon increasing the temperature, the bandwidths of
the OH stretching bands increase markedly, indicating that the structure of POSSh has become
more disordered.
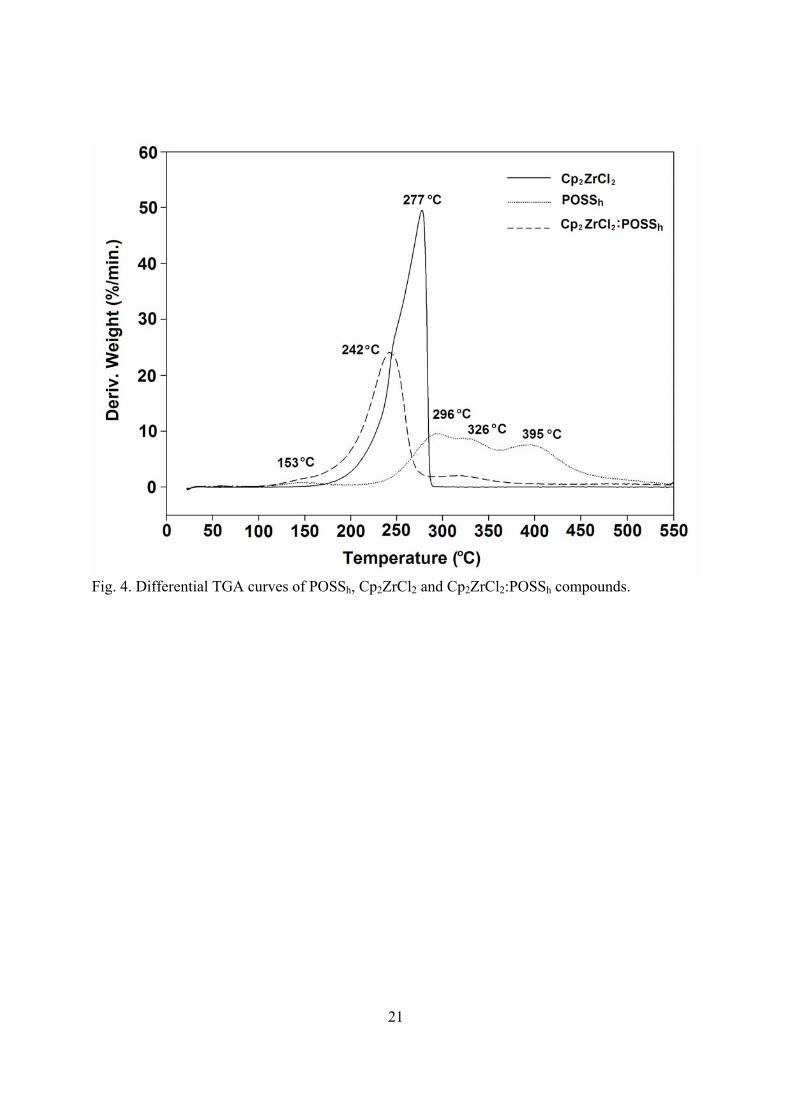
On the basis of the differential thermogravimetric data, POSSh decomposes in four stages at 153,
296, 326 and 395 oC with associated weight losses of 2.6, 26.6, 18.0 and 28.9%, respectively
(Fig. 4). These data are in agreement with the IES results since some of the characteristic
vibrations of POSSh (Fig. 1) located at 3060, 3035, 2000-1700, 1598, 1586, 1496, 1246, 812 and
755 cm-1, are not detected at temperatures above 450 oC. Eisenberg et al. [11] have analyzed the
thermal and mechanical properties of organic-inorganic hybrid materials obtained by the
copolymerization of a methacryloxypropyl-functionalized silsesquioxane with variable amounts
of styrene. These researchers observed that thermal decomposition of such systems leads to the
7
formation of a SiOxCy glassy layer during the pyrolysis. Despite the fact that most of the R
groups in POSSh decompose at temperatures below 450 oC, there are still infrared emission bands
present at higher temperatures that are associated with organic groups, viz., 3040, 2968, 2903 and
1569 cm-1. It is likely that the large R group attached to each tetrahedral Si framework undergoes
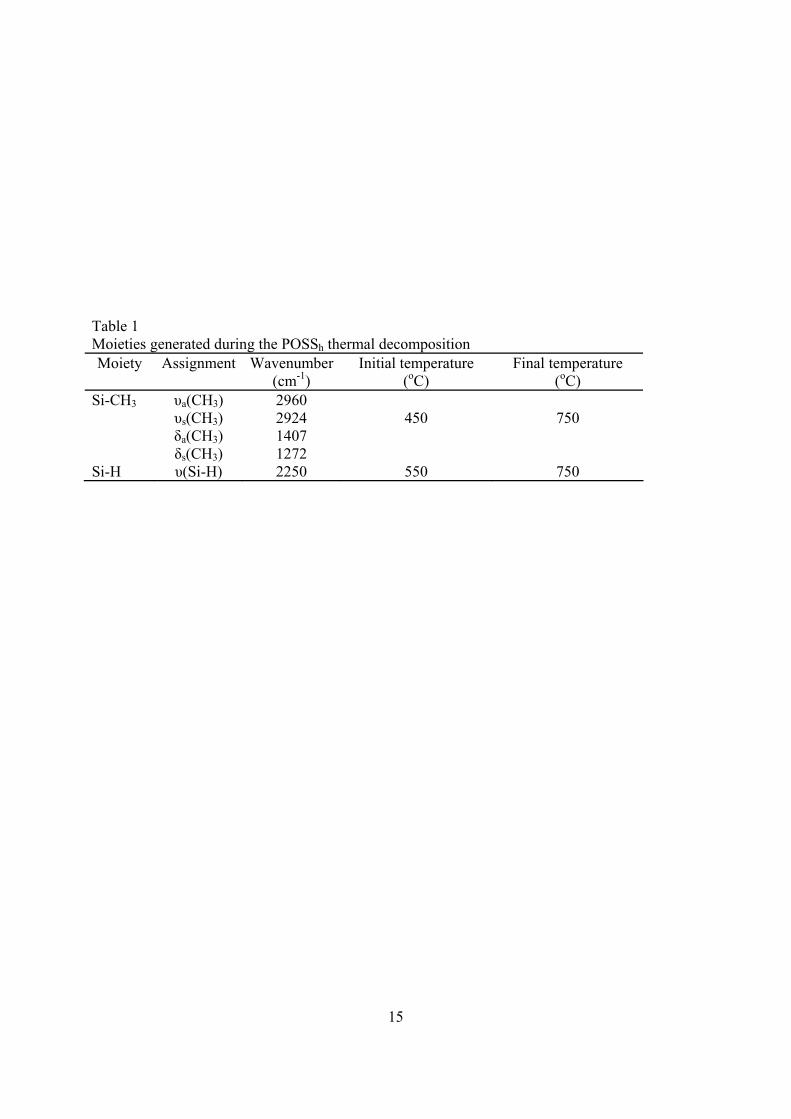
fragmentation during pyrolysis thereby generating smaller organic fragments. Table 1 indicates
that several infrared emission bands associated with Si-CH3 and Si-H groups begin to appear at
450 oC (when most of the bands due to the R groups are no longer observed) and 550 oC,
respectively. The Si-H groups are presumably generated by reactions or rearrangements of the Si-
CH3 groups as the temperature is increased. Neither moiety was detected above 750oC. The IES
data at temperatures up to 900 oC still display weak features near 3040 and 1650-1400 cm-1
corresponding, most probably, to heteroaromatic rings since it is well-known that aromatic and
heteroaromatic rings have higher thermal stabilities than do aliphatic groups [12]. Heteroaromatic
rings may well have been generated by rearrangements during the thermal decomposition
process.
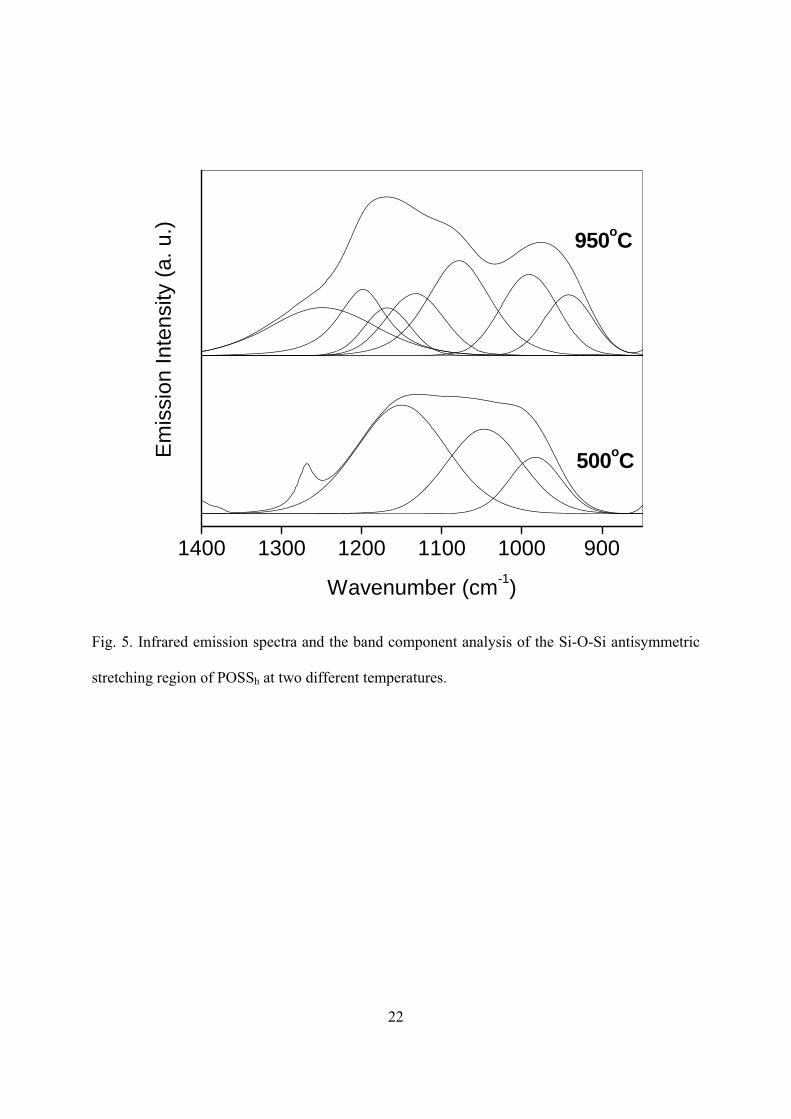
The IES data obtained at temperatures up to 400 oC show that the antisymmetric Si-O-Si
stretching modes are masked by vibrational bands of the organic groups. However, beginning at
400 oC, a large, unresolved envelope associated with the antisymmetric Si-O-Si stretching mode
is observed between 1300 and 870 cm-1. Significant modifications of the Si-O-Si region take
place from 850 oC onwards. The envelope splits in two new broad bands located at 1160 and 970
cm-1 together with a shoulder near 1090 cm-1. The infrared emission spectra and the band
component analyses of the antisymmetric Si-O-Si stretching region of POSSh at 500 and 950 oC
are illustrated in Fig. 5. The emission spectrum obtained at 500 oC can be deconvoluted into three
components at 1150, 1047 and 983 cm-1 (the 1270 cm-1 band is assigned to a C-H stretching
8
mode and so it was not considered in the deconvolution), while that obtained at 950 oC appears to
consists of seven components at 1249, 1199, 1168, 1133, 1079, 991 and 942 cm-1. Furthermore,
some of the seven components observed at 950 oC occur at higher or lower wavenumbers than do
the bands in the 500 oC spectrum. These observation suggests that more or less strained (Si-O)n
rings are being produced during the thermal decomposition of POSSh.
3.2. Thermal stability of Cp2ZrCl2:POSSh
The infrared emission spectra of Cp2ZrCl2:POSSh, obtained over temperature range from 100 to
1000 oC, are shown in Fig. 6. The bands located at 3103, 1438, 1364, 1125, 1014, 844 and 810
cm-1, which are attributed to vibrational modes of the Cp rings of Cp2ZrCl2 [7], are not observed
at temperatures above 100 oC. This observation indicates that the Cp2ZrCl2:POSSh compound
loses Cp rings when heated up to 100 oC.
As discussed previously, heating leads to decomposition of the R groups in POSSh. The
vibrational features assigned to the R groups are not observed in the Cp2ZrCl2:POSSh spectra
above 350 oC. However, some C-H and C-C stretching modes of heteroaromatic rings possibly
generated during thermal degradation of Cp2ZrCl2:POSSh can be detected at 3050 and 1650-1400
cm-1, respectively. Impregnation of POSSh with Cp2ZrCl2 clearly leads to a different thermal
decomposition pathway compared to that of POSSh. No bands corresponding to Si-CH3 and Si-H
groups were observed in the Cp2ZrCl2:POSSh spectra during the thermal degradation process.
The differential thermogravimetric analysis (DTGA) curves of Cp2ZrCl2, POSSh and
Cp2ZrCl2:POSSh are shown in Fig. 4. Of particular interest is that the thermal degradation of
POSSh occurs at a higher temperature than does that of Cp2ZrCl2. It should be mentioned that in
9
the DTGA data for POSSh these is a peak centred at 153 oC, most probably corresponding to the
loss of water or volatile small molecules. Thermal decomposition of Cp2ZrCl2 begins near 175
oC, reaching a maximum at 277 oC. On the other hand, thermal decomposition of
Cp2ZrCl2:POSSh begins just above 100 oC with a maximum occurring at 242 oC. These results
indicate that addition of a small amount of Cp2ZrCl2 to POSSh leads to the formation of a less
stable compound. The loss of water or small organic molecules from POSSh could induce the loss
of Cp rings from Cp2ZrCl2:POSSh. The relatively easy removal of Cp rings at lower temperatures
could be an eventual limitation on the utility of Cp2ZrCl2:POSSh in industrial polymerization
reactions since these occur at temperatures well above 100 oC.
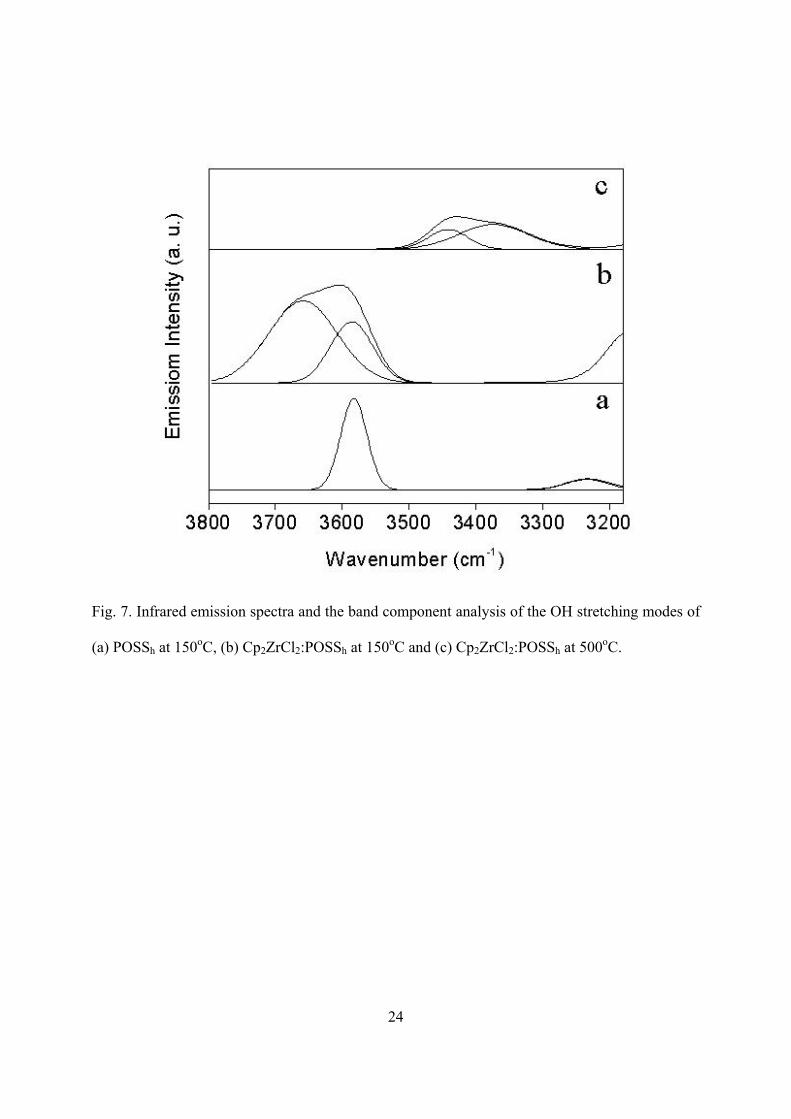
The OH stretching band of Cp2ZrCl2:POSSh, which was detected in the 150-500 oC temperature
range, was also subjected to band component analysis (Fig. 7) (for the purposes of comparison,
the POSSh spectrum at 150oC has been included). At 150 oC, the emission band assigned to OH
stretching is broader for Cp2ZrCl2:POSSh than for free POSSh and it can be deconvoluted into
two components centered at 3660 and 3585 cm-1. The latter band was also observed in the
emission spectrum of free POSSh at 150 oC. It is worthwhile pointing out that there is a peak at
3580 cm-1 in the Raman spectrum of Cp2ZrCl2:POSSh, which has been attributed to an OH
stretching mode [7]. The 3660 cm-1 emission band of Cp2ZrCl2:POSSh observed at 150 oC can be
attributed to Zr-OH groups generated during heating. Upon increasing the temperature up to 500
oC, the emission bands in the OH stretching region of Cp2ZrCl2:POSSh decrease in intensity and
shift by about 220 cm-1 towards lower wavenumbers to 3440 and 3368 cm-1, respectively. Using
FT-IR spectroscopy, Trunschke et al. [13] have examined the surface of ZrO2 after pretreatment
with flowing H2 for 1 h at 600 oC, followed by evacuation for 1 h at 600 oC. The sharp bands
corresponding to OH stretching modes, located between 3800 and 3600 cm-1, were attributed to

10
Zr-OH moieties, which remain on the surface of the crystalline ZrO2 phases after the high-
temperature pretreatment. In addition, the broad feature observed near 3400 cm-1 was attributed
to the presence of H-bonded OH groups on amorphous surface regions of the oxide.
The infrared emission spectra and the band component analyses of the Si-O-Si stretching modes
of Cp2ZrCl2:POSSh at 500 and 1000 oC are shown in Fig. 8 (for comparative purposes, the POSSh
spectrum at 500oC is included). At 500 oC, the Si-O stretching modes of the Cp2ZrCl2:POSSh
show five components at 1311, 1229, 1050, 996 and 911 cm-1 and are broader than are those of
POSSh. At 950 oC, the band component analysis reveals six features located at 1340, 1280, 1216,
1067, 980 and 902 cm-1. Furthermore, the deconvolutions of the Cp2ZrCl2:POSSh spectra
obtained at 500 and 1000 oC exhibit more intense components near 1000 cm-1, contrary what was
observed in the POSSh spectrum obtained at 950 oC (Fig. 5). It is possible that Si-O-Zr moieties
are generated by reaction of Zr-containing fragments with Si-O bonds produced during thermal
decomposition of POSSh species. The Si-O stretching modes of Si-O-Zr are expected to appear in
a similar region to the Si-O stretching modes of Si-O-Si units, and sometimes they may overlap.
Barraclough et al. [14] have reported that Si-O-M systems (M = Ti, Zr, Hf, Al, Nb, Ta) exhibit
two characteristic features, an intense band around 900 cm-1, assigned to the Si-O stretching
mode, and a second one, much weaker, in the 600-500 cm-1 region, corresponding to the M-O
stretching vibration. Unfortunately, because of the spectral limit of the infrared emission
spectrometer, no data could be collected below 650 cm-1 and so the Zr-O stretching modes could
not be observed.
3.3. Thermal decomposition of POSSh:SiO2
11
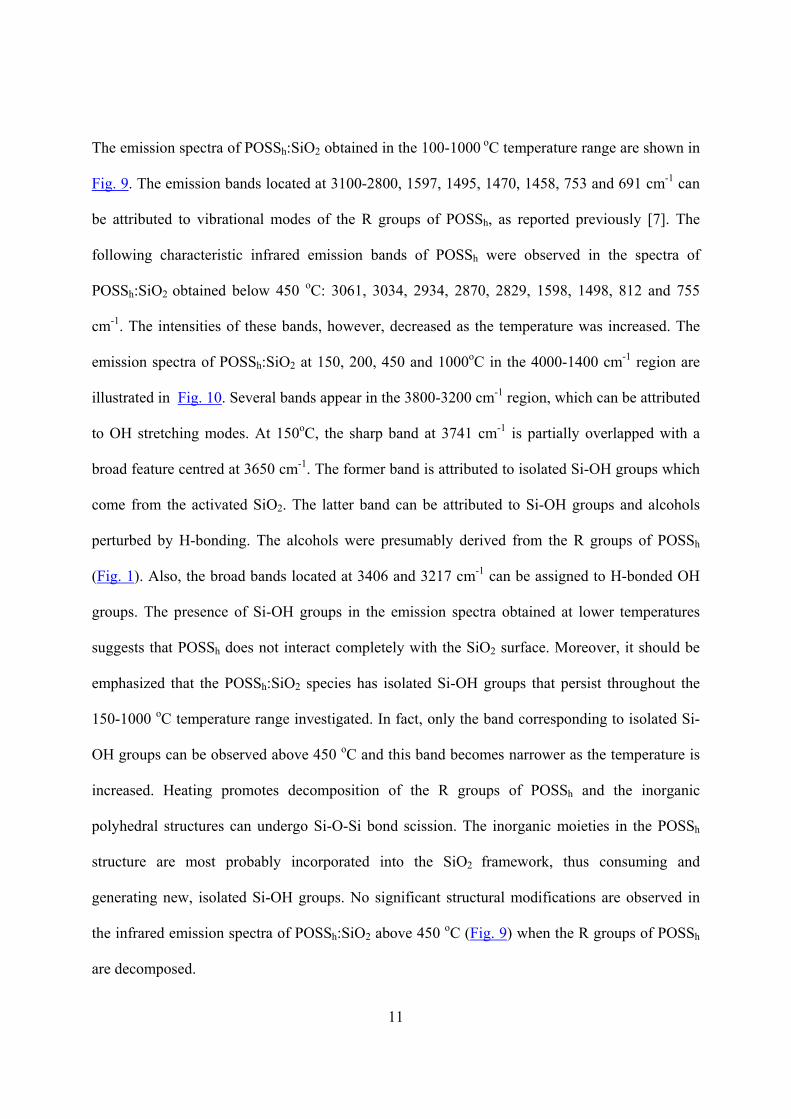
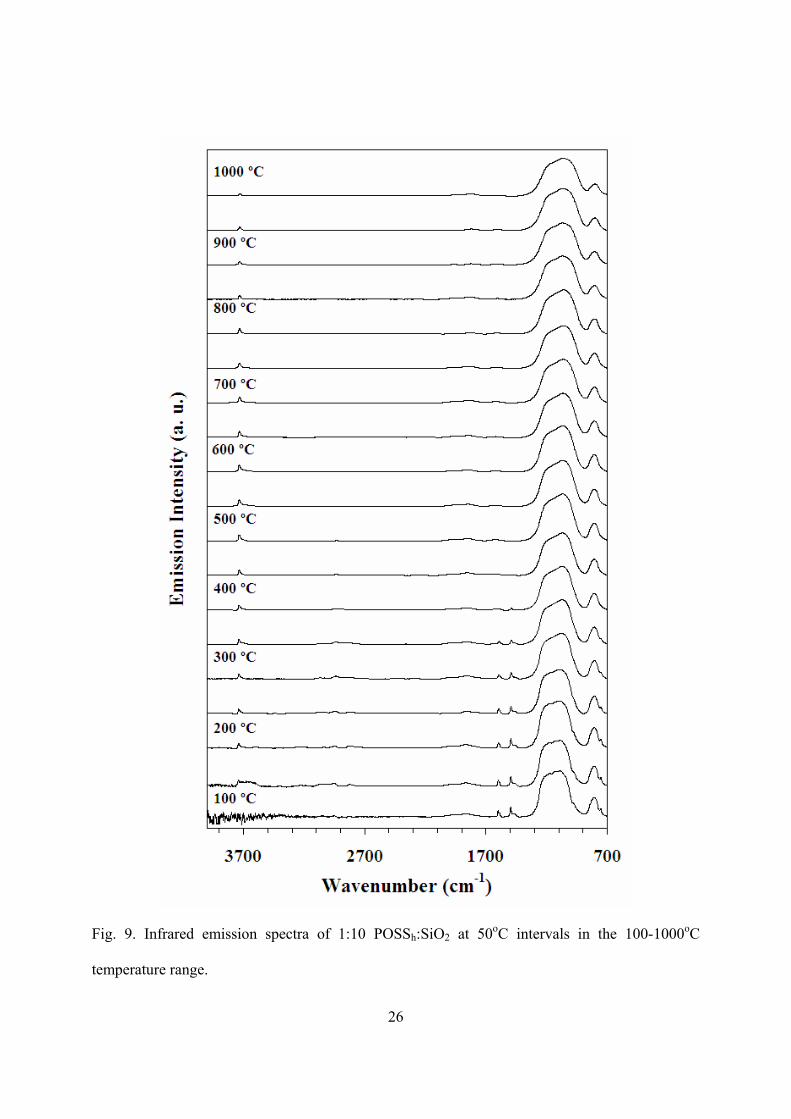
The emission spectra of POSSh:SiO2 obtained in the 100-1000 oC temperature range are shown in
Fig. 9. The emission bands located at 3100-2800, 1597, 1495, 1470, 1458, 753 and 691 cm-1 can
be attributed to vibrational modes of the R groups of POSSh, as reported previously [7]. The
following characteristic infrared emission bands of POSSh were observed in the spectra of
POSSh:SiO2 obtained below 450 oC: 3061, 3034, 2934, 2870, 2829, 1598, 1498, 812 and 755
cm-1. The intensities of these bands, however, decreased as the temperature was increased. The
emission spectra of POSSh:SiO2 at 150, 200, 450 and 1000oC in the 4000-1400 cm-1 region are
illustrated in Fig. 10. Several bands appear in the 3800-3200 cm-1 region, which can be attributed
to OH stretching modes. At 150oC, the sharp band at 3741 cm-1 is partially overlapped with a
broad feature centred at 3650 cm-1. The former band is attributed to isolated Si-OH groups which
come from the activated SiO2. The latter band can be attributed to Si-OH groups and alcohols
perturbed by H-bonding. The alcohols were presumably derived from the R groups of POSSh
(Fig. 1). Also, the broad bands located at 3406 and 3217 cm-1 can be assigned to H-bonded OH
groups. The presence of Si-OH groups in the emission spectra obtained at lower temperatures
suggests that POSSh does not interact completely with the SiO2 surface. Moreover, it should be
emphasized that the POSSh:SiO2 species has isolated Si-OH groups that persist throughout the
150-1000 oC temperature range investigated. In fact, only the band corresponding to isolated Si-
OH groups can be observed above 450 oC and this band becomes narrower as the temperature is
increased. Heating promotes decomposition of the R groups of POSSh and the inorganic
polyhedral structures can undergo Si-O-Si bond scission. The inorganic moieties in the POSSh
structure are most probably incorporated into the SiO2 framework, thus consuming and
generating new, isolated Si-OH groups. No significant structural modifications are observed in
the infrared emission spectra of POSSh:SiO2 above 450 oC (Fig. 9) when the R groups of POSSh
are decomposed.
12
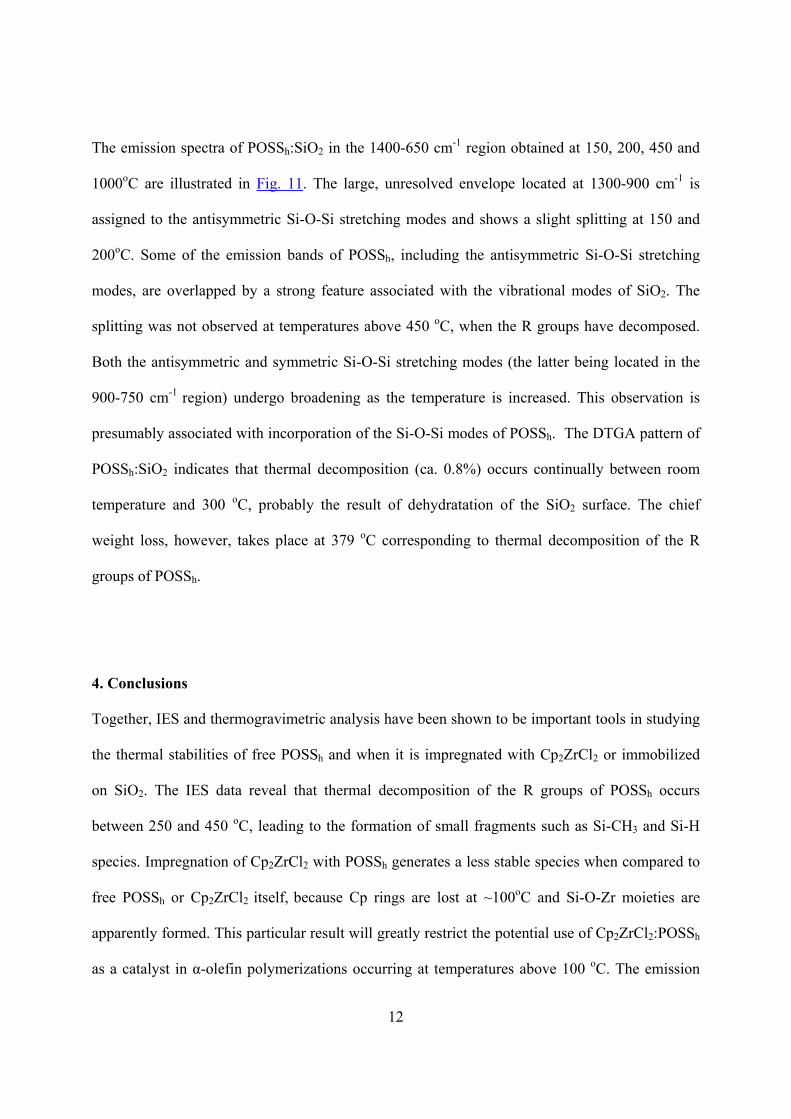
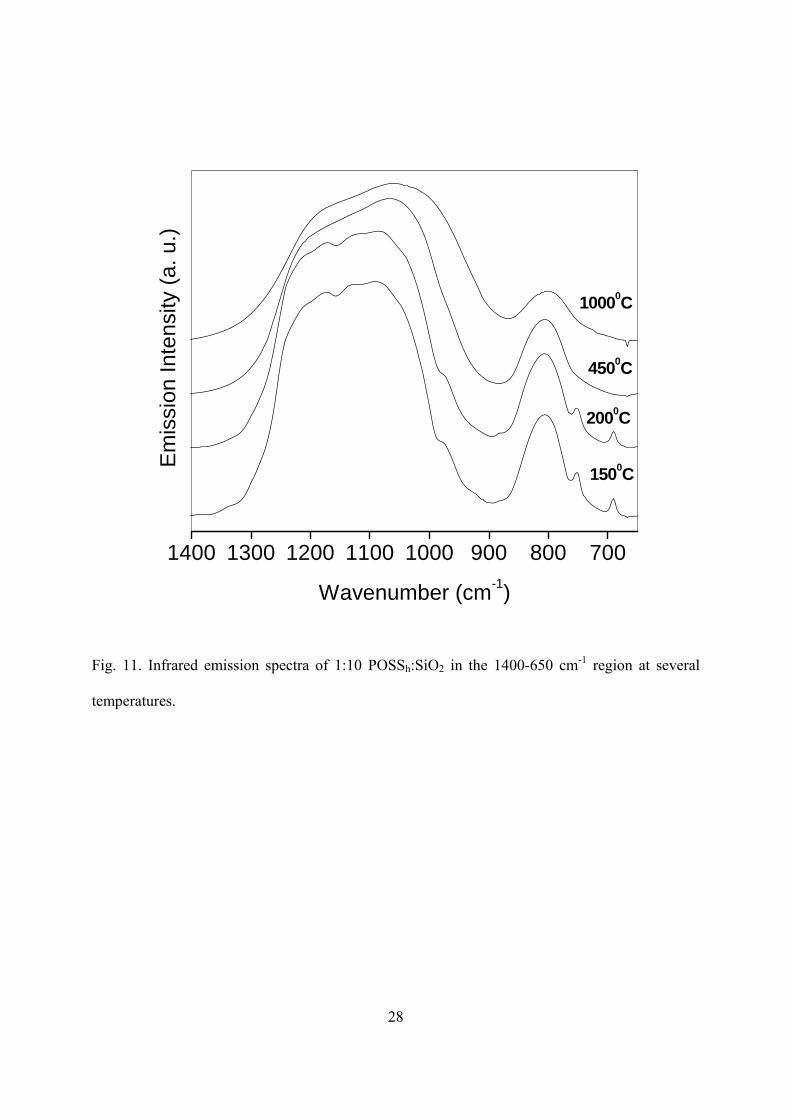
The emission spectra of POSSh:SiO2 in the 1400-650 cm-1 region obtained at 150, 200, 450 and
1000oC are illustrated in Fig. 11. The large, unresolved envelope located at 1300-900 cm-1 is
assigned to the antisymmetric Si-O-Si stretching modes and shows a slight splitting at 150 and
200oC. Some of the emission bands of POSSh, including the antisymmetric Si-O-Si stretching
modes, are overlapped by a strong feature associated with the vibrational modes of SiO2. The
splitting was not observed at temperatures above 450 oC, when the R groups have decomposed.
Both the antisymmetric and symmetric Si-O-Si stretching modes (the latter being located in the
900-750 cm-1 region) undergo broadening as the temperature is increased. This observation is
presumably associated with incorporation of the Si-O-Si modes of POSSh. The DTGA pattern of
POSSh:SiO2 indicates that thermal decomposition (ca. 0.8%) occurs continually between room
temperature and 300 oC, probably the result of dehydratation of the SiO2 surface. The chief
weight loss, however, takes place at 379 oC corresponding to thermal decomposition of the R
groups of POSSh.
4. Conclusions
Together, IES and thermogravimetric analysis have been shown to be important tools in studying
the thermal stabilities of free POSSh and when it is impregnated with Cp2ZrCl2 or immobilized
on SiO2. The IES data reveal that thermal decomposition of the R groups of POSSh occurs
between 250 and 450 oC, leading to the formation of small fragments such as Si-CH3 and Si-H
species. Impregnation of Cp2ZrCl2 with POSSh generates a less stable species when compared to
free POSSh or Cp2ZrCl2 itself, because Cp rings are lost at ~100oC and Si-O-Zr moieties are
apparently formed. This particular result will greatly restrict the potential use of Cp2ZrCl2:POSSh
as a catalyst in α-olefin polymerizations occurring at temperatures above 100 oC. The emission
13
spectra of the POSSh:SiO2 system show that the organic groups of POSSh undergo thermal
decomposition, while the inorganic portions of the structure are incorporated into the SiO2
framework itself.
Acknowledgments
Financial support from NSERC (Canada; ISB), CSIRO (Australia; RLF) and PROSUL/CNPQ
(Brazil; GBG and JHZdS) is acknowledged. DB thanks CAPES (Brazil) for the award of a
scholarship. Prof. R.J.J. Williams from Universidad Nacional de Mar del Plata, Argentina, most
graciously provided the POSSh sample.
References
[1] G.G. Hlatky, in: J. Scheirs, W. Kaminsky (Eds.), Metallocene-Based Polyolefins, John Willey
& Sons, West Sussex, 2000, vol. 1, 201-218.
[2] D. Bianchini, K.M. Bichinho, J.H.Z. dos Santos, Polymer 43 (2002) 2937-2943.
[3] J.H.Z. dos Santos, P.P. Greco, F.F.C. Stedile, J. Dupont, J. Mol. Catal. A: Chem. 154 (2000)
103-113.
[4] G.B.Galland, J.H.Z. dos Santos, F.C. Stedile, P.P. Greco, A.D. Campani, J. Mol. Catal. A:
Chem., 210 (2004) 149-156.
[5] D. Bianchini, G.B. Galland, J.H.Z. dos Santos, R.J.J. Williams, D. Fasce, I.E. dell’Erba, R.
Quijada, M. Perez, J. Polym. Sci., Part A: Polym. Chem. 43 (2005) 5465-5476.
[6] P.P. Pescarmona, T. Maschmeyer, Aust. J. Chem. 54 (2001) 583-596.
[7] D. Bianchini, M.M. Barsan, I.S. Butler , G.B. Galland, J.H.Z. dos Santos, D.P. Fasce, R.J.J.
Williams, R. Quijada, Spectrochim. Acta A (2007).

14
[8] R.L. Frost, R.-A. Wills, M.L. Weier, A.W. Musumeci, W. Martens, Thermochim. Acta, 432
(2005), 30-35.
[9] J.T. Kloprogge, H.D. Ruan, R.L. Frost, J. Mat. Science, 37 (2002), 1121-1129
[10] N.B. Colthup, L.H. Daly, S.E. Wiberley, Introduction to Infrared and Raman
Spectroscopy, 3rd edition, Academic Press, London, 1990.
[11] P. Eisenberg, J.C. Lucas, R.J.J. Williams, Macromol. Symp., 189 (2002) 1-13.
[12] T.W.G. Solomons, Organic Chemistry, sixth ed., John Wiley & Sons, New York,
1996, chapter 14.
[13] A. Trunschke, D.L. Hoang, H. Lieske, J. Chem. Soc. Faraday Trans., 91 (1995)
4441-4444.
[14] C.G. Barraclough, D.C. Bradley, J. Lewis, I.M. Thomas, J. Chem. Soc, 510
(1961) 2601-2605.
15
Table 1 Moieties generated during the POSSh thermal decomposition Moiety Assignment Wavenumber
(cm-1) Initial temperature
(oC) Final temperature
(oC) Si-CH3 υa(CH3)
υs(CH3) δa(CH3) δs(CH3)
2960 2924 1407 1272
450
750
Si-H υ(Si-H) 2250 550 750
16
Fig. 1. Structure of the organic group linked to each Si atom of POSSh (reproduced by permission
of Elsevier from Spectrochim. Acta. 2007).
Fig. 2. Infrared emission spectra of POSSh at 50oC intervals in the 100-1000oC temperature
range.
Fig. 3. Infrared emission spectra and band component analysis of the OH stretching region of
POSSh at different temperatures.
Fig. 4. Differential TGA curves of POSSh, Cp2ZrCl2 and Cp2ZrCl2:POSSh compounds.
Fig. 5. Infrared emission spectra and the band component analysis of the Si-O-Si antisymmetric
stretching region of POSSh at two different temperatures.
Fig. 6. Infrared emission spectra of Cp2ZrCl2:POSSh at 50oC intervals in the 100-1000oC
temperature range.
Fig. 7. Infrared emission spectra and the band component analysis of the OH stretching modes of
(a) POSSh at 150oC, (b) Cp2ZrCl2:POSSh at 150oC and (c) Cp2ZrCl2:POSSh at 500oC.
17
Fig. 8. Infrared emission spectra and the band component analyses of (a) POSSh at 500oC, (b)
Cp2ZrCl2:POSSh at 500oC and (c) Cp2ZrCl2:POSSh at 1000oC.
Fig. 9. Infrared emission spectra of 1:10 POSSh:SiO2 at 50oC intervals in the 100-1000oC
temperature range.
Fig. 10. Infrared emission spectra of 1:10 POSSh:SiO2 in the 4000-1400 cm-1 range at several
temperatures.
Fig. 11. Infrared emission spectra of 1:10 POSSh:SiO2 in the 1400-650 cm-1 region at several
temperatures.
18
Fig. 1. Structure of the organic group linked to each Si atom of POSSh (reproduced by permission
of Elsevier from Spectrochim. Acta. 2007).
19
Fig. 2. Infrared emission spectra of POSSh at 50oC intervals in the 100-1000oC temperature
range.
20
3800 3700 3600 3500 3400 3300 3200 3100
950oC
500oC
Em
issi
on In
tens
ity (a
. u.)
Wavenumber (cm-1)
150oC
Fig. 3. Infrared emission spectra and band component analysis of the OH stretching region of
POSSh at different temperatures.
21
Fig. 4. Differential TGA curves of POSSh, Cp2ZrCl2 and Cp2ZrCl2:POSSh compounds.
22
1400 1300 1200 1100 1000 900
950oC
500oCEm
issi
on In
tens
ity (a
. u.)
Wavenumber (cm-1)
Fig. 5. Infrared emission spectra and the band component analysis of the Si-O-Si antisymmetric
stretching region of POSSh at two different temperatures.

23
Fig. 6. Infrared emission spectra of Cp2ZrCl2:POSSh at 50oC intervals in the 100-1000oC
temperature range.
24
Fig. 7. Infrared emission spectra and the band component analysis of the OH stretching modes of
(a) POSSh at 150oC, (b) Cp2ZrCl2:POSSh at 150oC and (c) Cp2ZrCl2:POSSh at 500oC.

25
Fig. 8. Infrared emission spectra and the band component analyses of (a) POSSh at 500oC, (b)
Cp2ZrCl2:POSSh at 500oC and (c) Cp2ZrCl2:POSSh at 1000oC.
26
Fig. 9. Infrared emission spectra of 1:10 POSSh:SiO2 at 50oC intervals in the 100-1000oC
temperature range.

27
4000 3500 3000 2500 2000 1500
10000C
4500C
2000C
1500C
Em
issi
on In
tens
ity (a
. u.)
Wavenumber (cm-1)
Fig. 10. Infrared emission spectra of 1:10 POSSh:SiO2 in the 4000-1400 cm-1 range at several
temperatures.
28
1400 1300 1200 1100 1000 900 800 700
10000C
4500C
2000C
Em
issi
on In
tens
ity (a
. u.)
Wavenumber (cm-1)
1500C
Fig. 11. Infrared emission spectra of 1:10 POSSh:SiO2 in the 1400-650 cm-1 region at several
temperatures.