Quantification and 3-D imaging of the insulitis-induced...
17
Quantification and 3-D imaging of the insulitis-induced destruction of β-cells in murine Type 1 Diabetes Tomas Alanentalo 1 , Andreas Hörnblad 1 , Sofia Mayans 2,3 , Anna Karin Nilsson 2 , James Sharpe 4 , Åsa Larefalk 2 , Ulf Ahlgren 1 , Dan Holmberg 2,3 . 1 Umeå Centre for Molecular Medicine, Umeå University, SE-90187, Umeå, Sweden. 2 Dept. of Medical Biosciences, Umeå University, SE-901 85, Umeå, Sweden. 3 Dept of Disease Biology, Faculty of Life Science, Copenhagen University, DK-1870, Copenhagen, Denmark 4 ICREA and EMBL-CRG Systems Biology Program, Centre for Genomic Regulation, Dr. Aiguader 88, 08003, Barcelona, Spain U.A. and D.H. share Co-senior authorship Running Title: Imaging type 1 diabetes Address for correspondence: Dan Holmberg Email: [email protected] Ulf Ahlgren Email: [email protected] Submitted 21 September 2009 and accepted 26 March 2010. This is an uncopyedited electronic version of an article accepted for publication in Diabetes. The American Diabetes Association, publisher of Diabetes, is not responsible for any errors or omissions in this version of the manuscript or any version derived from it by third parties. The definitive publisher-authenticated version will be available in a future issue of Diabetes in print and online at http://diabetes.diabetesjournals.org. Diabetes Publish Ahead of Print, published online April 14, 2010 Copyright American Diabetes Association, Inc., 2010
Transcript of Quantification and 3-D imaging of the insulitis-induced...
Quantification and 3-D imaging of the insulitis-induced destruction
of ββββ-cells in murine Type 1 Diabetes
Tomas Alanentalo1, Andreas Hörnblad1, Sofia Mayans2,3, Anna Karin Nilsson2, James Sharpe4 , Åsa Larefalk2, Ulf Ahlgren1, Dan Holmberg2,3.
1Umeå Centre for Molecular Medicine, Umeå University, SE-90187, Umeå, Sweden.
2Dept. of Medical Biosciences, Umeå University, SE-901 85, Umeå, Sweden.
3Dept of Disease Biology, Faculty of Life Science, Copenhagen University, DK-1870,
Copenhagen, Denmark 4ICREA and EMBL-CRG Systems Biology Program, Centre for Genomic Regulation, Dr.
Aiguader 88, 08003, Barcelona, Spain
U.A. and D.H. share Co-senior authorship
Running Title: Imaging type 1 diabetes
Address for correspondence: Dan Holmberg
Email: [email protected]
Ulf Ahlgren Email: [email protected]
Submitted 21 September 2009 and accepted 26 March 2010.
This is an uncopyedited electronic version of an article accepted for publication in Diabetes. The American Diabetes Association, publisher of Diabetes, is not responsible for any errors or omissions in this version of the manuscript or any version derived from it by third parties. The definitive publisher-authenticated version will be available in a future issue of Diabetes in print and online at http://diabetes.diabetesjournals.org.
Diabetes Publish Ahead of Print, published online April 14, 2010
Copyright American Diabetes Association, Inc., 2010
Imaging type 1 diabetes
2
Objective: The aim of this study was to refine the information regarding the quantitative and spatial dynamics of infiltrating lymphocytes and remaining β-cell volume during the progression of type 1 diabetes in the NOD mouse model of the disease. Research design and methods: Using an ex vivo technique, optical projection tomography (OPT), we quantified and assessed the 3D spatial development and progression of insulitis and β-cell destruction in pancreas from diabetes prone NOD and non-diabetes prone congenic NOD.H-2b mice between 3 and 16 weeks of age. Results: Together with results showing the spatial dynamics of the insulitis process we provide data of β-cell volume distributions down to the level of the individual islets and throughout the pancreas during the development and progression of type 1 diabetes. Our data provide evidence for a compensatory growth potential of the larger insulin+ islets during the later stages of the disease around the time point for development of clinical diabetes. This is in contrast to smaller islets, which appear less resistant to the autoimmune attack. We also provide new information on the spatial dynamics of the insulitis process itself, including its apparently random distribution at onset, the local variations during its further development, and the formation of structures resembling tertiary lymphoid organs at later phases of insulitis progression. Conclusions: Our data provides a powerful tool for phenotypic analysis of genetic and environmental effects on type 1 diabetes etiology as well as for evaluating the potential effect of therapeutic regimes.
Imaging type 1 diabetes
3
ype 1 diabetes is an autoimmune disorder resulting from the destruction of insulin-producing β-cells by an
autoreactive immune response involving CD4+ and CD8+ T cells as well as other leukocyte subsets. Our present understanding of the natural history of type 1 diabetes (1) depends to a large extent on analysis of rodent models of the disease like the non-obese diabetic (NOD) mouse (2). In NOD mice, the development of clinical diabetes is preceded by an inflammation of the pancreatic islets. It is generally thought that an initial event in triggering the development of insulitis and β-cell destruction is the processing of β-cell antigens by macrophages and dendritic cells residing in the pancreatic islets (3). The antigen presenting cells are then drained to the pancreatic lymph nodes where they will present the antigen to autoreactive T cells. In the absence of proper peripheral tolerance mechanisms, this leads to activation and insufficiently controlled expansion of these T cell clones and eventually to their migration back to the pancreatic islets where they mediate β-cell destruction (4). While it is well established that the insulitis progresses over an extended time period, detailed information on the quantification of spatial dynamics is largely lacking in part due to limitations in existing technology. Recently, we have developed an OPT based approach (5), allowing for ex vivo, global evaluation of molecularly labeled pancreatic constituents (e.g. insulin producing islet cells or infiltrating CD3+ T lymphocytes) (6, 7). This provides a method for direct quantification and 3D-spatial assessment of both infiltrating lymphocytes and remaining β-cell mass during the progression of type 1 diabetes in NOD mice. Using this approach to extract information of islet number, β-cell distribution and volume, down to the level of individual islets throughout the pancreas, we provide a detailed account of the kinetics and
spatial extension of the insulitis and β-cell mass destruction process during the development and progression type 1 diabetes. RESEARCH DESIGN AND METHODS Animals. NOD.Bom, were originally obtained from Bomholtgaard (Ry, Denmark), while NOD.B10-H-2b (NOD.H-2b) mice were kindly provided by Dr. Linda Wicker, (Cambridge University, UK). Mice were bred and maintained in the animal facility at Umeå University. All animals were kept on normal chow and the NOD mice were screened for diabetes by urine analysis for significant glucosuria once a week (BM-test Glucose, Boehringer Mannheim, Mannheim, Germany). Positive results were thereafter verified by daily urine analyses for a week. In our NOD colony, the frequency of diabetes reaches 70% in females and 20% in males by 30 weeks of age. All experiments were performed in compliance with the relevant Swedish and institutional laws and guidelines. Organ preparations. Pancreata from female NOD and NOD.H2-b mice were isolated, stained for insulin and prepared for OPT scanning as described previously (6). To minimize variation in the staining procedure, groups consisting of one pancreas at each time point were stained simultaneously. For practical reasons, the gastric and duodenal lobe of the pancreas was scanned as one body (referred to as duodenal) and the splenic lobe as the other. For studies of insulitis, the same protocols were applied with the addition of Rb anti-CD3 (C7930, Sigma) primary- and Alexa 488 anti-Rb (Molecular Probes) secondary antibodies. Optical projection tomography. OPT scanning using the Bioptonics 3001 OPT scanner (Bioptonics), with exciter D560/40x and emitter E610lpv2 filter (Chroma), or exciter D480/30 and emitter HQ535/50 filter (Chroma) when visualizing Alexa 594 and 488 respectively, was performed as described
T
Imaging type 1 diabetes
4
previously (7). Generation of tomographic reconstructions and quantitations were performed as described previously (7). Iso-surface reconstructions were generated using the visualisation software module for Volocity v4.3.2 (Improvision). To correct for minute zoom factor aberrations detected in the Bioptonics 3001 OPT scanner, the OPT alignment pin (Bioptonics) was measured with a digital calliper. This value was compared to digital measurements of the (same) scanned alignment pin using the Skyscan Software (SkyScan). All measurements were made in triplicate. A correction factor for each magnification was calculated by dividing the value obtained with the calliper measurement by the value obtained using the SkyScan software. Volume measurements were subsequently adjusted according to the calculated correction factors. Immunohistochemistry and morphometric analysis. Regions of interest (ROI)’s containing one or more of the 10 largest islets were identified from the OPT scanned specimen as described previously (7). ROIs were isolated, remaining agarose was removed by washing in 0.29M sucrose at 57ºC, and processed for cryosectioning. Freshly dissected pancreata from 14 weeks old female NOD mice were fixed with 4% paraformaldehyde in PBS, washed in PBS and stored in 30% sucrose at 4ºC before snap-freezing in O.C.T compound (VWR International Ltd) and sectioning. Antibodies used were: Rb anti-CD3 (C7930, Sigma), Rb anti-phospho-Histone H3 (Ser10, Millipore), Rb anti-glucagon (B31-1, Euro-Diagnostica). Rt anti- MAdCAM-1 (MECA-89, BD Pharmingen), Rt anti-CD19 (1D3, BD Pharmingen), goat anti-Rb (A11008, Molecular Probes), goat anti-Rb (A11012, Molecular Probes), goat anti-Rt (A11007, Molecular Probes). Nuclei covering a total β-cell area of at least 12500 µm2 were scored from 12 and 16 weeks old female NOD and NOD.H2b mice
using a grid covering 2500 µm2. Average β-cell area was calculated by dividing the total β-cell area by the number of nuclei scored. Statistical analyses. Different zoom factors were used during the OPT scanning to enable imaging of various sized pancreata (a pancreas at 16 weeks is approximately 4 times larger than at 3 weeks). Hence, the smallest detectable object (highest resolution) varies between the largest and smallest pancreas analyzed. To normalize the smallest islet β-cell volume analyzed, between the time series, islet β-cell volumes smaller than the smallest detectable object using the lowest zoom factor were excluded from the statistical analyses. Therefore only islet β-cell volumes larger than 5000µm3 were analyzed. This volume corresponds to a spherical object with a diameter of ~21µm. The excluded islets, even at the highest zoom factor contributed only marginally to the overall islet number (~9 % at 3 weeks) and volume (less than 0.08 % at 3 weeks). Subsequent statistical analyses were performed using the Excel 2007 software (Microsoft). Mann-Whitney U non-parametric (two-tailed) test in SPSS 16.0 (SPSS, Chicago, IL, USA) was used to compare islet numbers and volumes between the different stages. The level of significance was considered to be P<0.05. Individual islet β-cell volumes, corresponding spatial co-ordinates and tomographic scan data files can be accessed via web link. RESULTS
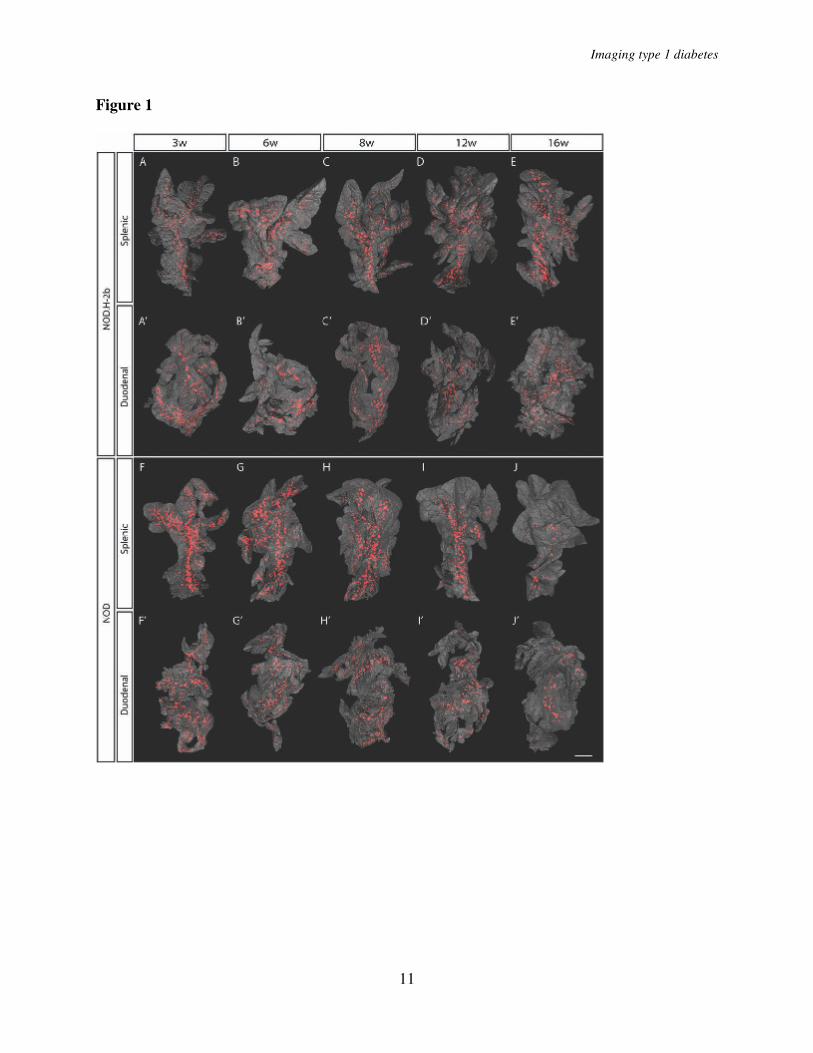
Pancreata from diabetes prone NOD mice and non-diabetes prone NOD.H-2b congenic mice were isolated at different ages ranging from 3 to 16 weeks, stained with anti-insulin antibodies, and subjected to OPT scanning. In this manner, the volume of insulin-producing β-cells in each individual islet could be directly quantified as well as spatially assessed. As illustrated in Figure 1, the pancreata from NOD.H-2b mice displayed islets containing insulin-producing β-cells
Imaging type 1 diabetes
5
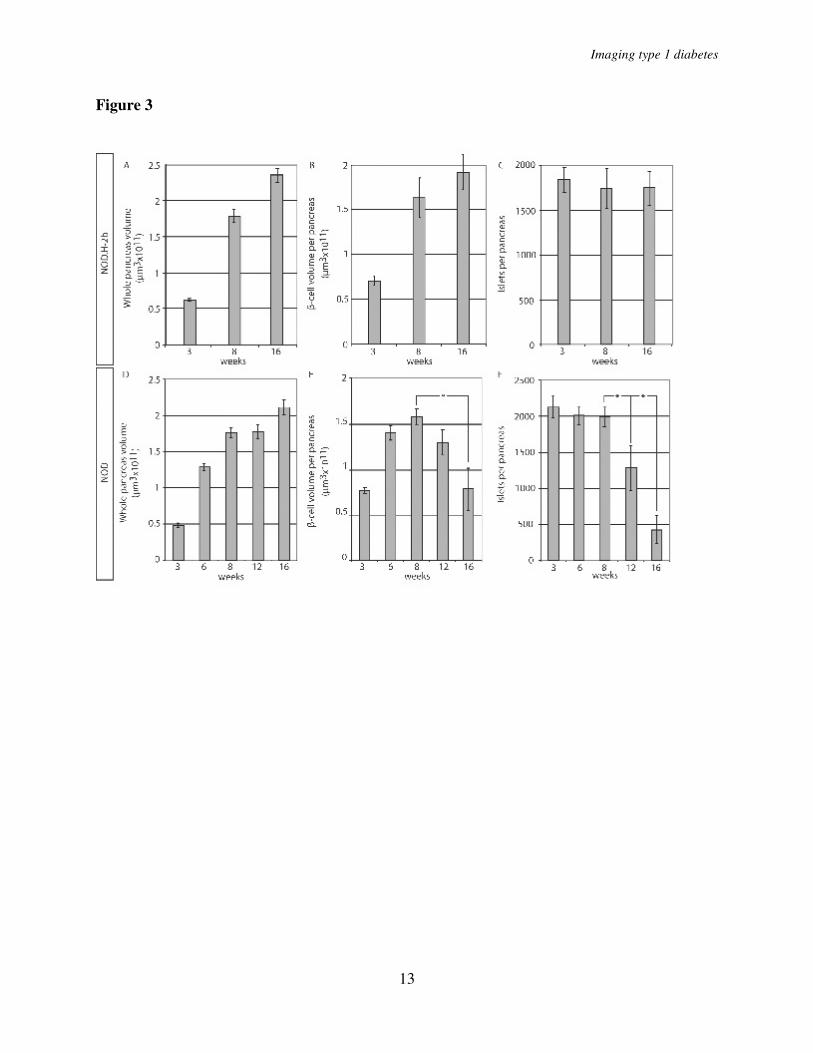
scattered over the whole organ with a similar pattern observed at all ages studied (Fig. 1 A-E’). The global assessment of the 3D-spatial distribution also confirmed the previous notion (6, 8) of an uneven distribution of differently sized islets with a predominance of small islets in the periphery of the organ and larger islets mainly located centrally in proximity to the large blood vessels and pancreatic ducts (Fig. 1, Fig. 2 A-E). The total pancreas volume (Fig. 3A, D) increased over the whole period of observation with the largest increase occurring between 3 and 8 weeks of age. A similar development was seen in both NOD and NOD.H-2b congenic mice as illustrated by both strains displaying a similar total pancreas volume at 16 weeks of age (compare Fig. 3 A and D). The total β-cell volume increased with similar kinetics (Fig. 3 B, E). In contrast, the total number of islets (Fig. 3 C, F) had reached adult levels of about 2000 islets at only 3 weeks, agreeing with previous estimates using stereological techniques (9). This data suggests that the observed increase in β-cell volume between 3 and 8 weeks of age is mainly due to the expansion of already existing islets rather than through de novo establishment.
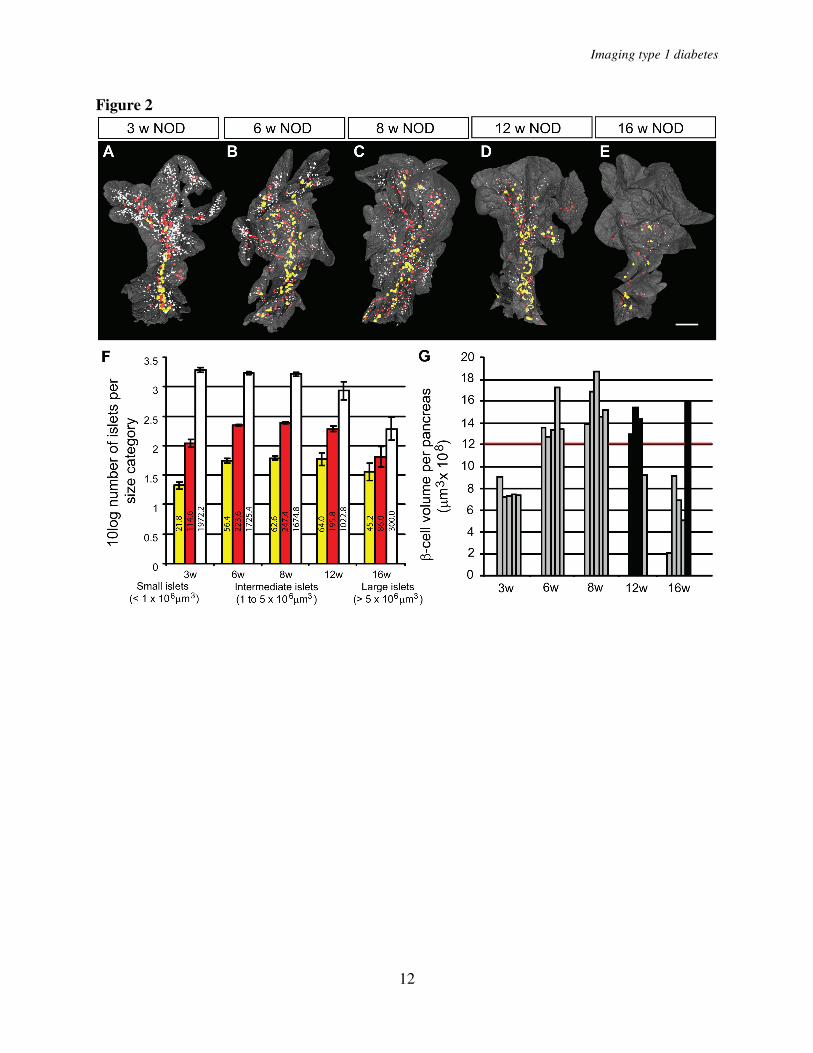
In contrast to the NOD.H-2b mice, the diabetes-prone NOD mice displayed an expected loss of ins+ islets due to the autoimmune process which became evident around 8 weeks of age. Between 8 and 12 weeks of age the average number of islets decreased by ~35% and between 8 and 16 weeks of age the number of islets was reduced by more than 75% (Fig. 3 C, F). Interestingly, the drop in islet number was not accompanied by a corresponding drop in total β-cell volume, which was only reduced by less than 20% between 8 and 12 weeks and to around 50% between 8 and 16 weeks of age (Fig. 3 E). This discrepancy could in part be explained by the fact that smaller islets were preferentially lost in the earlier stages of the process (Fig. 1 F-J’). To confirm this notion,
we classified all individual islets into size categories arbitrarily chosen to represent “large” (>5x106 µm3), “intermediate” (1-5 x106 µm3) and “small” (<1x106 µm3) islets (Fig. 2). When determined at each time point, the number of ins+ islets and the mean islet β-cell volume for each of these categories. As illustrated in Figure 2F, the maximum number of islets in each size category was established at 3 weeks for the smallest category and by 6 weeks for the larger categories. Between 8 and 12 weeks the number of small islets significantly decreased (39%, p<0.05) and between 8 and 16 weeks of age, this reduction was even more prominent (82%, P< 0.01). In contrast, the number of intermediate and large islets remained comparatively constant between 8 and 12 weeks. After this point a clear reduction in the number of intermediate sized islets was observed at 16 weeks (77 % reduction when compared with 8 weeks, P<0.01) while the number of the largest islets even at this point only decreased by 28 % when compared with 8 weeks. Together, this data reveal that the smallest, peripherally located, islets are the first to be destroyed during insulitis induced type 1 diabetes.
The time of onset for diabetes in the NOD mouse is known to display a large individual variation. This is also reflected in the variation in β-cell volume of individual animals. As illustrated in Figure 2G, the total β-cell volume is kept relatively stable in all animals between 6 and 12 weeks of age with the exception of one 12 week old mouse in which a clear reduction was evident. In contrast, four of five 16 week old mice displayed a similar reduction in β-cell volume while one mouse appeared relatively unaffected. Diabetes has been suggested to induce β-cell regeneration either trough recruitment of progenitor cells from the ductal epithelium or through proliferation of mature insulin-producing β-cells (10-12). It is therefore possible that in addition to a preferential loss of smaller islets, the delay in
Imaging type 1 diabetes
6
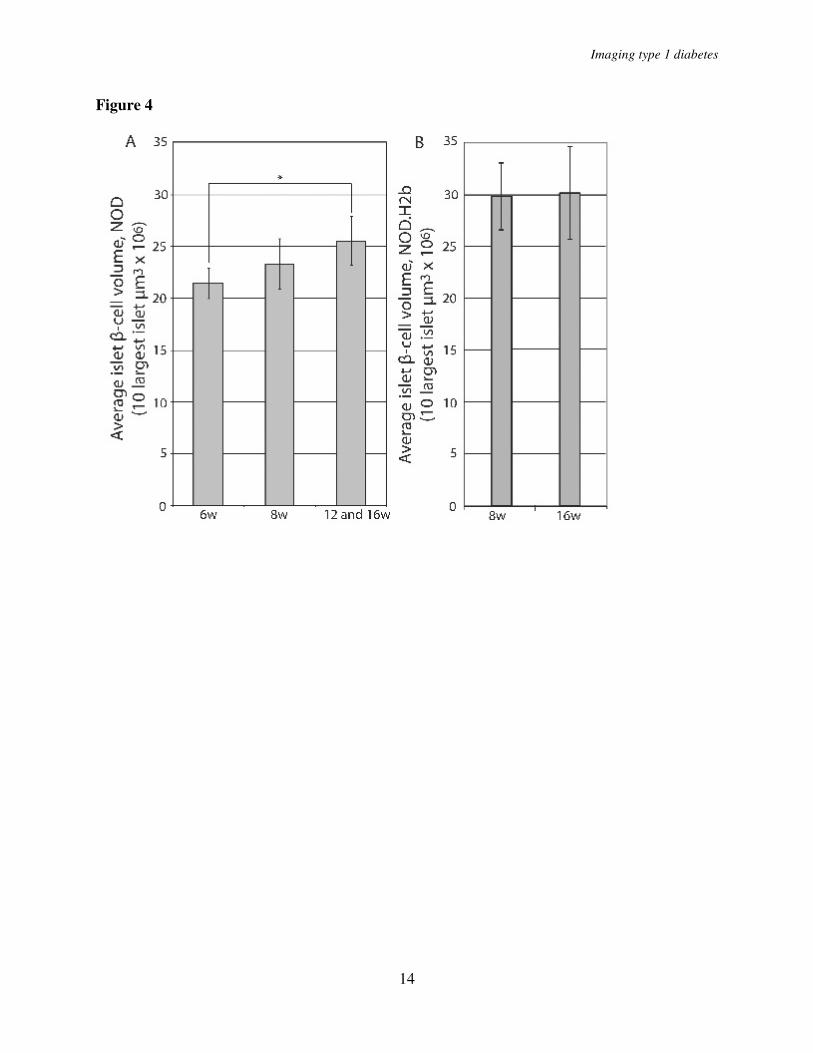
β-cell volume reduction when compared with the reduction of islet numbers could be a result of β-cell regeneration. We reasoned that if regeneration of β-cells through proliferation, and/or expansion, of mature β-cells would contribute to this phenomenon, the islets remaining in later stages of insulitis would be predicted to increase in volume. To test this hypothesis, we calculated the average β-cell volume of the 10 largest islets in 6 and 8 week old mice and compared it with the average of the 10 largest islets in the 12 and 16 week old mice that did not yet show evidence of reduction in the total β-cell volume (Fig. 2G, filled bars). The average volume of the largest NOD islets increased 19% from 6 to 12 and 16 week old animals (p<0.05) supporting the notion that regeneration of β-cells is paralleling the autoimmune destruction at this stage of the process (Fig. 4A). The islets in NOD.H2-b mice were larger than in NOD mice at 8 weeks of age but no increase in the average volume of the 10 largest islets could be observed between 8-16 weeks (Fig. 4B). Together, these data indicate that the largest islets possess a potential for compensatory β-cell proliferation and/or expansion to withstand the autoimmune destruction. To test for the possibility that the observed expansion could be due to “swelling” of individual β-cells rather than to proliferation, we determined the average β-cell volume in islets isolated from 12 and 16 week old NOD or NOD.H2-b congenic mice. In both cases the estimated average β-cell area was similar (NOD 12w 85.6 µm2, NOD 16w 75.5 µm2, NOD.H2-b 12w 76.5 µm2, NOD.H2-b 16w 81.1 µm2) providing no evidence in support of a hypermorphic alteration of the NOD β-cells.
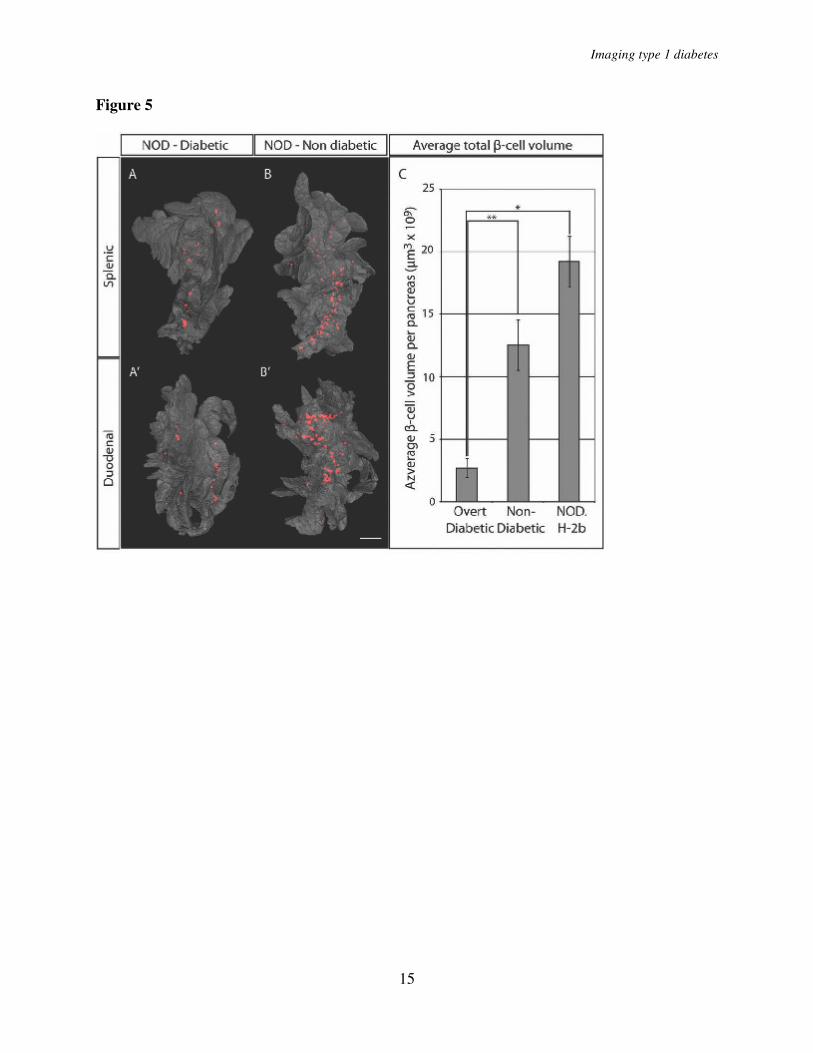
We next estimated the threshold of total β-cell volume required to withstand the development of overt diabetes (Fig. 5). Five sibling pairs of NOD origin were analyzed at the point when one of the individuals (in each litter) developed overt diabetes while the
other retained normal glucose levels. The diabetic mice displayed consistently lower total β-cell volume when compared with their non-diabetic littermates and confirms our previously reported estimates (6) of a threshold at around 2.7x109 µm3, below which the mice developed clinical diabetes (Fig. 5C). When compared to 16 week old NOD.H-2b mice, this corresponds to an approximate 86 % reduction in β-cell volume. This data suggests that the diabetic phenotype of NOD mice develops at a threshold significantly lower than what has been previously reported by point-counting morphometry (13). It is also worth noting that, the approximate threshold for development of clinical diabetes established in our study falls well within the estimated interval of a 80 to 95% reduction in β-cell mass for human type 1 diabetes (14).
We next compared the fluctuations in β-cell volume and islet numbers with the progression of autoimmunity in the NOD mice. Pancreata isolated at the same ages as analyzed above were stained with antibodies against insulin and CD3 to detect β-cells and infiltrating T lymphocytes and were submitted to OPT analysis (Fig. 6). Using this method we could assess the progression of infiltrating CD3+ T cells paralleling the progressive loss of β-cell mass. In agreement with previous observations (15), the first detectable CD3+ infiltrating cells were already present in NOD pancreata at 3 weeks of age, progressively increasing in abundance over time. Surprisingly, the preferential depletion of peripherally located islets was not found to coincide with a preferential insulitis developing in these areas of the organ. Instead, the appearance of the first CD3+ foci do not appear to occur in any preferred region of the organ, however, to what extent it follows different blood vessels or ducts have not been addressed here. A plausible explanation for this observation is that the destruction of the small islets in the periphery
Imaging type 1 diabetes
7
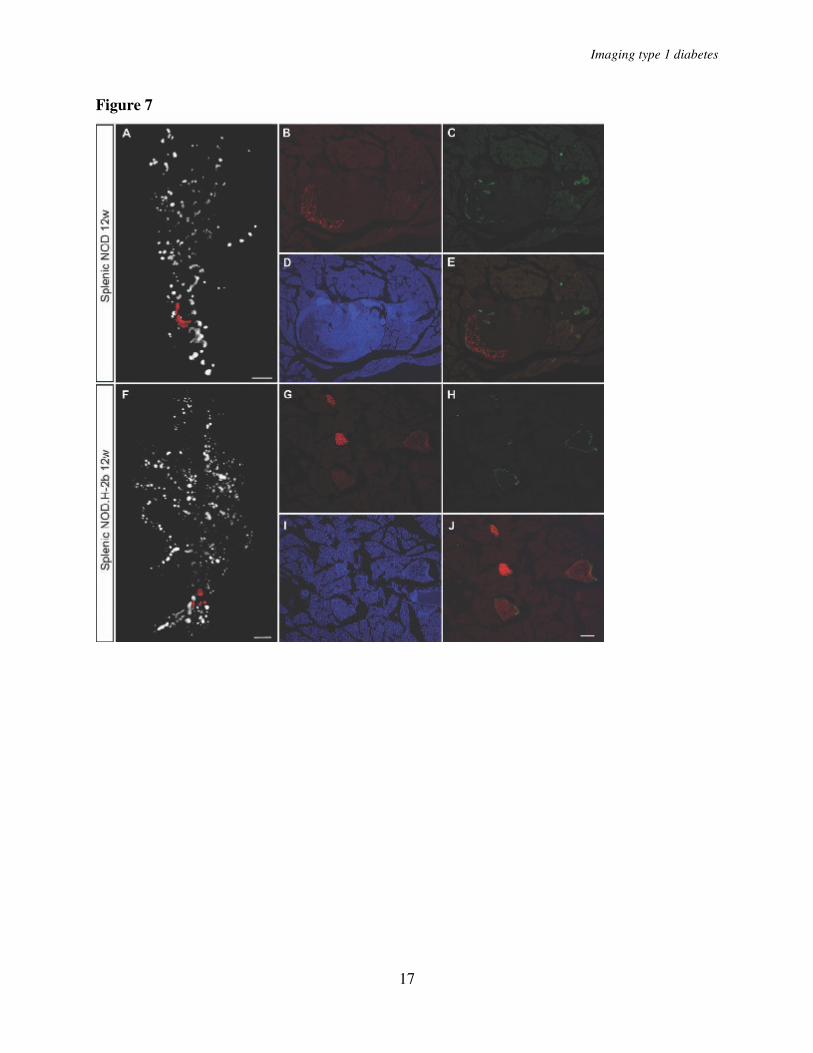
of the organ occurs more rapidly because they contain relatively few β-cells. As a consequence of this, the β-cell antigen disappears more rapidly and the infiltrating mononuclear cells are no longer retained at the location of the islet. Like unaffected islets, the islets displaying severe insulitis were surrounded by α-cells. Thus, while the β-cells eventually were destroyed also in the larger islets affected by insulitis, no corresponding reduction in alpha cells was observed (Figure 7).
At later stages, as the individual foci grew in size, the distribution was less evenly spread over the organ with some areas of large accumulations of infiltrating cells present at the same time as other areas of the organ appeared to be totally unaffected by the inflammatory process. From around 8-12 weeks, larger accumulations of CD3+ cells in direct association with islets became evident. These structures resembled tertiary lymphoid organs (TLOs) with formation of T- and B- cell areas and of high endothelial venules (Fig. 6F and G), previously reported to be associated with chronic inflammatory diseases (16) including in the NOD mouse (17).
. DISCUSSION
Using a novel tomographic imaging approach to analyze the post-weaning development of the pancreas in mice, we have provided detailed 3D spatial and quantitative data regarding the progession of autoimmune-induced insulitis and β-cell destruction in isolated pancreata from the diabetes-prone NOD model for TID. While this model has been intensively studied using conventional immunohistological methodology our approach, by enabling directly quantitative and 3D-spatial analyses of complete intact organs, gives a more comprehensive picture including a set of novel insights that will aid in understanding the molecular and cellular basis of disease progression in this system.
The observed growth kinetics of the endocrine pancreas in normal mice is not surprising nor is the progressive loss of β-cell volume observed in the diabetes-prone NOD mice after massive insulitis has been established. However, the kinetics of the decrease in islet numbers and loss of β-cell volume together with the finding that the mean β-cell volume of the largest and most resistant islet actually increase is noteworthy. In fact this observation provides evidence of a regenerative process simultaneously underway with the autoimmune-induced destruction of β-cells. This has been previously suggested based on the detection of markers associated with β-cell development reoccurring during the autoimmune destruction of β-cells in type 1 diabetes (13). This is also in line with recently reported findings that abolishment of mature β-cells and insulin expression triggers the regeneration of β-cells mainly due to the expansion of already existing mature β-cells (11). Thus, while we cannot rule out the possibility that the observed expansion of the large islets in the late stage of insulitis in part could be the result of β-cell swelling, these findings support the hypothesis that two competing processes are simultaneously ongoing in the autoimmune type 1 diabetes pancreas, one of autoimmune destruction and the other of regeneration of β-cells. Understanding the basic mechanisms controlling these processes remains an important challenge with potential implications for interfering and halting the destructive arm of the autoimmune diabetes. The observed formation of TLOs in stages of advanced insulitis may provide a clue for understanding how this is controlled. The role of these structures, which have been reported to appear in various conditions of chronic inflammation (16), could be to sustain the autoagressive insulitis tipping the balance in favor of degeneration rather than regeneration of the β-cells. Further insights into when and
Imaging type 1 diabetes
8
how these structures are formed in association with insulitis, together with a better understanding of their functional contribution to the chronic inflammation is much warranted and should shed light on how to interfere with the progression of insulitis and β-cell destruction. Another interesting observation is the unsynchronized spreading of insulitis into different parts of the organ. In view of the prevailing model for the onset and progression of insulitis, the observed co-existence of areas with full blown insulitis adjacent to areas apparently unaffected by insulitis is remarkable and suggests that local factors may provide cues for the homing of activated lymphocytes back to the pancreas.
The quantitative and 3-D spatial characterization of the autoimmune progression, from the earliest stages of
leukocyte infiltration into the endocrine pancreas to the complete destruction of the β-cell volume and development of diabetes, provides a novel and more detailed frame of the process that could be used for elucidating the effect of specific genetic factors e.g. by comparing NOD mice with transgenic or congenic strains and for efficient evaluation of various treatment protocols.
ACKNOWLEDGEMENTS Dr T. Edlund and I. Jones are acknowledged for helpful comments on the manuscript. This work was funded by grants from the NOVO-Nordisk Fonden, Swedish Diabetes Foundation (D.H.), the Juvenile Diabetes Foundation, the Swedish Research Council, and the Kempe Foundation (D.H. and U.A.)
REFERENCES 1. Gianani, R., and G. S. Eisenbarth. 2005. The stages of type 1A diabetes: 2005. Immunol
Rev 204:232-249. 2. Kikutani, H., and S. Makino. 1992. The murine autoimmune diabetes model: NOD and
related strains. Adv Immunol 51:285-322. 3. Jun, H. S., C. S. Yoon, L. Zbytnuik, N. van Rooijen, and J. W. Yoon. 1999. The role of
macrophages in T cell-mediated autoimmune diabetes in nonobese diabetic mice. The
Journal of experimental medicine 189:347-358. 4. Hoglund, P., J. Mintern, C. Waltzinger, W. Heath, C. Benoist, and D. Mathis. 1999.
Initiation of autoimmune diabetes by developmentally regulated presentation of islet cell antigens in the pancreatic lymph nodes. The Journal of experimental medicine 189:331-339.
5. Sharpe, J., U. Ahlgren, P. Perry, B. Hill, A. Ross, J. Hecksher-Sorensen, R. Baldock, and D. Davidson. 2002. Optical projection tomography as a tool for 3D microscopy and gene expression studies. Science (New York, N.Y 296:541-545.
6. Alanentalo, T., A. Asayesh, H. Morrison, C. E. Loren, D. Holmberg, J. Sharpe, and U. Ahlgren. 2007. Tomographic molecular imaging and 3D quantification within adult mouse organs. Nature Methods 4:31-33.
7. Alanentalo, T., C. E. Loren, A. Larefalk, J. Sharpe, D. Holmberg, and U. Ahlgren. 2008. High-resolution three-dimensional imaging of islet-infiltrate interactions based on optical projection tomography assessments of the intact adult mouse pancreas. Journal of
biomedical optics 13:054070. 8. Hara, M., R. F. Dizon, B. S. Glick, C. S. Lee, K. H. Kaestner, D. W. Piston, and V. P.
Bindokas. 2006. Imaging pancreatic beta-cells in the intact pancreas. American journal of
physiology 290:E1041-1047.
Imaging type 1 diabetes
9
9. Bock, T., B. Pakkenberg, and K. Buschard. 2005. Genetic background determines the size and structure of the endocrine pancreas. Diabetes 54:133-137.
10. Bonner-Weir, S., and G. C. Weir. 2005. New sources of pancreatic beta-cells. Nature
biotechnology 23:857-861. 11. Dor, Y., J. Brown, O. I. Martinez, and D. A. Melton. 2004. Adult pancreatic beta-cells
are formed by self-duplication rather than stem-cell differentiation. Nature 429:41-46. 12. Halban, P. A. 2004. Cellular sources of new pancreatic beta cells and therapeutic
implications for regenerative medicine. Nature cell biology 6:1021-1025. 13. Sreenan, S., A. J. Pick, M. Levisetti, A. C. Baldwin, W. Pugh, and K. S. Polonsky. 1999.
Increased beta-cell proliferation and reduced mass before diabetes onset in the nonobese diabetic mouse. Diabetes 48:989-996.
14. Gepts, W., and P. M. Lecompte. 1981. The pancreatic islets in diabetes. The American
journal of medicine 70:105-115. 15. Makino, S., M. Harada, Y. Kishimoto, and Y. Hayashi. 1986. Absence of insulitis and
overt diabetes in athymic nude mice with NOD genetic background. Jikken dobutsu
35:495-498. 16. Aloisi, F., and R. Pujol-Borrell. 2006. Lymphoid neogenesis in chronic inflammatory
diseases. Nat Rev Immunol 6:205-217. 17. Hjelmstrom, P., J. Fjell, T. Nakagawa, R. Sacca, C. A. Cuff, and N. H. Ruddle. 2000.
Lymphoid tissue homing chemokines are expressed in chronic inflammation. Am J
Pathol 156:1133-1138.
FIGURE LEGENDS Fig. 1. Islet β-cell distribution over time in NOD.H-2b and NOD mice. A, to J’, Isosurface rendered OPT images of representative NOD.H-2b splenic (A - E), duodenal (A’- E’) and NOD splenic (F- J) and duodenal (F’- J’) pancreata labeled for insulin (red). The pancreas outline (grey) is based on the signal from tissue autoflourescense. In contrast to NOD.H-2b mice (A - E’) the expected progressive destruction in islet β-cell volume is clearly observed in NOD mice (F, - J’). Scale bar corresponds to 2.3mm in I’; 2.1mm in C; 2mm in D,D’, J, J' and G’; 1.9 mm in B and H; 1.8 mm in I and H'; 1.7mm in C' and E'; 1.6 mm in A, E and F'; 1.5 mm in G; 1.4mm in A’ and B’; 1.2 mm in F. Fig. 2. NOD β-cell decay by islet β-cell volume size categories. A - E, Iso-surface rendered OPT images of representative islet β-cell distributions in 3, 6, 8, 12 and 16 week old NOD mice (splenic lobe). Individual Islet β-cell volumes are reconstructed based on the signal from insulin specific antibodies and have been pseudo colored to highlight the distribution of “large” (> 5x10⁶
µm3 - yellow), “intermediate” (1 to 5x106 µm3 - red) and “small” (< 1x106 µm3 - white) islets. Scale bar in corresponds to 2mm in (E), 1.9mm in (C) 1.8mm in (D), 1.5mm in (B) and 1.2 mm in (A). F, Graph illustrating the progressive loss of Ins+ islets in 3 - 16 week NOD pancreas (duodenal and splenic) broken down to size categories. The values on the Y-axis corresponds the 10log value of the average number of Ins+ islets within each size category +/- S. E. M. The numbers on each bar corresponds to the average number of Ins+ islets within each size category. G, Graph illustrating individual variations in total pancreatic β-cell volume in NOD mice at 3, 6, 8, 12 and 16 weeks. Relatively unaffected individuals (filled bars) with a total β-cell volume over 12 x 109 µm3 (red line) can be identified at both 12 and 16 weeks. n=5 for 3, 6, 8, 16 weeks and
Imaging type 1 diabetes
10
n=4 for 12 weeks. Significance levels for the decay of β-cell volume and number of islets are indicated * indicates p<0.05, ** indicates p<0.01. Fig. 3. A and D, graphs showing the average whole pancreas volume (duodenal and splenic) at 3, 8, and 16 weeks and in NOD.H-2b mice (A) and in NOD mice at 3, 6, 8, 12 and 16 weeks (D). B
and E, average total pancreatic β-cell volume in NOD.H2-b (B) and NOD (E). C and F, average islet number in NOD.H2-b (C) and NOD (F) mice. n=5 for NOD at 3, 6, 8, 16 weeks, n=4 for NOD at 12 weeks and n=3 for NOD.H-2b at 3, 8 and 16 weeks. Values are given +/- S. E. M. Significance levels for the decay of β-cell volume and number of islets are indicated * indicates p<0.05, ** indicates p<0.01. Fig. 4. A, Graph showing the average volume of the 10 largest islet -cell volumes in 6, 8 and 12 and 16 week old NOD mice (in the latter group only animals with a total pancreatic β-cell volume over 12 x 109 µm3 indicated by filled bars in figure 2G were included). The average size of the 10 largest islet β-cell volumes increase from 6 to 16 weeks (P=0.011). n= 5 for 6 and 8 weeks, n= 4 for 12 and 16 weeks. B, Graph showing the average volume of the 10 largest islet -cell volumes in 8 and 12 and 16 week old NOD.H-2b mice. Fig. 5. Comparison of overt diabetic and non-diabetic NOD sibling pairs. A - B’, Isosurface rendered OPT images of representative diabetic (A,A’) and non diabetic (B,B’) splenic (A and B) and duodenal (A’ and B’) pancreata labeled for insulin (red). The pancreas outline (grey) is based on the signal from tissue autoflourescense. C, Graph showing the average total β-cell volume in overt diabetic and non diabetic NOD sibling pairs (n=5 for each group, pairs analyzed at 14, 14, 18, 18 and 23 weeks) and in NOD.H 2b mice at 16 weeks (n=3) +/- S. E. M. Scale bar is 2.2mm in A’ and 2mm in A, B, and B’. Significance levels are indicated * p<0.05, ** p<0.01. Fig. 6. Spatial assessment of the progression of autoimmune insulitis in the NOD mouse. A-E, Iso-surface rendered OPT images of representative pancreata (duodenal) from NOD mice at 3, 6, 8, 12 and 16 weeks. Ins+ islets (red) are reconstructed based on the signal from insulin specific antibodies and infiltrating T-lymphocytes (green) based on the signal from CD3 specific antibodies. Insets, A´-E´´, are high magnification views corresponding to the enclosed boxes in A, D and E respectively. n= 3 for 3, 6, 8 and 12 weeks, n= 5 for 16 weeks. Abbreviation: Ins, insulin. F and G, sections of a pancreas from a 14 week old female NOD mouse stained with DAPI, anti-CD3 (green) and anti-CD19 (red) (F) or anti-CD3 (green) and anti-MAdCAM-1 (red) (G). F, B cell areas (arrow head) and T cell areas (arrow) are indicated by arrow head. G, High endothelial venules (arrow head). The scale bar in E corresponds to 2mm in (E), 1.5 mm in (C), 1.4mm in (B), 1.3 mm in (D) and 1.0 mm in (A). The scale bar in E’’ corresponds to 1mm in E’’, E’ D’’, D’, and 0.76mm in A’’, A’. Scale bar in G corresponds to 100µm in F and G. Scale bar in I corresponds to 100µm in H and I. Fig. 7. Comparision of α- and β-cell distribution in 12w NOD and NODH2b mice. A and F, volume renderings of β-cell distribution. Cryosections in B-E and G-J corresponds to red pseudocolor in A and F respectively. Sections were counter stained against glucagon (C, E, H
and J) and DAPI (D and I). Note the remaining Glu+ cells in the highly infiltrated NOD islets (C
and E). B and G illustrates Ins+ β-cells. Scale bar in A and F corresponds to 1mm. Scale bar in J
corresponds to 100 µm in B-E and G-J.
Imaging type 1 diabetes
11
Figure 1
Imaging type 1 diabetes
12
Figure 2
Imaging type 1 diabetes
13
Figure 3
Imaging type 1 diabetes
14
Figure 4
Imaging type 1 diabetes
15
Figure 5

Imaging type 1 diabetes
16
Figure 6
Imaging type 1 diabetes
17
Figure 7


![Within-Site Variation in Feather Stable Hydrogen Isotope ... · cally not being explicitly quantified in geographic assignment tests using non-specific trans- ... [24, 25] and, potentially,](https://static.fdocument.org/doc/165x107/6093b8997a45d033dd56566b/within-site-variation-in-feather-stable-hydrogen-isotope-cally-not-being-explicitly.jpg)