Predictions of fan broadband noise due to rotor-stator ... OF FAN BROADBAND NOISE DUE TO...
8
ICSV14 Cairns • Australia 9-12 July, 2007 PREDICTIONS OF FAN BROADBAND NOISE DUE TO ROTOR-STATOR INTERACTION Vincent Jurdic 1 * , Phillip Joseph 1† , Antoine Moreau 2‡ , Lars Enghardt 2§ 1 ISVR University of Southampton University road Southampton SO17 England 2 German Aerospace Center (DLR) Institute of Propulsion Technology, Engine Acoustics Branch Mueller-Breslau-Str. 8 10623 Berlin Germany * † ‡ § Abstract This paper presents a comparison of the predicted and measured broadband noise gen- erated in a low-speed fan rig. It is assumed that the dominant noise generation mechanism is rotor-stator interaction whereby turbulent wakes from the rotor interact with the downstream stator. The stator is modelled as a cascade of flat plate airfoils. The acoustic response of these blades is predicted using classical theory for the acoustic response due a rectilinear cascade of flat plate airfoils in which a harmonic (single-frequency,single-wavenumber) gust is incident. This theory has been extended to predict the broadband noise generated by impinging homoge- nous isotropic turbulence. The present paper proposes a comparison between measured and predicted noise power spectra. Aerodynamic measurements have also been performed at different radial positions down- stream of the rotor to obtain velocity spectra and wake profiles. The aerodynamics measurements will be presented in this paper to validate the assump- tions of homogenous isotropic turbulence made in the noise model. From these measurements, the turbulence intensity and length scale at the stator leading edge are also determined as input quantities to the noise model.
Transcript of Predictions of fan broadband noise due to rotor-stator ... OF FAN BROADBAND NOISE DUE TO...
ICSV14 Cairns • Australia
9-12 July, 2007
PREDICTIONS OF FAN BROADBAND NOISE DUE TOROTOR-STATOR INTERACTION
Vincent Jurdic1* , Phillip Joseph1 †, Antoine Moreau2 ‡, Lars Enghardt2 §
1ISVRUniversity of Southampton
University roadSouthampton SO17
England2German Aerospace Center (DLR)
Institute of Propulsion Technology, Engine Acoustics BranchMueller-Breslau-Str. 8
10623 BerlinGermany
*vj�isvr.soton.a .uk†pfj�isvr.soton.a .uk
‡antoine.moreau�dlr.de§lars.enghardt�dlr.de
Abstract
This paper presents a comparison of the predicted and measured broadband noise gen-erated in a low-speed fan rig. It is assumed that the dominantnoise generation mechanism isrotor-stator interaction whereby turbulent wakes from therotor interact with the downstreamstator.
The stator is modelled as a cascade of flat plate airfoils. Theacoustic response of theseblades is predicted using classical theory for the acousticresponse due a rectilinear cascade offlat plate airfoils in which a harmonic (single-frequency,single-wavenumber) gust is incident.This theory has been extended to predict the broadband noisegenerated by impinging homoge-nous isotropic turbulence. The present paper proposes a comparison between measured andpredicted noise power spectra.
Aerodynamic measurements have also been performed at different radial positions down-stream of the rotor to obtain velocity spectra and wake profiles.
The aerodynamics measurements will be presented in this paper to validate the assump-tions of homogenous isotropic turbulence made in the noise model. From these measurements,the turbulence intensity and length scale at the stator leading edge are also determined as inputquantities to the noise model.
ICSV14 • 9–12 July 2007 • Cairns • Australia
1. INTRODUCTION
Improvements in the reduction of jet noise and fan tones havemeant that fan broadband noiseis now a major noise source. It is widely believed that the dominant source of fan broadbandnoise is due to the interaction between rotor wake turbulence and the stator vanes.
The first part of this paper deals with the formulation of Cheong et al [1] for the acousticpower spectrum radiated by a two-dimensional flat plate cascade due to impinging isotropichomogeneous turbulence. The second part of this paper describes the experimental low speedfan rig at DLR Berlin. The third part of this paper describes the aerodynamic and acousticmeasurements for the use in the prediction model. Finally, acomparison is presented betweenthe measured and predicted sound power spectra, upstream and downstream of the fan stage.
2. ROTOR-STATOR INTERACTION BROADBAND NOISE MODEL
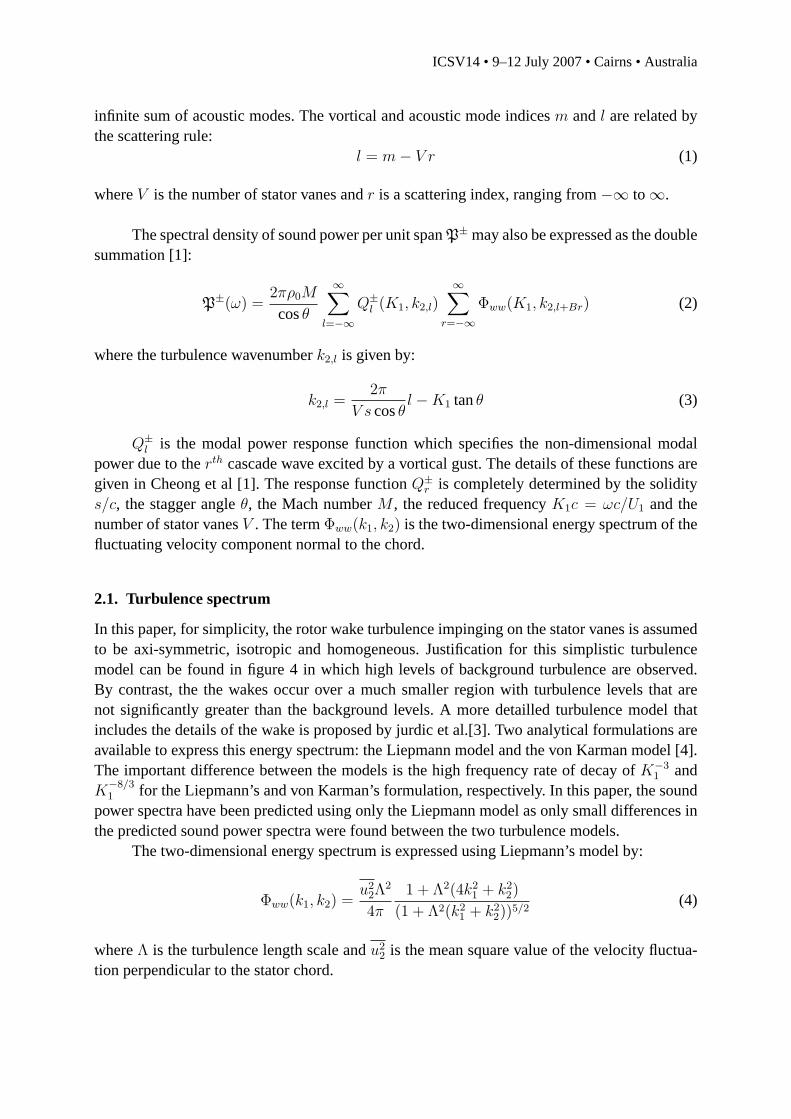
The broadband noise generated by rotor-stator interactionis predicted based on strip theory ap-plied to the stator. The sound power radiated by each strip ispredicted using a two-dimensionalmodel of the unsteady blade response. Justification for the use of a two-dimensional blade re-sponse model follows from the findings by Cheong et al [1] in which noise predictions obtainedusing the current two-dimensional model gave near identical results to that obtained using thethree-dimensional noise model of Hanson [2]. Each section is unrolled at the mid-section radiusto produce an infinite cascade of flat plates of chordc, spaced bys and with a stagger angleθas shown in figure 1. The coordinate systems(x1, x2, x3) corresponds to a unrolled duct-boundcoordinate system while(y1, y2, y3) is a vane-bound coordinate system withy1 being in thechordwise direction. The cascade is immersed in a mean flow ofspeedU1 in the direction ofthe stator. Velocity fluctuations are assumed to be very small compared to the mean velocitymagnitudeU1. The two-dimensional model also assumes that the flat plate cascade is situatedin a free-field and that the duct has no effect on the sound power radiation.
U1
q
y1
y2
x2
x1
s
c
Figure 1. Cascade model and coordinate system
An expression for the sound power has been formulated in which an infinite number ofimpinging vortical Fourier modes interacts with the cascade, each of which is scattered into an
ICSV14 • 9–12 July 2007 • Cairns • Australia
infinite sum of acoustic modes. The vortical and acoustic mode indicesm andl are related bythe scattering rule:
l = m − V r (1)
whereV is the number of stator vanes andr is a scattering index, ranging from−∞ to ∞.
The spectral density of sound power per unit spanP± may also be expressed as the doublesummation [1]:
P±(ω) =2πρ0M
cosθ
∞∑
l=−∞
Q±
l (K1, k2,l)∞
∑
r=−∞
Φww(K1, k2,l+Br) (2)
where the turbulence wavenumberk2,l is given by:
k2,l =2π
V s cosθl − K1 tanθ (3)
Q±
l is the modal power response function which specifies the non-dimensional modalpower due to therth cascade wave excited by a vortical gust. The details of thesefunctions aregiven in Cheong et al [1]. The response functionQ±
r is completely determined by the soliditys/c, the stagger angleθ, the Mach numberM , the reduced frequencyK1c = ωc/U1 and thenumber of stator vanesV . The termΦww(k1, k2) is the two-dimensional energy spectrum of thefluctuating velocity component normal to the chord.
2.1. Turbulence spectrum
In this paper, for simplicity, the rotor wake turbulence impinging on the stator vanes is assumedto be axi-symmetric, isotropic and homogeneous. Justification for this simplistic turbulencemodel can be found in figure 4 in which high levels of background turbulence are observed.By contrast, the the wakes occur over a much smaller region with turbulence levels that arenot significantly greater than the background levels. A moredetailled turbulence model thatincludes the details of the wake is proposed by jurdic et al.[3]. Two analytical formulations areavailable to express this energy spectrum: the Liepmann model and the von Karman model [4].The important difference between the models is the high frequency rate of decay ofK−3
1 andK
−8/31 for the Liepmann’s and von Karman’s formulation, respectively. In this paper, the sound
power spectra have been predicted using only the Liepmann model as only small differences inthe predicted sound power spectra were found between the twoturbulence models.
The two-dimensional energy spectrum is expressed using Liepmann’s model by:
Φww(k1, k2) =u2
2Λ2
4π
1 + Λ2(4k21 + k2
2)
(1 + Λ2(k21 + k2
2))5/2
(4)
whereΛ is the turbulence length scale andu22 is the mean square value of the velocity fluctua-
tion perpendicular to the stator chord.
ICSV14 • 9–12 July 2007 • Cairns • Australia
3. LOW SPEED FAN RIG
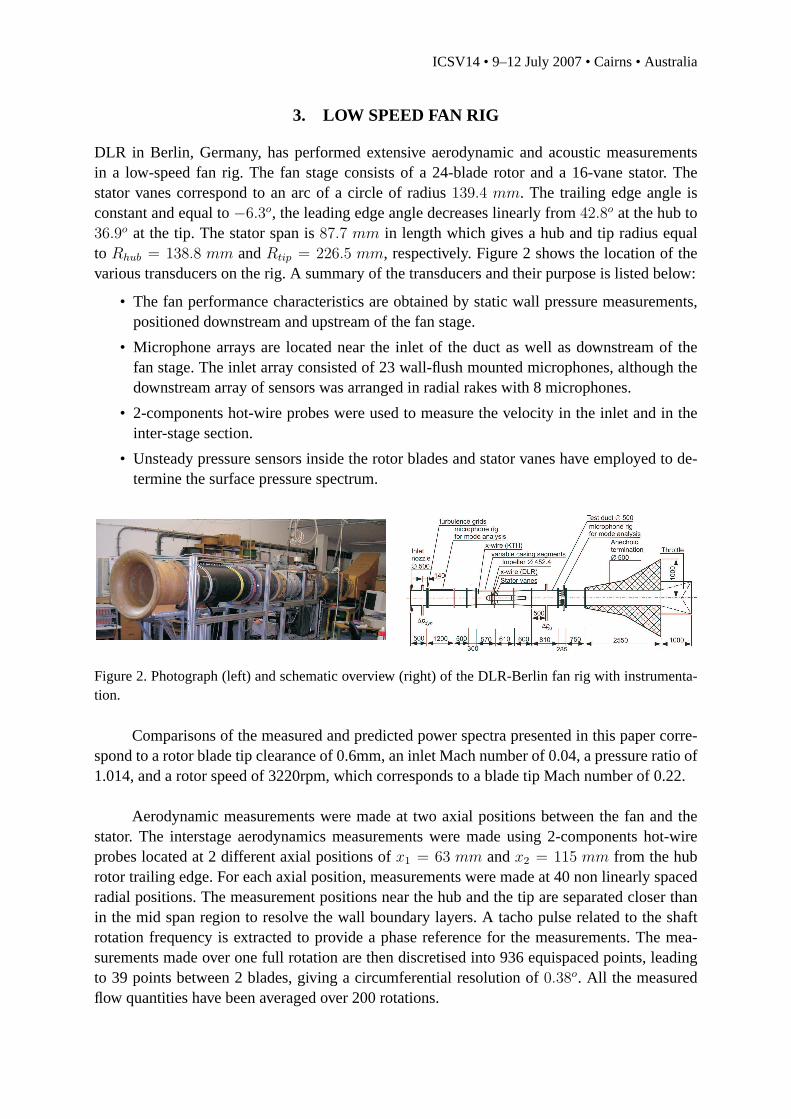
DLR in Berlin, Germany, has performed extensive aerodynamicand acoustic measurementsin a low-speed fan rig. The fan stage consists of a 24-blade rotor and a 16-vane stator. Thestator vanes correspond to an arc of a circle of radius139.4 mm. The trailing edge angle isconstant and equal to−6.3o, the leading edge angle decreases linearly from42.8o at the hub to36.9o at the tip. The stator span is87.7 mm in length which gives a hub and tip radius equalto Rhub = 138.8 mm andRtip = 226.5 mm, respectively. Figure 2 shows the location of thevarious transducers on the rig. A summary of the transducersand their purpose is listed below:
• The fan performance characteristics are obtained by static wall pressure measurements,positioned downstream and upstream of the fan stage.
• Microphone arrays are located near the inlet of the duct as well as downstream of thefan stage. The inlet array consisted of 23 wall-flush mountedmicrophones, although thedownstream array of sensors was arranged in radial rakes with 8 microphones.
• 2-components hot-wire probes were used to measure the velocity in the inlet and in theinter-stage section.
• Unsteady pressure sensors inside the rotor blades and stator vanes have employed to de-termine the surface pressure spectrum.
Figure 2. Photograph (left) and schematic overview (right) of the DLR-Berlin fan rig with instrumenta-tion.
Comparisons of the measured and predicted power spectra presented in this paper corre-spond to a rotor blade tip clearance of 0.6mm, an inlet Mach number of 0.04, a pressure ratio of1.014, and a rotor speed of 3220rpm, which corresponds to a blade tip Mach number of 0.22.
Aerodynamic measurements were made at two axial positions between the fan and thestator. The interstage aerodynamics measurements were made using 2-components hot-wireprobes located at 2 different axial positions ofx1 = 63 mm andx2 = 115 mm from the hubrotor trailing edge. For each axial position, measurementswere made at 40 non linearly spacedradial positions. The measurement positions near the hub and the tip are separated closer thanin the mid span region to resolve the wall boundary layers. A tacho pulse related to the shaftrotation frequency is extracted to provide a phase reference for the measurements. The mea-surements made over one full rotation are then discretised into 936 equispaced points, leadingto 39 points between 2 blades, giving a circumferential resolution of 0.38o. All the measuredflow quantities have been averaged over 200 rotations.
ICSV14 • 9–12 July 2007 • Cairns • Australia
4. INTERSTAGE AERODYNAMIC MEASUREMENTS
The aerodynamic input data required by the noise model is obtained directly from the interstagemeasurements. Details of these aerodynamic measurements are presented below.
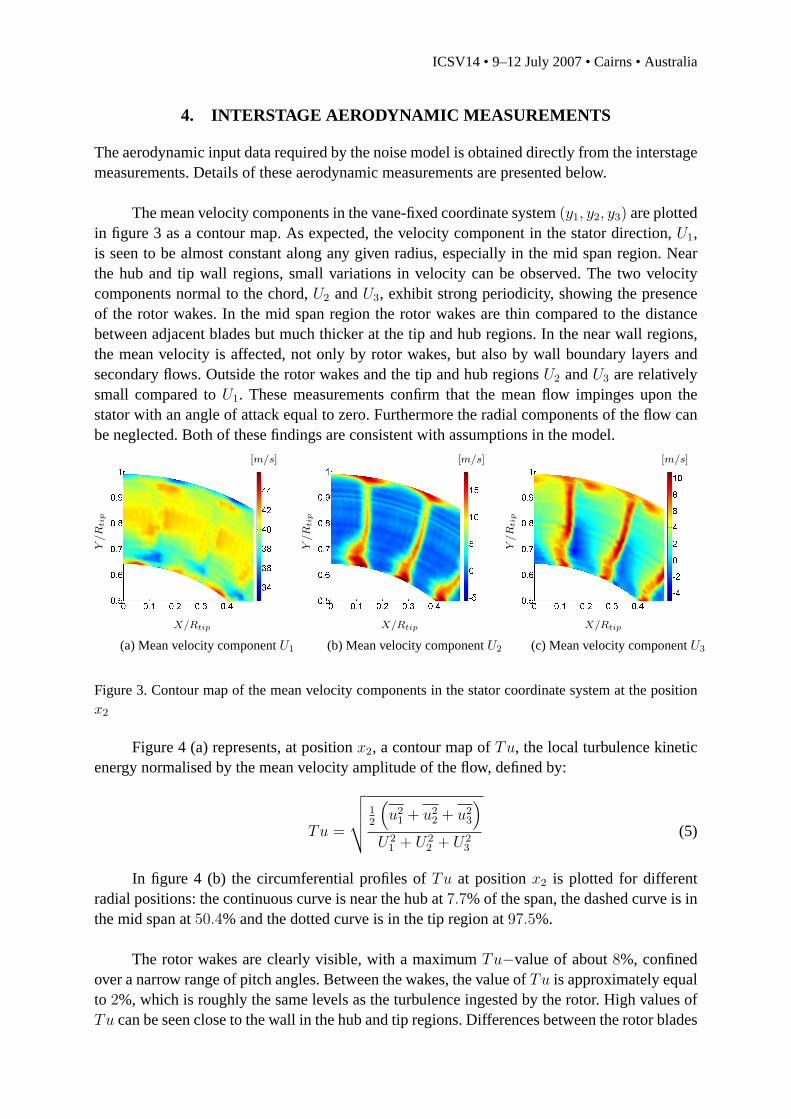
The mean velocity components in the vane-fixed coordinate system(y1, y2, y3) are plottedin figure 3 as a contour map. As expected, the velocity component in the stator direction,U1,is seen to be almost constant along any given radius, especially in the mid span region. Nearthe hub and tip wall regions, small variations in velocity can be observed. The two velocitycomponents normal to the chord,U2 andU3, exhibit strong periodicity, showing the presenceof the rotor wakes. In the mid span region the rotor wakes are thin compared to the distancebetween adjacent blades but much thicker at the tip and hub regions. In the near wall regions,the mean velocity is affected, not only by rotor wakes, but also by wall boundary layers andsecondary flows. Outside the rotor wakes and the tip and hub regionsU2 andU3 are relativelysmall compared toU1. These measurements confirm that the mean flow impinges upon thestator with an angle of attack equal to zero. Furthermore theradial components of the flow canbe neglected. Both of these findings are consistent with assumptions in the model.
Y/R
tip
X/Rtip
[m/s]
(a) Mean velocity componentU1
Y/R
tip
X/Rtip
[m/s]
(b) Mean velocity componentU2
Y/R
tip
X/Rtip
[m/s]
(c) Mean velocity componentU3
Figure 3. Contour map of the mean velocity components in the stator coordinate system at the positionx2
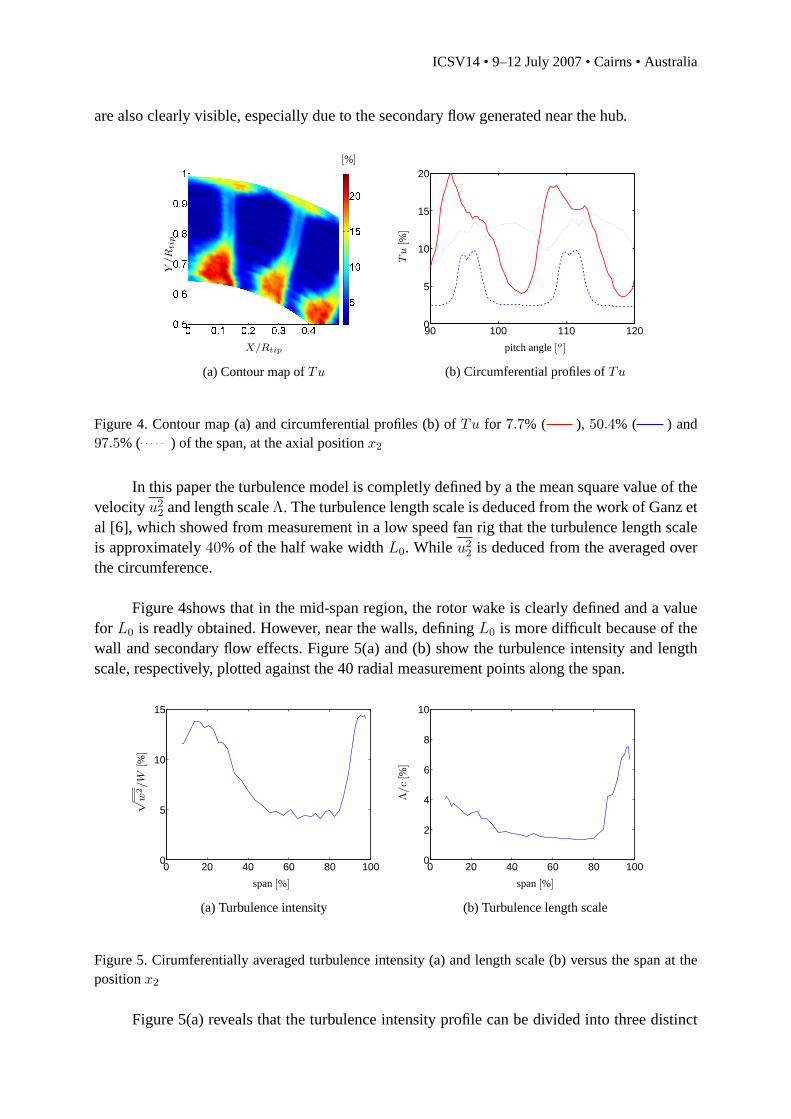
Figure 4 (a) represents, at positionx2, a contour map ofTu, the local turbulence kineticenergy normalised by the mean velocity amplitude of the flow,defined by:
Tu =
√
√
√
√
12
(
u21 + u2
2 + u23
)
U21 + U2
2 + U23
(5)
In figure 4 (b) the circumferential profiles ofTu at positionx2 is plotted for differentradial positions: the continuous curve is near the hub at7.7% of the span, the dashed curve is inthe mid span at50.4% and the dotted curve is in the tip region at97.5%.
The rotor wakes are clearly visible, with a maximumTu−value of about8%, confinedover a narrow range of pitch angles. Between the wakes, the value ofTu is approximately equalto 2%, which is roughly the same levels as the turbulence ingested by the rotor. High values ofTu can be seen close to the wall in the hub and tip regions. Differences between the rotor blades
ICSV14 • 9–12 July 2007 • Cairns • Australia
are also clearly visible, especially due to the secondary flow generated near the hub.
Y/R
tip
X/Rtip
[%]
(a) Contour map ofTu
90 100 110 1200
5
10
15
20
Tu
[%]
pitch angle[o]
(b) Circumferential profiles ofTu
Figure 4. Contour map (a) and circumferential profiles (b) ofTu for 7.7% ( ), 50.4% ( ) and97.5% ( ) of the span, at the axial positionx2
In this paper the turbulence model is completly defined by a the mean square value of thevelocityu2
2 and length scaleΛ. The turbulence length scale is deduced from the work of Ganzetal [6], which showed from measurement in a low speed fan rig that the turbulence length scaleis approximately40% of the half wake widthL0. While u2
2 is deduced from the averaged overthe circumference.
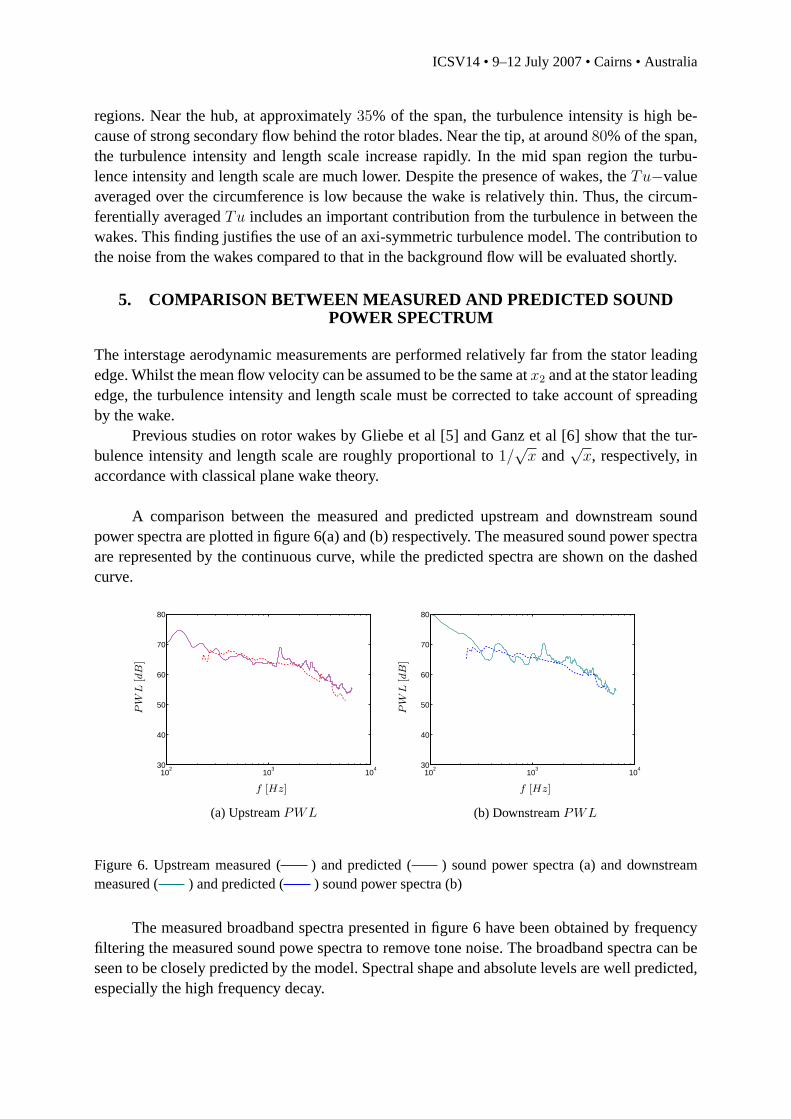
Figure 4shows that in the mid-span region, the rotor wake is clearly defined and a valuefor L0 is readly obtained. However, near the walls, definingL0 is more difficult because of thewall and secondary flow effects. Figure 5(a) and (b) show the turbulence intensity and lengthscale, respectively, plotted against the 40 radial measurement points along the span.
0 20 40 60 80 1000
5
10
15
p
w2/W
[%]
span[%]
(a) Turbulence intensity
0 20 40 60 80 1000
2
4
6
8
10
Λ/c
[%]
span[%]
(b) Turbulence length scale
Figure 5. Cirumferentially averaged turbulence intensity (a) and length scale (b) versus the span at thepositionx2
Figure 5(a) reveals that the turbulence intensity profile can be divided into three distinct
ICSV14 • 9–12 July 2007 • Cairns • Australia
regions. Near the hub, at approximately35% of the span, the turbulence intensity is high be-cause of strong secondary flow behind the rotor blades. Near the tip, at around80% of the span,the turbulence intensity and length scale increase rapidly. In the mid span region the turbu-lence intensity and length scale are much lower. Despite thepresence of wakes, theTu−valueaveraged over the circumference is low because the wake is relatively thin. Thus, the circum-ferentially averagedTu includes an important contribution from the turbulence in between thewakes. This finding justifies the use of an axi-symmetric turbulence model. The contribution tothe noise from the wakes compared to that in the background flow will be evaluated shortly.
5. COMPARISON BETWEEN MEASURED AND PREDICTED SOUNDPOWER SPECTRUM
The interstage aerodynamic measurements are performed relatively far from the stator leadingedge. Whilst the mean flow velocity can be assumed to be the sameatx2 and at the stator leadingedge, the turbulence intensity and length scale must be corrected to take account of spreadingby the wake.
Previous studies on rotor wakes by Gliebe et al [5] and Ganz etal [6] show that the tur-bulence intensity and length scale are roughly proportional to 1/
√x and
√x, respectively, in
accordance with classical plane wake theory.
A comparison between the measured and predicted upstream and downstream soundpower spectra are plotted in figure 6(a) and (b) respectively. The measured sound power spectraare represented by the continuous curve, while the predicted spectra are shown on the dashedcurve.
102
103
10430
40
50
60
70
80
PW
L[d
B]
f [Hz]
(a) UpstreamPWL
102
103
10430
40
50
60
70
80
PW
L[d
B]
f [Hz]
(b) DownstreamPWL
Figure 6. Upstream measured ( ) and predicted ( ) sound power spectra (a) and downstreammeasured ( ) and predicted ( ) sound power spectra (b)
The measured broadband spectra presented in figure 6 have been obtained by frequencyfiltering the measured sound powe spectra to remove tone noise. The broadband spectra can beseen to be closely predicted by the model. Spectral shape andabsolute levels are well predicted,especially the high frequency decay.
ICSV14 • 9–12 July 2007 • Cairns • Australia
6. CONCLUSION
The aerodynamics measurements have shown that the flow impinging upon the stator vanes canbe assumed as a uniform two dimensional flow. The flow can be also divided into three distinctregions: the hub, mid span and tip regions. In the mid span region the wakes generate com-paratively low levels of turbulence. Near the wall, the turbulence values are larger because ofsecondary flow and the wall boundary layers.
A simple analytical model of the turbulence impinging the stator vanes has been shown togive encouraging agreement with experimental results. Thespectral shape and absolute levelsare relatively well predicted.
This preliminary study appears to suggest that most of the broadband noise produced inthis low-speed fan rig is generated by secondary flow effectsat the walls. More work is neededto confirm this hypothesis.
REFERENCES
[1] C. Cheong, P. Joseph, and S. Lee, “High frequency formulation for the acoustic powerspectrum due to cascade-turbulence interaction”,Journal of the Acoustical Society ofAmerica 119, no. 1, 108–22(2006).
[2] D. B. Hanson, K. P. Horan, “Turbulence/cascade interaction - spectra of inflow, cascade re-sponse, and noise”,AIAA/CEAS Aeroacoustics Conference, 4th (19th AIAA AeroacousticsConference), (June 2-4, 1998).
[3] V. Jurdic, A. Moreau, P. Joseph, L. Enghardt, J. Coupland,“A comparison between mea-sured and predicted fan broadband noise due to rotor-statorinteraction”, AIAA/CEASAeroacoustics Conference, 13th, (May 21-23, 2007).
[4] R. K. Amiet, “Acoustic radiation from an airfoil in a turbulent stream”,41, no. 4, 407–420(1975). 75120002976.
[5] P. Gliebe, R. Mani,S. Shin, B. Mitchell,G. Ashford,S. Salamah, S. Connell, “AeroacousticPrediction Codes”,NASA/CR-2000-210244 (2000).
[6] U. W. Ganz, P. D. Joppa, T. J. Patten, D. F. Scharpf, “Boeing18-inch fan rig broadbandnoise test”,NASA/CR-1998-208704 (1998).