
Ppb-level mid-infrared ethane detection based on three ......Ppb-level mid-infrared ethane detection...
13
1 3 DOI 10.1007/s00340-016-6460-6 Appl. Phys. B (2016) 122:185 Ppb‑level mid‑infrared ethane detection based on three measurement schemes using a 3.34‑μm continuous‑wave interband cascade laser Chunguang Li 1,2 · Chuantao Zheng 1,2 · Lei Dong 1,3 · Weilin Ye 1,4 · Frank K. Tittel 1 · Yiding Wang 2 Received: 11 March 2016 / Accepted: 6 June 2016 © Springer-Verlag Berlin Heidelberg 2016 For the quasi-simultaneous DAS and WMS scheme, both the 2f signal and the direct absorption signal were simul- taneously extracted using a LabVIEW platform, and four C 2 H 6 samples (0, 30, 60 and 90 ppbv with nitrogen as the balance gas) were used as the target gases to assess the sen- sor performance. A detailed comparison of the three meas- urement schemes is reported. Atmospheric C 2 H 6 measure- ments on the Rice University campus and a field test at a compressed natural gas station in Houston, TX, were con- ducted to evaluate the performance of the sensor system as a robust and reliable field-deployable sensor system. 1 Introduction Ethane (C 2 H 6 ) is the second largest component of natural gas after methane (CH 4 ). C 2 H 6 is used in the production of ethylene (C 2 H 4 ) as well as in the manufacture of other com- modity chemicals. C 2 H 6 is also an explosive when mixed with 3–12.5 % volume of air. C 2 H 6 occurs as a trace gas in the atmosphere at concentration levels of several ppbv. In fact, C 2 H 6 is the most abundant non-methane hydrocarbon in the atmosphere that strongly affects both atmosphere chemistry and climate [1, 2]. Hence, the detection of C 2 H 6 , at low concentration levels (i.e., ppbv), is important in envi- ronmental monitoring [3, 4]. Furthermore, ultra-sensitive C 2 H 6 detection has found applications in human breath analysis as a noninvasive method to monitor and identify different diseases, such as lung cancer and asthma [5–7]. There are two typical techniques used in the detection of trace-level gases based on infrared absorption spectroscopy. The first technique is direct absorption spectroscopy (DAS), in which excitation sources such as near- and mid-infrared lasers or an incandescent light source [8, 9] can be used. An advan- tage of DAS is its ability to offer quantitative concentration Abstract A ppb-level mid-infrared ethane (C 2 H 6 ) sensor was developed using a continuous-wave, thermoelectrically cooled, distributed feedback interband cascade laser emit- ting at 3.34 μm and a miniature dense patterned multipass gas cell with a 54.6-m optical path length. The performance of the sensor was investigated using two different tech- niques based on the tunable interband cascade laser: direct absorption spectroscopy (DAS) and second-harmonic wave- length modulation spectroscopy (2f-WMS). Three measure- ment schemes, DAS, WMS and quasi-simultaneous DAS and WMS, were realized based on the same optical sen- sor core. A detection limit of ~7.92 ppbv with a precision of ±30 ppbv for the separate DAS scheme with an averag- ing time of 1 s and a detection limit of ~1.19 ppbv with a precision of about ±4 ppbv for the separate WMS scheme with a 4-s averaging time were achieved. An Allan–Werle variance analysis indicated that the precisions can be further improved to 777 pptv @ 166 s for the separate DAS scheme and 269 pptv @ 108 s for the WMS scheme, respectively. * Chuantao Zheng [email protected] * Frank K. Tittel [email protected] 1 Department of Electrical and Computer Engineering, Rice University, 6100 Main Street, Houston, TX 77005, USA 2 State Key Laboratory on Integrated Optoelectronics, College of Electronic Science and Engineering, Jilin University, 2699 Qianjin Street, Changchun 130012, China 3 State Key Laboratory of Quantum Optics and Quantum Optics Devices, Institute of Laser Spectroscopy, Shanxi University, Taiyuan 030006, China 4 College of Engineering, Shantou University, Shantou 515063, China
Transcript of Ppb-level mid-infrared ethane detection based on three ......Ppb-level mid-infrared ethane detection...
1 3
DOI 10.1007/s00340-016-6460-6Appl. Phys. B (2016) 122:185
Ppb‑level mid‑infrared ethane detection based on three measurement schemes using a 3.34‑μm continuous‑wave interband cascade laser
Chunguang Li1,2 · Chuantao Zheng1,2 · Lei Dong1,3 · Weilin Ye1,4 · Frank K. Tittel1 · Yiding Wang2
Received: 11 March 2016 / Accepted: 6 June 2016 © Springer-Verlag Berlin Heidelberg 2016
For the quasi-simultaneous DAS and WMS scheme, both the 2f signal and the direct absorption signal were simul-taneously extracted using a LabVIEW platform, and four C2H6 samples (0, 30, 60 and 90 ppbv with nitrogen as the balance gas) were used as the target gases to assess the sen-sor performance. A detailed comparison of the three meas-urement schemes is reported. Atmospheric C2H6 measure-ments on the Rice University campus and a field test at a compressed natural gas station in Houston, TX, were con-ducted to evaluate the performance of the sensor system as a robust and reliable field-deployable sensor system.
1 Introduction
Ethane (C2H6) is the second largest component of natural gas after methane (CH4). C2H6 is used in the production of ethylene (C2H4) as well as in the manufacture of other com-modity chemicals. C2H6 is also an explosive when mixed with 3–12.5 % volume of air. C2H6 occurs as a trace gas in the atmosphere at concentration levels of several ppbv. In fact, C2H6 is the most abundant non-methane hydrocarbon in the atmosphere that strongly affects both atmosphere chemistry and climate [1, 2]. Hence, the detection of C2H6, at low concentration levels (i.e., ppbv), is important in envi-ronmental monitoring [3, 4]. Furthermore, ultra-sensitive C2H6 detection has found applications in human breath analysis as a noninvasive method to monitor and identify different diseases, such as lung cancer and asthma [5–7].
There are two typical techniques used in the detection of trace-level gases based on infrared absorption spectroscopy. The first technique is direct absorption spectroscopy (DAS), in which excitation sources such as near- and mid-infrared lasers or an incandescent light source [8, 9] can be used. An advan-tage of DAS is its ability to offer quantitative concentration
Abstract A ppb-level mid-infrared ethane (C2H6) sensor was developed using a continuous-wave, thermoelectrically cooled, distributed feedback interband cascade laser emit-ting at 3.34 μm and a miniature dense patterned multipass gas cell with a 54.6-m optical path length. The performance of the sensor was investigated using two different tech-niques based on the tunable interband cascade laser: direct absorption spectroscopy (DAS) and second-harmonic wave-length modulation spectroscopy (2f-WMS). Three measure-ment schemes, DAS, WMS and quasi-simultaneous DAS and WMS, were realized based on the same optical sen-sor core. A detection limit of ~7.92 ppbv with a precision of ±30 ppbv for the separate DAS scheme with an averag-ing time of 1 s and a detection limit of ~1.19 ppbv with a precision of about ±4 ppbv for the separate WMS scheme with a 4-s averaging time were achieved. An Allan–Werle variance analysis indicated that the precisions can be further improved to 777 pptv @ 166 s for the separate DAS scheme and 269 pptv @ 108 s for the WMS scheme, respectively.
* Chuantao Zheng [email protected]
* Frank K. Tittel [email protected]
1 Department of Electrical and Computer Engineering, Rice University, 6100 Main Street, Houston, TX 77005, USA
2 State Key Laboratory on Integrated Optoelectronics, College of Electronic Science and Engineering, Jilin University, 2699 Qianjin Street, Changchun 130012, China
3 State Key Laboratory of Quantum Optics and Quantum Optics Devices, Institute of Laser Spectroscopy, Shanxi University, Taiyuan 030006, China
4 College of Engineering, Shantou University, Shantou 515063, China
C. Li et al.
1 3
185 Page 2 of 13
measurements of trace gas species without sensor calibration as the concentration can be calculated from the relative change of the intensity according to Beer–Lambert’s law. On the other hand, wavelength modulation spectroscopy (WMS) [10–12] enables non-contact trace gas concentration measurements. In WMS, the spectral signal is shifted to the high-frequency region to minimize low frequency noise, referred to as 1/f noise. This procedure can improve the measurement precision. Therefore, WMS has proven to be an excellent tool for trace gas detection in environmental [13–15], biomedical [16–18], industrial [19, 20] and national security [15] applications. WMS requires a tunable laser capable of single-frequency emission and a narrow linewidth at the targeted absorption line of a gas molecule. To meet this requirement, several laser sources are commercially available, e.g., difference-frequency generation (DFG) [21] and optical parameter oscillators (OPO) [22]. In recent years, quantum cascade lasers (QCLs) [23] in the 4- to 12-µm spectral range and interband cascade lasers (ICLs) in the 3- to 6-µm range, capable of operating with low electrical power consumption [24], provide continu-ous-wave (CW) output power levels of >5 mW. For example, the development of WMS based on CW, thermoelectrically cooled (TEC), distributed feedback (DFB) diode lasers for C2H6 detection was reported in [25, 26].
In this manuscript, a mid-infrared C2H6 sensor based on a compact multipass gas cell (MPGC) with a 54.6-m effective absorption length and a room-temperature CW, TEC, DFB ICL centered at 2996.88 cm−1 was experimen-tally demonstrated. The reported C2H6 sensor describes improvements in terms of the optical sensor core design, operating schemes and sensor application compared to a previously CH4 sensor based on a similar MPGC and an ICL [27]. A second-generation optical sensor core with a single-floor structure (see Fig. 2e) was developed based on the two-floor optical sensor core described in Ref. [27]. The single-floor design provides better mechanical stabil-ity without compromising the sensor-system footprint. Furthermore, three measurement schemes (DAS, WMS and quasi-simultaneous DAS and WMS) were realized, compared with only the DAS scheme used in Ref. [27]. In addition, an atmospheric C2H6 measurement campaign on the Rice University campus and a field test at a compressed natural gas (CNG) station in Houston, TX, were conducted to evaluate the performance of the sensor system as a robust and reliable field-deployable sensor system.
2 Sensor configuration
2.1 Absorption line selection of C2H6 at 3.34 µm
C2H6 possesses strong fundamental absorption lines in the mid-infrared spectral range centered at 3.34 μm, which
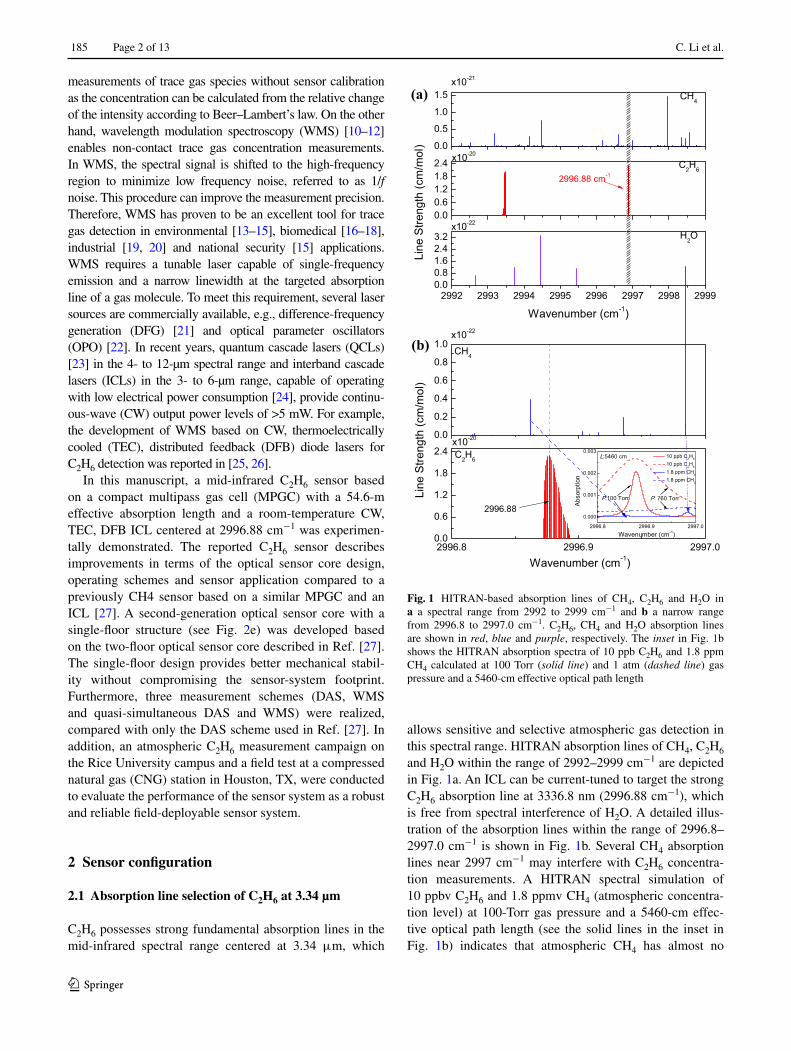
allows sensitive and selective atmospheric gas detection in this spectral range. HITRAN absorption lines of CH4, C2H6 and H2O within the range of 2992–2999 cm−1 are depicted in Fig. 1a. An ICL can be current-tuned to target the strong C2H6 absorption line at 3336.8 nm (2996.88 cm−1), which is free from spectral interference of H2O. A detailed illus-tration of the absorption lines within the range of 2996.8–2997.0 cm−1 is shown in Fig. 1b. Several CH4 absorption lines near 2997 cm−1 may interfere with C2H6 concentra-tion measurements. A HITRAN spectral simulation of 10 ppbv C2H6 and 1.8 ppmv CH4 (atmospheric concentra-tion level) at 100-Torr gas pressure and a 5460-cm effec-tive optical path length (see the solid lines in the inset in Fig. 1b) indicates that atmospheric CH4 has almost no
0.00.61.21.82.4
0.0
0.5
1.0
1.5
H2O
C2H6
x10-21
CH4
x10-20
2992 2993 2994 2995 2996 2997 2998 29990.00.81.62.43.2
x10-22
Line
Stre
ngth
(cm
/mol
)
Wavenumber (cm-1)
2996.88 cm-1
(a)
(b)
2996.8 2996.9 2997.00.0
0.6
1.2
1.8
2.4
0.0
0.2
0.4
0.6
0.8
1.0
2996.8 2996.9 2997.0
0.000
0.001
0.002
0.003L:5460 cm
P:100 Torr
10 ppb C2H6
10 ppb C2H
6
1.8 ppm CH4
1.8 ppm CH4
Abso
rptio
n
Wavenumber (cm-1)
P: 760 Torr
C2H6
x10-22
CH4
Lin
e S
treng
th (c
m/m
ol)
x10-20
Wavenumber (cm-1)
2996.88
Fig. 1 HITRAN-based absorption lines of CH4, C2H6 and H2O in a a spectral range from 2992 to 2999 cm−1 and b a narrow range from 2996.8 to 2997.0 cm−1. C2H6, CH4 and H2O absorption lines are shown in red, blue and purple, respectively. The inset in Fig. 1b shows the HITRAN absorption spectra of 10 ppb C2H6 and 1.8 ppm CH4 calculated at 100 Torr (solid line) and 1 atm (dashed line) gas pressure and a 5460-cm effective optical path length
Ppb-level mid-infrared ethane detection based on three measurement schemes using a 3.34 μm…
1 3
Page 3 of 13 185
effect on C2H6 detection. However, at 760 Torr pressure, the 2996.88-cm−1 C2H6 line overlaps with the 2997-cm−1 CH4 line (see the dashed lines in the inset of Fig. 1b). Hence, the pressure inside the MPGC was controlled experimentally below 150 Torr in order to avoid the broadening of adjacent CH4 lines, especially the absorption line at ~2997 cm−1. Below 150 Torr, the absorption line at 2996.88 cm−1 is the optimum choice for C2H6 detection (Fig. 2).
2.2 Sensor configuration based on three measurement schemes
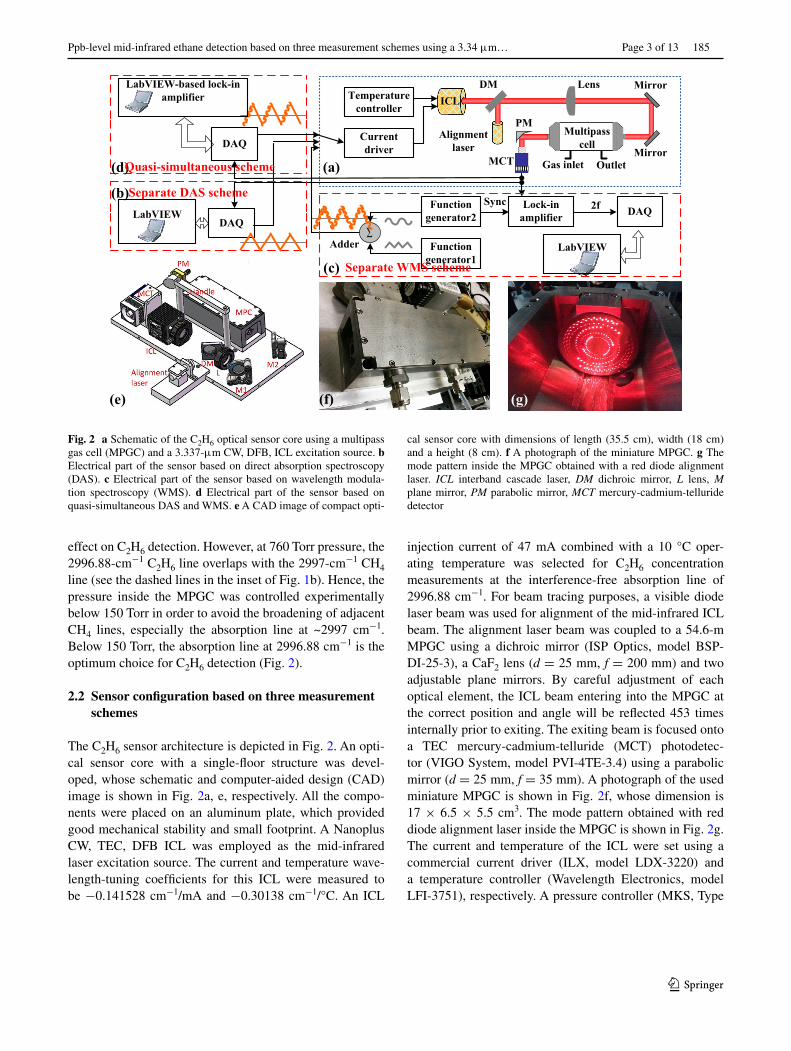
The C2H6 sensor architecture is depicted in Fig. 2. An opti-cal sensor core with a single-floor structure was devel-oped, whose schematic and computer-aided design (CAD) image is shown in Fig. 2a, e, respectively. All the compo-nents were placed on an aluminum plate, which provided good mechanical stability and small footprint. A Nanoplus CW, TEC, DFB ICL was employed as the mid-infrared laser excitation source. The current and temperature wave-length-tuning coefficients for this ICL were measured to be −0.141528 cm−1/mA and −0.30138 cm−1/°C. An ICL
injection current of 47 mA combined with a 10 °C oper-ating temperature was selected for C2H6 concentration measurements at the interference-free absorption line of 2996.88 cm−1. For beam tracing purposes, a visible diode laser beam was used for alignment of the mid-infrared ICL beam. The alignment laser beam was coupled to a 54.6-m MPGC using a dichroic mirror (ISP Optics, model BSP-DI-25-3), a CaF2 lens (d = 25 mm, f = 200 mm) and two adjustable plane mirrors. By careful adjustment of each optical element, the ICL beam entering into the MPGC at the correct position and angle will be reflected 453 times internally prior to exiting. The exiting beam is focused onto a TEC mercury-cadmium-telluride (MCT) photodetec-tor (VIGO System, model PVI-4TE-3.4) using a parabolic mirror (d = 25 mm, f = 35 mm). A photograph of the used miniature MPGC is shown in Fig. 2f, whose dimension is 17 × 6.5 × 5.5 cm3. The mode pattern obtained with red diode alignment laser inside the MPGC is shown in Fig. 2g. The current and temperature of the ICL were set using a commercial current driver (ILX, model LDX-3220) and a temperature controller (Wavelength Electronics, model LFI-3751), respectively. A pressure controller (MKS, Type
Alignment laser
Function generator2
Current driver
Temperature controller
Lock-in amplifier DAQ
Gas inlet OutletMCT
PM
DM Mirror
Adder
Lens
2f
Multipass cell
Mirror
ICL
∑
Separate DAS scheme
DAQ
Function generator1
Sync
(a)
(f) (g)
DAQ
(b)
(c)
(d)Quasi-simultaneous scheme
(e)
LabVIEW-based lock-in amplifier
LabVIEW
LabVIEW
Separate WMS scheme
Fig. 2 a Schematic of the C2H6 optical sensor core using a multipass gas cell (MPGC) and a 3.337-μm CW, DFB, ICL excitation source. b Electrical part of the sensor based on direct absorption spectroscopy (DAS). c Electrical part of the sensor based on wavelength modula-tion spectroscopy (WMS). d Electrical part of the sensor based on quasi-simultaneous DAS and WMS. e A CAD image of compact opti-
cal sensor core with dimensions of length (35.5 cm), width (18 cm) and a height (8 cm). f A photograph of the miniature MPGC. g The mode pattern inside the MPGC obtained with a red diode alignment laser. ICL interband cascade laser, DM dichroic mirror, L lens, M plane mirror, PM parabolic mirror, MCT mercury-cadmium-telluride detector
C. Li et al.
1 3
185 Page 4 of 13
649) is connected with the MPGC inlet and a vacuum pump (KNF Neuberger, Type N831.5 ANE/AF) that is attached to the MPGC outlet to regulate the pressure inside the MPGC.
Two different techniques (DAS and WMS) were adopted for the detection of C2H6, and three measurement schemes were realized via the same optical sensor core: DAS, WMS and quasi-simultaneous DAS and WMS. These three schemes require different electronic modules, drive signals and data-processing methods.
1) DAS scheme (Fig. 2b). A data acquisition (DAQ) unit (NI, model USB6356) was used to generate a trian-gular signal for tuning the laser wavelength, and the output signal from the detector was applied directly to the DAQ for data acquisition. A LabVIEW laptop com-puter platform was used for scan-signal generation and absorption-signal extraction.
2) WMS scheme (Fig. 2c). A triangular signal produced by function generator 1 (Stanford, model DS345) com-bined with a small-amplitude sinusoidal wave from function generator 2 (Stanford, model DS345) via an electrical adder was applied to the current driver to scan and modulate the ICL wavelength. A lock-in amplifier (Stanford, model SR830) was used to demod-ulate the signal from the MCT when operated in the 2f mode and used a sync signal from function generator 2. A DAQ card was used to acquire the second-harmonic spectra from the lock-in amplifier. A LabVIEW plat-form was used for the 2f signal acquisition.
3) Quasi-simultaneous DAS and WMS scheme (Fig. 2d). A triangular drive signal was used to realize this scheme. The first half-period of this signal (for WMS operation) was a rising ramp signal for wavelength scanning combined with a sinusoidal wave signal for wavelength modulation. The second half-period (for DAS operation) was a falling ramp signal for wave-length scanning. For simplifying the sensor design, signal generation, data acquisition and processing were all conducted by a DAQ unit as well as a laptop. In order to decide the C2H6 concentration simultaneously, a LabVIEW-based lock-in amplifier was employed to
extract the 2f signal from the first half-period of the detector output signal, and a data-processing procedure was adopted to extract the laser absorption signal dur-ing the second half-period of the output signal from the detector.
3 Sensor performances using a separate DAS scheme
3.1 Measurement formulation
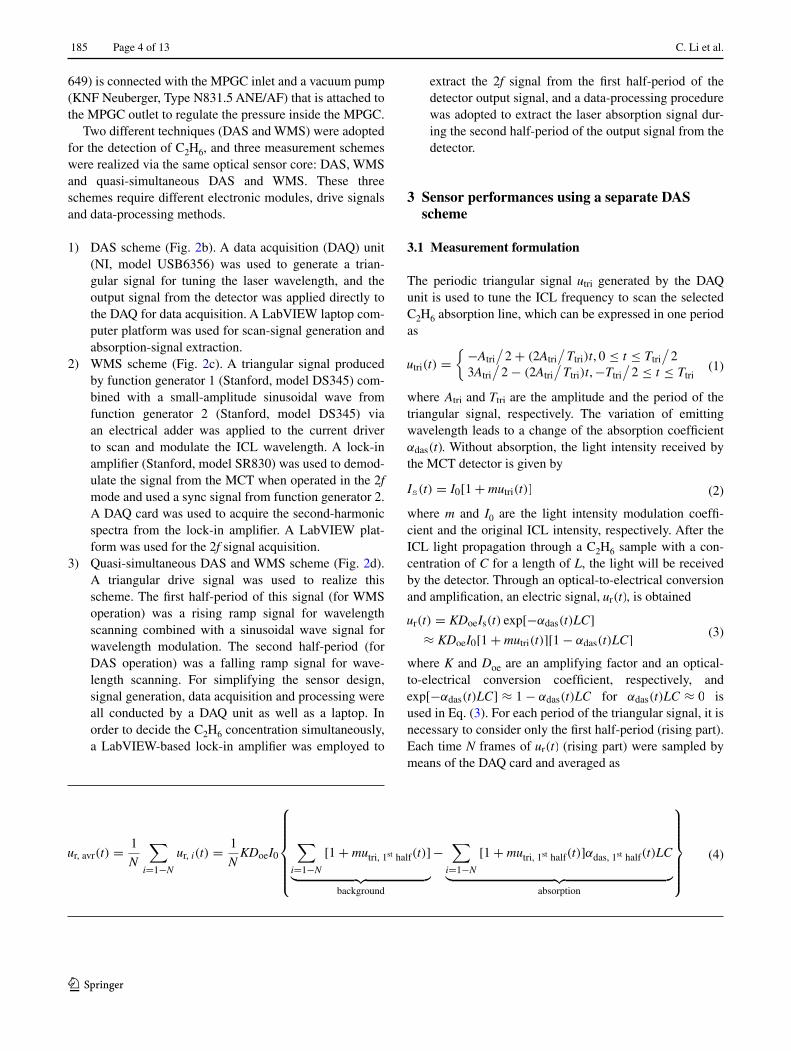
The periodic triangular signal utri generated by the DAQ unit is used to tune the ICL frequency to scan the selected C2H6 absorption line, which can be expressed in one period as
where Atri and Ttri are the amplitude and the period of the triangular signal, respectively. The variation of emitting wavelength leads to a change of the absorption coefficient αdas(t). Without absorption, the light intensity received by the MCT detector is given by
where m and I0 are the light intensity modulation coeffi-cient and the original ICL intensity, respectively. After the ICL light propagation through a C2H6 sample with a con-centration of C for a length of L, the light will be received by the detector. Through an optical-to-electrical conversion and amplification, an electric signal, ur(t), is obtained
where K and Doe are an amplifying factor and an optical-to-electrical conversion coefficient, respectively, and exp[−αdas(t)LC] ≈ 1− αdas(t)LC for αdas(t)LC ≈ 0 is used in Eq. (3). For each period of the triangular signal, it is necessary to consider only the first half-period (rising part). Each time N frames of ur(t) (rising part) were sampled by means of the DAQ card and averaged as
(1)utri(t) =
{−Atri
/2+ (2Atri
/Ttri)t, 0 ≤ t ≤ Ttri
/2
3Atri
/2− (2Atri
/Ttri)t,−Ttri
/2 ≤ t ≤ Ttri
(2)Is(t) = I0[1+ mutri(t)]
(3)ur(t) = KDoeIs(t) exp[−αdas(t)LC]
≈ KDoeI0[1+ mutri(t)][1− αdas(t)LC]
(4)ur, avr(t) =1
N
�
i=1−N
ur, i(t) =1
NKDoeI0
�
i=1−N
[1+ mutri, 1st half(t)]
� �� �
background
−�
i=1−N
[1+ mutri, 1st half(t)]αdas, 1st half(t)LC
� �� �
absorption
Ppb-level mid-infrared ethane detection based on three measurement schemes using a 3.34 μm…
1 3
Page 5 of 13 185
Once ur, avr(t) is obtained, data fitting based on LabVIEW (results are reported in “Results and discussion” section) is used to obtain the background signal
Furthermore, the following processing is performed to eliminate the background signal
Therefore, the amplitude of ur, final(t) is proportional to the concentration C
Such a curve can be achieved by means of a calibration experiment with standard C2H6 samples.
3.2 Experiment details
The mid-infrared C2H6 sensor system in DAS mode described in “Sensor configuration based on three meas-urement schemes” section was operated at a drive cur-rent and temperature of 47 mA and 10 °C, respectively. The pressure in the MPGC was set to 100 Torr in order to avoid spectral interference from CH4. A triangular scan signal with a frequency of 250 Hz and a peak-to-peak amplitude of 200 mV was used. The sampling rate of the DAQ card was set to 250 kHz, and therefore, each triangular period (including two C2H6 spectra) contains 1000 data points. Data sampling was triggered by the tri-angular signal to realize the complete sample of the first half-period of the sensing signal, which contains 500 points. Each time, N = 80 frames were sampled, which required ~1 s plus the data-processing time. All the data were recorded by a Dell computer (model # PP04X) for processing and postanalysis. Furthermore, a standard gas generator (Environics, Series 4040) was used for the per-formance assessment of the C2H6 sensor. A 1.14-ppmv [balanced by nitrogen (N2)] C2H6 cylinder and a pure N2 cylinder were used as input to the gas generator for the preparation of C2H6 samples with different concentrations at ppbv levels. The same method was used to prepare C2H6 samples in all of the following experiments except for atmospheric C2H6 measurements. Our data-processing routine was based on LabVIEW.
(5)ur, bac(t) =
1
NKDoeI0
∑
i=1−N
[1+ mutri, rising(t)]
︸ ︷︷ ︸
background
(6)
ur, final(t) =ur, bac(t)− ur, avr(t)
ur, bac(t)=
�
i=1−N
αdas, 1st half
(t)
LC
(7)Amp[ur, final(t)
]= Amp
[∑
i=1−N
αdas, 1st half(t)
]
LC
3.3 Results and discussion
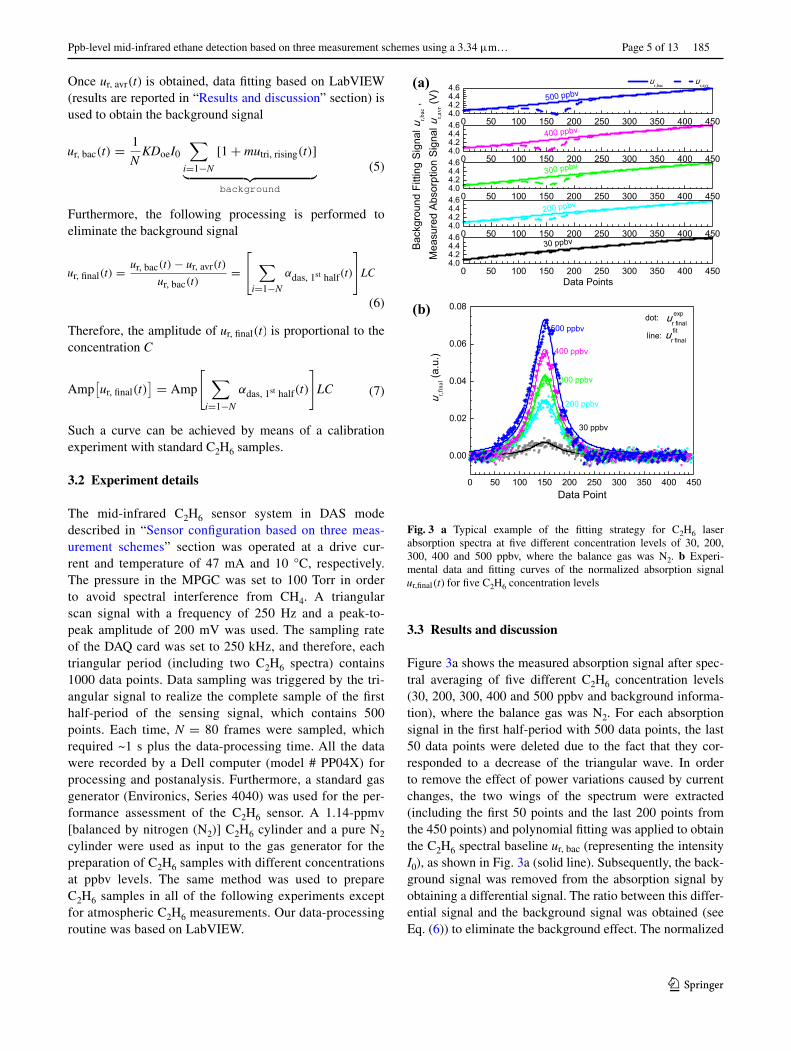
Figure 3a shows the measured absorption signal after spec-tral averaging of five different C2H6 concentration levels (30, 200, 300, 400 and 500 ppbv and background informa-tion), where the balance gas was N2. For each absorption signal in the first half-period with 500 data points, the last 50 data points were deleted due to the fact that they cor-responded to a decrease of the triangular wave. In order to remove the effect of power variations caused by current changes, the two wings of the spectrum were extracted (including the first 50 points and the last 200 points from the 450 points) and polynomial fitting was applied to obtain the C2H6 spectral baseline ur, bac (representing the intensity I0), as shown in Fig. 3a (solid line). Subsequently, the back-ground signal was removed from the absorption signal by obtaining a differential signal. The ratio between this differ-ential signal and the background signal was obtained (see Eq. (6)) to eliminate the background effect. The normalized
0 50 100 150 200 250 300 350 400 4504.04.24.44.6
ur,bac ur,avr
30 ppbv
200 ppbv
300 ppbv
400 ppbv
Bac
kgro
und
Fitti
ng S
igna
l ur,b
ac ,
Mea
sure
d A
bsor
ptio
n S
igna
l ur,a
vr (V
)
500 ppbv
0 50 100 150 200 250 300 350 400 4504.04.24.44.6
0 50 100 150 200 250 300 350 400 4504.04.24.44.6
0 50 100 150 200 250 300 350 400 4504.04.24.44.6
0 50 100 150 200 250 300 350 400 4504.04.24.44.6
Data Points
(a)
(b)
0 50 100 150 200 250 300 350 400 450
0.00
0.02
0.04
0.06
0.08
line: u fitr final
u expr final
30 ppbv
200 ppbv
300 ppbv
400 ppbv
u r,final (
a.u.
)
Data Point
500 ppbv dot:
Fig. 3 a Typical example of the fitting strategy for C2H6 laser absorption spectra at five different concentration levels of 30, 200, 300, 400 and 500 ppbv, where the balance gas was N2. b Experi-mental data and fitting curves of the normalized absorption signal ur,final(t) for five C2H6 concentration levels
C. Li et al.
1 3
185 Page 6 of 13
absorption signals uexpr, final(t) for the five concentrations levels are shown in Fig. 3b. The infrared absorption line, uexpr, final(t), follows a Lorentzian lineshape function. Hence,
the experimental data were fitted using the Lorentzian line-shape function, ufitr, final(t) =
A
πγ
[
1+(t−t0γ
)2], for each con-
centration, where A, γ and t0 were obtained by data fitting. The amplitudes of the fitting curves (ufitr, final(t)) were used to represent C2H6 concentrations, which are more accurate than those obtained by using the amplitude of ufitr, final(t) due to signal fluctuations.
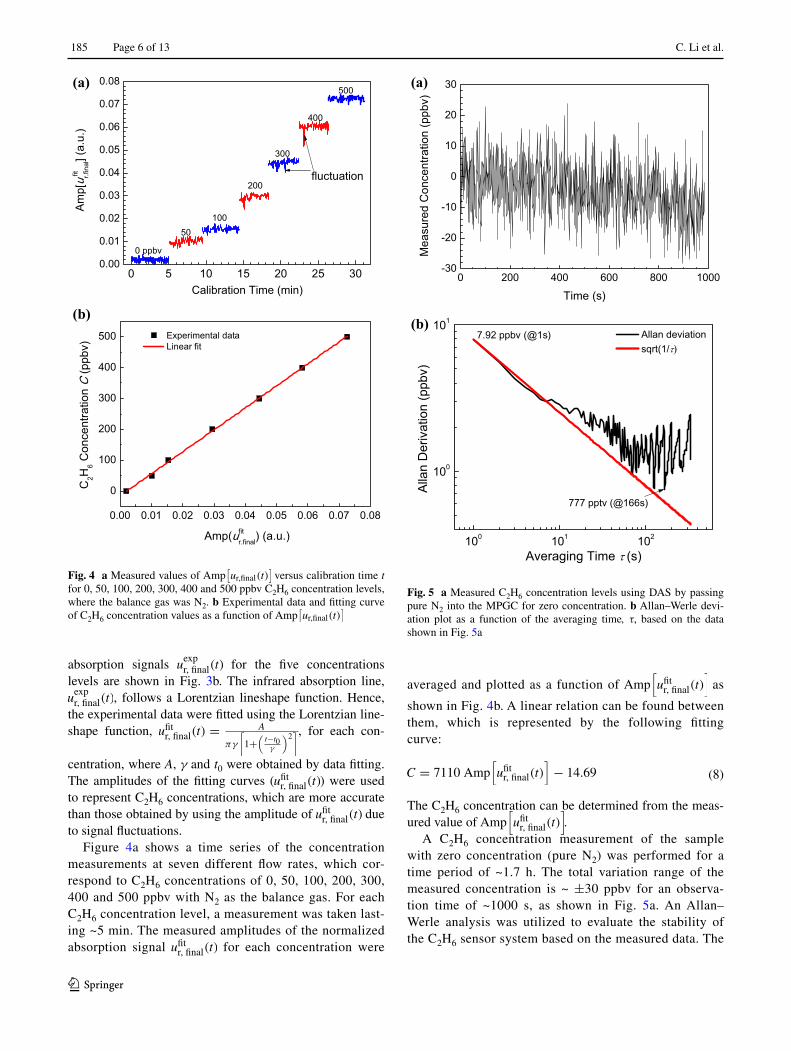
Figure 4a shows a time series of the concentration measurements at seven different flow rates, which cor-respond to C2H6 concentrations of 0, 50, 100, 200, 300, 400 and 500 ppbv with N2 as the balance gas. For each C2H6 concentration level, a measurement was taken last-ing ~5 min. The measured amplitudes of the normalized absorption signal ufitr, final(t) for each concentration were
averaged and plotted as a function of Amp[
ufitr, final(t)
]
as
shown in Fig. 4b. A linear relation can be found between them, which is represented by the following fitting curve:
The C2H6 concentration can be determined from the meas-ured value of Amp
[
ufitr, final(t)
]
.A C2H6 concentration measurement of the sample
with zero concentration (pure N2) was performed for a time period of ~1.7 h. The total variation range of the measured concentration is ~ ±30 ppbv for an observa-tion time of ~1000 s, as shown in Fig. 5a. An Allan–Werle analysis was utilized to evaluate the stability of the C2H6 sensor system based on the measured data. The
(8)C = 7110 Amp[
ufitr, final(t)
]
− 14.69
0 5 10 15 20 25 300.00
0.01
0.02
0.03
0.04
0.05
0.06
0.07
0.08
400
500
200
300
10050
Am
p[u fi
tr.f
inal] (
a.u.
)
Calibration Time (min)
0 ppbv
fluctuation
(a)
(b)
0.00 0.01 0.02 0.03 0.04 0.05 0.06 0.07 0.08
0
100
200
300
400
500 Experimental data Linear fit
C2H
6 Con
cent
ratio
n C
(ppb
v)
Amp(ufitr.final) (a.u.)
Fig. 4 a Measured values of Amp[ur,final(t)
] versus calibration time t
for 0, 50, 100, 200, 300, 400 and 500 ppbv C2H6 concentration levels, where the balance gas was N2. b Experimental data and fitting curve of C2H6 concentration values as a function of Amp
[ur,final(t)
]
0 200 400 600 800 1000-30
-20
-10
0
10
20
30
Mea
sure
d C
once
ntra
tion
(ppb
v)
Time (s)
(a)
(b)
100 101 102
100
101
777 pptv (@166s)
Allan deviation sqrt(1/
Alla
n D
eriv
atio
n (p
pbv)
Averaging Time (s)
7.92 ppbv (@1s)
Fig. 5 a Measured C2H6 concentration levels using DAS by passing pure N2 into the MPGC for zero concentration. b Allan–Werle devi-ation plot as a function of the averaging time, τ, based on the data shown in Fig. 5a
Ppb-level mid-infrared ethane detection based on three measurement schemes using a 3.34 μm…
1 3
Page 7 of 13 185
Allan–Werle deviation was plotted on a log–log scale versus the averaging time, τ as shown in Fig. 5b. The plot indicates a measurement precision of ~7.92 ppbv with a 1-s averaging time. With increasing averaging time, the Allan–Werle plot shows an optimum aver-aging time of ~166 s, corresponding to a precision of ~777 pptv. However, as the averaging time continues, the Allan–Werle derivation increases again, which shows that sensor-system drift becomes the dominant factor and decreases the sensor-system stability. The red solid line (which is proportional to the sqrt(1/τ)) indicates that the theoretically expected behavior of the sensor system is a white noise-dominated region prior to when system drifts start to occur.
4 Sensor performance using separate WMS scheme
4.1 Measurement formulation
In the case of WMS, the electrical drive signal of the DFB ICL is
where utri(t) is given by Eq. (1), and usin(t) = Asin sin(ωsint) is a modulation signal with Asin and ωsin as its amplitude and angular frequency, respectively. Hence a variation, uWMS(t), of the ICL leads to a change of the absorption coefficient, expressed as αwms(t). As a result of optical-to-electrical conversion and amplification, an electrical signal is also obtained, which can be written as
The 2f signal can be extracted from the orthogonal output of the lock-in amplifier, which is given by
where
are two orthogonal components and Tint2 is an integration-time factor determined by the cutoff frequency of a related low-pass filter. The peak amplitude of the 2f signal cor-responding to the peak absorption wavelength of C2H6 as max[A2f (t)] is proportional to the C2H6 concentration, as
(9)uwms(t) = utri(t)+ usin(t)
(10)ur(t) = KDoeI0[1+ mu(t)][1− αwms(t)LC]
(11)A2f (t) =
√
(A2f , ⊥)2 + (A2f , �)
2
(12)
A2f , ⊥(t) =
∫ t
t−Tint2
ur(τ ) sin(2ωsinτ)dτ , A2f , �(t)
=
∫ t
t−Tint2
ur(τ ) cos(2ωsinτ)dτ
(13)max[A2f (t)
]= F(C)
where the expression of F can be determined experimen-tally by means of calibration of the C2H6 sensor system.
4.2 Experimental details
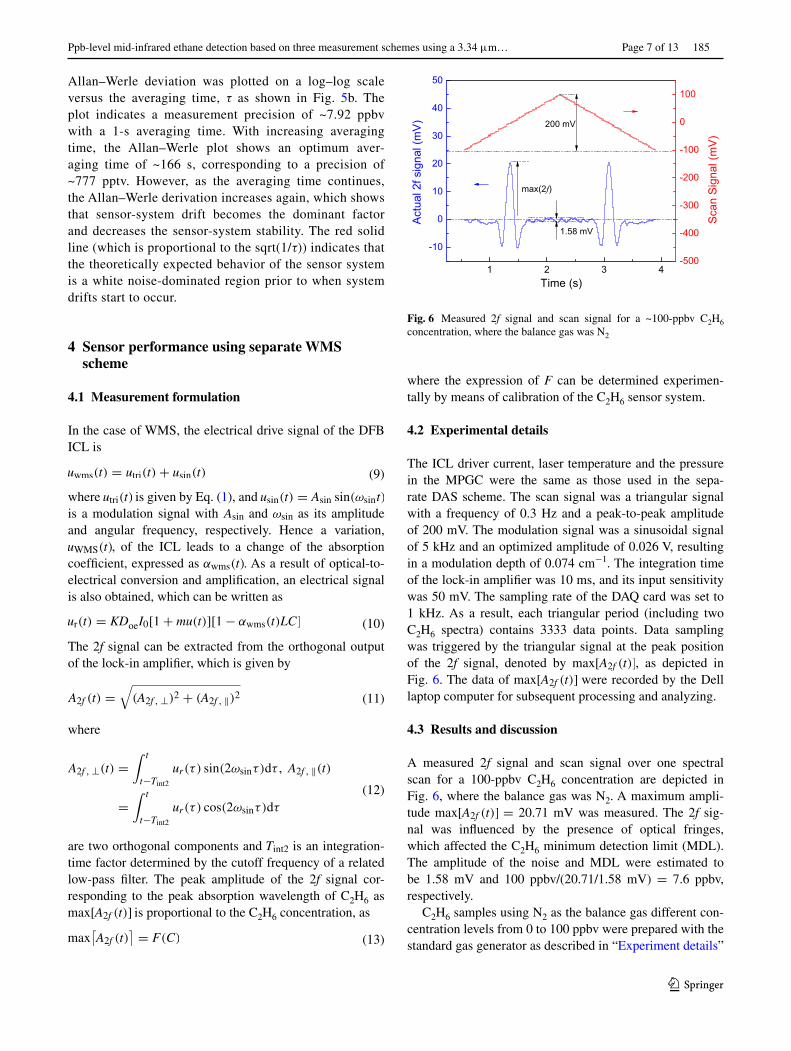
The ICL driver current, laser temperature and the pressure in the MPGC were the same as those used in the sepa-rate DAS scheme. The scan signal was a triangular signal with a frequency of 0.3 Hz and a peak-to-peak amplitude of 200 mV. The modulation signal was a sinusoidal signal of 5 kHz and an optimized amplitude of 0.026 V, resulting in a modulation depth of 0.074 cm−1. The integration time of the lock-in amplifier was 10 ms, and its input sensitivity was 50 mV. The sampling rate of the DAQ card was set to 1 kHz. As a result, each triangular period (including two C2H6 spectra) contains 3333 data points. Data sampling was triggered by the triangular signal at the peak position of the 2f signal, denoted by max[A2f (t)], as depicted in Fig. 6. The data of max[A2f (t)] were recorded by the Dell laptop computer for subsequent processing and analyzing.
4.3 Results and discussion
A measured 2f signal and scan signal over one spectral scan for a 100-ppbv C2H6 concentration are depicted in Fig. 6, where the balance gas was N2. A maximum ampli-tude max[A2f (t)] = 20.71 mV was measured. The 2f sig-nal was influenced by the presence of optical fringes, which affected the C2H6 minimum detection limit (MDL). The amplitude of the noise and MDL were estimated to be 1.58 mV and 100 ppbv/(20.71/1.58 mV) = 7.6 ppbv, respectively.
C2H6 samples using N2 as the balance gas different con-centration levels from 0 to 100 ppbv were prepared with the standard gas generator as described in “Experiment details”
1 2 3 4
-10
0
10
20
30
40
50
200 mV
Sca
n S
igna
l (m
V)
Act
ual 2
f sig
nal (
mV
)
Time (s)
max(2f)
-500
-400
-300
-200
-100
0
100
1.58 mV
Fig. 6 Measured 2f signal and scan signal for a ~100-ppbv C2H6 concentration, where the balance gas was N2
C. Li et al.
1 3
185 Page 8 of 13
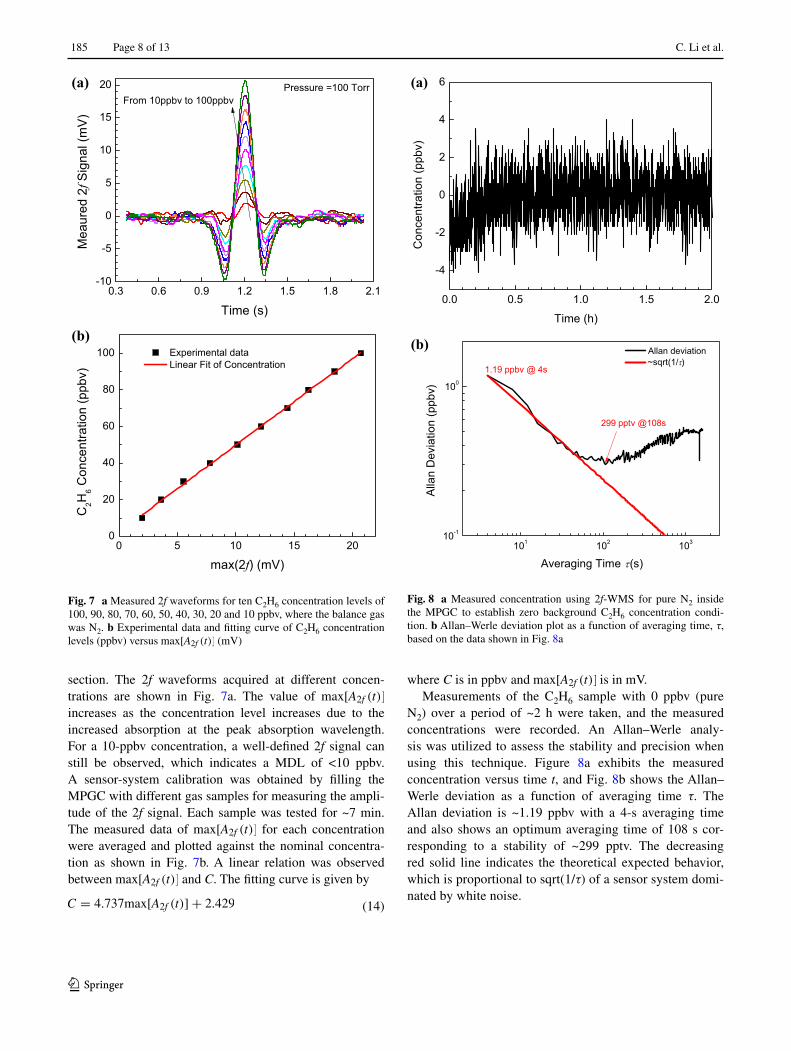
section. The 2f waveforms acquired at different concen-trations are shown in Fig. 7a. The value of max[A2f (t)] increases as the concentration level increases due to the increased absorption at the peak absorption wavelength. For a 10-ppbv concentration, a well-defined 2f signal can still be observed, which indicates a MDL of <10 ppbv. A sensor-system calibration was obtained by filling the MPGC with different gas samples for measuring the ampli-tude of the 2f signal. Each sample was tested for ~7 min. The measured data of max[A2f (t)] for each concentration were averaged and plotted against the nominal concentra-tion as shown in Fig. 7b. A linear relation was observed between max[A2f (t)] and C. The fitting curve is given by
(14)C = 4.737max[A2f (t)] + 2.429
where C is in ppbv and max[A2f (t)] is in mV.Measurements of the C2H6 sample with 0 ppbv (pure
N2) over a period of ~2 h were taken, and the measured concentrations were recorded. An Allan–Werle analy-sis was utilized to assess the stability and precision when using this technique. Figure 8a exhibits the measured concentration versus time t, and Fig. 8b shows the Allan–Werle deviation as a function of averaging time τ. The Allan deviation is ~1.19 ppbv with a 4-s averaging time and also shows an optimum averaging time of 108 s cor-responding to a stability of ~299 pptv. The decreasing red solid line indicates the theoretical expected behavior, which is proportional to sqrt(1/τ) of a sensor system domi-nated by white noise.
0.3 0.6 0.9 1.2 1.5 1.8 2.1-10
-5
0
5
10
15
20M
eaur
ed 2f S
igna
l (m
V)
Time (s)
Pressure =100 TorrFrom 10ppbv to 100ppbv
(a)
(b)
0 5 10 15 200
20
40
60
80
100 Experimental data Linear Fit of Concentration
C2H
6 Con
cent
ratio
n (p
pbv)
max(2f) (mV)
Fig. 7 a Measured 2f waveforms for ten C2H6 concentration levels of 100, 90, 80, 70, 60, 50, 40, 30, 20 and 10 ppbv, where the balance gas was N2. b Experimental data and fitting curve of C2H6 concentration levels (ppbv) versus max[A2f (t)] (mV)
0.0 0.5 1.0 1.5 2.0
-4
-2
0
2
4
6
Con
cent
ratio
n (p
pbv)
Time (h)
(a)
(b)
101 102 10310-1
100
1.19 ppbv @ 4s
Allan deviation ~sqrt(1/ )
Alla
n D
evia
tion
(ppb
v)
Averaging Time (s)
299 pptv @108s
Fig. 8 a Measured concentration using 2f-WMS for pure N2 inside the MPGC to establish zero background C2H6 concentration condi-tion. b Allan–Werle deviation plot as a function of averaging time, τ, based on the data shown in Fig. 8a
Ppb-level mid-infrared ethane detection based on three measurement schemes using a 3.34 μm…
1 3
Page 9 of 13 185
5 Sensor performances using a quasi‑simultaneous DAS and WMS scheme
5.1 Experimental details
For this measurement scheme, the parameters of the ICL were the same as those in the previous two schemes. An
asymmetric drive signal with a frequency of 0.3 Hz was used, its first half-period was a rising ramp signal (peak-to-peak amplitude: 200 mV) combined with a sinusoidal wave signal (frequency: 5 kHz; amplitude: 0.026 V), and its second half-period was only a falling ramp signal (peak-to-peak amplitude: 200 mV). A LabVIEW-based platform on a laptop was modified, and its function diagram is shown in
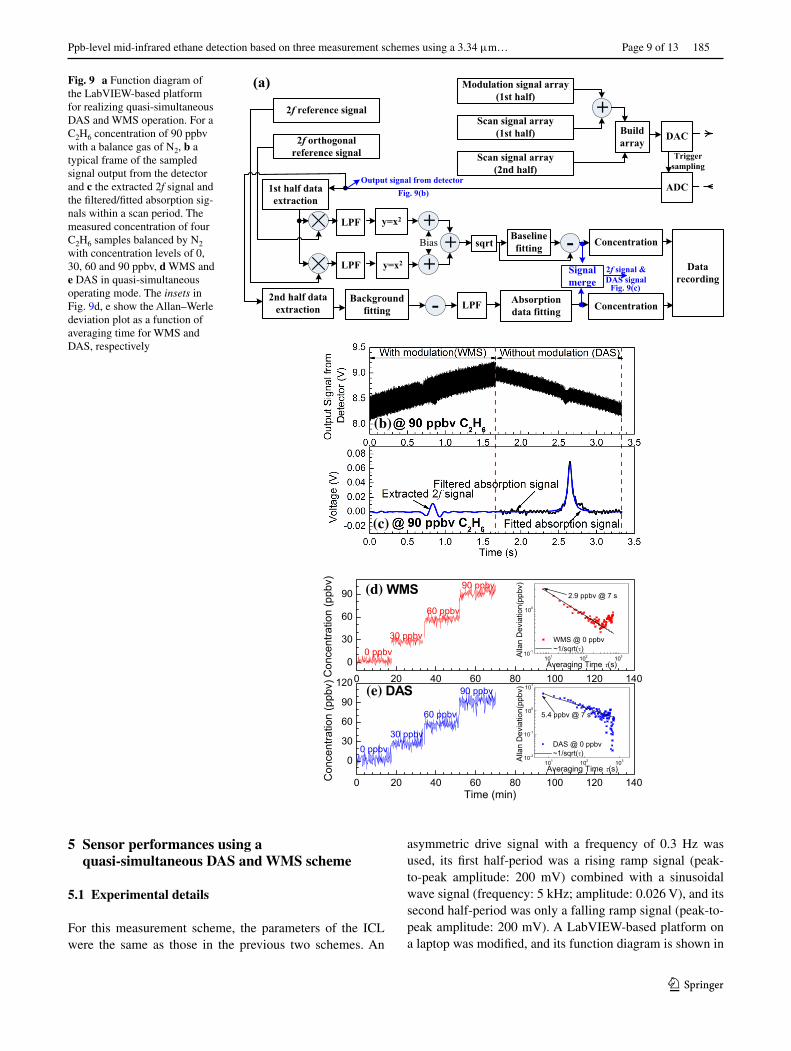
Fig. 9 a Function diagram of the LabVIEW-based platform for realizing quasi-simultaneous DAS and WMS operation. For a C2H6 concentration of 90 ppbv with a balance gas of N2, b a typical frame of the sampled signal output from the detector and c the extracted 2f signal and the filtered/fitted absorption sig-nals within a scan period. The measured concentration of four C2H6 samples balanced by N2 with concentration levels of 0, 30, 60 and 90 ppbv, d WMS and e DAS in quasi-simultaneous operating mode. The insets in Fig. 9d, e show the Allan–Werle deviation plot as a function of averaging time for WMS and DAS, respectively
2f reference signal
2f orthogonal reference signal
Modulation signal array(1st half)
Scan signal array(1st half)
Scan signal array(2nd half)
+Buildarray DAC
ADC
Trigger sampling
1st half data extraction
LPF y=x2
LPF y=x2
+
+Bias + sqrt
Baseline fitting Concentration
2nd half data extraction
Backgroundfitting - LPF Absorption
data fitting Concentration
Data recording
-
Output signal from detector
Signal merge
2f signal & DAS signal
(a)
Fig. 9(b)
Fig. 9(c)
0 20 40 60 80 100 120 1400
30
60
90
101 102 10310-2
10-1
100
101
DAS @ 0 ppbv ~1/sqrt( )
Alla
n D
evia
tion(
ppbv
)
Averaging Time (s)
5.4 ppbv @ 7 s
101 102 10310-1
100
WMS @ 0 ppbv ~1/sqrt( )
Alla
n D
evia
tion(
ppbv
)
Averaging Time (s)
2.9 ppbv @ 7 s
0 ppbv
(e) DAS
Con
cent
ratio
n (p
pbv)
(d) WMS 90 ppbv
60 ppbv
30 ppbv
0 20 40 60 80 100 120 140
0
30
60
90
12090 ppbv
60 ppbv
Con
cent
ratio
n (p
pbv)
Time (min)
30 ppbv0 ppbv
(b)
(c)
C. Li et al.
1 3
185 Page 10 of 13
Fig. 9a. The sampling rate of digital to analog conversion (DAC) was 300 kHz, and there were 1000-k data points for each period of the drive signal. The sampling rate of analog to digital conversion (ADC) was also 300 kHz, which resulted in 1000-k data points for each period of the sam-pled signal. A typical frame of the sampled signal output from the detector is shown in Fig. 9b, where the C2H6 con-centration was 90 ppbv with N2 as the balance gas. Ethane absorption occurred both in the rising part and in the falling part of the absorption spectra signal.
After data sampling of a whole period (1000-k data points), the first 500-k data points were sent to an orthogo-nal lock-in amplifier, which was realized by LabVIEW soft-ware. Two orthogonal sinusoidal wave signals with 500-k data points were used as reference signals for extracting the two orthogonal components from the absorption sig-nal, and details of this procedure are shown in Fig. 9a. The last 500-k data points were processed following a similar method adopted in the separate DAS scheme (see “Sensor performances using a separate DAS scheme” section). This method provided background fitting, background elimina-tion, low-pass filtering (LPF, cutoff frequency: 10 Hz) and absorption line fitting. A 2f signal extracted from the first half-period and an absorption signal extracted from the sec-ond half-period were merged together. Typically, the 2f sig-nal and the filtered/fitted absorption signals for a 90-ppbv C2H6 concentration level with N2 as the balance gas are shown in Fig. 9c.
5.2 Measurements and results
The concentration levels of four C2H6 samples with N2 as the balance gas of 0, 30, 60 and 90 ppbv, respectively, were measured. The measurement results based on DAS and WMS are shown in Fig. 9d, e, respectively. The aver-age sampling period was ~7 s, which included a data sam-pling time (~3.4 s) as well as a data-processing time (e.g.,
lock-in time). As shown in the insets of Fig. 9d, e, the Allan deviations of the measurement results for the 0-ppbv C2H6 sample are 2.9 and 5.4 ppbv (@ 7 s) for WMS and DAS, respectively. These two values differ slightly from the Allan deviations, 1.2 ppbv (@ 4 s) for the separate WMS and 7.9 ppbv (@ 1 s) for the separate DAS. For WMS, this difference results from the use of a different signal genera-tor and processing unit, e.g., a commercial SR830 lock-in amplifier for WMS and a LabVIEW-based lock-in ampli-fier for the quasi-simultaneous scheme. For DAS, the dif-ference mainly arises from different scan-signal frequency and data-processing procedures, e.g., 250-Hz scan fre-quency and averaging of 80-frame spectra for a separate DAS mode, a scan 0.3-Hz scan frequency and no averag-ing of the absorption spectra for the quasi-simultaneous scheme.
6 Intercomparison and atmospheric C2H6 measurements
6.1 Intercomparison among the three schemes
C2H6 concentration measurements were realized by using three different schemes, DAS, WMS and quasi-simulta-neous DAS and WMS, using the same sensor platform. A comparison of the sensor-system performances among the three measurement schemes is listed in Table 1. Gen-erally, it is simple to use DAS for the C2H6 concentration measurement, which only requires a triangular signal and fitting of the background for minimizing noise. The WMS detection technique requires both a scan and a modulation signal and a lock-in amplifier to extract harmonic signals. For WMS, the background noise can be minimized, and both precision and stability can be improved compared with DAS. As shown in Table 1, the Allan–Werle deviation is decreased by a factor of ~7–8 times (from 7.92 ppbv @
Table 1 Intercomparison of C2H6 sensor-system performance obtained with three measurement schemes, separate DAS, separate WMS and quasi-simultaneous DAS and WMS
a Allan deviation listed in the table is either the value obtained at the minimum averaging time of a sensor or the minimum value of the Allan deviation plot of a sensor
Measurement scheme Scan/modulation fre-quency
Allan deviationa Primary technology Advantages and disadvan-tages
Separate DAS 250 Hz/unused 7.92 ppbv (@ 1 s)777 pptv (@ 166 s)
Background/absorption fit-ting based on LabVIEW
Simple, limited sensitivity
Separate WMS 0.3/5 kHz 1.19 ppbv (@ 4 s)299 pptv (@ 108 s)
Harmonic extraction based on SR830
Complex, high stability
Quasi-simultaneous DAS and WMS
0.3/5 kHz 5.4 ppbv (@ 7 s) for DAS Background/absorption fit-ting based on LabVIEW
Simple, low sensitivity
2.9 ppbv (@ 7 s) for WMS Harmonic extraction based on LabVIEW
Complex, high stability
Ppb-level mid-infrared ethane detection based on three measurement schemes using a 3.34 μm…
1 3
Page 11 of 13 185
1 s to 1.19 ppbv @ 4 s) in the case of a WMS scheme. A similar behavior can be found between DAS and WMS in the quasi-simultaneous DAS and WMS scheme, subject to some differences in the Allan deviation because of different software and hardware for the three schemes. Hence, these three detection schemes can be applied in different applica-tions, depending upon the requirement of the sensor-system performance.
6.2 Atmospheric C2H6 measurement at Rice University, Houston, TX
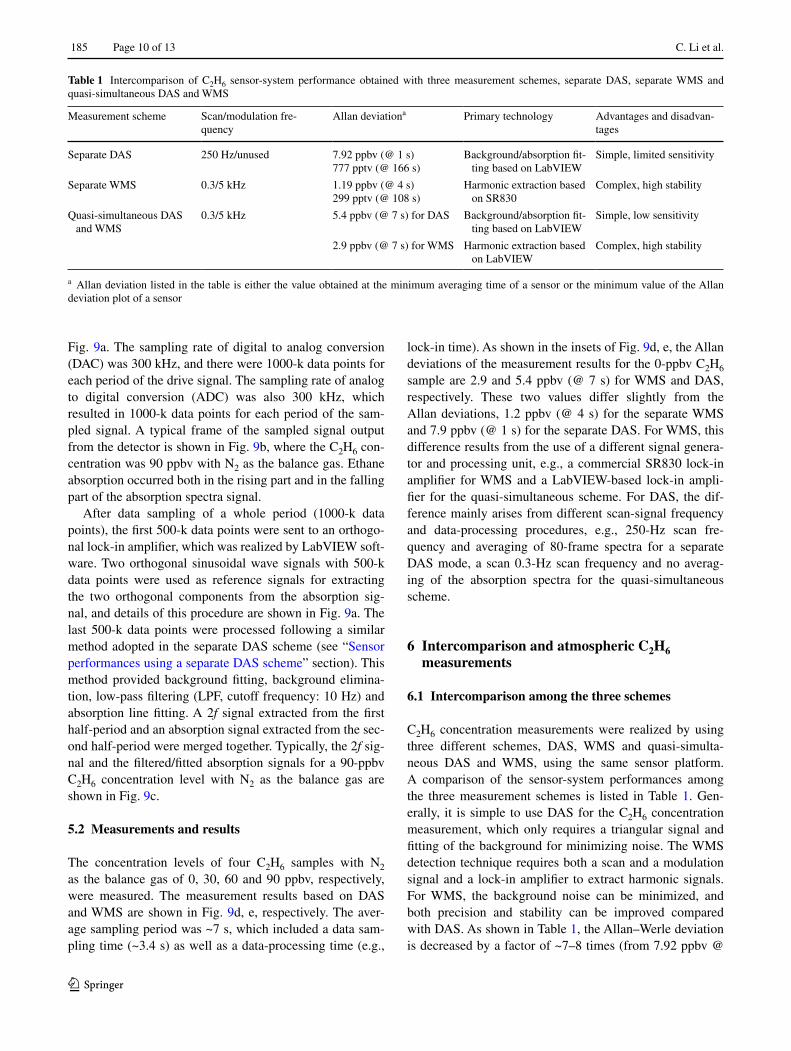
The sensor system was located in the Space Science and Technology building on the Rice University cam-pus. An oil-free pump (KNF Neuberger, Type N831.5 ANE/AF) was used to sample air from outdoors, and the pressure inside the MPGC was set to 100 Torr. Atmospheric C2H6 concentration levels were measured for 2 days of continuous monitoring (from 05:00 pm, February 17, 2016, to 05:00 pm, February 19, 2016, CDT), as shown in Fig. 10. The data-recording period of the WMS-based sensor system was set to ~4 s. The diurnal profile of the C2H6 concentration shows an increase during the early morning between 01:00 and 08:30 am. The early morning peak and the diur-nal trends observed for the C2H6 mixing ratio were the same for the 2 days. On February 18, a sharp increase of C2H6 concentration of ~30 ppbv was observed at 8:00 am. At other time periods, the C2H6 concentration levels were below 5 ppbv. Basically, the MDL of the reported C2H6 sensor is ~ three times the Allan devia-tion (1.19 ppbv) and is estimated to be ~4 ppbv. Hence, the reported sensor system can monitor >4 ppbv atmos-pheric C2H6 concentration levels.
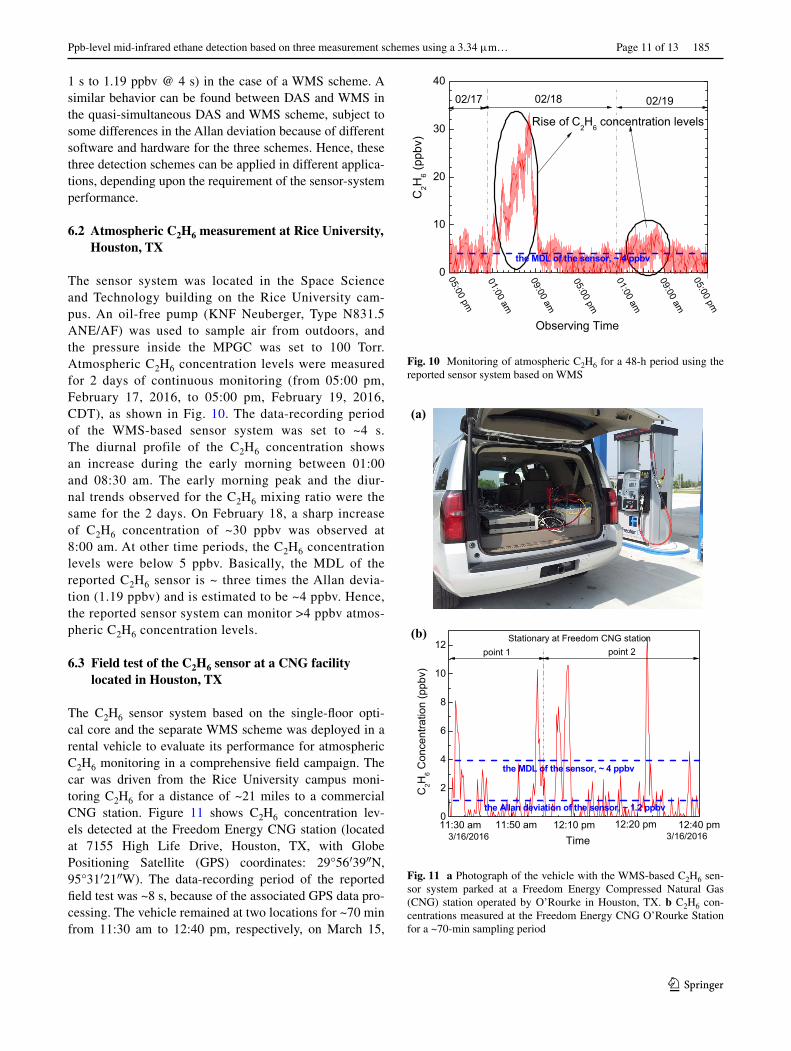
6.3 Field test of the C2H6 sensor at a CNG facility located in Houston, TX
The C2H6 sensor system based on the single-floor opti-cal core and the separate WMS scheme was deployed in a rental vehicle to evaluate its performance for atmospheric C2H6 monitoring in a comprehensive field campaign. The car was driven from the Rice University campus moni-toring C2H6 for a distance of ~21 miles to a commercial CNG station. Figure 11 shows C2H6 concentration lev-els detected at the Freedom Energy CNG station (located at 7155 High Life Drive, Houston, TX, with Globe Positioning Satellite (GPS) coordinates: 29°56′39″N, 95°31′21″W). The data-recording period of the reported field test was ~8 s, because of the associated GPS data pro-cessing. The vehicle remained at two locations for ~70 min from 11:30 am to 12:40 pm, respectively, on March 15,
0
10
20
30
40
02/19 02/18 02/17
C2H
6 (ppb
v)
Observing Time
05:00pm
09:00am
01:00am
05:00pm
09:00am
01:00am
05:00 pm
Rise of C2H6 concentration levels
the MDL of the sensor, ~ 4 ppbv
Fig. 10 Monitoring of atmospheric C2H6 for a 48-h period using the reported sensor system based on WMS
(a)
0
2
4
6
8
10
12
the Allan deviation of the sensor, ~ 1.2 ppbv
3/16/2016
point 2
12:40 pm12:20 pm12:10 pm11:50 am
C2H
6 Con
cent
ratio
n (p
pbv)
Time11:30 am
point 1Stationary at Freedom CNG station
3/16/2016
the MDL of the sensor, ~ 4 ppbv
(b)
Fig. 11 a Photograph of the vehicle with the WMS-based C2H6 sen-sor system parked at a Freedom Energy Compressed Natural Gas (CNG) station operated by O’Rourke in Houston, TX. b C2H6 con-centrations measured at the Freedom Energy CNG O’Rourke Station for a ~70-min sampling period
C. Li et al.
1 3
185 Page 12 of 13
2016. Several peaks in the C2H6 mixing ratios compared with observed background levels (~4 ppbv) were observed, while our vehicle was stationary at these locations. C2H6 concentrations as high as ~12 ppbv were detected at the Freedom Energy CNG station when a gas truck appeared for refueling. This field test verified that our reported sen-sor system can be used effectively to monitor C2H6 at the ppb levels which were above the MDL of the sensor.
7 Conclusions
A CW, TEC, DFB ICL-based mid-infrared sensor was devel-oped for ppb-level C2H6 detection using an absorption line at 2996.88 cm−1 and operating at <100 Torr pressure. A dense patterned MPGC can provide a 54.6-m optical path length with a small sampling volume of 220 ml to facilitate a fast gas exchange demonstrating the potential of compact, sensitive trace gas sensor technology. Three measurement schemes based on two different techniques were employed to assess the C2H6 sensor performance. MDLs of ~7.92 ppbv for an averaging time of 1 s for the separate DAS scheme and ~1.19 ppbv @ 4 s for the separate WMS scheme were obtained. MDLs of 299 pptv for an averaging time of 108 s using separate WMS scheme compared to 777 pptv @ 166 s using separate DAS scheme were realized. Similar sensor performance was demonstrated in the quasi-simultaneous DAS and WMS scheme. Atmospheric C2H6 measurements at Rice University and a field test at a commercial CNG sta-tion in Houston, TX, were conducted using the sensor sys-tem based on the WMS scheme. The reported sensor system can be adapted to other trace gas species by using an ICL or QCL with the appropriate central wavelength.
Acknowledgments Chunguang Li acknowledges support by China Scholarship Council (Grant No. 201406170107). Chuantao Zheng acknowledges the support by China Scholarship Council (Grant No. 201506175025), the National Natural Science Foundation of China (Grant No. 61307124) and the Changchun Municipal Sci-ence and Technology Bureau (Grant No. 14KG022). Lei Dong acknowledges support by National Natural Science Founda-tion of China (Grant Nos. 61575113 and 61275213). Weilin Ye acknowledges the support by China Scholarship Council (Grant No. 201508440112). Frank Tittel acknowledges support by the National Science Foundation (NSF) ERC MIRTHE award, a Rob-ert Welch Foundation Grant C-0586 and a NSF Phase II SBIR (Grant No. IIP-1230427DE DE) and DOE ARPA-E awards # DE-0000545 with Aeris Technologies, Inc. and # DE-0000547 with Maxion Technologies, Inc.
References
1. I.J. Simpson, F.S. Rowland, S. Meinardi, D.R. Blake, Influence of biomass burning during recent fluctuations in the slow growth of global tropospheric methane. Geophys. Res. Lett. 33, L22808 (2006)
2. Y. Xiao, J.A. Logan, D.J. Jacob, R.C. Hudman, R. Yantosca, D.R. Blake, Global budget of ethane and regional constraints on U.S. sources. J. Geophys. Res. 113, D21306 (2008)
3. L.C. Thomson, B. Hirst, G. Gibson, S. Gillespie, P. Jonathan, K.D. Skeldon, M.J. Padgett, An improved algorithm for locating a gas source using inverse methods. Atmos. Environ. 41, 1128–1134 (2007)
4. G. Etiope, P. Ciccioli, Earth’s degassing: a missing ethane and propane source. Science 323, 478 (2009)
5. P. Paredi, S.A. Kharitonov, P.J. Barnes, Elevation of exhaled ethane concentration in asthma. Am. J. Respir. Crit. Care Med. 162, 1450–1454 (2000)
6. B.K. Puri, B.M. Ross, I.H. Treasaden, Increased levels of ethane, a non-invasive, quantitative, direct marker of n-3 lipid peroxida-tion, in the breath of patients with schizophrenia. Prog. Neuro-Psychopharmacol. Biol. Psychiatry 32, 858–862 (2008)
7. K.D. Skeldon, L.C. McMillan, C.A. Wyse, S.D. Monk, G. Gibson, C. Patterson, T. France, C. Longbottom, M.J. Padgett, Application of laser spectroscopy for measurement of exhaled ethane in patients with lung cancer. Respir. Med. 100, 300–306 (2006)
8. W.L. Ye, C.T. Zheng, X. Yu, C.X. Zhao, Z.W. Song, Y.D. Wang, Design and performances of a mid-infrared CH4 detection device with novel three-channel-based LS-FTF self-adaptive denoising structure. Sens. Actuators B Chem. 155, 37–45 (2011)
9. C.T. Zheng, W.L. Ye, X. Yu, C.X. Zhao, Z.W. Song, Y.D. Wang, Performance enhancement of a mid-infrared CH4 detection sen-sor by optimizing an asymmetric ellipsoid gas-cell and reducing voltage-fluctuation: theory, design and experiment. Sens. Actua-tors B Chem. 160, 389–398 (2011)
10. J.A. Silver, Frequency-modulation spectroscopy for trace species detection: theory and comparison among experimental methods. Appl. Opt. 31, 707–717 (1992)
11. P. Werle, A review of recent advances in semiconductor laser based gas monitors. Spectrochim. Acta A 54, 197–236 (1998)
12. S. Schilt, L. Thévenaz, P. Robert, Wavelength modulation spec-troscopy: combined frequency and intensity laser modulation. Appl. Opt. 42, 6728–6738 (2003)
13. G. Wysocki, Y. Bakhirkin, S. So, F.K. Tittel, C.J. Hill, R.Q. Yang, M.P. Fraser, Dual interband cascade laser based trace-gas sensor for environmental monitoring. Appl. Opt. 46, 8202–8210 (2007)
14. M.N. Fiddler, I. Begashaw, M.A. Mickens, M.S. Collingwood, Z. Assefa, S. Bililign, Laser spectroscopy for atmospheric and environmental sensing. Sensors 9, 10447–10512 (2009)
15. R.F. Curl, F. Capasso, C. Gmachl, A.A. Kosterev, B. McManus, R. Lewicki, M. Pusharsky, G. Wysocki, F.K. Tittel, Quantum cascade lasers in chemical physics. Chem. Phys. Lett. Front. Artic. 487, 1–18 (2010)
16. M.R. McCurdy, Y. Bakhirkin, G. Wysocki, R. Lewicki, F.K. Tit-tel, Recent advances of laser—spectroscopy-based techniques for applications in breath analysis. J. Breath Res. 1, 014001 (2007)
17. T.H. Risby, F.K. Tittel, Current status of mid-infrared quantum and interband cascade lasers for clinical breath analysis. Opt. Eng. 49, 111123 (2010)
18. J.H. Shorter, D.D. Nelson, J.B. McManus, M.S. Zahniser, D.K. Milton, Multicomponent breath analysis with infrared absorption using room-temperature quantum cascade lasers. IEEE Sens. J. 10, 76–84 (2010)
19. G. Wysocki, A.A. Kosterev, F.K. Tittel, Spectroscopic trace-gas sensor with rapidly scanned wavelengths of a pulsed quantum cascade laser for in situ NO monitoring of industrial exhaust sys-tems. Appl. Phys. B 80, 617–625 (2005)
20. M. Lewander, Z.G. Guan, L. Persson, A. Olsson, S. Svanberg, Food monitoring based on diode laser gas spectroscopy. Appl. Phys. B 93, 619–625 (2008)

Ppb-level mid-infrared ethane detection based on three measurement schemes using a 3.34 μm…
1 3
Page 13 of 13 185
21. J. Chen, S. So, H. Lee, M.P. Fraser, R.F. Curl, T. Harman, F.K. Tittel, Atmospheric formaldehyde monitoring in the Greater Houston area in 2002. Appl. Spectrosc. 58(2004), 243–247 (2002)
22. M. Angelmahr, A. Miklos, P. Hess, Photoacoustic spectroscopy of formaldehyde with tunable laser radiation at the parts per bil-lion level. Appl. Phys. B 85, 285–288 (2006)
23. J. Li, U. Parchatka, H. Fischer, A formaldehyde trace gas sensor based on a thermoelectrically cooled CW-DFB quantum cascade laser. Anal. Methods 6, 5483–5488 (2014)
24. J.H. Miller, Y.A. Bakhirkin, T. Ajtai, F.K. Tittel, C.J. Hill, R.Q. Yang, “Detection of formaldehyde using off-axis integrated cav-ity output spectroscopy with an interband cascade laser”. Appl. Phys. B 85, 391–396 (2006)
25. K. Krzempek, M. Jahjah, R. Lewicki, P. Stefanski, S. So, D. Thomazy, F.K. Tittel, CW DFB RT diode laser-based sensor for trace-gas detection of ethane using a novel compact multipass gas absorption cell. Appl. Phys. B 112, 461–465 (2013)
26. K. Krzempek, R. Lewicki, L. Naehle, M. Fischer, J. Koeth, S. Belahsene, Y. Rouillard, L. Worschech, F.K. Tittel, Continuous wave, distributed feedback diode laser based sensor for trace-gas detection of ethane. Appl. Phys. B 106, 251–255 (2012)
27. L. Dong, C. Li, N.P. Sanchez, A.K. Gluszek, R. Griffin, F.K. Tit-tel, Compact CH4 sensor system based on a continuous-wave, low power consumption, room temperature interband cascade laser. Appl. Phys. Lett. 108, 011106 (2016)


![acd 3-1 MID-1 [ ]](https://static.fdocument.org/doc/165x107/568bf2331a28ab893395ce42/acd-3-1-mid-1-wwwuandistarorg.jpg)