7 μm, ultrafast, sub-millijoule-level mid-infrared optical ...
C O N C E P T U A L D E S I G N M E M O R A N D U M
MID-SEA DAM AND BARRIER CONCEPTS SALTON SEA STUDY RIVERSIDE AND IMPERIAL COUNTIES, CALIFORNIA
Prepared for:
Bureau of Reclamation Lower Colorado Regional Office Boulder City, Nevada Under Subcontract to: Tetra Tech, Inc. 3475 Foothill Boulevard Pasadena, California 91107 URS Project No. 27662033
September 21, 2004
1615 Murray Canyon Road, Suite 1000 San Diego, CA 92108-4314 619.294.9400 Fax: 619.293.7920
TABLE OF CONTENTS
W:\27662033\00002-a-r.doc\21-Sep-04\SDG i
Section 1 Introduction ......................................................................................................1-1
1.1 Background of Salton Sea Studies.........................................................................1-1 1.2 Preliminary Geotechnical Investigation.................................................................1-2 1.3 Purpose and Scope of Study ..................................................................................1-3
1.3.1 Task 1.1 – Preliminary Stability and Seepage Analyses...........................1-3 1.3.2 Task 1.2 – Projected Draw Down of the Sea ............................................1-4 1.3.3 Task 1.3 – Reevaluation of Unit Costs......................................................1-4 1.3.4 Task 1.4 – Update Previous Conceptual Design Concepts .......................1-4 1.3.5 Task 1.5 – Develop New Design Concepts...............................................1-4 1.3.6 Task 1.6 – Workshop and Report Preparation ..........................................1-4
Section 2 Preliminary Engineering Analyses .................................................................2-1
2.1 Sea Drawdown Analyses .......................................................................................2-1 2.1.1 Dam Concept ............................................................................................2-1 2.1.2 Barrier Concept .........................................................................................2-2
2.2 Embankment Stability Analyses............................................................................2-2 2.2.1 Methodology .............................................................................................2-2 2.2.2 Material Properties....................................................................................2-2 2.2.3 Input Parameters .......................................................................................2-3 2.2.4 Results.......................................................................................................2-3
2.3 Cellular Dam Stability Analyses ...........................................................................2-4 2.4 Settlement Analyses...............................................................................................2-4 2.5 Seepage Analyses ..................................................................................................2-5
Section 3 Engineering Workshop ....................................................................................3-1
Section 4 Dam Concepts ..................................................................................................4-1
4.1 Seismic Dike (Revised) .........................................................................................4-1 4.2 DSM Cellular Dam (Revised) ...............................................................................4-1 4.3 Zoned Rockfill Dam (New) ...................................................................................4-2 4.4 Blanketed Rockfill Dam (New) .............................................................................4-3 4.5 Precast Concrete Caisson (New)............................................................................4-3 4.6 Concrete Sheet Pile Dam (New)............................................................................4-4 4.7 Dumped Fill Dike (Eliminated) .............................................................................4-4
Section 5 Barrier Concepts ..............................................................................................5-1
5.1 Dumped Earthfill Barrier (Revised) ......................................................................5-1 5.2 Rockfill Barrier with Dredged Fill (Revised) ........................................................5-1 5.3 DSM Cellular Barrier (New) .................................................................................5-2 5.4 Precast Concrete Caisson (New)............................................................................5-2 5.5 Concrete Sheet Pile Barrier (New) ........................................................................5-3 5.6 Beach Barrier (Eliminated)....................................................................................5-3
Section 6 Appraisal Level Cost Estimates......................................................................6-1
TABLE OF CONTENTS
W:\27662033\00002-a-r.doc\21-Sep-04\SDG ii
6.1 Quantity Estimates.................................................................................................6-1 6.2 Unit Prices .............................................................................................................6-1 6.3 Estimated Total Costs ............................................................................................6-2
Section 7 Conclusions......................................................................................................7-1
7.1 Technical Feasibility..............................................................................................7-1 7.2 Design and Construction Issues.............................................................................7-1 7.3 Material Sources ....................................................................................................7-1 7.4 Estimated Total Costs ............................................................................................7-2 7.5 Further Studies.......................................................................................................7-2
7.5.1 Fault Locations..........................................................................................7-2 7.5.2 Additional Geotechnical Investigations ....................................................7-2 7.5.3 Dynamic Response of Embankments........................................................7-3
Section 8 References ........................................................................................................8-1
List of Tables, Figures, and Appendices
W:\27662033\00002-a-r.doc\21-Sep-04\SDG iii
Tables
Table 1 Summary of Material Properties Used for Preliminary Static Slope Stability Analyses Table 2 Results of Preliminary Static Slope Stability Analyses Table 3 Summary of Material Properties Used for Cellular Dam Stability Analyses Table 4 Comparison of Unit Costs for Rockfill Sources Table 5 Summary of Unit Costs for Mid-Sea Dam Concepts Table 6 Summary of Unit Costs for Mid-Sea Barrier Concepts Table 7 Summary of Conceptual Designs and Appraisal Level Costs for Mid-Sea Dam Concepts
with Sea at –230 feet MSL Table 8 Summary of Conceptual Designs and Appraisal Level Costs for Mid-Sea Dam Concepts
with Sea at –235 feet MSL Table 9 Summary of Conceptual Designs and Appraisal Level Costs for Mid-Sea Dam Concepts
with Sea at –240 feet MSL Table 10 Summary of Conceptual Designs and Appraisal Level Costs for Mid-Sea Barrier
Concepts with Sea at –247 feet MSL Table 11 Summary of Conceptual Designs and Appraisal Level Costs for Rockfill Dam with Slurry
Wall
Figures
Figure 1 Mid-Sea Dam and Barrier Location Figure 2 Projected Downstream Brine Pool Elevation– Dam Concept Figure 3 Projected Sea Water Surface Elevation– Barrier Concept Figure 4 Mid-Sea Dam Conceptual Design - Seismic Dike Figure 5 Mid-Sea Dam Conceptual Design - Deep Soil Mixed (DSM) Cellular Dam Figure 6 Mid-Sea Dam Conceptual Design - Zoned Rockfill Dam Figure 7 Mid-Sea Dam Conceptual Design - Blanketed Rockfill Dam Figure 8 Mid-Sea Dam Conceptual Design - Precast Concrete Caisson Figure 9 Mid-Sea Dam Conceptual Design - Concrete Sheet Pile Dam Figure 10 Mid-Sea Barrier Conceptual Design - Dumped Fill Barrier Figure 11 Mid-Sea Barrier Conceptual Design – Rockfill Barrier with Dredged Fill Figure 12 Mid-Sea Barrier Conceptual Design - Deep Soil Mixed (DSM) Cellular Barrier Figure 13 Mid-Sea Barrier Conceptual Design - Precast Concrete Caisson Figure 14 Mid-Sea Barrier Conceptual Design - Concrete Sheet Pile Barrier Figure 15 Net Present Value vs. Sea Level for Dam Concepts
Appendices
Appendix A Static Slope Stability Analyses Appendix B Engineering Workshop Biographical Sketches Appendix C Appraisal Level Cost Estimates – Dam Concepts Appendix D Appraisal Level Cost Estimates – Barrier Concepts Appendix E Salinity and Sea Level Predictions
List of Acronyms and Abbreviations
W:\27662033\00002-a-r.doc\21-Sep-04\SDG iv
BOR United States Bureau of Reclamation c’ Effective cohesion CPT Cone Penetration Test cu Undrained Shear Strength DSOD Division of Safety of Dams ICU Isotropically Consolidated Undrained (Triaxial Compression Test) kAF Thousand acre-feet mg/L Milligrams per Liter MSL Mean Sea Level NAD 83 North American Datum 1983 NPV Net Present Value pcf Pounds per cubic foot psf Pounds per square foot QSA Quantification Settlement Agreement Sea Salton Sea SSA Salton Sea Authority tsf Tons per square foot USCS Unified Soil Classification System URS URS Corporation UU Unconsolidated Undrained (Triaxial Compression Test) φ’ Effective friction angle σv’ Vertical effective stress
Glossary
W:\27662033\00002-a-r.doc\21-Sep-04\SDG v
Below is a glossary of terms that are unique to geotechnical engineering or this study:
Anisotropic – soils exhibiting strength properties with different values when measured in different directions.
Appraisal level – initial level of study to determine if concepts are feasible.
Alluvial deposits – geologic sediments that have been deposited in flowing water.
Barrier – an earthen, steel or concrete structure that is designed to separate waters of differing salinities but not to retain substantial water head differences.
Borings – penetrations into the earth that are used to obtain soil samples for engineering characterization.
Caisson – a structure that is sunk to its design level by excavating from within and at the bottom of the structure
Cellular – configuration of the dam or barrier using a series of interconnected cells, usually circular in shape
Cofferdam – a temporary watertight enclosure that is built to allow construction of other facilities in the dry.
Cone Penetration Tests – an in-situ test that is performed as part of a geotechnical investigation. Test is performed by pushing load cell instrumented steel cone into soil with rods.
Consolidation – compression of soil structure due to loading and subsequent movement of soil pore water.
Dam – an earthen, steel or concrete structure that is designed to retain substantial water head differences.
Deep Soil Mixing – method used to mix cement into soil with large augers to solidify soil.
Dumped Earth Fill – embankment materials that are dumped into the Sea and no compaction of the materials is undertaken.
Dynamic response – the reaction of embankment configurations to seismic shaking.
Embankment – earthen structure constructed out of either soil or rockfill.
Factors of safety – calculated in stability analyses to estimate margin above limit equilibrium. A factor of safety of 1.0 indicates incipient failure.
Freeboard – height of a dam or barrier above the Sea level; incorporated to prevent overtopping by waves.
Hydraulically dredged – excavation of earthen materials below water using a suction pipe and transported as a slurry.
Lacustrine deposits – geologic sediments that have accumulated in freshwater lakes or closed basins.
Lifts – placement of earth materials in layers.
Liquefaction – loss of shear strength in a granular soil due to increased pore pressures generated by seismic shaking.
Lithology – the mineral constitution and classification of earthen materials.
Glossary
W:\27662033\00002-a-r.doc\21-Sep-04\SDG vi
Net Present Value – the present cost of the capital costs plus the future annual operating costs calculated using a discount rate.
Noncontract costs – costs that are not for actual construction of the facility; these cover the costs of permitting, engineering, construction management, owner’s administration, legal, and other costs.
Overexcavation – excavation of weak materials below embankment and replacement with more suitable materials.
Piping – internal erosion of embankment materials.
Rockfills – embankment materials consisting of blasted rock, with particles ranging from gravel to boulder size. Construction specifications may limit largest size.
Salton Sea Accounting Model – spreadsheet model developed to estimate salinities and elevation of Salton Sea for various inflows and losses.
Seepage analyses – an estimation of waters that may flow through a dam or barrier.
Seismic deformations – movements of embankments induced by seismic vibrations.
Settlement analyses – an estimation of the settlement that may occur of an embankment due to compression of the supporting soils.
Slurry wall – a hydraulic barrier constructed by excavating a trench that is backfilled with a relatively impermeable material. The trench walls are typically supported during excavation by filling the trench with a bentonite slurry.
Static slope stability analyses – analyses to estimate potential for embankment materials to slide on weak foundation. Only gravity (static) forces (and not seismically induced forces) are considered.
Stratigraphy – layering of geologic deposits.
Subbottom materials – earthen materials below the bottom of the Sea.
Undrained shear strength – strength of a soil that occurs when loading is sufficiently fast that soil pore pressures generated from the loading do not dissipate.
Unlisted items – ancillary features of the dams and barriers that are not detailed or quantified at the conceptual level of design
Viboflotation – method used to densify loose granular soils by inserting vibrating probe and backfilling penetration hole with additional material.
Zoned dam – a dam consisting of an outer shell and an inner core. The core usually serves as the hydraulic barrier.
SECTIONONE Introduction
W:\27662033\00002-a-r.doc\21-Sep-04\SDG 1-1
SECTION 1 INTRODUCTION
This conceptual design memorandum presents the results of URS Corporation’s (URS) technical study of mid-Sea dam and barrier concepts for elevation and/or salinity control at the Salton Sea (Sea). Almost any control action would include construction of some facilities within the Salton Sea. Facilities that would act as dams or barriers to either impound water or to isolate saltier water from fresher water. Recent geotechnical investigations of the Sea bottom conducted by the Bureau of Reclamation (BOR) and the Salton Sea Authority (SSA) have provided new information about the foundation conditions for in-Sea construction. The latest geotechnical information was used to update and expand upon previous conceptual design strategies for constructing such facilities. Existing concepts were reviewed and updated, new strategies were proposed and reviewed, conceptual design drawings were prepared, and appraisal-level cost estimates were developed. This study was limited to review of the mid-Sea features only.
1.1 BACKGROUND OF SALTON SEA STUDIES
The Sea is located in Riverside and Imperial Counties in southern California, south of Indio and north of El Centro. The Sea is situated in a closed basin, more than 200 feet below sea (ocean) level, and has no natural outlet. Although lakes have existed in this basin in the past, the current body of water formed in 1905 when a levee break along the Colorado River caused flows from the Colorado River to enter the basin for about 18 months. Since 1905, the Sea has fluctuated in size with varying inflow, and it recently has had a surface area of 365 square miles. A balance between inflowing water and evaporation sustains the Sea.
With no outlet, any salts that are dissolved in the inflow are trapped, although some do precipitate. Salt concentrations are currently about 44,000 milligrams per liter (mg/L), or about 25 percent higher than ocean water. Salinity will continue to rise under current conditions. A reduction in inflow will cause the Sea to shrink and cause salinity to rise faster that it would have without the reduction in inflow. The Quantification Settlement Agreement (QSA) signed into law in late 2003 will likely reduce the inflows to the Sea.
A Status Report (BOR, 2003b) provides a summary of the status of the evaluation of alternatives under consideration for salinity. The primary purpose of that planning study was to evaluate possible methods of controlling the salinity and elevation of the Sea. The study also includes elements that address other issues at the Sea, such as high levels of nutrients. Fourteen alternatives providing a range of salinity and elevation control benefits and costs are presented in this report. For ease of presentation and understanding, alternatives were divided into the following categories:
• Salinity control alternatives
• Salinity and elevation control alternatives
• Barrier alternatives
• Specialized diking alternatives
SECTIONONE Introduction
W:\27662033\00002-a-r.doc\21-Sep-04\SDG 1-2
Methods to control salinity and elevation include pumping water out of the Sea with discharge to some remote location; pumping water out of the Sea with discharge to local desalting plants or evaporation ponds, possibly in combination with enhanced evaporation systems that would require disposal of salt residues near or within the Sea; and dividing the Sea through the construction of embankments so that one portion serves to concentrate and isolate salts from the remainder of the Sea. The most practical and promising of these options would involve some in-Sea construction of dams or barriers to facilitate the desired salinity and elevation controls.
The most cost-effective location for a dam or barrier that would reduce the evaporative surface of the Sea is what has been termed the mid-Sea location. The alignment for this location runs from the west shore of the Sea about one to two miles south of Salton City, to the east shore of the Sea, about two miles north of Bombay Beach, a total length of about 8½ miles (Figure 1). This location minimizes the length of the structure as well as the evaporation area of the remaining part of the Sea. The combination of shallower water depths and narrow Sea width at this location allows for the least volume of embankment material than other alignments that would be required to reduce the Sea surface by similar amounts.
The mid-Sea dam concept would divide the Sea to create two separate bodies of water, providing a hydraulic barrier and maintaining the elevation of the Sea on one side of the dam while providing a repository for hypersaline waters at a lower elevation on the other side of the dam. One side of the dam would be allowed to shrink in size and increase in salinity, whereas the body of water on the other side of the dam would receive sufficient flows from the New and Alamo Rivers to maintain a salinity near present levels. The dam concepts would provide both elevation and salinity control on one side of the dam. Excess flows received by the Sea would be channeled to the hyper-saline repository.
The mid-Sea barrier concept would separate waters of different salinities, but would not provide a barrier to hydraulic heads. Similar to the mid-Sea dam concept, one body of water would receive sufficient flows from the New and Alamo Rivers to maintain salinity levels near the present levels. The other body of water would become the terminal location of dissolved salts, where salt concentrations would eventually increase to the point where salt crystals would begin to precipitate from solution. Dissolved salts would migrate to the hypersaline body of water through the displacement of saline water by inflows of the New and Alamo Rivers. Large culverts constructed through the barrier would allow for flow between the bodies, such that the hydraulic head across the barrier would be balanced. The barrier would provide the ability to control salinity on one side of the barrier but would not provide elevation control on either side of the barrier.
Previous concepts for the mid-Sea dam and barrier were developed during engineering workshops in late 2002 and in mid-2003. The concepts developed at these workshops included relatively impervious dam and perimeter dikes, and barriers constructed of earthen materials. These concepts were developed using the collective experience of teams of government and consulting engineers; no site-specific geotechnical information was available during development of the concepts.
1.2 PRELIMINARY GEOTECHNICAL INVESTIGATION
The mid-Sea dam and barrier concepts would involve extensive embankment construction and the requirements for foundation preparation are a critical design and cost consideration. In recognition of this, a preliminary geotechnical investigation was undertaken in late 2003 to develop a general characterization
SECTIONONE Introduction
W:\27662033\00002-a-r.doc\21-Sep-04\SDG 1-3
of the foundation conditions at the mid-Sea location, and at other locations around the perimeter of the Sea. A secondary objective of the investigation was to evaluate the potential for obtaining suitable borrow materials from within the Sea for embankment construction. The results of the investigation are presented in a report that is available on SSA’s website; www.saltonsea.ca.gov (URS, 2004). The preliminary geotechnical investigation provided limited data along potential embankment alignments. A much more extensive investigation will be warranted as design concepts are further developed.
Drilled and sampled borings and Cone Penetration Tests (CPTs) were utilized to explore the subsurface conditions within the Sea. A self-propelled jack-up barge provided a stable platform for the exploration activities. A total of 11 borings and 17 CPTs were completed throughout the Sea during the exploration program, to depths ranging from 30 to 150 feet below the seafloor. A series of borings and CPTs were performed along a mid-Sea alignment in the narrowest part of the Sea, and also at various locations around the perimeter of the Sea. An extensive laboratory testing program was undertaken on the soil samples obtained from the investigation to characterize the physical and mechanical properties of the soils.
The explorations for the preliminary geotechnical investigation encountered primarily fine-grained (silts and clays) lacustrine deposits underlying the Sea. Immediately underlying the seafloor, the lacustrine deposits have most likely been deposited in the lake environment and have never been dried out or desiccated. As a result, they are of low strength and high compressibility. The weak deposits will have a significant impact on the design of embankments in the Sea. In the central and eastern portion of the mid-Sea alignment, these weak soils extend to depths of 40 to 45 feet. With depth, the lacustrine deposits typically became stronger, probably because these sediments were laid down in ancient ephemeral lakes and have gone through wetting and drying cycles. As a result, the consistencies and strengths of these materials are variable. Some granular (sandy) alluvial deposits were encountered near the shoreline of the present Sea, primarily along the western shore, and typically grade laterally (with distance from the shoreline) into the lacustrine deposits.
1.3 PURPOSE AND SCOPE OF STUDY
The purpose of this study was to reevaluate the previous mid-Sea dam and barrier concepts in light of the site-specific results obtained from the preliminary geotechnical investigation. Additional concepts appropriate for the site conditions were also to be evaluated. The scope of the study is outlined in the following tasks.
1.3.1 Task 1.1 – Preliminary Stability and Seepage Analyses
Static stability and seepage analyses were performed to assess the appropriate cross section for the dam or barrier embankment or structure. Parametric stability analyses were performed to evaluate the requirements for combining some overexcavation of the weak foundation soils with an appropriate inclination of embankment slopes. Seepage analyses were performed to evaluate the permeability and embankment width requirements to mitigate against high seepage velocities that could erode the embankment. Settlement analyses were also performed to evaluate freeboard requirements, and to account for the additional embankment material that may be required due to compression of the foundation soils.
SECTIONONE Introduction
W:\27662033\00002-a-r.doc\21-Sep-04\SDG 1-4
Data on sediments were also reviewed to facilitate an evaluation as to whether borrow materials dredged from the Sea will be a suitable source for fill.
1.3.2 Task 1.2 – Projected Draw Down of the Sea
Some control strategies involve designs of in-Sea structures at Sea levels lower than the present level. These strategies could involve construction at future times when Sea levels have been drawn down by reduced inflows. Estimates of the future Sea levels were made using the BOR Salton Sea Accounting model. Estimates were made for the downstream Sea level of the mid-Sea dam and the ultimate Sea level for the barrier concept. These estimates are provided in Appendix E.
1.3.3 Task 1.3 – Reevaluation of Unit Costs
Unit costs used for the previous concepts were perpetuated from costs used for the Draft EIS/EIR and did not account for the potential source of the materials or quantities that may be required. These were reevaluated based on potential borrow sites that have been identified. Unit costs were developed based on the labor, equipment and materials that would be required to develop the quantities anticipated in the conceptual designs.
1.3.4 Task 1.4 – Update Previous Conceptual Design Concepts
Previous design concepts were reviewed for applicability given the site-specific conditions as characterized by the preliminary geotechnical investigation. The previous concepts were revised to account for different amounts of overexcavation of the foundation soils, different embankment inclinations, and additional quantities to account for settlements. Appraisal level cost estimates were developed for conceptual designs of dams constructed at various water depths.
1.3.5 Task 1.5 – Develop New Design Concepts
New concepts for both the mid-Sea dam and barrier were developed that were appropriate for the site’s foundation soils and seismic exposure. Drawings of the conceptual designs to depict the design and appraisal level cost estimates for the new concepts were prepared.
1.3.6 Task 1.6 – Workshop and Report Preparation
A one-day workshop of 15 government and consulting engineers was convened on March 23, 2004 to review the previous dam and barrier concepts in light of the results of the preliminary geotechnical investigation. In addition, new concepts were developed that recognized the site-specific preliminary geotechnical investigations and potential for high seismicity at the site. The workshop also provided a forum to obtain comments on the results of the preliminary geotechnical investigation from the group of engineers. The results of the workshop are incorporated in this conceptual design memorandum. Detailed results are provided in Appendix A for static slope stability analyses, Appendix B contains biographical sketches of the workshop participants, Appendix C and D provide details of the cost estimates, and Appendix E provides a discussion and results of predicted salinities and Sea levels using the Salton Sea Accounting Model.
SECTIONTWO Preliminary Engineering Analyses
W:\27662033\00002-a-r.doc\21-Sep-04\SDG 2-1
SECTION 2 PRELIMINARY ENGINEERING ANALYSES
The dam and barrier alternatives consisted of either earthen embankments or structures constructed of steel sheet piles or precast concrete. Preliminary conceptual designs were formulated based primarily on foundation considerations; e.g. slope inclinations for the embankments that would be statically stable, and structure widths that would resist sliding and overturning for the water heads to be retained. Seismic design considerations were incorporated using precedence and engineering judgment. Additional analyses (completed by Tetra Tech) included estimates of the Sea level drawdown for the downstream pool for the dam concept and the ultimate level for the barrier concept.
The dam and barrier alternatives considered represent significant engineered facilities. The concepts have been developed based on preliminary site-specific information and significant engineering judgment. Considerably more engineering analyses will be required to further develop the concepts evaluated.
2.1 SEA DRAWDOWN ANALYSES
The Salton Sea Accounting spreadsheet model (BOR, 2003b) was used to estimate the level of the Sea for various scenarios. The average inflow to the Sea is expected to decrease, over about 15 to 20 years, from over 1,300,000 acre feet per year to an expected value of about 930,000 acre-feet per year. While the water transfer agreements contain predictable transfer schedules, there is an option for up to 1.6 million-acre feet of additional transferred water if the water is not needed to mitigate effects to the Salton Sea. In addition, inflow to the New River from Mexico, where the flow originates, may also be subject to future reductions. For example, reductions in surplus Colorado River flows to Mexico could, in turn, affect New River flows back across the border. It is also possible that the Coachella Valley groundwater management program would affect inflows. These variables translate to an uncertainty with respect to actual Salton Sea inflows. Therefore, three inflow scenarios are considered: 1) The anticipated QSA schedule that includes water releases to mitigate effects to the Salton Sea over the next 15 years; 2) The QSA schedule with the mitigation water terminated in 2006 and sale of additional water to generate restoration funds; and 3) A schedule that would reduce average inflow to about 800,000 acre feet per year. The results of these analyses are detailed in Appendix E.
2.1.1 Dam Concept
It is currently proposed that the hyperlsaline side of the dam would be on the south side. The Sea level on the north side will likely be lower than –230 feet MSL to accommodate transfer of waters from the New and Alamo Rivers without pumping; and may vary between –230 and –240 feet MSL. Figure 2 presents the water level on the south (downstream) side of the dam for varying Sea levels. This analysis assumes flows reduced to those in the QSA with mitigation water flowing to the Sea until 2018. This analysis indicates that the downstream pool will be at elevations varying from about –255 to –260 feet MSL. The elevation of –255 feet MSL was used in the stability analyses. This was the level anticipated when the analyses were initiated. Subsequently, the drawdown analyses indicated slightly lower levels. An evaluation of selected alternatives indicated that the change was not significant enough to change the selected slope inclinations or cell sizes. As a result, the analyses were not redone.
SECTIONTWO Preliminary Engineering Analyses
W:\27662033\00002-a-r.doc\21-Sep-04\SDG 2-2
2.1.2 Barrier Concept
For the barrier concept, the Sea will shrink until the inflows balance the evaporative losses. Figure 3 illustrates the Sea level without elevation control (simulating what would occur with the barrier concept). This analysis projects the Sea level to be at –247 feet MSL with the barrier concept, for inflows anticipated with the QSA and mitigation water flowing to the Sea until 2018.
2.2 EMBANKMENT STABILITY ANALYSES
Preliminary static slope stability analyses were performed to evaluate the appropriate side slope inclinations for the embankments incorporated into the dam and barrier concepts. These inclinations should be confirmed during further design development by performing seismic response analyses.
2.2.1 Methodology
The static slope stability analyses were performed using the two-dimensional computer program SLOPE/W, Version 5.17 (Geo-Slope International Ltd., 2003b). The analyses were based on the Spencer Method of Slices for force and moment equilibrium stability. Analyses were performed for each of the embankment alternatives for the dam and barrier concepts. Wedge-shaped failure sliding surfaces were analyzed on a limited basis; however, they were found to be more stable than a circular sliding surface. Therefore, only the results for the circular sliding surfaces are presented.
The results of the stability analyses are presented in terms of factors of safety. Factors of safety are defined as the ratio of the total stabilizing forces/moments along an assumed sliding surface divided by the total sum of external and internal driving forces/moments acting on the sliding mass. Typically, a factor of safety of at least 1.5 is desired for long-term stability.
2.2.2 Material Properties
The material properties used for the static stability analyses were based on the results of laboratory testing from the preliminary geotechnical investigation and input from the engineering workshop participants. The material properties used in the analyses are summarized in Table 1. The material parameters used for the “Compacted or Densified Fill” are presumed to be conservative (same as for “Dumped Fill”) and could be revised in future analysis.
Isotropically consolidated undrained (ICU) triaxial compression strength tests were performed on the foundation soils for the preliminary geotechnical investigation. However, index properties obtained on the weak foundation soils, and the depositional environment at the Sea, were very similar to those for clays underlying or in the vicinity of the Great Salt Lake in Utah. Extensive studies performed on those clays indicate anisotropic strengths; e.g. varying strengths depending on whether the soil is being compressed, sheared or in extension. Workshop participants indicated that the appropriate foundation shear strengths could be lower than what was indicated by the ICU tests. Therefore, anisotropic strength parameters were developed for use in the stability analyses.
An undrained shear strength ratio (cu/σ’v) of 0.35 was used for vertical (compressive) shear, based on the results of the ICU tests. A cu/σ’v ratio of 0.25 was used for horizontal shear, based on published
SECTIONTWO Preliminary Engineering Analyses
W:\27662033\00002-a-r.doc\21-Sep-04\SDG 2-3
correlations (Ladd, 1991). The cu/σ’v ratio for each slice in the stability analysis is interpolated between 0.35 and 0.25 based on the inclination of the base of the slice (between the horizontal and vertical). The strength of the foundation material was calculated based on the vertical effective stress and the cu/σ’v ratio.
2.2.3 Input Parameters
The slope stability analyses for the dam concept incorporated a crest elevation of –225 feet MSL, allowing for 5 feet of freeboard with a water level of –230 feet MSL on the upstream side of the dam. This freeboard was based on engineering judgment and previous reservoir designs in the area. Wave runup analyses for a specific dam location and wind fetch will need to be performed, as the design is further developed. A water level of –255 feet MSL was used on the downstream side of the dam, based on the drawdown analyses. Steeper slope inclinations were possible on the upstream side of the dam due to the lower buoyant weights contributing to the driving forces.
The barrier concepts were analyzed for a crest elevation of –242 feet MSL, also allowing for 5 feet of freeboard with a water level of –247 feet MSL on both sides of the barrier.
The slope stability analyses were performed assuming some removal of the weak foundation materials. Preliminary analyses for the dam concepts indicated that it was more economical to limit the depth of overexcavation of the weak materials and to use flatter slope inclinations. A maximum overexcavation depth of 25 feet was selected based on judgment and previously constructed projects on similar soils, e.g. the Great Salt Lake railroad causeway (Casagrande, 1960). This maximum depth of overexcavation was used below the toes of the embankment whereas it was decreased to only 10 feet of overexcavation below the crest of the dam. The reduced overexcavation was used to reduce both the dredging and embankment quantities. For the barrier concepts, some depth of removal was required, and 10 feet of overexcavation below the entire embankment was selected based on judgment.
2.2.4 Results
Parametric slope stability analyses were performed for various embankment slope inclinations until a static factor of safety of at least 1.5 was achieved. The resulting slope inclinations for each concept are presented in Sections 3 and 4 where each concept is discussed. These same slope inclinations were conservatively assumed for concepts that would entail Sea levels lower than –230 feet MSL.
The results of the embankment slope stability analyses are presented in Table 2. Graphical results of the slope stability analyses are presented in Appendix A. In these figures, the assumed sliding surface and rotation center (of the sliding surface) are shown. The vertical lines within the sliding surface represent slices for computational purposes; the moments and forces acting on each slice are computed to calculate the factor of safety. The contours shown above the embankment represent rotation centers with similar factors of safety. The rotation center with the minimum factor of safety is labeled.
It should again be recognized that these analyses are preliminary and additional analyses, based on more extensive investigations of foundation conditions and evaluations of potential embankment materials, will be required as the design of the concepts are further developed.
SECTIONTWO Preliminary Engineering Analyses
W:\27662033\00002-a-r.doc\21-Sep-04\SDG 2-4
2.3 CELLULAR DAM STABILITY ANALYSES
The cellular dam concepts were sized using static limit equilibrium analyses for overturning and sliding. These analyses assume that the cellular dams act as rigid bodies, due to the solidification or densification that is proposed for the fill and foundation soils. This will need to be confirmed with additional analyses and evaluations as the concepts are further developed. The systems were not analyzed for racking (internal horizontal shear) or vertical shear because it was assumed that the soils within the cellular dams would be densified by vibroflotation or solidified by deep soil mixing (DSM). Sliding was the controlling failure mode, and thus, the cellular dam systems were sized to provide a minimum static factor of safety of 1.5 against sliding. The bearing capacity of cellular dam concepts is an issue that should also be evaluated if the design of these systems is to be further developed.
The cellular dam and barrier concepts also incorporated 5 feet of freeboard with crest elevations of –225 and -242 feet MSL, respectively. A water level of –255 feet MSL was used on the downstream side of the dam. The reduction in cellular dam width for Sea levels lower than –230 feet MSL was assumed to be proportional to the height reduction.
The material properties used for cellular dam stability analyses were based on the results of laboratory testing from the preliminary geotechnical investigation, a review of available information, and engineering judgment. As discussed previously for the slope stability analyses, anisotropic strengths were used for the weak foundation materials. Table 3 presents a summary of the material properties used for the cellular dam stability analyses.
The connections between the cells/caissons will be a critical component of the structure. The arcs connecting the sheet pile cells are a conventional construction technique. However, the connection between the precast concrete caissons are unique and will require further study if this concept is to be developed further.
2.4 SETTLEMENT ANALYSES
Preliminary settlement analyses were performed to estimate the magnitude of consolidation settlements that could occur beneath the embankments. These preliminary settlement analyses only considered the primary consolidation settlements for the seafloor and soft lacustrine deposits. It is anticipated that most of the consolidation settlements will occur in these deposits due to the large increases in effective stress (relative to existing overburden pressures) and their high compressibilities. Excess pore pressures will be generated in these soils when the load of the embankment fill is placed. Settlements will occur as these pore pressures dissipate and the soils consolidate.
Settlement analyses were not performed for the cellular dam systems, as these systems are typically founded below the depth of soft soils encountered in the preliminary geotechnical investigation. Some settlement of the cellular dams may occur, but these settlements were not evaluated as part of this study. Further evaluation of the potential settlements of the cellular dam systems should be performed as part of further design development for these concepts.
The consolidation parameters developed during the preliminary geotechnical investigation were used to determine the magnitudes of consolidation settlement. The maximum settlement would occur beneath the
SECTIONTWO Preliminary Engineering Analyses
W:\27662033\00002-a-r.doc\21-Sep-04\SDG 2-5
crest of the embankment where the load is the greatest, and the minimum settlement would occur at the toe of the embankment where the load is the smallest. The average settlement across the bottom of the embankment was estimated to be approximately 60 to 65 percent of the settlement beneath the crest. Average settlements of 6% and 4% (of the remaining compressible materials) were estimated for the dam and barrier concepts, respectively. The settlement of the dam is larger due to the greater embankment height and corresponding load on the foundation soils.
The embankment designs could accommodate the post-construction settlements by initially overbuilding the embankment such that the freeboard is maintained when the consolidation settlements are complete, or by periodically raising the embankments as the settlements occur. The consolidation of foundation materials would increase the quantity of materials required to construct the embankments. An average settlement across the bottom of the embankment (modeled as a percentage of the remaining soft soils) was used to estimate the additional quantity of embankment materials.
2.5 SEEPAGE ANALYSES
Seepage analyses were performed for the embankment dam concepts using the two-dimensional computer program SEEP/W, Version 5.17 (Geo-Slope International Ltd., 2003a). Analyses were performed to evaluate the seepage quantities and to evaluate the potential for erosion and piping of the embankment materials. The seepage quantities and erosion and piping potential are influenced by the material permeability and embankment geometry.
Embankments with a crest width of 30 feet and slope inclinations of 6:1 and 10:1 (horizontal:vertical) were modeled with permeability values of either sand or rockfill. The analyses indicated high seepage quantities through the embankment for both the sand and rockfill embankments. However, it should be recognized that seepage through a rockfill embankment could be orders of magnitude greater than through a sand embankment. Seepage prevention measures such as a seepage blanket, cutoff, or lower-permeability core will be required for the embankments to prevent significant loss of water through the dam. However, the analyses did indicate low gradients (low seepage velocities) at the downstream toe of the embankment, where the potential for erosion and piping is highest. This was primarily due to the long seepage paths and low differential heads across the dam.
SECTIONTHREE Engineering Workshop
W:\27662033\00002-a-r.doc\21-Sep-04\SDG 3-1
SECTION 3 ENGINEERING WORKSHOP
A one-day workshop of 15 government and consulting engineers was convened on March 23, 2004 to review and revise the previous dam and barrier concepts in light of the results of the preliminary geotechnical investigation. In addition, new concepts were developed that recognized the site-specific geotechnical investigation and potential for high seismicity at the site. The workshop also provided a forum to obtain comments on the results of the preliminary geotechnical investigation from the group of engineers. Biographical sketches of each of the workshop attendees are presented in Appendix B.
Several design and construction issues were raised at the engineering workshop. The more significant issues included:
• Anisotropic strengths should be assumed for the weak foundation soils;
• Seismic deformations may control the slope inclinations given the proximity of large seismic sources;
• The Sea level may need to be lower than –230 feet MSL on the north side of the dam to allow for gravity flow from the New and Alamo Rivers;
• A risk based approach to design should be warranted given the scale of the facility and consequences of failure;
• Hydraulically placed fills should not be considered for embankments due to high liquefaction potential;
• Rockfills are desirable to mitigate the liquefaction potential of uncompacted embankments;
• A seepage cutoff would be required for rockfill dam and barrier embankments;
• Rockfill gradation requirements will need to consider method of transport and placement;
• Composite slope inclinations (e.g. steeper in the upper part of the embankment) should be considered in further design development;
• Staged placement of embankments will likely be required to allow strength gains in the foundation soils;
• Test fills should be used to refine embankment design during further design development;
• A simplified embankment section is desirable for underwater construction;
• Hydraulic dredging would be the most economical means for the overexcavation removals;
• Waves on the Sea make the use of floating conveyor systems questionable;
• The California Division of Safety of Dams (DSOD) Office will have major involvement in project reviews along with regulatory requirements;
• Cellular dams and barriers must be founded in a stable foundation;
• Dumped Fill Dam Concept was considered to have imported materials;
• Use of “Dump Barge” for transporting and placement of embankment materials in the Sea;
SECTIONTHREE Engineering Workshop
W:\27662033\00002-a-r.doc\21-Sep-04\SDG 3-2
• Deposition of excavated Seafloor materials needs to be done in acceptable waste sites, which may be an environmental issue.
The issues raised for a particular concept are outlined in Section 3 and Section 4 for the dam and barrier concepts, respectively.
SECTIONFOUR Dam Concepts
W:\27662033\00002-a-r.doc\21-Sep-04\SDG 4-1
SECTION 4 DAM CONCEPTS
Three concepts had previously been proposed for the mid-Sea dam. These were 1) a Seismic Dike, 2) a Steel Sheet Pile Cellular Dam with Compacted Earth Dam, and 3) a Dumped Fill Dike with Slurry Wall (BOR, 2003a). Revisions (or elimination) of these concepts were made and new concepts were developed based on input from the engineering workshop.
4.1 SEISMIC DIKE (REVISED)
This concept consists of an embankment built “in the dry” with the embankment materials compacted to withstand earthquake loading. A conventional zoned embankment dam consisting of compacted sand and gravel shells with a compacted silt/clay core and filter would be constructed. Dewatering an area within parallel sets of temporary cofferdams would provide the dry conditions. The embankment would be built in segments to allow reusing the cofferdam materials. This concept is shown in Figure 4.
The roller-compacted concrete (RCC) or soil-cement mat was eliminated from the seismic dike concept at the engineering workshop because the workshop participants felt that conventional overexcavation and replacement with compacted earthfill would provide a suitable base for the embankment. The earthfill would be a less costly alternative than the RCC.
The foundation soils were modeled with anisotropic strengths. The conceptual design includes inclinations of 5:1 (horizontal:vertical) on the upstream slope and 7:1 on the downstream slope. The crest of the dam would be 30 feet wide (to allow for two-way traffic) and provide for 5 feet of freeboard above the Sea level. An overexcavation depth of 10 feet was used beneath the embankment crest, and an overexcavation depth of 25 feet was used beneath the embankment toes. An additional embankment volume was calculated based on an average settlement of 6% of the unexcavated soft soils over the entire width of the embankment.
An advantage of the seismic dike concept is that the dry construction method allows compaction of the embankment materials and would be more stable during a seismic event. However, extensive cofferdams are required for the temporary dewatering, and staging of the construction would be complex. For example, the construction segments that will be required to complete the 8-½-mile-long dam, if 2,500-foot-long construction segments are considered, are 18 separate segments.
4.2 DSM CELLULAR DAM (REVISED)
The previous cellular dam concept incorporated a compacted embankment on the downstream side of a sheet pile cellular dam. The embankment was incorporated because the steel sheet piles would eventually corrode, which could impair the structural integrity of the cellular dam. The revised concept eliminates the embankment and instead solidifies the earthfill and foundation soils within the cellular dam using Deep Soil Mixing (DSM). DSM consists of solidifying materials by mixing cement into the soils with large augers. Once the steel corrodes, the cellular dam would maintain its integrity with the solidified materials. No overexcavation would be required for this concept. The cellular dam will be founded such that it provides a stable configuration.
SECTIONFOUR Dam Concepts
W:\27662033\00002-a-r.doc\21-Sep-04\SDG 4-2
It is anticipated that this concept would be constructed in a linear fashion from the shoreline. Floating equipment would be used to drive the sheet piles to form the cells and connecting arcs. Land based or floating equipment could be used to place fill in the cells and arcs. Equipment operating from the surface of the filled cells would perform the DSM.
Anisotropic strengths were used for the foundation material in the analyses. The conceptual design of cellular dam consists of cells 70 feet in diameter and 88 feet high, for a Sea level of –230 feet MSL. The width/height ratio was kept the same for lower Sea levels. This concept is shown in Figure 5.
An advantage of the DSM cellular dam system is that no overexcavation of soft soils would be required and the DSM soils would be seismic resistant. However, the DSM would be costly.
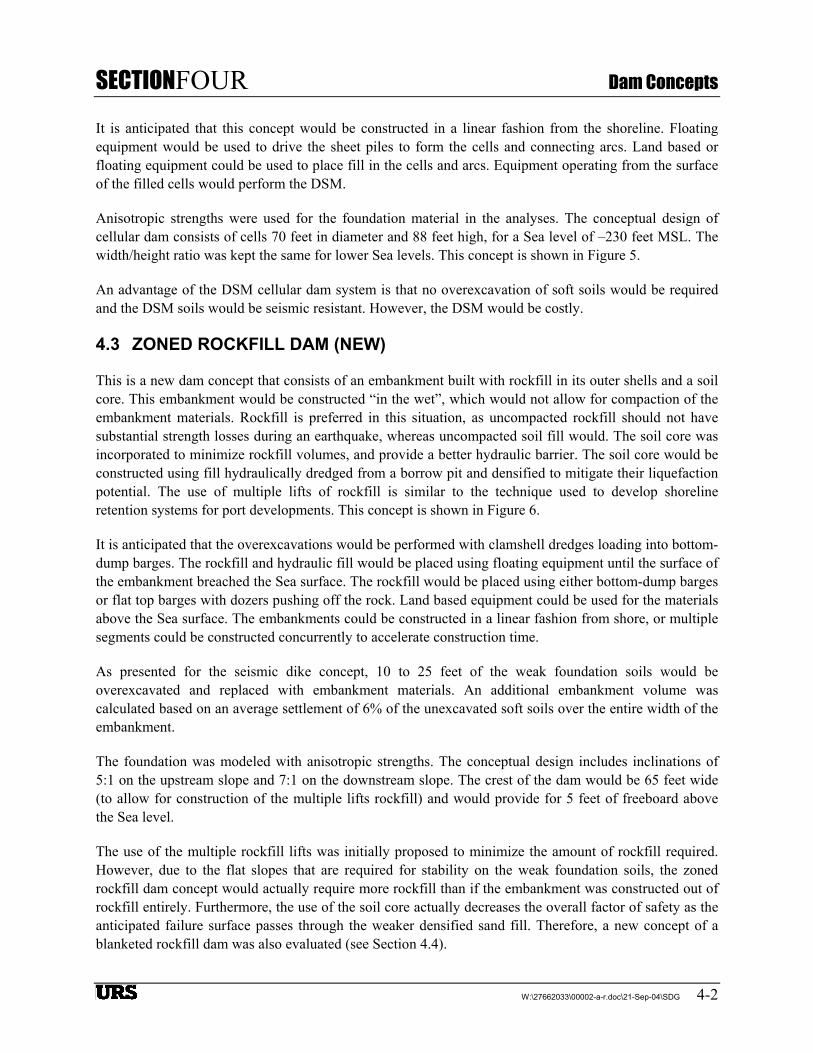
4.3 ZONED ROCKFILL DAM (NEW)
This is a new dam concept that consists of an embankment built with rockfill in its outer shells and a soil core. This embankment would be constructed “in the wet”, which would not allow for compaction of the embankment materials. Rockfill is preferred in this situation, as uncompacted rockfill should not have substantial strength losses during an earthquake, whereas uncompacted soil fill would. The soil core was incorporated to minimize rockfill volumes, and provide a better hydraulic barrier. The soil core would be constructed using fill hydraulically dredged from a borrow pit and densified to mitigate their liquefaction potential. The use of multiple lifts of rockfill is similar to the technique used to develop shoreline retention systems for port developments. This concept is shown in Figure 6.
It is anticipated that the overexcavations would be performed with clamshell dredges loading into bottom-dump barges. The rockfill and hydraulic fill would be placed using floating equipment until the surface of the embankment breached the Sea surface. The rockfill would be placed using either bottom-dump barges or flat top barges with dozers pushing off the rock. Land based equipment could be used for the materials above the Sea surface. The embankments could be constructed in a linear fashion from shore, or multiple segments could be constructed concurrently to accelerate construction time.
As presented for the seismic dike concept, 10 to 25 feet of the weak foundation soils would be overexcavated and replaced with embankment materials. An additional embankment volume was calculated based on an average settlement of 6% of the unexcavated soft soils over the entire width of the embankment.
The foundation was modeled with anisotropic strengths. The conceptual design includes inclinations of 5:1 on the upstream slope and 7:1 on the downstream slope. The crest of the dam would be 65 feet wide (to allow for construction of the multiple lifts rockfill) and would provide for 5 feet of freeboard above the Sea level.
The use of the multiple rockfill lifts was initially proposed to minimize the amount of rockfill required. However, due to the flat slopes that are required for stability on the weak foundation soils, the zoned rockfill dam concept would actually require more rockfill than if the embankment was constructed out of rockfill entirely. Furthermore, the use of the soil core actually decreases the overall factor of safety as the anticipated failure surface passes through the weaker densified sand fill. Therefore, a new concept of a blanketed rockfill dam was also evaluated (see Section 4.4).
SECTIONFOUR Dam Concepts
W:\27662033\00002-a-r.doc\21-Sep-04\SDG 4-3
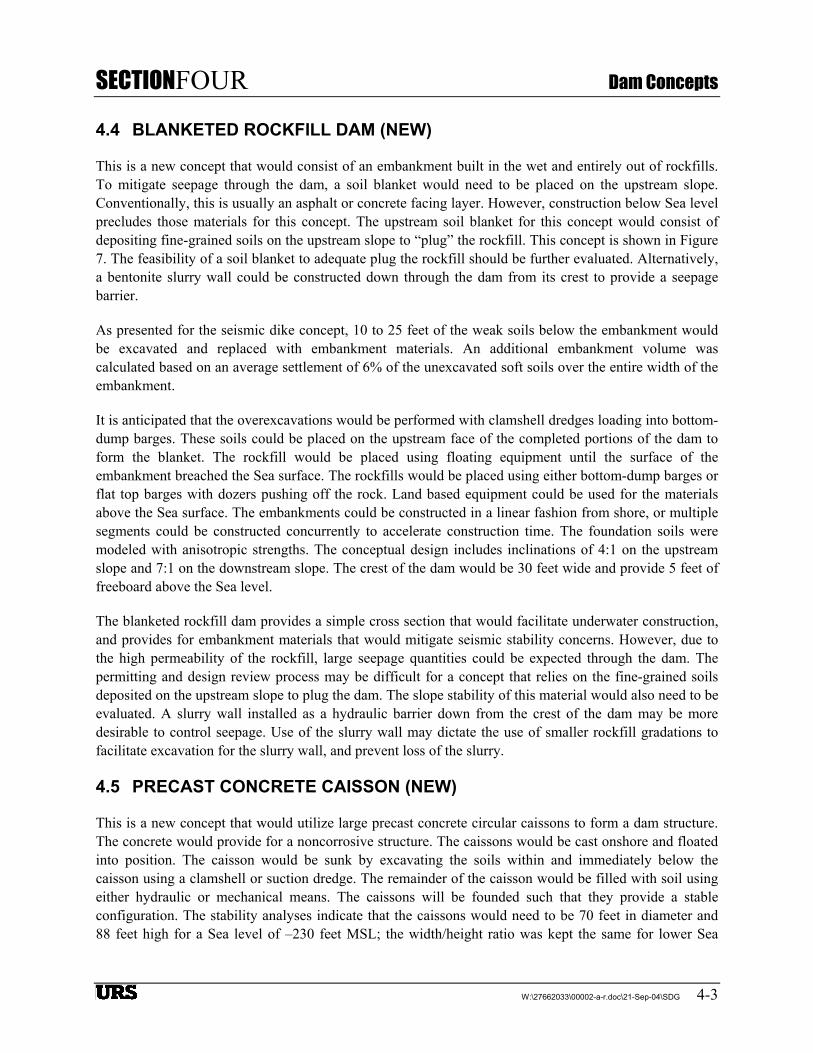
4.4 BLANKETED ROCKFILL DAM (NEW)
This is a new concept that would consist of an embankment built in the wet and entirely out of rockfills. To mitigate seepage through the dam, a soil blanket would need to be placed on the upstream slope. Conventionally, this is usually an asphalt or concrete facing layer. However, construction below Sea level precludes those materials for this concept. The upstream soil blanket for this concept would consist of depositing fine-grained soils on the upstream slope to “plug” the rockfill. This concept is shown in Figure 7. The feasibility of a soil blanket to adequate plug the rockfill should be further evaluated. Alternatively, a bentonite slurry wall could be constructed down through the dam from its crest to provide a seepage barrier.
As presented for the seismic dike concept, 10 to 25 feet of the weak soils below the embankment would be excavated and replaced with embankment materials. An additional embankment volume was calculated based on an average settlement of 6% of the unexcavated soft soils over the entire width of the embankment.
It is anticipated that the overexcavations would be performed with clamshell dredges loading into bottom-dump barges. These soils could be placed on the upstream face of the completed portions of the dam to form the blanket. The rockfill would be placed using floating equipment until the surface of the embankment breached the Sea surface. The rockfills would be placed using either bottom-dump barges or flat top barges with dozers pushing off the rock. Land based equipment could be used for the materials above the Sea surface. The embankments could be constructed in a linear fashion from shore, or multiple segments could be constructed concurrently to accelerate construction time. The foundation soils were modeled with anisotropic strengths. The conceptual design includes inclinations of 4:1 on the upstream slope and 7:1 on the downstream slope. The crest of the dam would be 30 feet wide and provide 5 feet of freeboard above the Sea level.
The blanketed rockfill dam provides a simple cross section that would facilitate underwater construction, and provides for embankment materials that would mitigate seismic stability concerns. However, due to the high permeability of the rockfill, large seepage quantities could be expected through the dam. The permitting and design review process may be difficult for a concept that relies on the fine-grained soils deposited on the upstream slope to plug the dam. The slope stability of this material would also need to be evaluated. A slurry wall installed as a hydraulic barrier down from the crest of the dam may be more desirable to control seepage. Use of the slurry wall may dictate the use of smaller rockfill gradations to facilitate excavation for the slurry wall, and prevent loss of the slurry.
4.5 PRECAST CONCRETE CAISSON (NEW)
This is a new concept that would utilize large precast concrete circular caissons to form a dam structure. The concrete would provide for a noncorrosive structure. The caissons would be cast onshore and floated into position. The caisson would be sunk by excavating the soils within and immediately below the caisson using a clamshell or suction dredge. The remainder of the caisson would be filled with soil using either hydraulic or mechanical means. The caissons will be founded such that they provide a stable configuration. The stability analyses indicate that the caissons would need to be 70 feet in diameter and 88 feet high for a Sea level of –230 feet MSL; the width/height ratio was kept the same for lower Sea
SECTIONFOUR Dam Concepts
W:\27662033\00002-a-r.doc\21-Sep-04\SDG 4-4
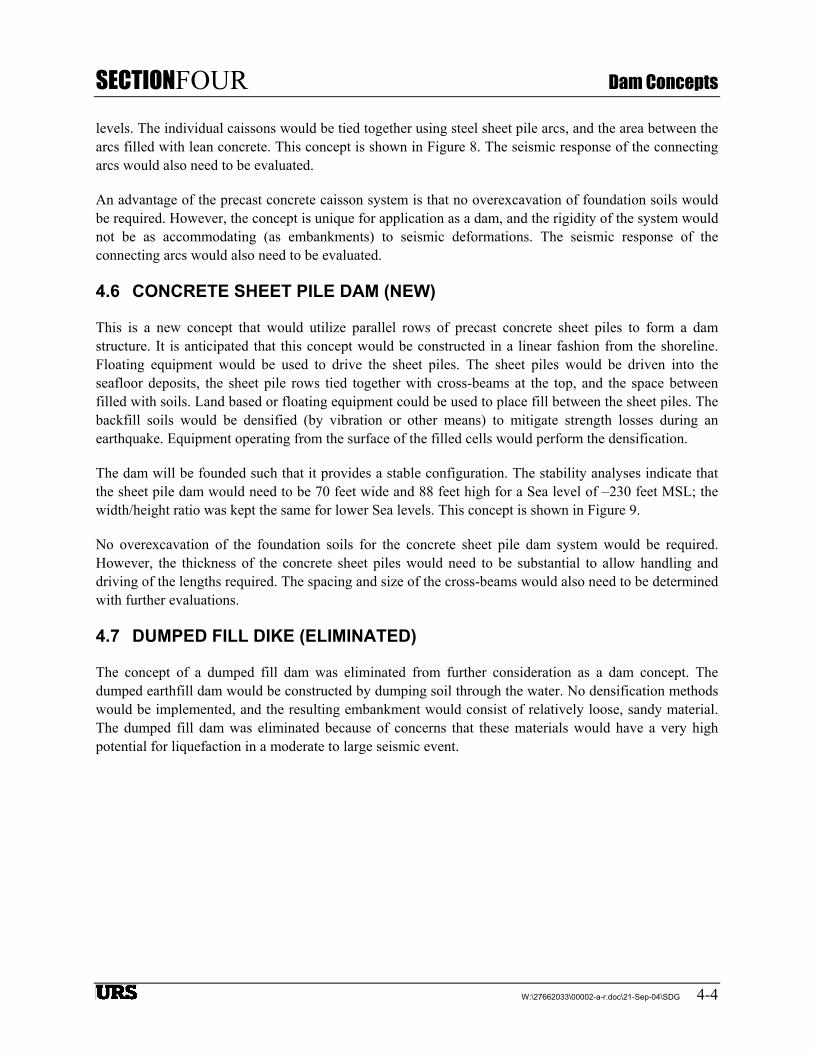
levels. The individual caissons would be tied together using steel sheet pile arcs, and the area between the arcs filled with lean concrete. This concept is shown in Figure 8. The seismic response of the connecting arcs would also need to be evaluated.
An advantage of the precast concrete caisson system is that no overexcavation of foundation soils would be required. However, the concept is unique for application as a dam, and the rigidity of the system would not be as accommodating (as embankments) to seismic deformations. The seismic response of the connecting arcs would also need to be evaluated.
4.6 CONCRETE SHEET PILE DAM (NEW)
This is a new concept that would utilize parallel rows of precast concrete sheet piles to form a dam structure. It is anticipated that this concept would be constructed in a linear fashion from the shoreline. Floating equipment would be used to drive the sheet piles. The sheet piles would be driven into the seafloor deposits, the sheet pile rows tied together with cross-beams at the top, and the space between filled with soils. Land based or floating equipment could be used to place fill between the sheet piles. The backfill soils would be densified (by vibration or other means) to mitigate strength losses during an earthquake. Equipment operating from the surface of the filled cells would perform the densification.
The dam will be founded such that it provides a stable configuration. The stability analyses indicate that the sheet pile dam would need to be 70 feet wide and 88 feet high for a Sea level of –230 feet MSL; the width/height ratio was kept the same for lower Sea levels. This concept is shown in Figure 9.
No overexcavation of the foundation soils for the concrete sheet pile dam system would be required. However, the thickness of the concrete sheet piles would need to be substantial to allow handling and driving of the lengths required. The spacing and size of the cross-beams would also need to be determined with further evaluations.
4.7 DUMPED FILL DIKE (ELIMINATED)
The concept of a dumped fill dam was eliminated from further consideration as a dam concept. The dumped earthfill dam would be constructed by dumping soil through the water. No densification methods would be implemented, and the resulting embankment would consist of relatively loose, sandy material. The dumped fill dam was eliminated because of concerns that these materials would have a very high potential for liquefaction in a moderate to large seismic event.
SECTIONFIVE Barrier Concepts
W:\27662033\00002-a-r.doc\21-Sep-04\SDG 5-1
SECTION 5 BARRIER CONCEPTS
Three concepts had previously been proposed for the mid-Sea barrier. These were 1) a Dumped Fill Barrier, 2) a Rockfill Dike with Dredged Fill Barrier, and 3) a Beach Barrier (BOR, 2003c). Revisions (or elimination) of these concepts were made for a Sea level at –247 feet MSL and new concepts were developed based on input from the engineering workshop.
It is anticipated that the barriers would be constructed after the Sea level has dropped. However, concepts utilizing embankments only might be constructed earlier than those using marine construction techniques only. Culverts would be installed through the barriers to assure equalization of water levels on either side of the barrier. It is anticipated that fresh water would be flowing out of the culverts such that mixing of the different salinity waters would not occur. With the Sea level drawn down to elevation –247 feet MSL, the barriers are anticipated to be 41,700 feet long (about 8 miles).
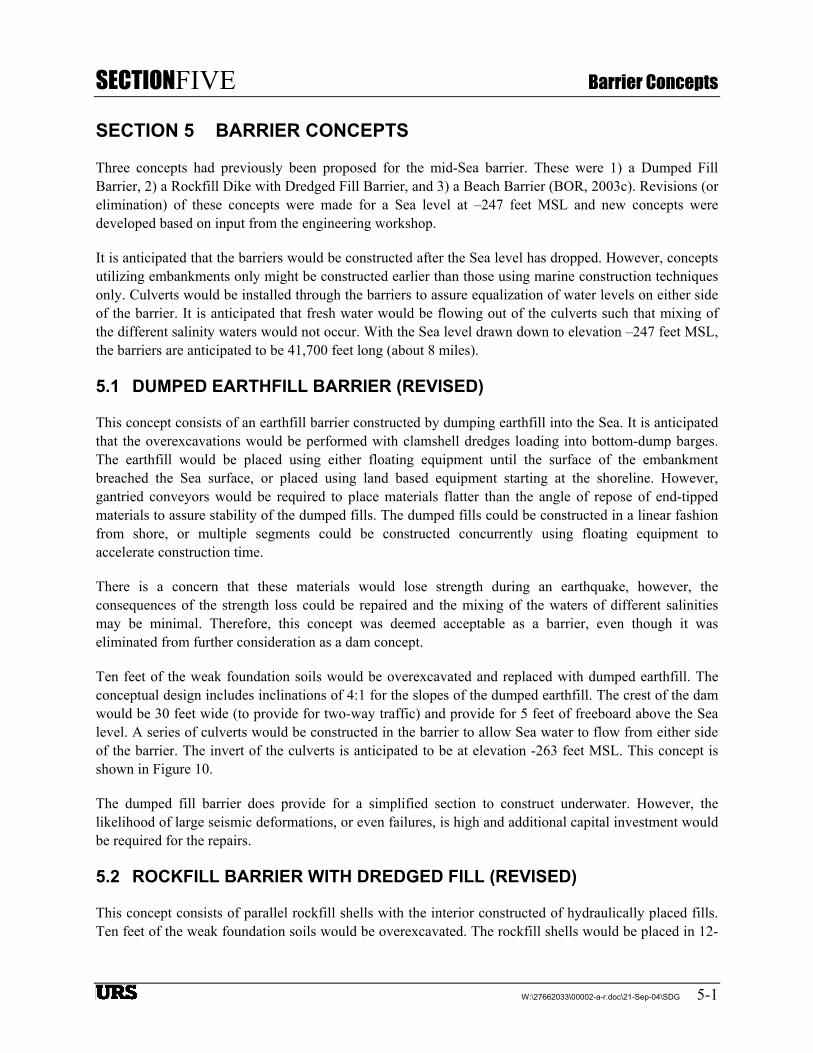
5.1 DUMPED EARTHFILL BARRIER (REVISED)
This concept consists of an earthfill barrier constructed by dumping earthfill into the Sea. It is anticipated that the overexcavations would be performed with clamshell dredges loading into bottom-dump barges. The earthfill would be placed using either floating equipment until the surface of the embankment breached the Sea surface, or placed using land based equipment starting at the shoreline. However, gantried conveyors would be required to place materials flatter than the angle of repose of end-tipped materials to assure stability of the dumped fills. The dumped fills could be constructed in a linear fashion from shore, or multiple segments could be constructed concurrently using floating equipment to accelerate construction time.
There is a concern that these materials would lose strength during an earthquake, however, the consequences of the strength loss could be repaired and the mixing of the waters of different salinities may be minimal. Therefore, this concept was deemed acceptable as a barrier, even though it was eliminated from further consideration as a dam concept.
Ten feet of the weak foundation soils would be overexcavated and replaced with dumped earthfill. The conceptual design includes inclinations of 4:1 for the slopes of the dumped earthfill. The crest of the dam would be 30 feet wide (to provide for two-way traffic) and provide for 5 feet of freeboard above the Sea level. A series of culverts would be constructed in the barrier to allow Sea water to flow from either side of the barrier. The invert of the culverts is anticipated to be at elevation -263 feet MSL. This concept is shown in Figure 10.
The dumped fill barrier does provide for a simplified section to construct underwater. However, the likelihood of large seismic deformations, or even failures, is high and additional capital investment would be required for the repairs.
5.2 ROCKFILL BARRIER WITH DREDGED FILL (REVISED)
This concept consists of parallel rockfill shells with the interior constructed of hydraulically placed fills. Ten feet of the weak foundation soils would be overexcavated. The rockfill shells would be placed in 12-
SECTIONFIVE Barrier Concepts
W:\27662033\00002-a-r.doc\21-Sep-04\SDG 5-2
to 15-foot-thick lifts starting with the initial backfilling of the overexcavations. It is anticipated that the overexcavations would be performed with clamshell dredges loading into bottom-dump barges. The rockfill and hydraulic fills would be placed using floating equipment until the surface of the embankment breached the Sea surface. The rockfills would be placed using either bottom-dump barges or flat top barges with dozers pushing off the rock. Land based equipment could be used for the materials above the Sea surface. The embankments could be constructed in a linear fashion from shore, or multiple segments could be constructed concurrently to accelerate construction time.
The conceptual design includes inclinations of 4:1 on the embankment slopes. The crest of the barrier would be 65 feet wide (to facilitate construction of the multiple lift rockfill shells) and would provide for 5 feet of freeboard above the Sea level. Culverts would also be incorporated into the embankment to allow Sea water to flow from either side of the barrier. This concept is shown in Figure 11.
The rockfill barrier would provide for a more seismically resistant embankment. However, it is a complicated section to build underwater, and there is still a high potential for the interior, hydraulically placed, fill to liquefy during a moderate to large seismic event. Therefore, the likelihood of large seismic deformations, or even failures, is moderate and additional capital investment would be required for the repairs.
5.3 DSM CELLULAR BARRIER (NEW)
This concept would use steel sheet pile cellular barrier with the enclosed soils solidified by Deep Soil Mixing (DSM), as conceived for the mid-Sea dam. Once the steel corrodes, the cellular barrier would maintain its integrity with the solidified materials. The cellular barrier will be founded such that it provides a stable configuration. The stability analyses indicate that the cellular barrier should consist of cells 50 feet in diameter and 68 feet high. The crest of the cellular barrier would provide for 5 feet of freeboard above the Sea level. This concept is shown in Figure 12.
It is anticipated that this concept would be constructed in a linear fashion from the shoreline. Floating equipment would be used to drive the sheet piles to form the cells and connecting arcs. Land based or floating equipment could be used to place fill in the cells and arcs. Equipment operating from the surface of the filled cells would perform the DSM.
An advantage of the DSM cellular barrier system is that no overexcavation of soft soils would be required and the DSM soils would be seismic resistant. However, the DSM would be costly.
5.4 PRECAST CONCRETE CAISSON (NEW)
This is a new concept that would utilize large precast concrete circular caissons to form a barrier structure, as conceived for the mid-Sea dam. The soils within the caissons would be excavated using a clamshell or suction dredge. The remainder of the caisson would be filled with soil using either hydraulic or mechanical means. The caissons will be founded such that they provide a stable configuration. The stability analyses indicate that the caissons should be 50 feet in diameter and 68 feet high. The individual caissons would be tied together using steel sheet pile arcs, and the area between the arcs filled with lean concrete. The crest of the caissons would provide for 5 feet of freeboard above the Sea level. This concept is shown in Figure 13.
SECTIONFIVE Barrier Concepts
W:\27662033\00002-a-r.doc\21-Sep-04\SDG 5-3
An advantage of the precast concrete caisson system is that no overexcavation of foundation soils would be required. However, the connections of the caissons would be complicated, and the rigidity of the system would not be as accommodating (as embankments) to seismic deformations. The seismic performance of the connections would also need to be evaluated.
5.5 CONCRETE SHEET PILE BARRIER (NEW)
This is a new concept that would utilize parallel rows of precast concrete sheet piles to form a barrier structure, as also conceived for the mid-Sea dam. It is anticipated that this concept would be constructed in a linear fashion from the shoreline. Floating equipment would be used to drive the sheet piles. The sheet piles would be driven into the seafloor deposits, the sheet pile rows tied together with cross-beams at the top, and the space between filled with soils. Land based or floating equipment could be used to place fill between the sheet piles. The backfill soils would be densified (by vibration or other means) to mitigate strength losses during an earthquake. Equipment operating from the surface of the filled cells would perform the densification.
The barrier will be founded such that it provides a stable configuration. The stability analyses indicate that the sheet pile barrier should be 50 feet wide and 68 feet high. The crest of the barrier would provide for 5 feet of freeboard above the Sea level. This concept is shown in Figure 14.
No overexcavation of the foundation soils for the concrete sheet pile barrier system would be required. However, substantial ground improvement would need to be undertaken to densify/strengthen the soils within the barrier.
5.6 BEACH BARRIER (ELIMINATED)
The beach barrier concept was eliminated from further consideration as a barrier. The beach barrier would be constructed by using hydraulically placed fills. No ground improvement methods would be implemented, and the resulting embankment would consist of a very flat embankment containing relatively loose, sandy materials. The beach barrier was eliminated because of concerns that these materials would have a very high potential for liquefaction in a moderate to large seismic event.
SECTIONSIX Appraisal Level Cost Estimates
W:\27662033\00002-a-r.doc\21-Sep-04\SDG 6-1
SECTION 6 APPRAISAL LEVEL COST ESTIMATES
Appraisal level costs were estimated for each of the dam and barrier concepts. These estimates were made by first estimating the quantities of materials that would be required for each of the concepts. Unit prices for those materials were then applied to develop a construction cost estimate. A total cost was estimated by applying markups for mobilization, unlisted items, contingencies, and non-contract costs to the estimated construction cost developed for each concept. The “total” cost is only for the dam or barrier concept; it does not include conveyance/canal costs, wetland creation, dust mitigation, or other components that may be required as part of the overall scheme at the Sea.
The appraisal estimates included in this report are to be used for the purposes of determining whether more detailed investigations of a potential concept are economically justified. The estimated costs are not to be used as a basis for requesting authorization or construction fund appropriations.
6.1 QUANTITY ESTIMATES
To facilitate development of the appraisal level costs, material quantities were estimated for each of the concepts. The quantities were estimated by multiplying the quantities in typical sections by the total length of the structure. The unit quantities were based on the typical cross-sectional geometry at three seafloor elevations; -270, -260, and -245 feet MSL, for respective concepts as shown in Figures 4 through 14. The length of embankment for the selected seafloor elevations was determined from bathymetry information provided by the BOR. A total length of 45,600 feet (8.6 miles) was used for the dam concepts with a Sea level of –230 feet MSL; with lengths of 26,000, 7,500, and 12,100 feet for seafloor elevations of -270, -260, and -245 feet MSL, respectively. Shorter lengths were used for the length of seafloor at –245 feet MSL for the dam concepts that had Sea levels of –235 and –240 feet MSL. A total length of 41,700 feet (7.9 miles) was used for the barrier concept with the Sea level at –247 feet MSL, with lengths of 26,000, 7,500, and 8,200 feet for seafloor elevations of -270, -260, and -245 feet MSL, respectively.
The embankment quantity estimates incorporated additional volume to account for the settlement of the soft foundation soils. A unit quantity was estimated by multiplying the average compression of the compressible foundation soils remaining by the width of the embankment bottom. As with other unit quantities, this additional unit volume was multiplied by the length of the structure to obtain the total volume.
6.2 UNIT PRICES
Unit prices for each of the construction components were estimated by evaluating the material, equipment and labor costs, or precedence with recent bids on similar projects. The unit price for each component considered the costs for material development and processing, transport, and placement. These unit prices were applied to the estimated quantities to obtain an estimated construction cost for each of the concepts.
An evaluation was also performed as to whether transporting stockpiles of rockfill material available at Eagle Mountain and Mesquite mines would be more economical than developing a new quarry on Torres-Martinez property for rockfill. A comparison of unit costs for these sources of rockfill is presented in
SECTIONSIX Appraisal Level Cost Estimates
W:\27662033\00002-a-r.doc\21-Sep-04\SDG 6-2
Table 4. This evaluation indicated that developing a new quarry within 15 miles of the mid-Sea location would be more cost-effective than transporting rockfill from the mine stockpiles, which are located approximately 40 to 50 miles from the mid-Sea location. It has been assumed that suitable rock would be available from the knob of mountainous land that Torres-Martinez owns and projects very near Desert Shores. The quality and availability of this material will need to be confirmed in further studies. It was assumed that the rockfill would be trucked for three miles to the Sea, and then barged 12 miles to the mid-Sea location. A unit price of $7.02 per cubic yard was developed for the rockfill. This compares favorably with the $3 to $4 per cubic yard cost for rockfill that was developed (1997 was the middle year of construction) within a couple of miles of the dams constructed for the Diamond Valley Reservoir project in Hemet, California.
Unit prices and their basis developed for the dam concepts are presented in Table 5 and in Table 6 for the barrier concepts. These should be updated at various stages of the program development to account for differing labor, fuel, equipment, and material costs.
6.3 ESTIMATED TOTAL COSTS
Percentages of the construction costs were added to estimate total costs. Mobilization/demobilization costs were estimated as 5% of the construction costs and unlisted items were estimated as 10%. The cost for unlisted items is to account for ancillary features of the dams and barriers (e.g. spillways, flow controllers, etc.) that are not detailed or quantified at the conceptual design level. These costs were added to the construction cost to obtain a contract cost.
A contingency of 25% of the contract cost was added to obtain a field cost. The contingency would account for items that may cost more once the design is further developed, or when construction is complete (e.g. changed conditions costs). Noncontract costs amounting to 30% of the field cost was added to obtain a total cost. The noncontract costs would include permitting, engineering, construction management, owner’s administration, legal and other costs.
Revisions had been made to these other costs based on input at the latest workshop. The cost for unlisted items was reduced from 15% and the noncontract costs were reduced from 33%. Additionally, the costs for mobilization and unlisted items were modified so that their costs were additive rather than compounded to arrive at the appraisal level total cost.
A net present value (NPV) for the concepts were developed by assuming annual maintenance costs equal to 1% of the total costs, over a 30-year period.
A summary of the features, quantities, and costs of the mid-Sea dam concepts with the Sea level at -230, -235, and -240 feet MSL is included in Tables 7, 8, and 9. A plot of NPVs versus Sea elevation is presented in Figure 15. A summary of the features, quantities, and costs of the mid-Sea barrier concepts with the Sea level at –247 feet MSL is included in Table 10. Detailed cost estimates are presented in Appendix C and Appendix D for the dam and barrier concepts, respectively.
SECTIONSEVEN Conclusions
W:\27662033\00002-a-r.doc\21-Sep-04\SDG 7-1
SECTION 7 CONCLUSIONS
A number of significant conclusions can be drawn from the additional studies that have been undertaken. These are further discussed in this section.
7.1 TECHNICAL FEASIBILITY
The concepts developed for the mid-Sea dam and barrier, supported by the preliminary geotechnical investigation and further engineering analyses, have demonstrated that a dam or barrier constructed at a mid-Sea location should be feasible from technical and construction perspectives. A number of challenges will need to be addressed for design and construction of the concepts, yet it was the consensus of the engineering workshop that the developed concepts were technically feasible. The weak foundation soils are similar to those that other embankments have been constructed, and means and methods are available that should mitigate the seismic vulnerability of the concepts.
7.2 DESIGN AND CONSTRUCTION ISSUES
The mid-Sea dam and barrier concepts do pose significant design and construction challenges; including the scale of the facilities, construction below Sea levels, weak foundation soils, permitting of the project, and the presence of significant seismic sources adjacent to the Sea.
It appears that the concepts that address these challenges most effectively are those utilizing a rockfill embankment. Such concepts use a readily available construction material (rockfill) and a relatively simple construction processes (dumped fill) to construct an embankment where precedent has shown that acceptable engineering performance during an earthquake can be obtained (if properly designed and constructed). The primary disadvantage is the potential for excessive seepage through the rockfill embankment. However, the hydraulic and environmental requirements of the Salton Sea could allow for greater seepage quantities than typically used for the design of conventional dams. Future design efforts will need to assess the ability of dredged material to create a “plug” within the dam (blanketed rockfill concept) relative to the potential need for processing the rockfill to facilitate developing a plug or constructing a slurry wall.
Other significant design and construction issues are listed in Section 3 of this report.
7.3 MATERIAL SOURCES
An assessment of material sources was conducted for the rockfill embankments, as the embankment materials are the largest cost component of the concept. Three potential material sources were evaluated; Eagle Mountain Mine near Desert Center, Mesquite Mine near Glamis, and the Torres Martinez property west of Salton City. The assessment indicates that developing a new Torres-Martinez quarry within 10 miles of the Sea is more cost effective than transporting materials from the Eagle Mountain or Mesquite mines. The cost of transporting the materials from the more distant sources is more than three times as costly as developing a new quarry close to the Sea.
One objective of the preliminary geotechnical investigation was to evaluate the potential for borrowing materials from within the Sea to construct embankments. These materials could be economically dredged
SECTIONSEVEN Conclusions
W:\27662033\00002-a-r.doc\21-Sep-04\SDG 7-2
and transported using marine dredging methods. The majority of the seafloor materials encountered in the preliminary geotechnical investigation consisted of fine-grained soils (silts and clays). Some sandy alluvial deposits were encountered near the seafloor in some of the explorations near the existing shoreline. It appears that the most promising areas for sand borrow source would be along the west side of the Sea, or near the mouth of Salt Creek. However, most of the concepts currently being considered utilize rockfill rather than granular (sandy) fills.
7.4 ESTIMATED TOTAL COSTS
The NPV of the appraisal level total costs for the mid-Sea dam with the Sea level at –235 feet MSL range from about $500 million (for the Blanketed Rockfill Dam concept) to about $1.8 billion (for the Seismic Dike concept). The cost differential for each 5 foot drop in the Sea level is about $100 to $200 million.
There is a significant concern on the effectiveness of the blanketed rockfill dam to mitigate seepage through the dam. Table 11 provides cost estimates for the rockfill dam concept with a slurry wall along the crest to mitigate seepage. This indicates that the NPV of the appraisal level total cost for this modified concept would be approximately $560 million with the Sea level at –235 feet MSL.
The NPV of the appraisal level total costs for the mid-Sea barrier range from $131 million (for the Dumped Fill Barrier concept) to $1.1 billion (for the DSM Cellular Barrier concept).
7.5 FURTHER STUDIES
This study has been conceptual in nature and additional studies will need to be performed as the concepts are further developed. This section provides a discussion of studies that have currently been identified that should be performed as the development of the concepts proceeds.
7.5.1 Fault Locations
The San Andreas Fault is mapped 1.8 miles east of the east end of the mid-Sea location. This fault is projected to enter the Sea just east of Bombay Beach. The Imperial and Brawley faults are mapped at the southern end of the Sea. The locations of these onshore faults could all be projected into the Sea. Historical seismicity data also implies that faults do underlie the Sea, although their surface projection is unknown. These data do not preclude the possibility that an active fault could cross proposed embankment locations. This potential fault rupture hazard should be further evaluated to assess the possible presence and activity of the faults.
7.5.2 Additional Geotechnical Investigations
As the concepts are further developed, additional geotechnical explorations will be warranted. It should be recognized that the explorations completed for the preliminary geotechnical investigation are miles apart. Variations in subbottom conditions could occur between the existing exploration locations. As specific locations are identified for the alternatives, the subbottom conditions will need to be further characterized in those areas. The subsurface conditions encountered in these investigations could significantly influence the type of the alternative and its location. The preliminary geotechnical investigation used drilled and sampled borings combined with CPTs. This provided an excellent
SECTIONSEVEN Conclusions
W:\27662033\00002-a-r.doc\21-Sep-04\SDG 7-3
combination of material characterization of the boring samples with the nearly continuous lithology obtained from the CPTs. In addition, consideration should be given to in-situ testing of strengths and compressibilities, such as vane shear testing and pressuremeter testing. Marine geophysical surveys could also provide information on the continuity of the subbottom stratigraphy, and the possible presence of faulting.
A substantial amount of embankment fill will need to be borrowed from upland areas. A reconnaissance level study should be undertaken to identify potential borrow areas in the vicinity of the Sea. The need will be to identify potential sources of primarily rockfill. Subsurface explorations should then be performed in the areas identified to confirm the quality of the potential borrow materials. The quality of that rock for rockfill and riprap should also be evaluated.
7.5.3 Dynamic Response of Embankments
The side slope inclinations of the embankments for the conceptual mid-Sea dam and barriers were based on static slope stability analyses. However, the proposed embankments are probably in an area with the highest potential seismicity in California. Furthermore, very few large earthen structures have been designed and constructed in the area. It is recommended that preliminary dynamic response and deformation analyses of the proposed embankment configurations be performed to validate the conceptual designs of embankments developed for the alternatives.
SECTIONEIGHT References
W:\27662033\00002-a-r.doc\21-Sep-04\SDG 8-1
SECTION 8 REFERENCES
BOR, 2003a. Salton Sea Workshop Assigned Action Item – Appraisal Grade Cost Estimates for Salton-Sea Mid-Sea Impervious Dam and Impervious Perimeter Dike, Memorandum prepared by Leo Handfelt (URS), Michael J. Clinton (Michael Clinton Engineering), and Jack Delp (Reclamation Consultant), dated January 22, 2003.
BOR, 2003b. Salton Sea Study, Status Report, prepared by Bureau of Reclamation, Lower Colorado Region, dated January 28, 2003.
BOR, 2003c. Salton Sea Barrier Design Workshop – La Quinta, California, Memorandum prepared by Leo Handfelt (URS), William Brownlie (Tetra Tech), and Jack Delp (Reclamation Consultant), dated July 23, 2003.
Casagrande, A. 1960. An Unsolved Problem of Embankment Stability on Soft Ground, in Proceedings of the First Panamerican Conference on Soil Mechanics and Foundation Engineering, September 7-12, 1959, Volume 2.
Geo-Slope International, Ltd., 2003a. SEEP/W, a computer program for Seepage Analyses, Version 5.17.
Geo-Slope International, Ltd., 2003b. SLOPE/W, a computer program for Slope Stability Analyses, Version 5.17.
Ladd, Charles C. 1991. Stability Evaluation During Staged Construction, in ASCE Journal of Geotechnical Engineering, Vol. 117, No. 4, April 1991, pp. 540-615.
URS, 2004. Preliminary In-Sea Geotechnical Investigation, Salton Sea Restoration Project, Imperial and Riverside Counties, California, dated February 27, 2004.

Tables
W:\27662033\00002-a-r.doc\21-Sep-04\SDG
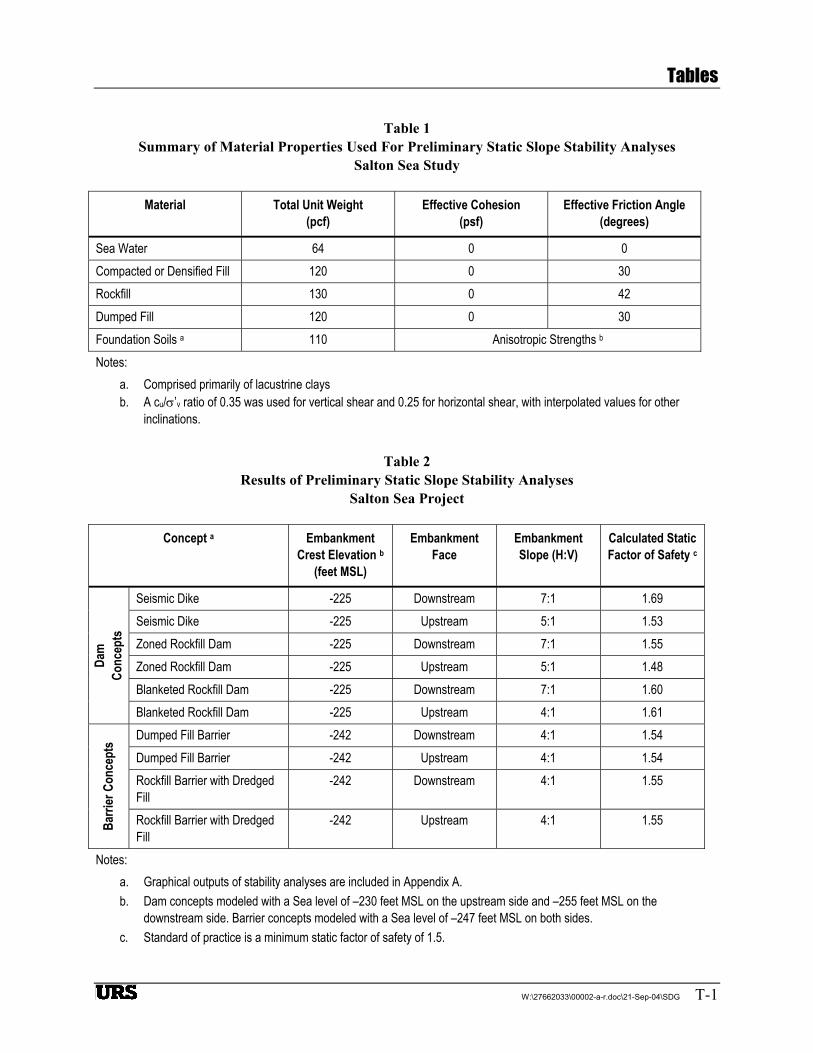
Tables
W:\27662033\00002-a-r.doc\21-Sep-04\SDG T-1
Table 1 Summary of Material Properties Used For Preliminary Static Slope Stability Analyses
Salton Sea Study
Material Total Unit Weight (pcf)
Effective Cohesion (psf)
Effective Friction Angle (degrees)
Sea Water 64 0 0 Compacted or Densified Fill 120 0 30 Rockfill 130 0 42 Dumped Fill 120 0 30 Foundation Soils a 110 Anisotropic Strengths b Notes:
a. Comprised primarily of lacustrine clays b. A cu/σ’v ratio of 0.35 was used for vertical shear and 0.25 for horizontal shear, with interpolated values for other
inclinations.
Table 2 Results of Preliminary Static Slope Stability Analyses
Salton Sea Project
Concept a Embankment Crest Elevation b
(feet MSL)
Embankment Face
Embankment Slope (H:V)
Calculated Static Factor of Safety c
Seismic Dike -225 Downstream 7:1 1.69 Seismic Dike -225 Upstream 5:1 1.53 Zoned Rockfill Dam -225 Downstream 7:1 1.55 Zoned Rockfill Dam -225 Upstream 5:1 1.48 Blanketed Rockfill Dam -225 Downstream 7:1 1.60
Dam
Co
ncep
ts
Blanketed Rockfill Dam -225 Upstream 4:1 1.61 Dumped Fill Barrier -242 Downstream 4:1 1.54 Dumped Fill Barrier -242 Upstream 4:1 1.54 Rockfill Barrier with Dredged Fill
-242 Downstream 4:1 1.55
Barri
er C
once
pts
Rockfill Barrier with Dredged Fill
-242 Upstream 4:1 1.55
Notes: a. Graphical outputs of stability analyses are included in Appendix A. b. Dam concepts modeled with a Sea level of –230 feet MSL on the upstream side and –255 feet MSL on the
downstream side. Barrier concepts modeled with a Sea level of –247 feet MSL on both sides. c. Standard of practice is a minimum static factor of safety of 1.5.
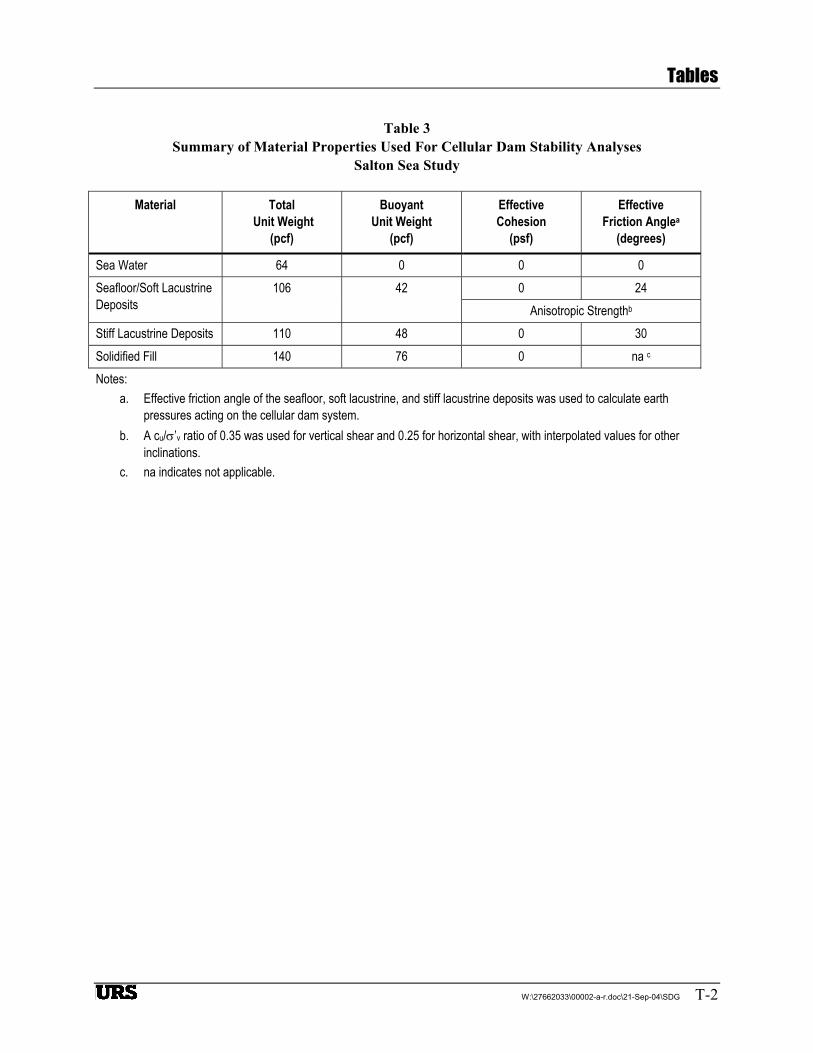
Tables
W:\27662033\00002-a-r.doc\21-Sep-04\SDG T-2
Table 3 Summary of Material Properties Used For Cellular Dam Stability Analyses
Salton Sea Study
Material Total Unit Weight
(pcf)
Buoyant Unit Weight
(pcf)
Effective Cohesion
(psf)
Effective Friction Anglea
(degrees)
Sea Water 64 0 0 0 0 24 Seafloor/Soft Lacustrine
Deposits 106 42
Anisotropic Strengthb Stiff Lacustrine Deposits 110 48 0 30 Solidified Fill 140 76 0 na c Notes:
a. Effective friction angle of the seafloor, soft lacustrine, and stiff lacustrine deposits was used to calculate earth pressures acting on the cellular dam system.
b. A cu/σ’v ratio of 0.35 was used for vertical shear and 0.25 for horizontal shear, with interpolated values for other inclinations.
c. na indicates not applicable.
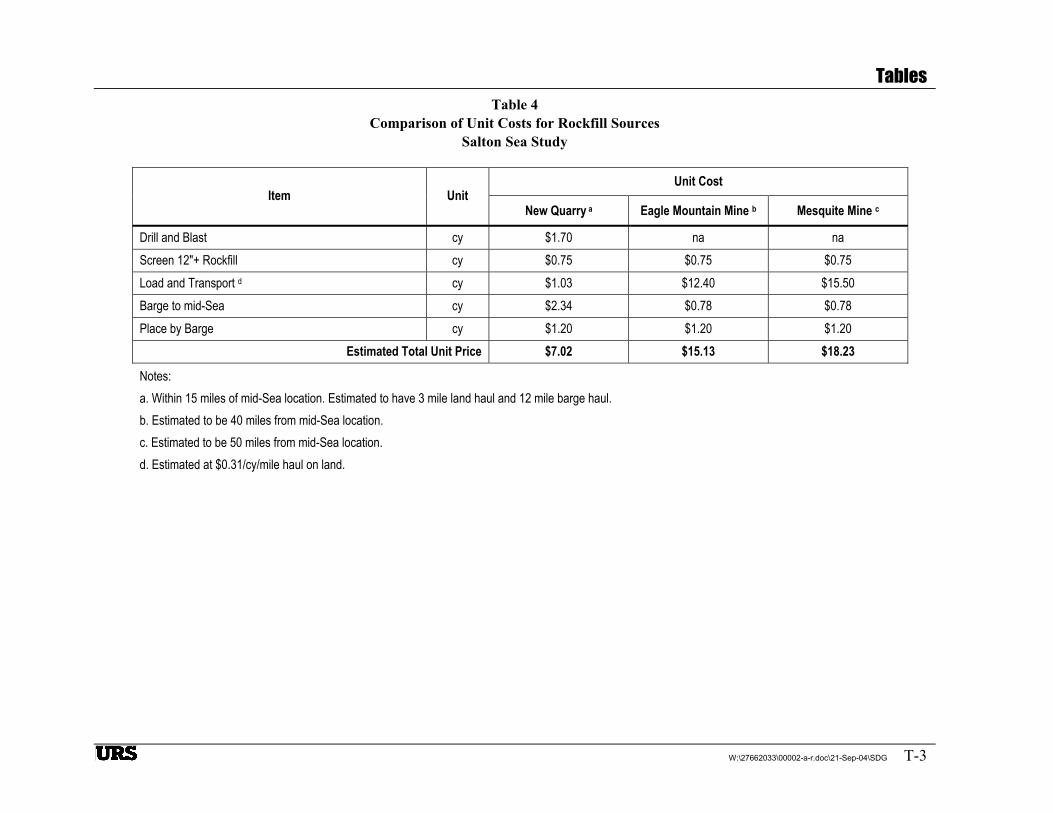
Tables
W:\27662033\00002-a-r.doc\21-Sep-04\SDG T-3
Table 4 Comparison of Unit Costs for Rockfill Sources
Salton Sea Study
Unit Cost Item Unit
New Quarry a Eagle Mountain Mine b Mesquite Mine c
Drill and Blast cy $1.70 na na Screen 12"+ Rockfill cy $0.75 $0.75 $0.75 Load and Transport d cy $1.03 $12.40 $15.50 Barge to mid-Sea cy $2.34 $0.78 $0.78 Place by Barge cy $1.20 $1.20 $1.20
Estimated Total Unit Price $7.02 $15.13 $18.23
Notes: a. Within 15 miles of mid-Sea location. Estimated to have 3 mile land haul and 12 mile barge haul. b. Estimated to be 40 miles from mid-Sea location. c. Estimated to be 50 miles from mid-Sea location. d. Estimated at $0.31/cy/mile haul on land.
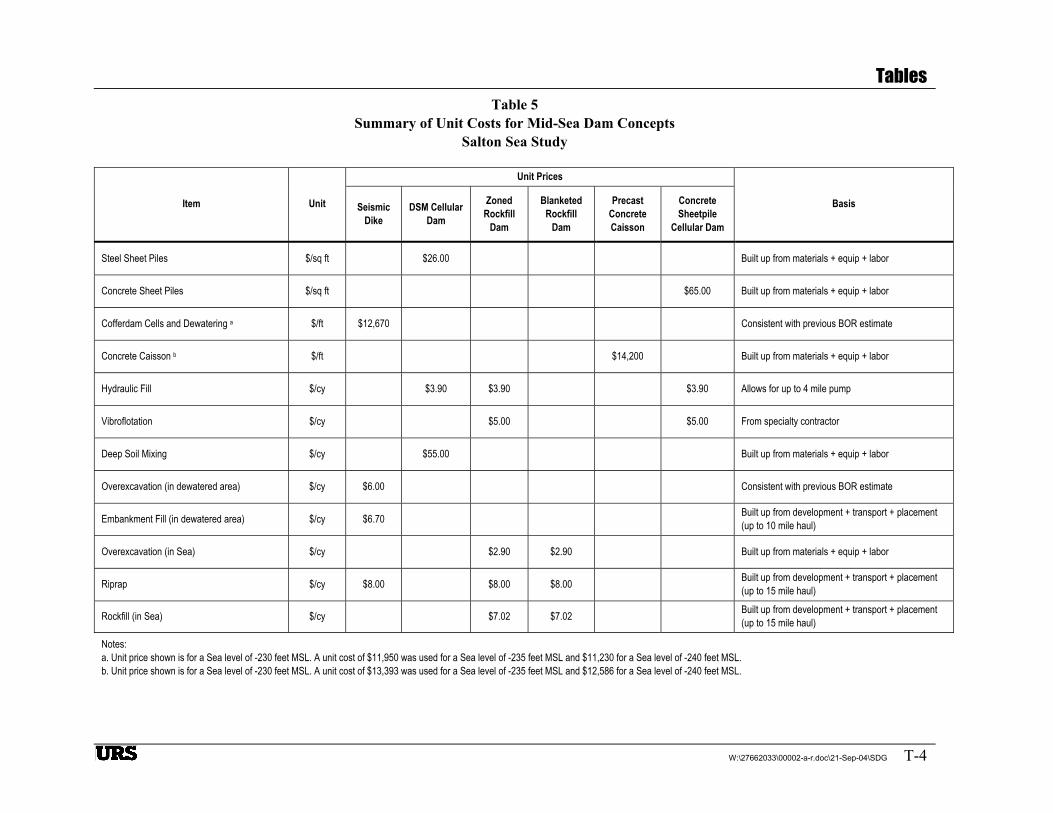
Tables
W:\27662033\00002-a-r.doc\21-Sep-04\SDG T-4
Table 5 Summary of Unit Costs for Mid-Sea Dam Concepts
Salton Sea Study
Unit Prices
Item Unit Seismic Dike
DSM Cellular Dam
Zoned Rockfill
Dam
Blanketed Rockfill
Dam
Precast Concrete Caisson
Concrete Sheetpile
Cellular Dam
Basis
Steel Sheet Piles $/sq ft $26.00 Built up from materials + equip + labor
Concrete Sheet Piles $/sq ft $65.00 Built up from materials + equip + labor
Cofferdam Cells and Dewatering a $/ft $12,670 Consistent with previous BOR estimate
Concrete Caisson b $/ft $14,200 Built up from materials + equip + labor
Hydraulic Fill $/cy $3.90 $3.90 $3.90 Allows for up to 4 mile pump
Vibroflotation $/cy $5.00 $5.00 From specialty contractor
Deep Soil Mixing $/cy $55.00 Built up from materials + equip + labor
Overexcavation (in dewatered area) $/cy $6.00 Consistent with previous BOR estimate
Embankment Fill (in dewatered area) $/cy $6.70 Built up from development + transport + placement (up to 10 mile haul)
Overexcavation (in Sea) $/cy $2.90 $2.90 Built up from materials + equip + labor
Riprap $/cy $8.00 $8.00 $8.00 Built up from development + transport + placement (up to 15 mile haul)
Rockfill (in Sea) $/cy $7.02 $7.02 Built up from development + transport + placement (up to 15 mile haul)
Notes: a. Unit price shown is for a Sea level of -230 feet MSL. A unit cost of $11,950 was used for a Sea level of -235 feet MSL and $11,230 for a Sea level of -240 feet MSL. b. Unit price shown is for a Sea level of -230 feet MSL. A unit cost of $13,393 was used for a Sea level of -235 feet MSL and $12,586 for a Sea level of -240 feet MSL.
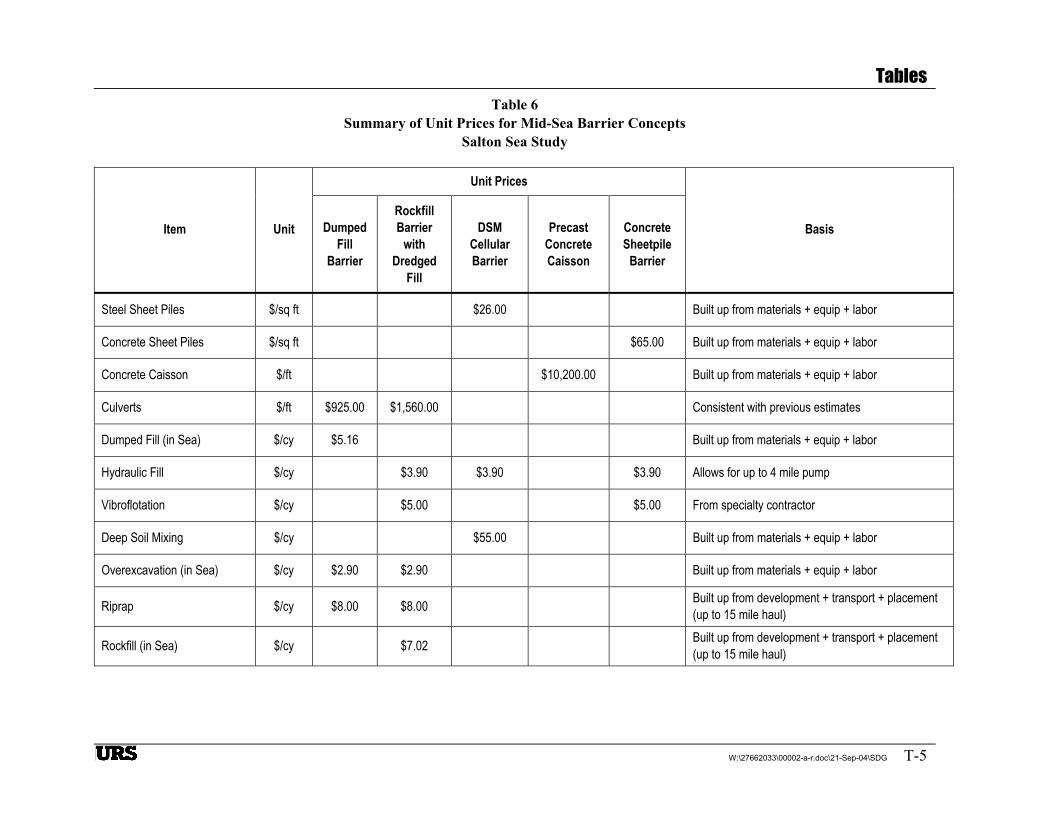
Tables
W:\27662033\00002-a-r.doc\21-Sep-04\SDG T-5
Table 6 Summary of Unit Prices for Mid-Sea Barrier Concepts
Salton Sea Study
Unit Prices
Item Unit Dumped Fill
Barrier
Rockfill Barrier
with Dredged
Fill
DSM Cellular Barrier
Precast Concrete Caisson
Concrete Sheetpile
Barrier
Basis
Steel Sheet Piles $/sq ft $26.00 Built up from materials + equip + labor
Concrete Sheet Piles $/sq ft $65.00 Built up from materials + equip + labor
Concrete Caisson $/ft $10,200.00 Built up from materials + equip + labor
Culverts $/ft $925.00 $1,560.00 Consistent with previous estimates
Dumped Fill (in Sea) $/cy $5.16 Built up from materials + equip + labor
Hydraulic Fill $/cy $3.90 $3.90 $3.90 Allows for up to 4 mile pump
Vibroflotation $/cy $5.00 $5.00 From specialty contractor
Deep Soil Mixing $/cy $55.00 Built up from materials + equip + labor
Overexcavation (in Sea) $/cy $2.90 $2.90 Built up from materials + equip + labor
Riprap $/cy $8.00 $8.00 Built up from development + transport + placement (up to 15 mile haul)
Rockfill (in Sea) $/cy $7.02 Built up from development + transport + placement (up to 15 mile haul)
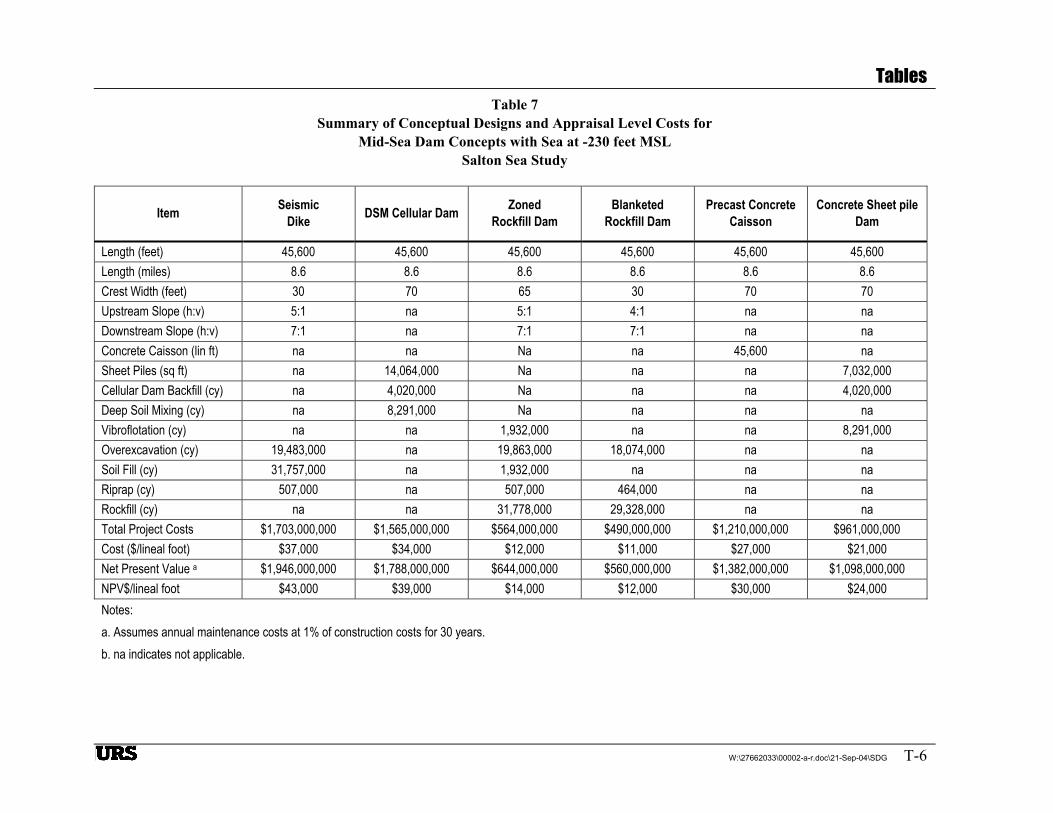
Tables
W:\27662033\00002-a-r.doc\21-Sep-04\SDG T-6
Table 7 Summary of Conceptual Designs and Appraisal Level Costs for
Mid-Sea Dam Concepts with Sea at -230 feet MSL Salton Sea Study
Item Seismic Dike DSM Cellular Dam Zoned
Rockfill Dam Blanketed
Rockfill Dam Precast Concrete
Caisson Concrete Sheet pile
Dam
Length (feet) 45,600 45,600 45,600 45,600 45,600 45,600 Length (miles) 8.6 8.6 8.6 8.6 8.6 8.6 Crest Width (feet) 30 70 65 30 70 70 Upstream Slope (h:v) 5:1 na 5:1 4:1 na na Downstream Slope (h:v) 7:1 na 7:1 7:1 na na Concrete Caisson (lin ft) na na Na na 45,600 na Sheet Piles (sq ft) na 14,064,000 Na na na 7,032,000 Cellular Dam Backfill (cy) na 4,020,000 Na na na 4,020,000 Deep Soil Mixing (cy) na 8,291,000 Na na na na Vibroflotation (cy) na na 1,932,000 na na 8,291,000 Overexcavation (cy) 19,483,000 na 19,863,000 18,074,000 na na Soil Fill (cy) 31,757,000 na 1,932,000 na na na Riprap (cy) 507,000 na 507,000 464,000 na na Rockfill (cy) na na 31,778,000 29,328,000 na na Total Project Costs $1,703,000,000 $1,565,000,000 $564,000,000 $490,000,000 $1,210,000,000 $961,000,000 Cost ($/lineal foot) $37,000 $34,000 $12,000 $11,000 $27,000 $21,000 Net Present Value a $1,946,000,000 $1,788,000,000 $644,000,000 $560,000,000 $1,382,000,000 $1,098,000,000 NPV$/lineal foot $43,000 $39,000 $14,000 $12,000 $30,000 $24,000 Notes: a. Assumes annual maintenance costs at 1% of construction costs for 30 years. b. na indicates not applicable.
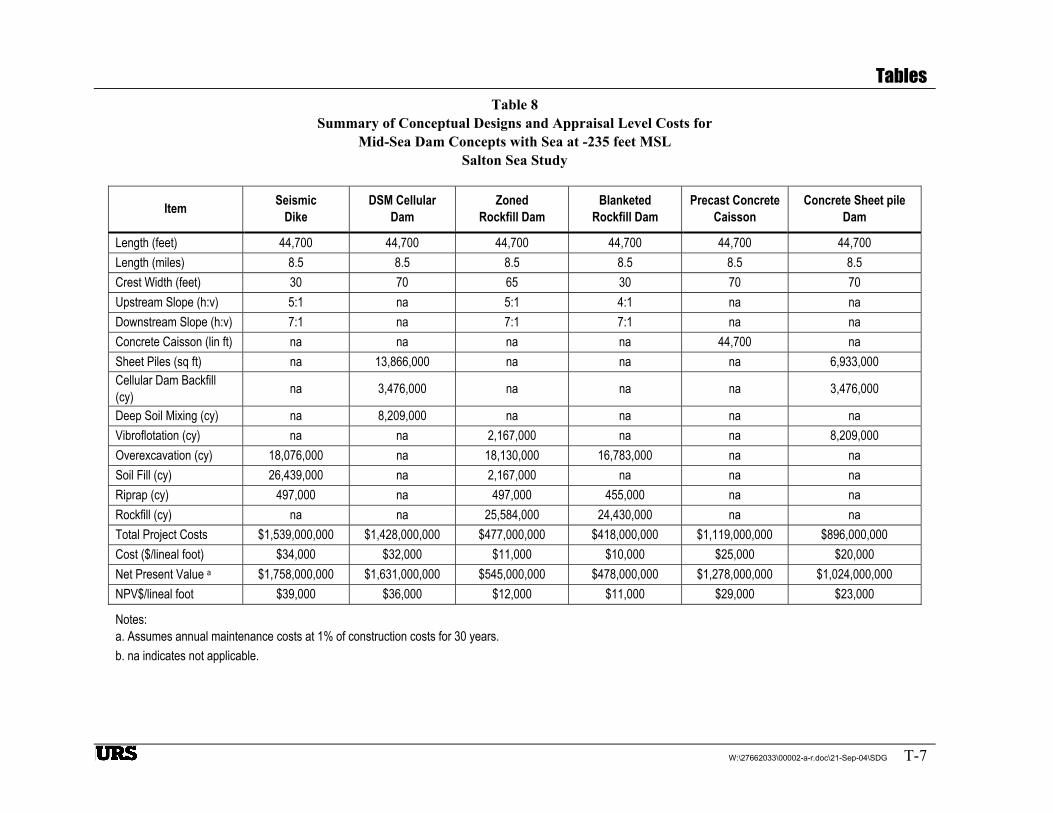
Tables
W:\27662033\00002-a-r.doc\21-Sep-04\SDG T-7
Table 8 Summary of Conceptual Designs and Appraisal Level Costs for
Mid-Sea Dam Concepts with Sea at -235 feet MSL Salton Sea Study
Item Seismic Dike
DSM Cellular Dam
Zoned Rockfill Dam
Blanketed Rockfill Dam
Precast Concrete Caisson
Concrete Sheet pile Dam
Length (feet) 44,700 44,700 44,700 44,700 44,700 44,700 Length (miles) 8.5 8.5 8.5 8.5 8.5 8.5 Crest Width (feet) 30 70 65 30 70 70 Upstream Slope (h:v) 5:1 na 5:1 4:1 na na Downstream Slope (h:v) 7:1 na 7:1 7:1 na na Concrete Caisson (lin ft) na na na na 44,700 na Sheet Piles (sq ft) na 13,866,000 na na na 6,933,000 Cellular Dam Backfill (cy) na 3,476,000 na na na 3,476,000
Deep Soil Mixing (cy) na 8,209,000 na na na na Vibroflotation (cy) na na 2,167,000 na na 8,209,000 Overexcavation (cy) 18,076,000 na 18,130,000 16,783,000 na na Soil Fill (cy) 26,439,000 na 2,167,000 na na na Riprap (cy) 497,000 na 497,000 455,000 na na Rockfill (cy) na na 25,584,000 24,430,000 na na Total Project Costs $1,539,000,000 $1,428,000,000 $477,000,000 $418,000,000 $1,119,000,000 $896,000,000 Cost ($/lineal foot) $34,000 $32,000 $11,000 $10,000 $25,000 $20,000 Net Present Value a $1,758,000,000 $1,631,000,000 $545,000,000 $478,000,000 $1,278,000,000 $1,024,000,000 NPV$/lineal foot $39,000 $36,000 $12,000 $11,000 $29,000 $23,000
Notes: a. Assumes annual maintenance costs at 1% of construction costs for 30 years. b. na indicates not applicable.
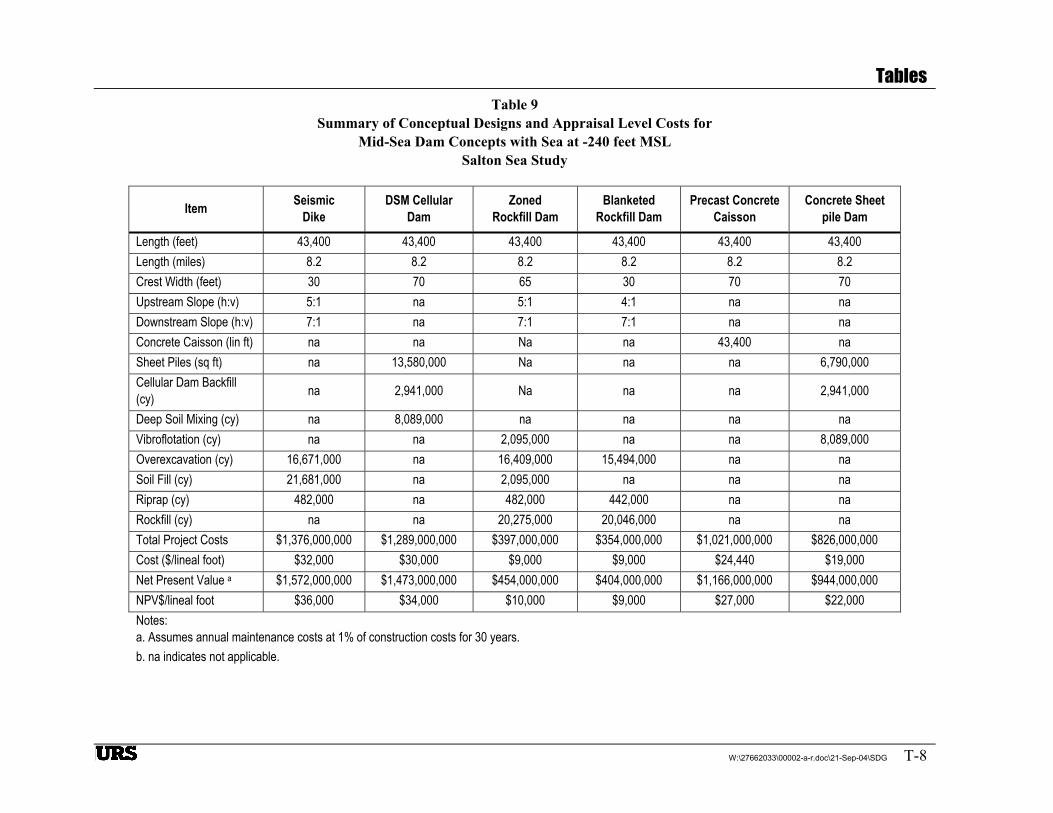
Tables
W:\27662033\00002-a-r.doc\21-Sep-04\SDG T-8
Table 9 Summary of Conceptual Designs and Appraisal Level Costs for
Mid-Sea Dam Concepts with Sea at -240 feet MSL Salton Sea Study
Item Seismic Dike
DSM Cellular Dam
Zoned Rockfill Dam
Blanketed Rockfill Dam
Precast Concrete Caisson
Concrete Sheet pile Dam
Length (feet) 43,400 43,400 43,400 43,400 43,400 43,400 Length (miles) 8.2 8.2 8.2 8.2 8.2 8.2 Crest Width (feet) 30 70 65 30 70 70 Upstream Slope (h:v) 5:1 na 5:1 4:1 na na Downstream Slope (h:v) 7:1 na 7:1 7:1 na na Concrete Caisson (lin ft) na na Na na 43,400 na Sheet Piles (sq ft) na 13,580,000 Na na na 6,790,000 Cellular Dam Backfill (cy) na 2,941,000 Na na na 2,941,000
Deep Soil Mixing (cy) na 8,089,000 na na na na Vibroflotation (cy) na na 2,095,000 na na 8,089,000 Overexcavation (cy) 16,671,000 na 16,409,000 15,494,000 na na Soil Fill (cy) 21,681,000 na 2,095,000 na na na Riprap (cy) 482,000 na 482,000 442,000 na na Rockfill (cy) na na 20,275,000 20,046,000 na na Total Project Costs $1,376,000,000 $1,289,000,000 $397,000,000 $354,000,000 $1,021,000,000 $826,000,000 Cost ($/lineal foot) $32,000 $30,000 $9,000 $9,000 $24,440 $19,000 Net Present Value a $1,572,000,000 $1,473,000,000 $454,000,000 $404,000,000 $1,166,000,000 $944,000,000 NPV$/lineal foot $36,000 $34,000 $10,000 $9,000 $27,000 $22,000 Notes: a. Assumes annual maintenance costs at 1% of construction costs for 30 years. b. na indicates not applicable.
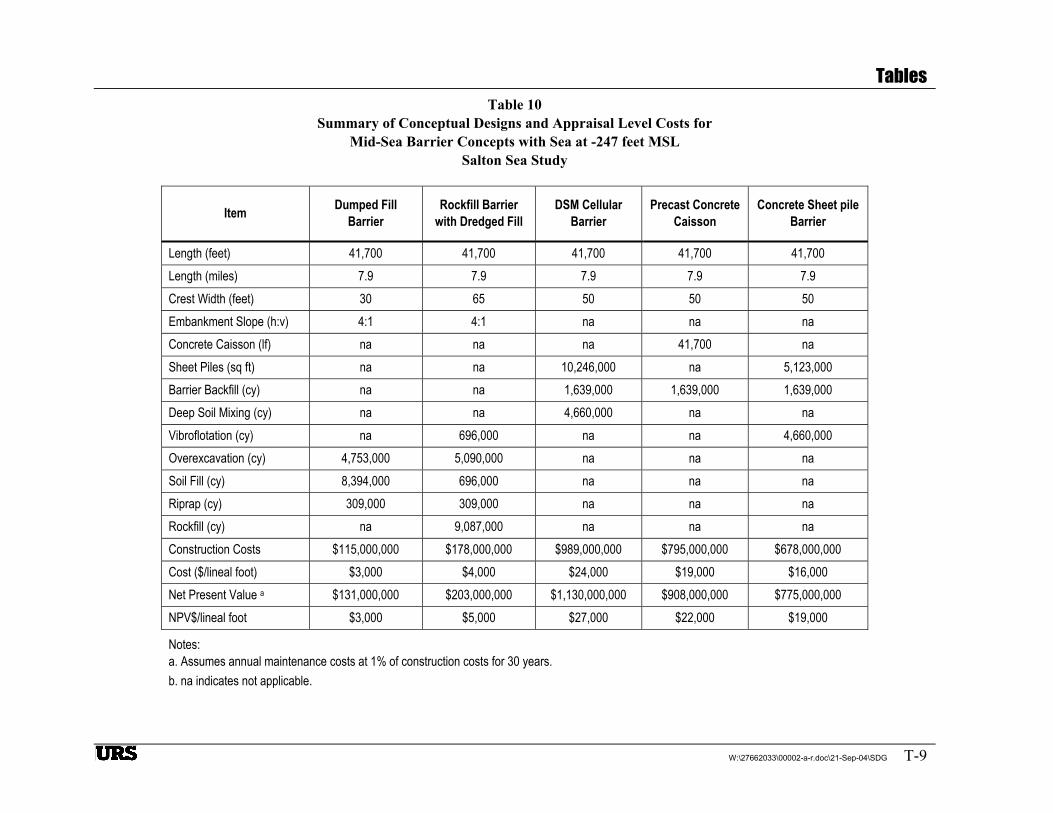
Tables
W:\27662033\00002-a-r.doc\21-Sep-04\SDG T-9
Table 10 Summary of Conceptual Designs and Appraisal Level Costs for
Mid-Sea Barrier Concepts with Sea at -247 feet MSL Salton Sea Study
Item Dumped Fill Barrier
Rockfill Barrier with Dredged Fill
DSM Cellular Barrier
Precast Concrete Caisson
Concrete Sheet pile Barrier
Length (feet) 41,700 41,700 41,700 41,700 41,700 Length (miles) 7.9 7.9 7.9 7.9 7.9 Crest Width (feet) 30 65 50 50 50 Embankment Slope (h:v) 4:1 4:1 na na na Concrete Caisson (lf) na na na 41,700 na Sheet Piles (sq ft) na na 10,246,000 na 5,123,000 Barrier Backfill (cy) na na 1,639,000 1,639,000 1,639,000 Deep Soil Mixing (cy) na na 4,660,000 na na Vibroflotation (cy) na 696,000 na na 4,660,000 Overexcavation (cy) 4,753,000 5,090,000 na na na Soil Fill (cy) 8,394,000 696,000 na na na Riprap (cy) 309,000 309,000 na na na Rockfill (cy) na 9,087,000 na na na Construction Costs $115,000,000 $178,000,000 $989,000,000 $795,000,000 $678,000,000 Cost ($/lineal foot) $3,000 $4,000 $24,000 $19,000 $16,000 Net Present Value a $131,000,000 $203,000,000 $1,130,000,000 $908,000,000 $775,000,000 NPV$/lineal foot $3,000 $5,000 $27,000 $22,000 $19,000
Notes: a. Assumes annual maintenance costs at 1% of construction costs for 30 years. b. na indicates not applicable.
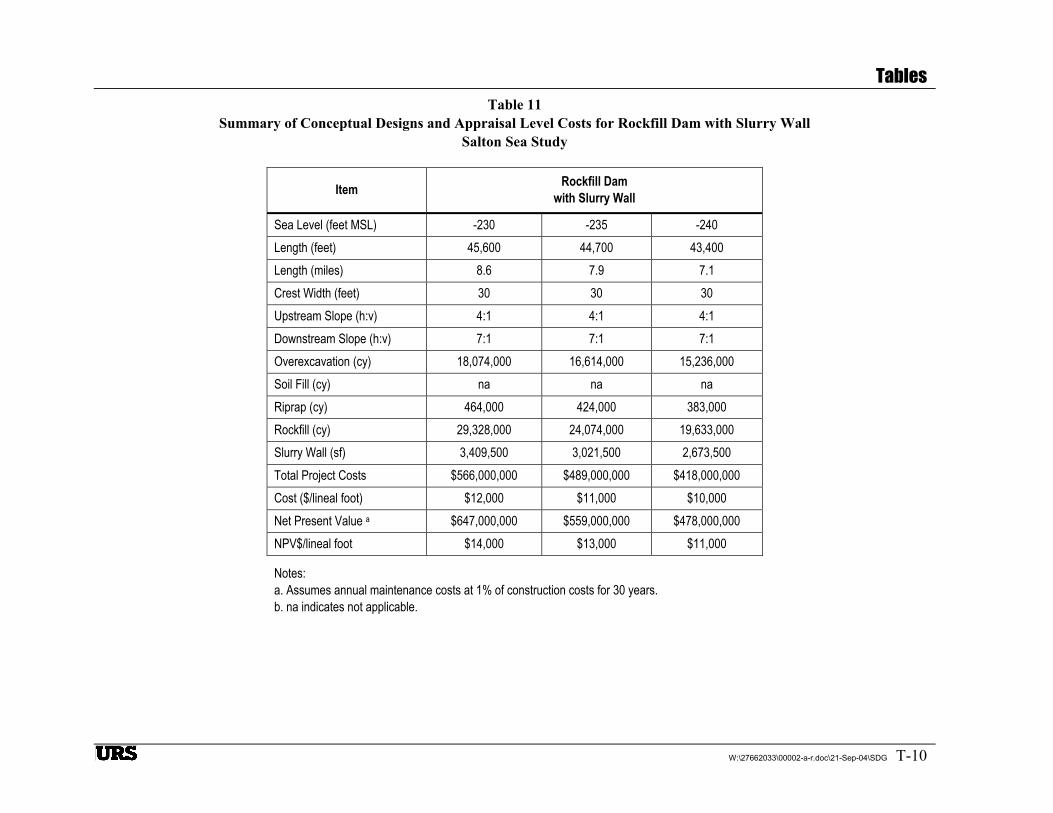
Tables
W:\27662033\00002-a-r.doc\21-Sep-04\SDG T-10
Table 11 Summary of Conceptual Designs and Appraisal Level Costs for Rockfill Dam with Slurry Wall
Salton Sea Study
Item Rockfill Dam with Slurry Wall
Sea Level (feet MSL) -230 -235 -240 Length (feet) 45,600 44,700 43,400 Length (miles) 8.6 7.9 7.1 Crest Width (feet) 30 30 30 Upstream Slope (h:v) 4:1 4:1 4:1 Downstream Slope (h:v) 7:1 7:1 7:1 Overexcavation (cy) 18,074,000 16,614,000 15,236,000 Soil Fill (cy) na na na Riprap (cy) 464,000 424,000 383,000 Rockfill (cy) 29,328,000 24,074,000 19,633,000 Slurry Wall (sf) 3,409,500 3,021,500 2,673,500 Total Project Costs $566,000,000 $489,000,000 $418,000,000 Cost ($/lineal foot) $12,000 $11,000 $10,000 Net Present Value a $647,000,000 $559,000,000 $478,000,000 NPV$/lineal foot $14,000 $13,000 $11,000
Notes: a. Assumes annual maintenance costs at 1% of construction costs for 30 years. b. na indicates not applicable.

Figures
W:\27662033\00002-a-r.doc\21-Sep-04\SDG
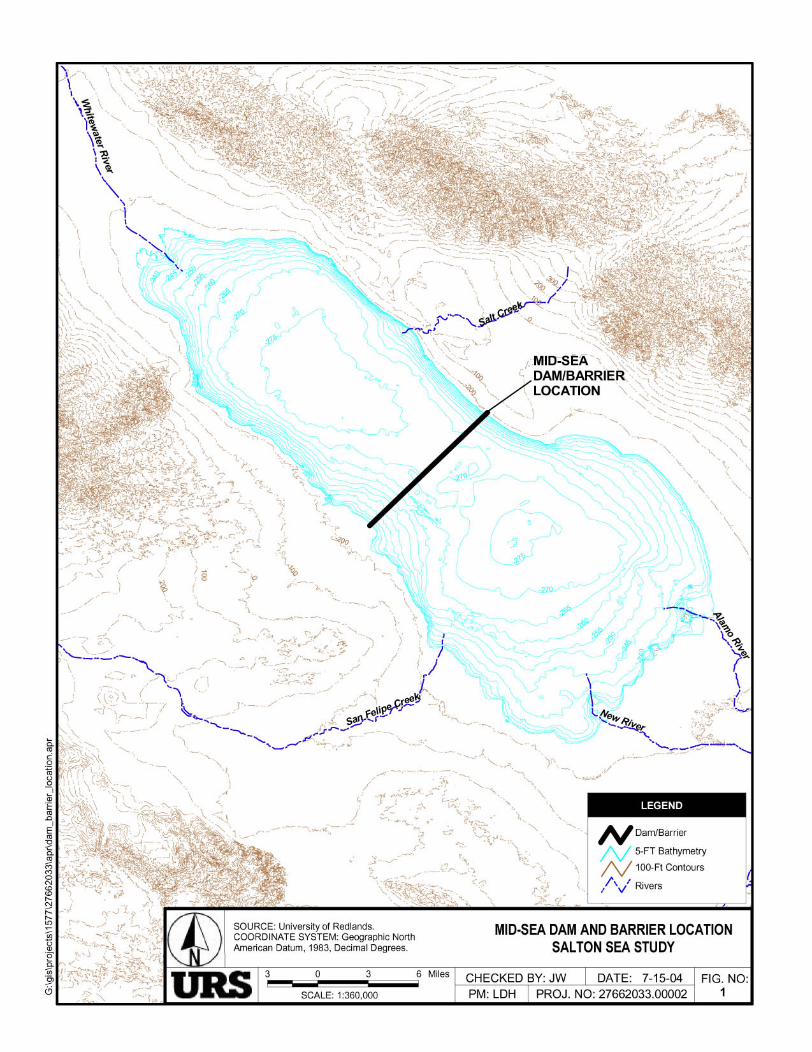
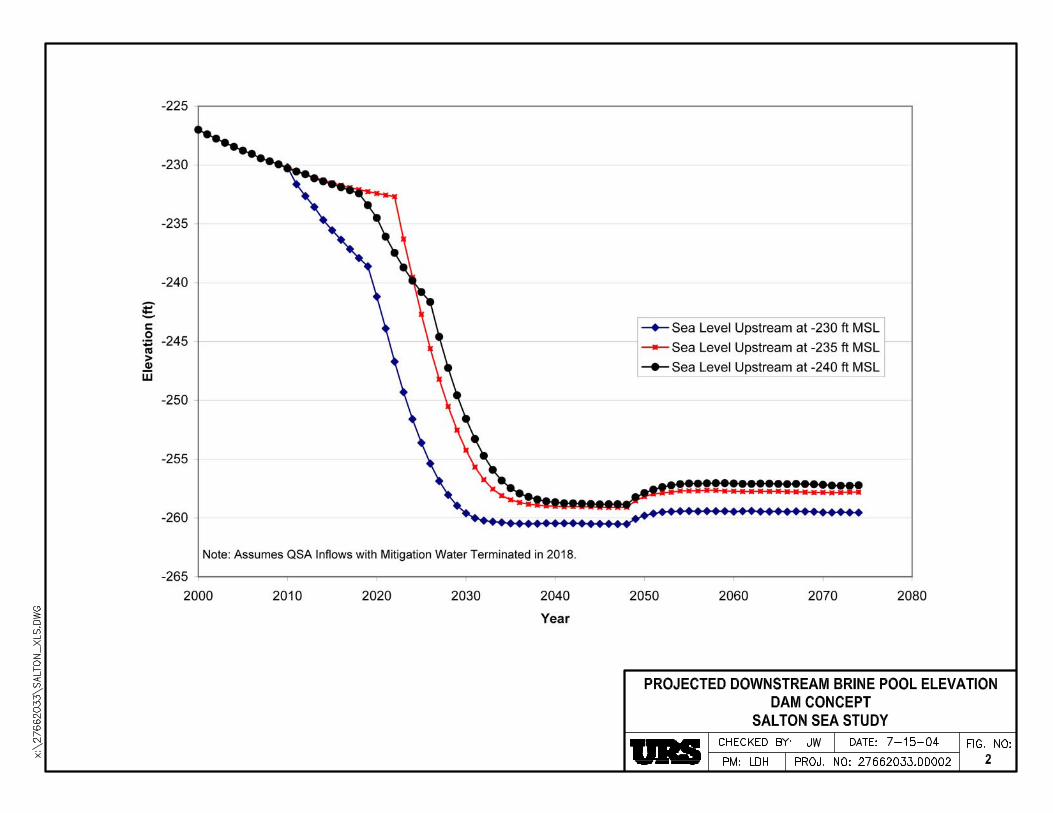
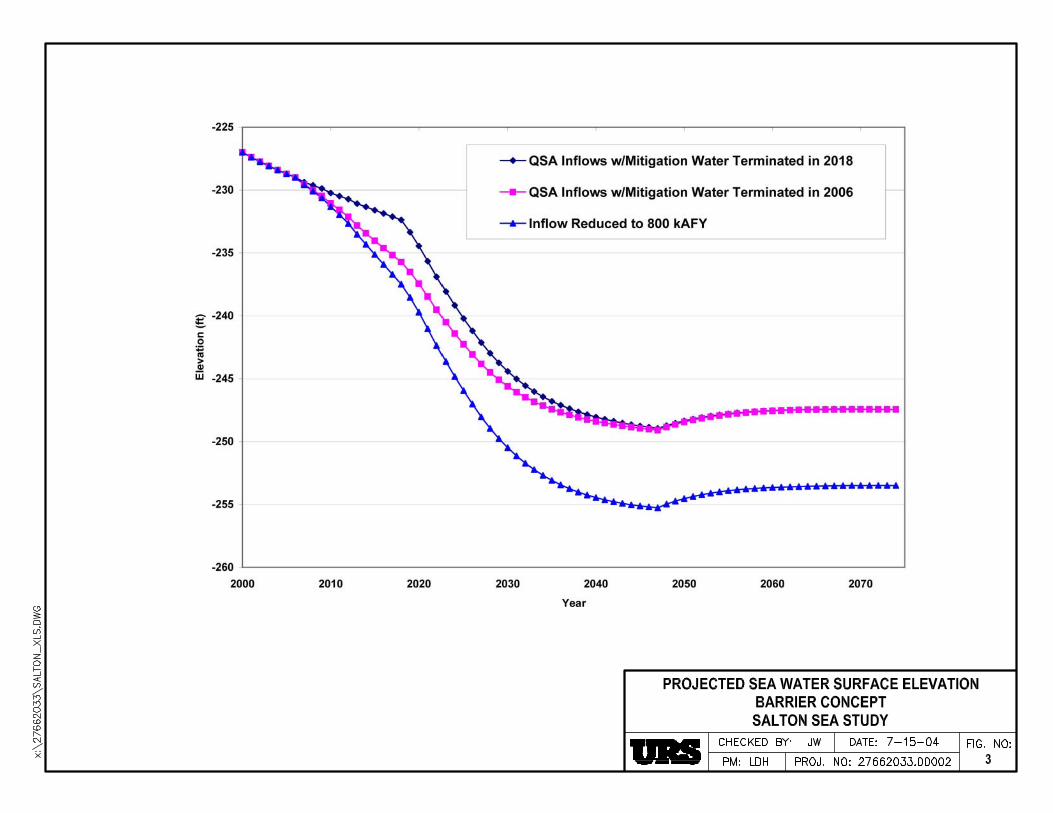
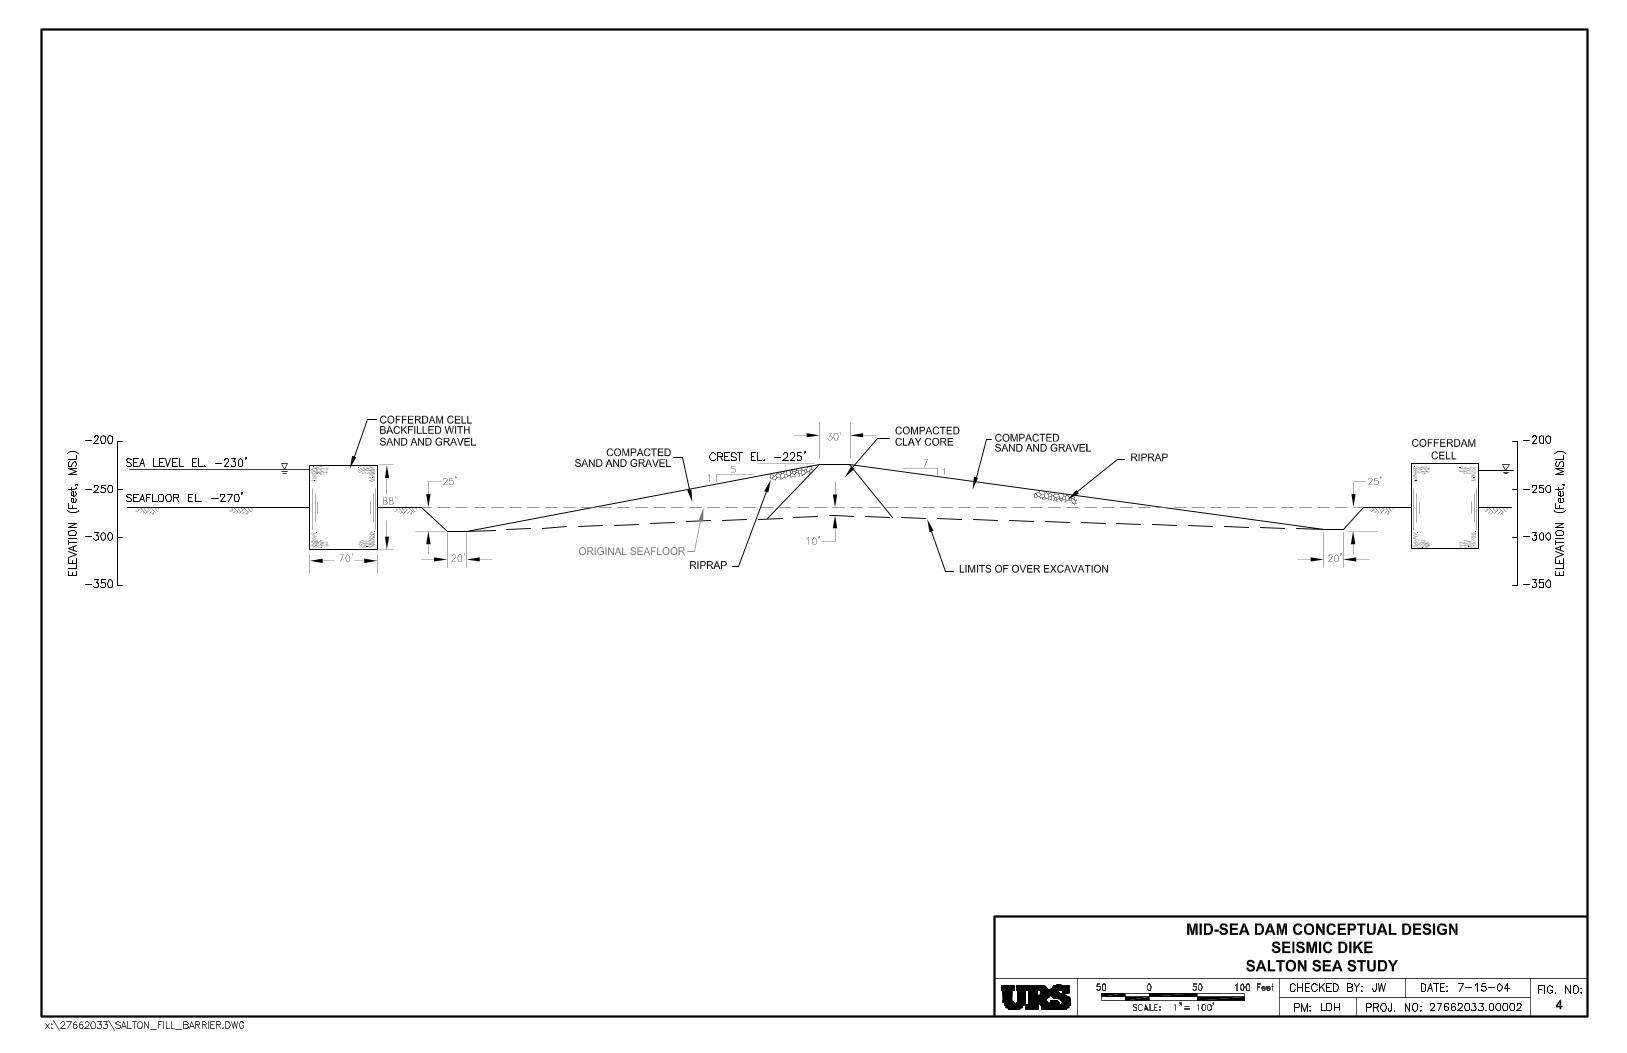
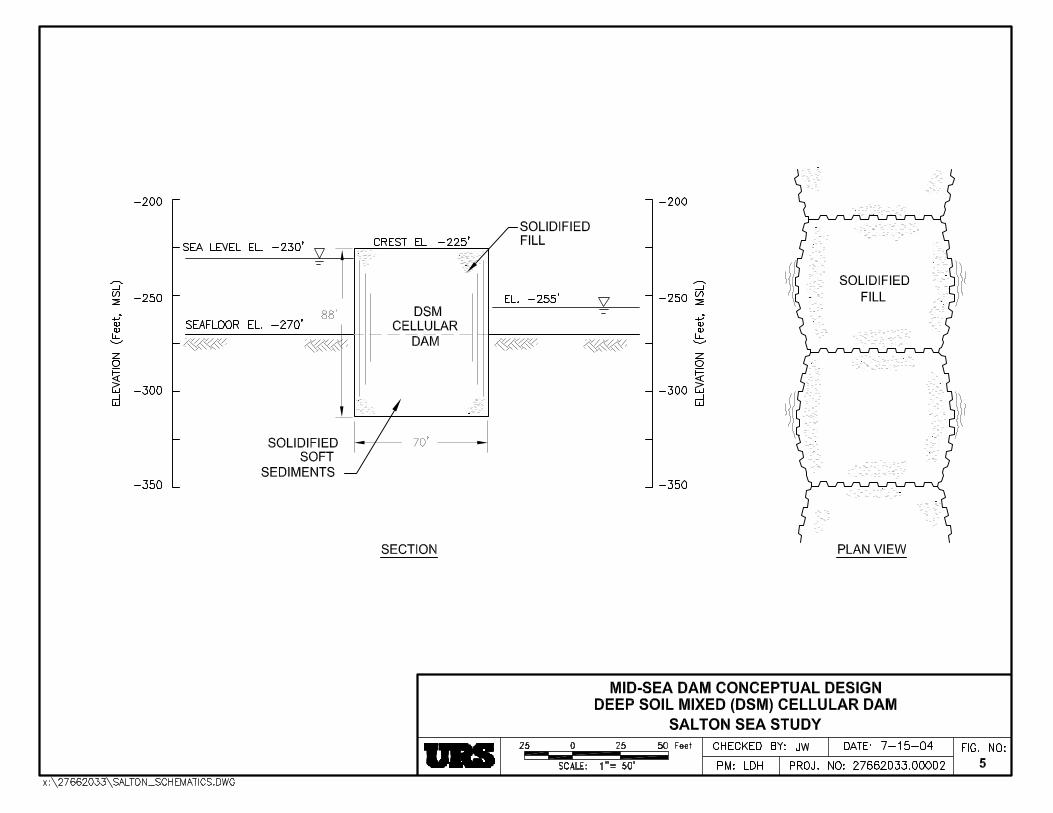
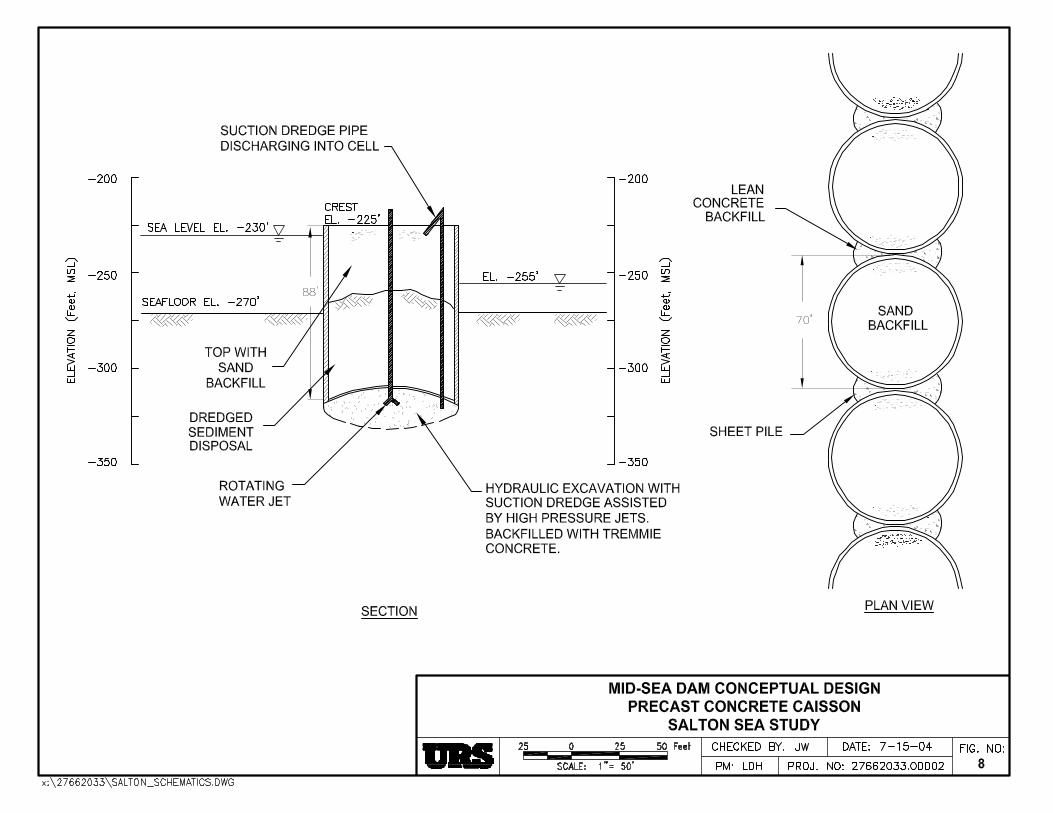
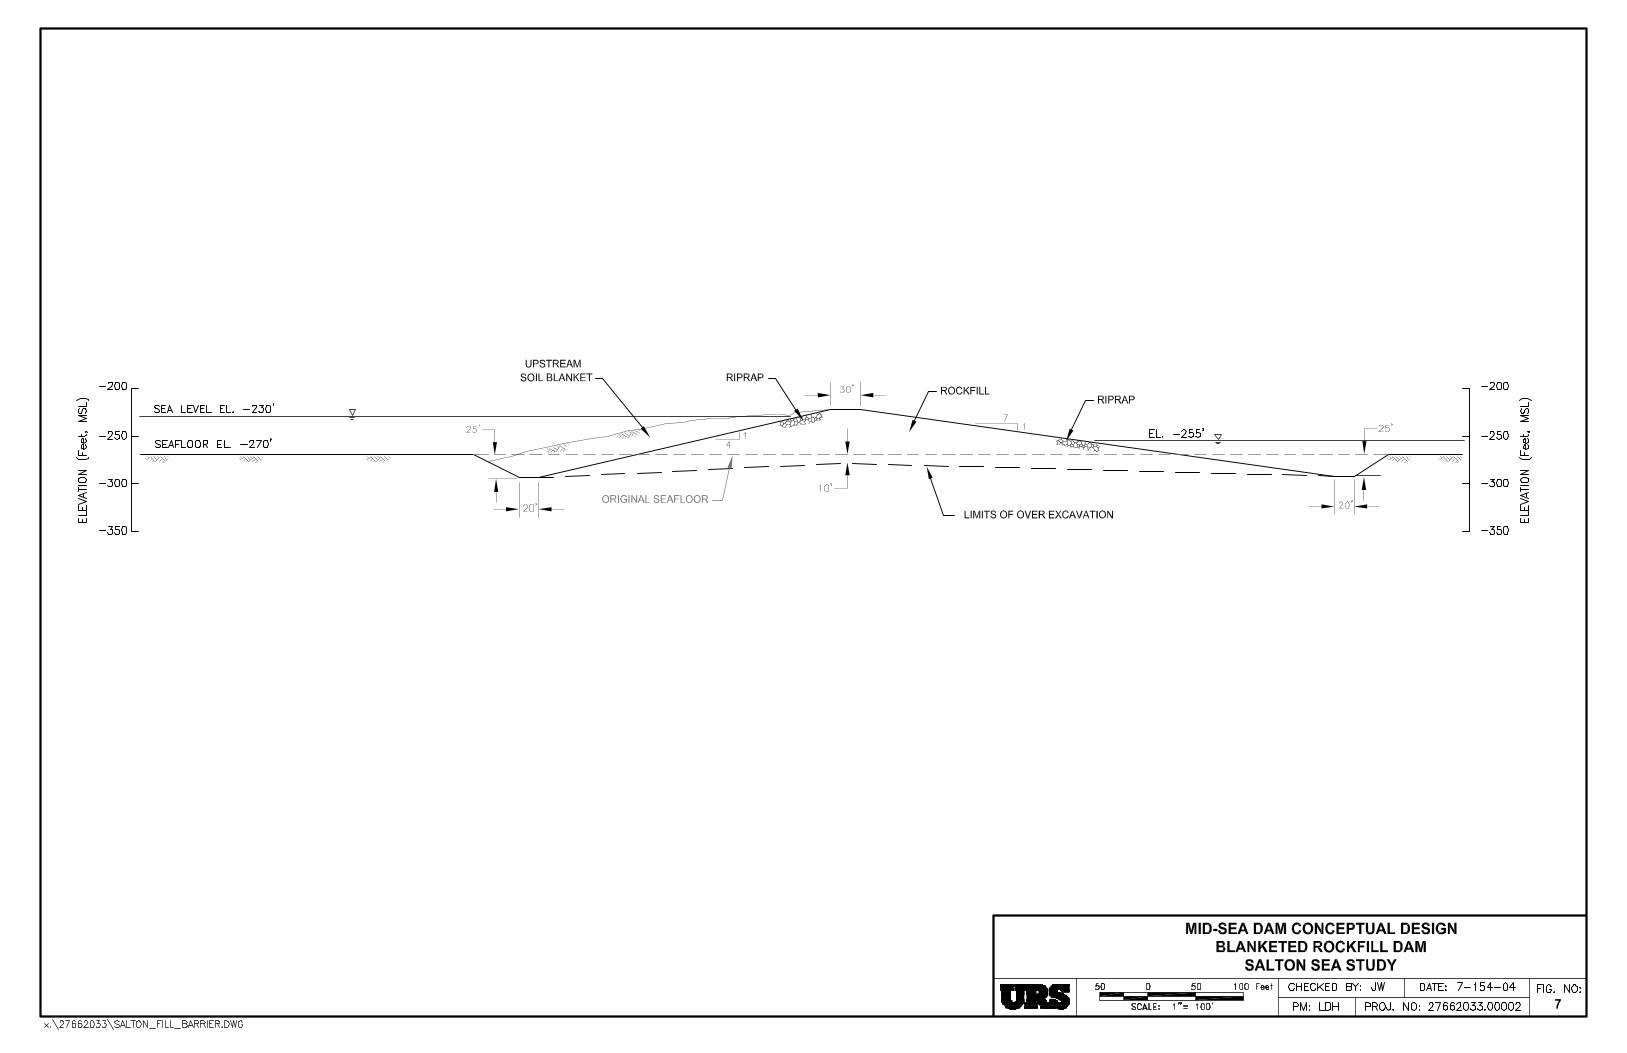
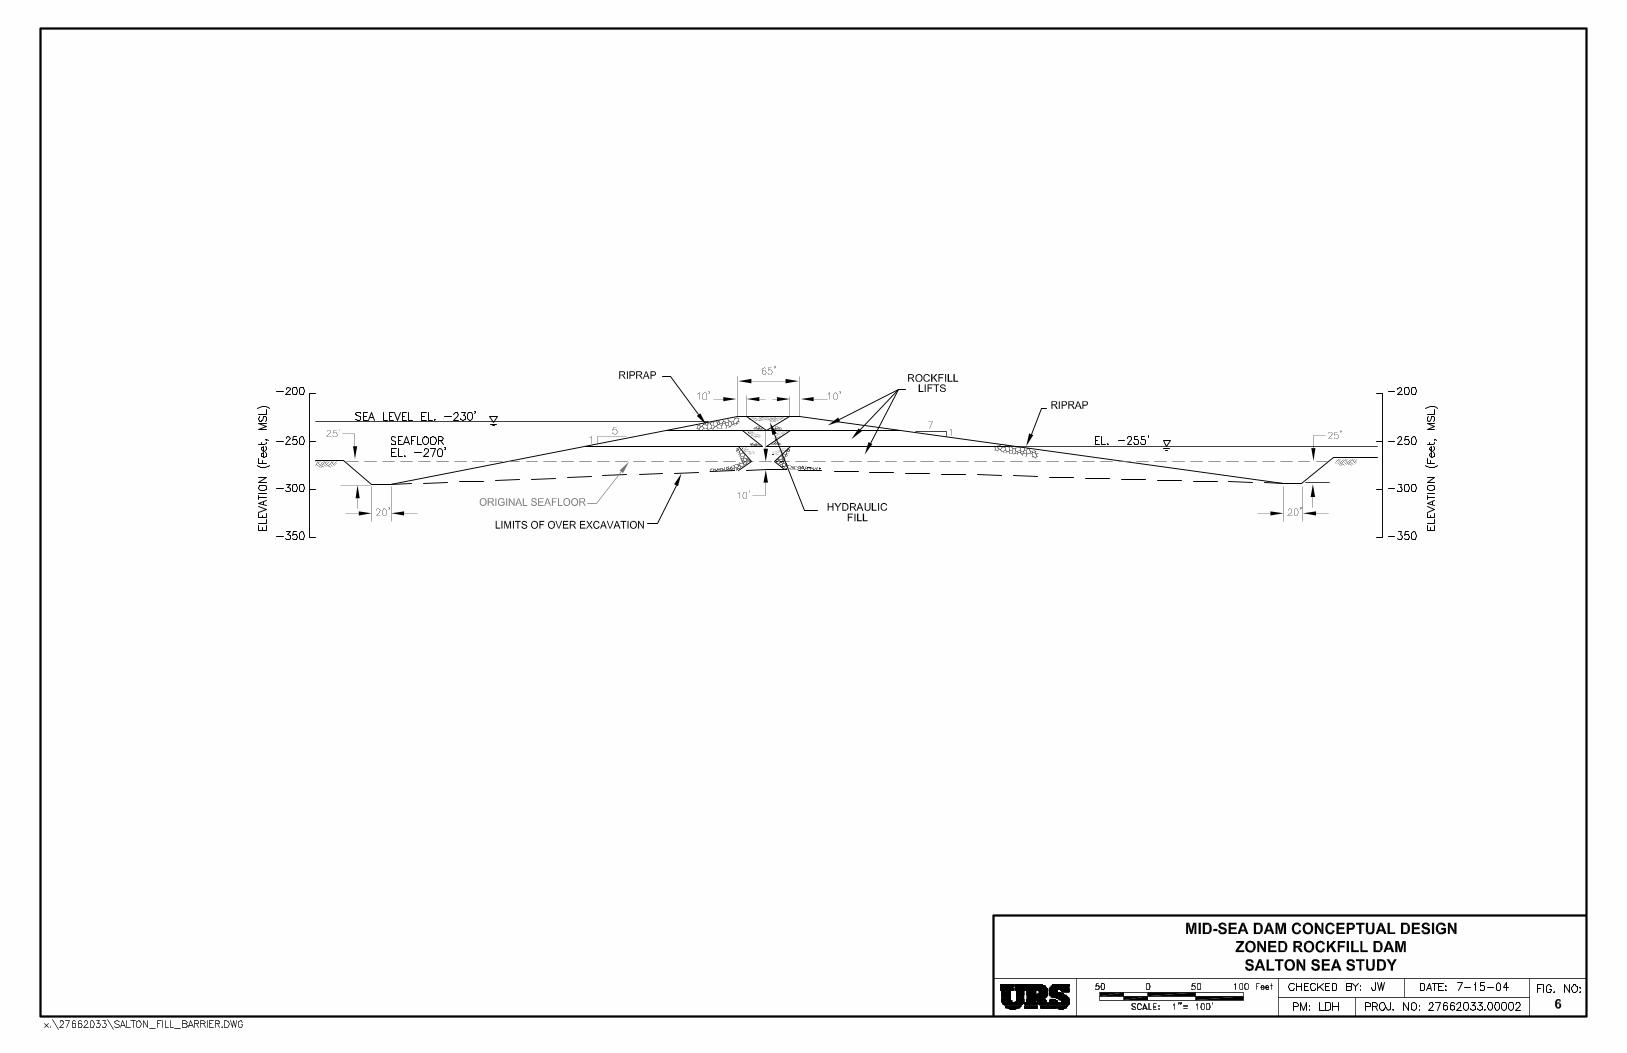
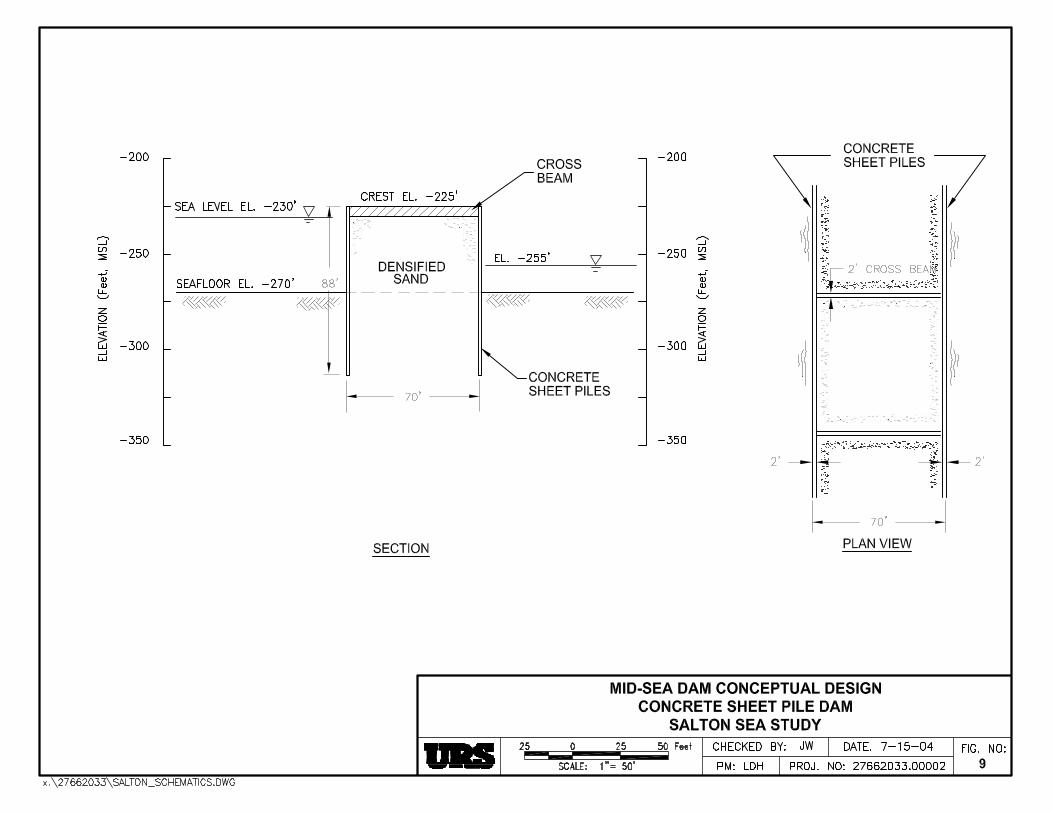
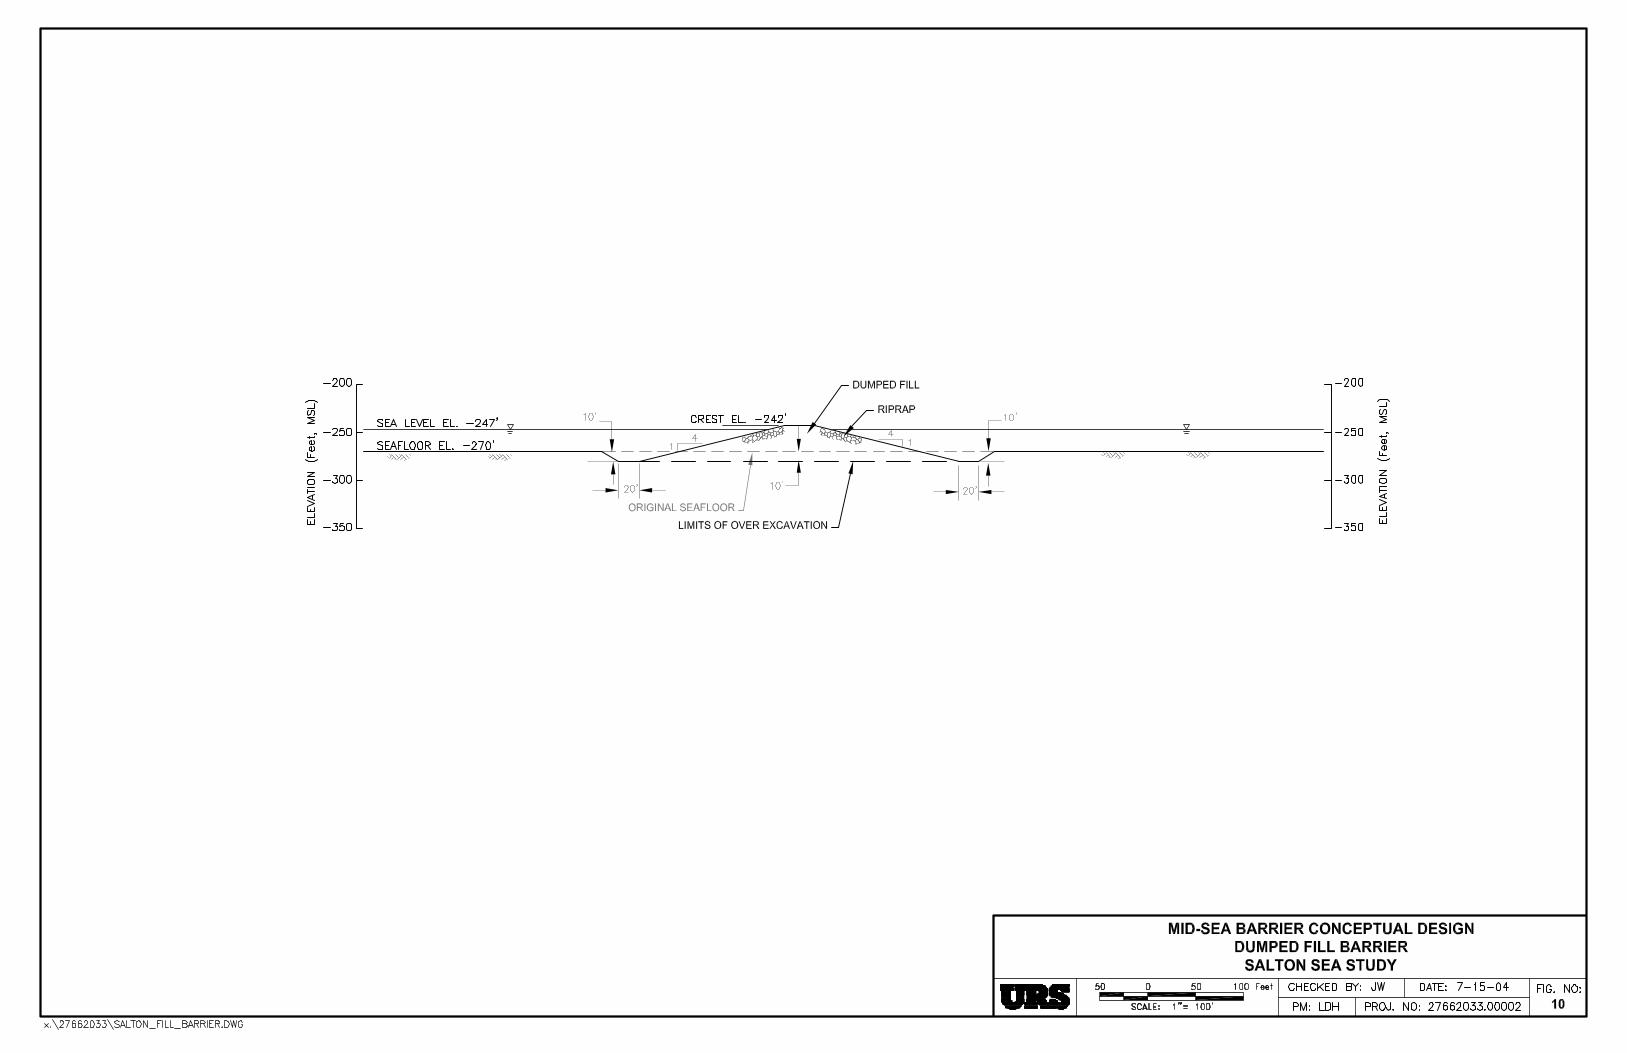
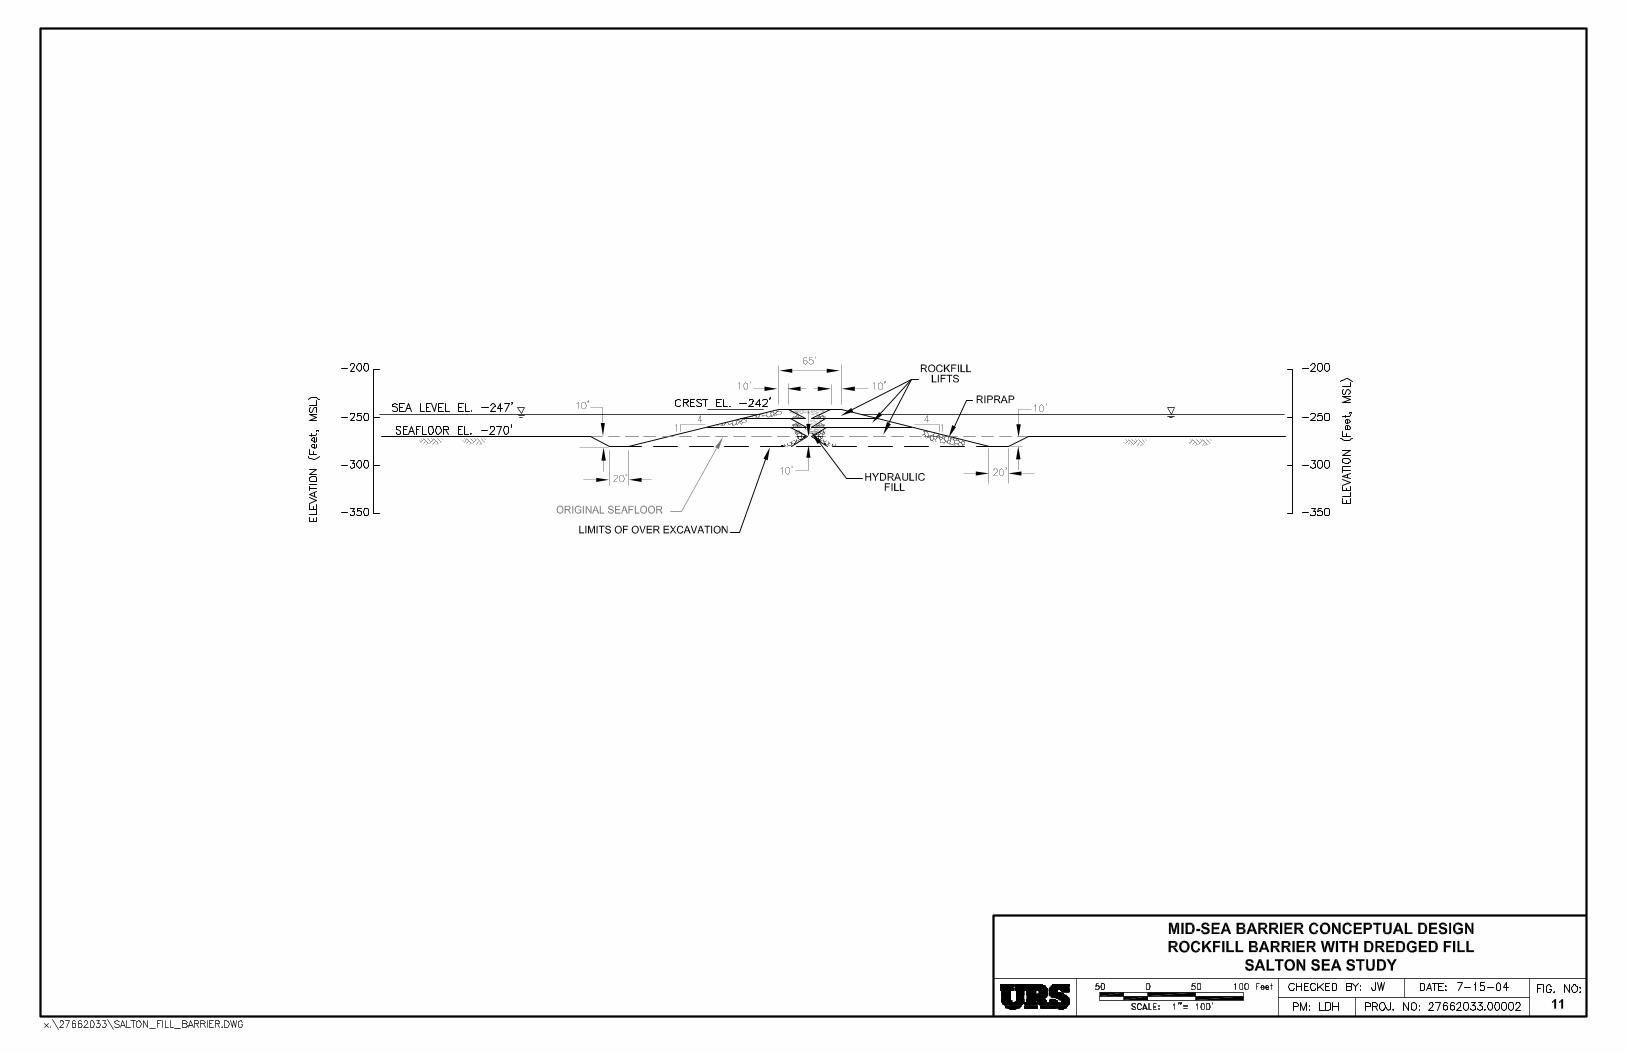
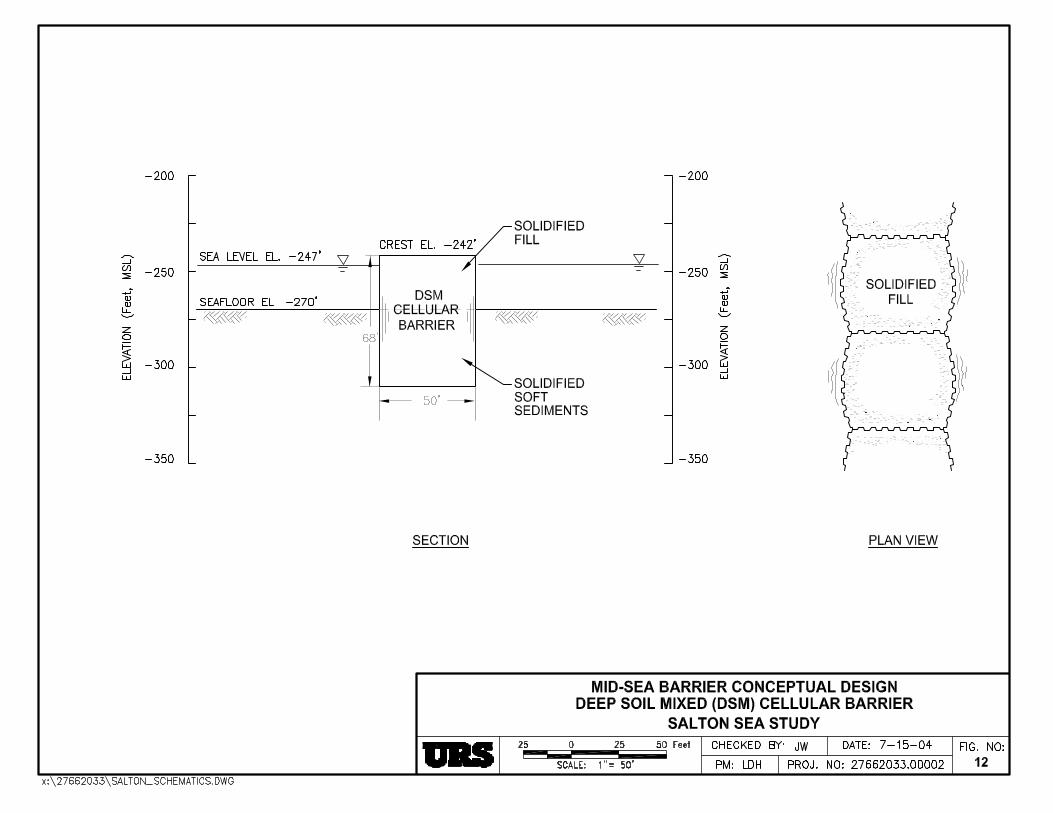
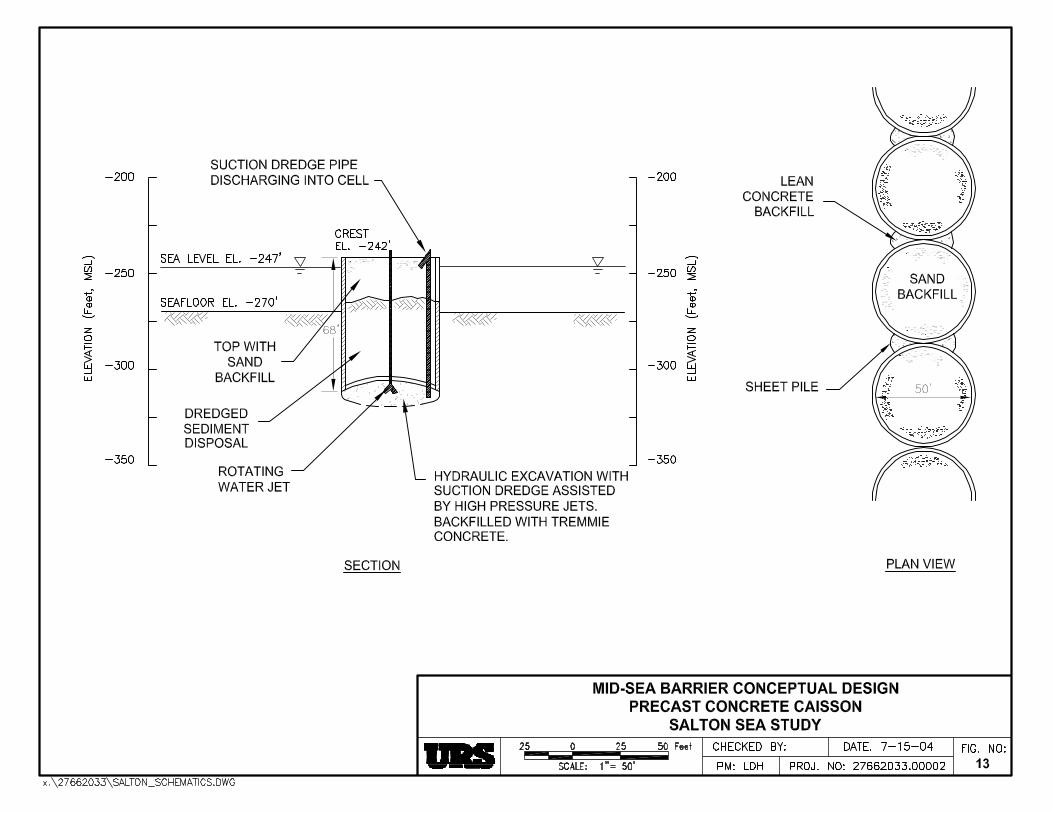
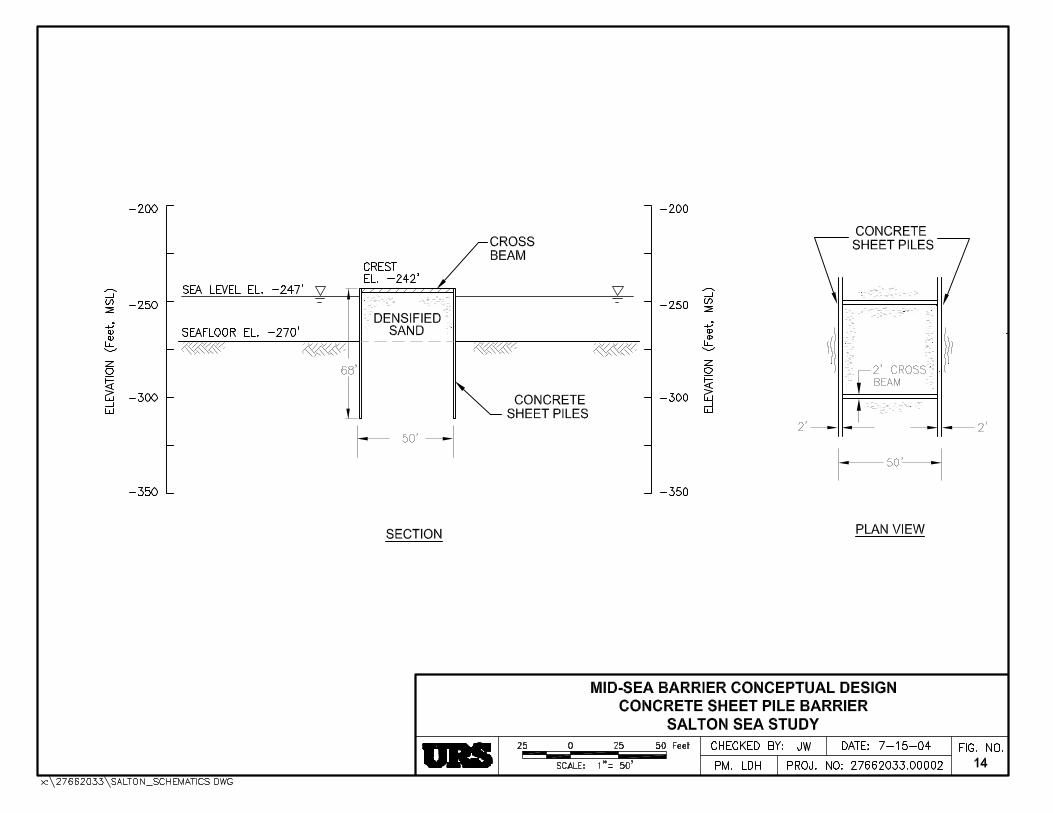
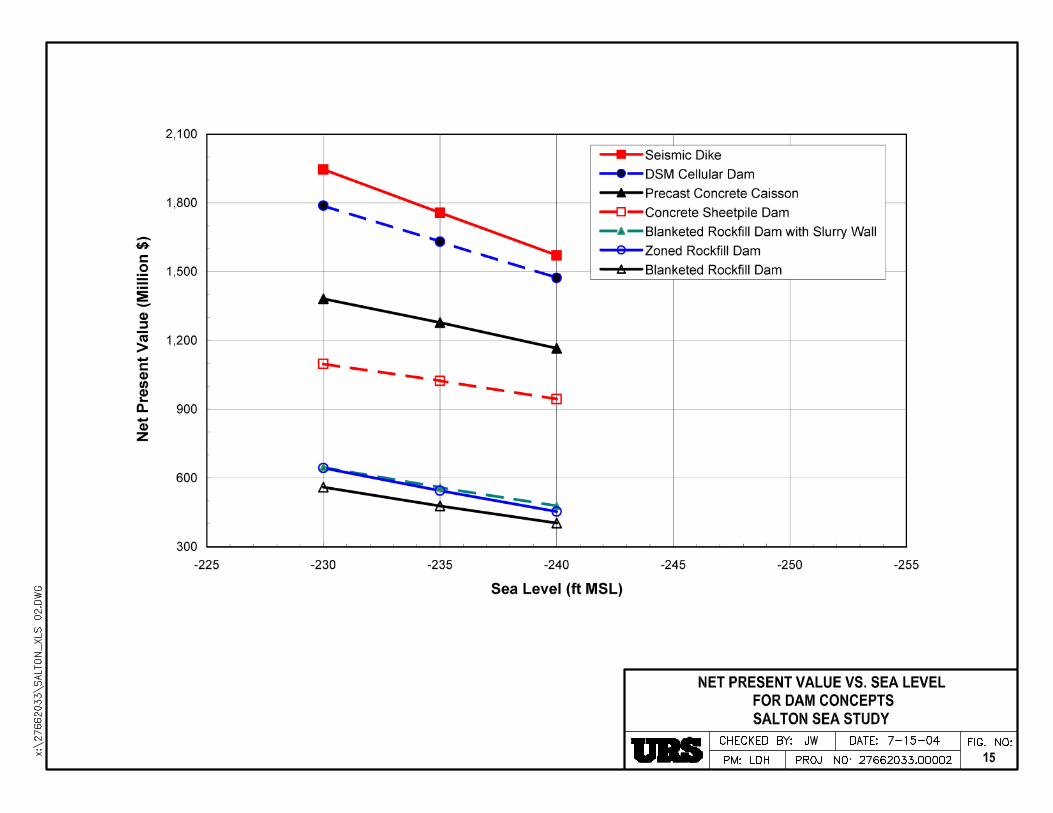
APPENDIXA Static Slope Stability Analyses
W:\27662033\00002-a-r.doc\21-Sep-04\SDG
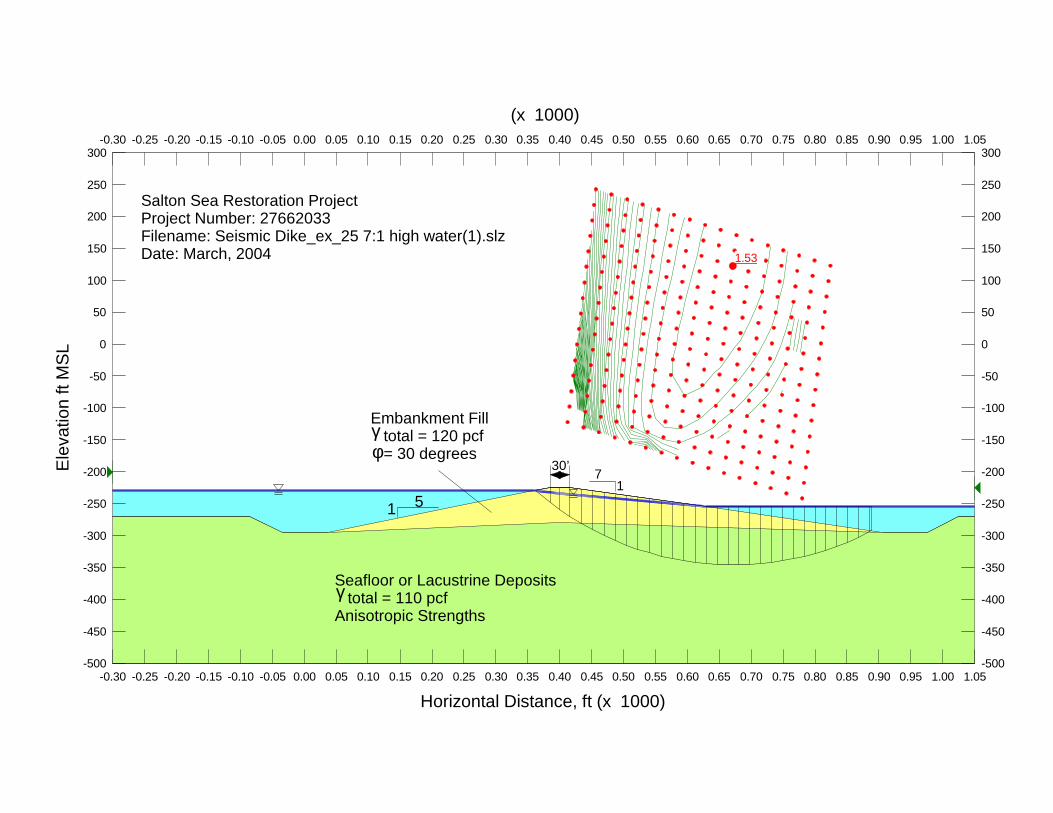
1.53
Salton Sea Restoration Project Project Number: 27662033Filename: Seismic Dike_ex_25 7:1 high water(1).slzDate: March, 2004
71
Seafloor or Lacustrine Deposits total = 110 pcfAnisotropic Strengths
γ
Embankment Fill total = 120 pcf = 30 degreesγφ
30’
1 5
Horizontal Distance, ft (x 1000)
-0.30 -0.25 -0.20 -0.15 -0.10 -0.05 0.00 0.05 0.10 0.15 0.20 0.25 0.30 0.35 0.40 0.45 0.50 0.55 0.60 0.65 0.70 0.75 0.80 0.85 0.90 0.95 1.00 1.05-500
-450
-400
-350
-300
-250
-200
-150
-100
-50
0
50
100
150
200
250
300
(x 1000)-0.30 -0.25 -0.20 -0.15 -0.10 -0.05 0.00 0.05 0.10 0.15 0.20 0.25 0.30 0.35 0.40 0.45 0.50 0.55 0.60 0.65 0.70 0.75 0.80 0.85 0.90 0.95 1.00 1.05
Ele
vatio
n ft
MS
L
-500
-450
-400
-350
-300
-250
-200
-150
-100
-50
0
50
100
150
200
250
300
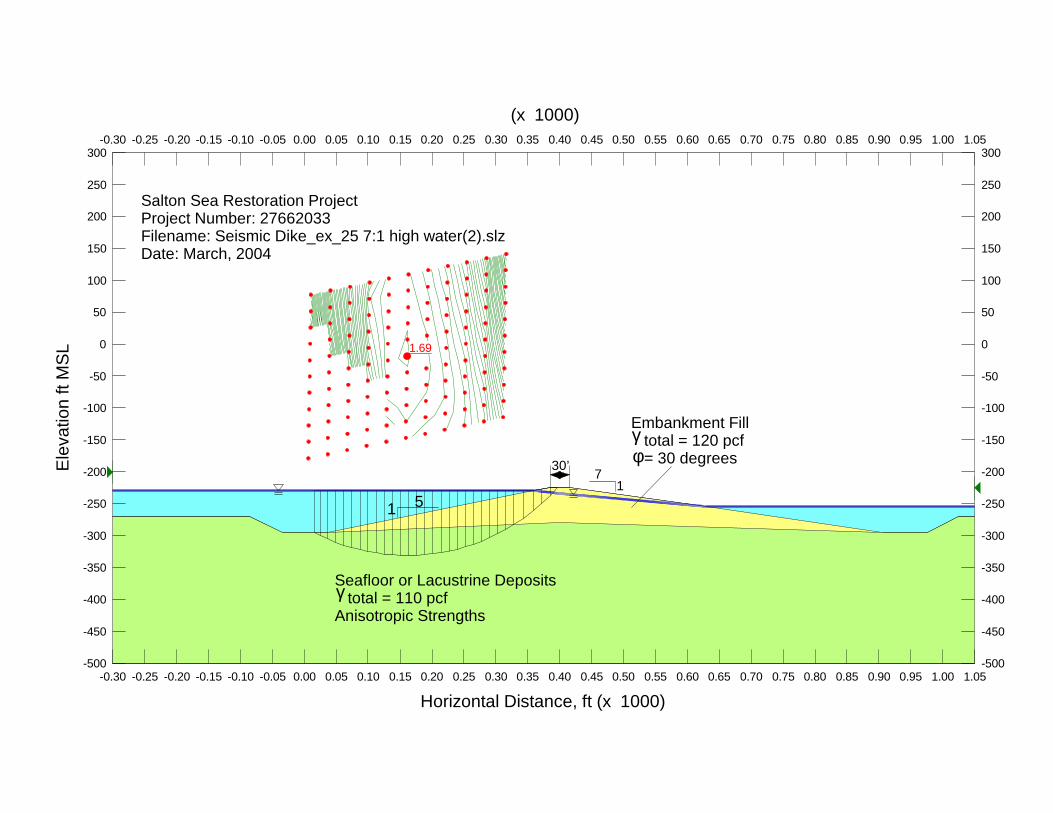
1.69
Salton Sea Restoration Project Project Number: 27662033Filename: Seismic Dike_ex_25 7:1 high water(2).slzDate: March, 2004
71
Seafloor or Lacustrine Deposits total = 110 pcfAnisotropic Strengths
γ
Embankment Fill total = 120 pcf = 30 degreesγφ
30’
1 5
Horizontal Distance, ft (x 1000)
-0.30 -0.25 -0.20 -0.15 -0.10 -0.05 0.00 0.05 0.10 0.15 0.20 0.25 0.30 0.35 0.40 0.45 0.50 0.55 0.60 0.65 0.70 0.75 0.80 0.85 0.90 0.95 1.00 1.05-500
-450
-400
-350
-300
-250
-200
-150
-100
-50
0
50
100
150
200
250
300
(x 1000)-0.30 -0.25 -0.20 -0.15 -0.10 -0.05 0.00 0.05 0.10 0.15 0.20 0.25 0.30 0.35 0.40 0.45 0.50 0.55 0.60 0.65 0.70 0.75 0.80 0.85 0.90 0.95 1.00 1.05
Ele
vatio
n ft
MS
L
-500
-450
-400
-350
-300
-250
-200
-150
-100
-50
0
50
100
150
200
250
300
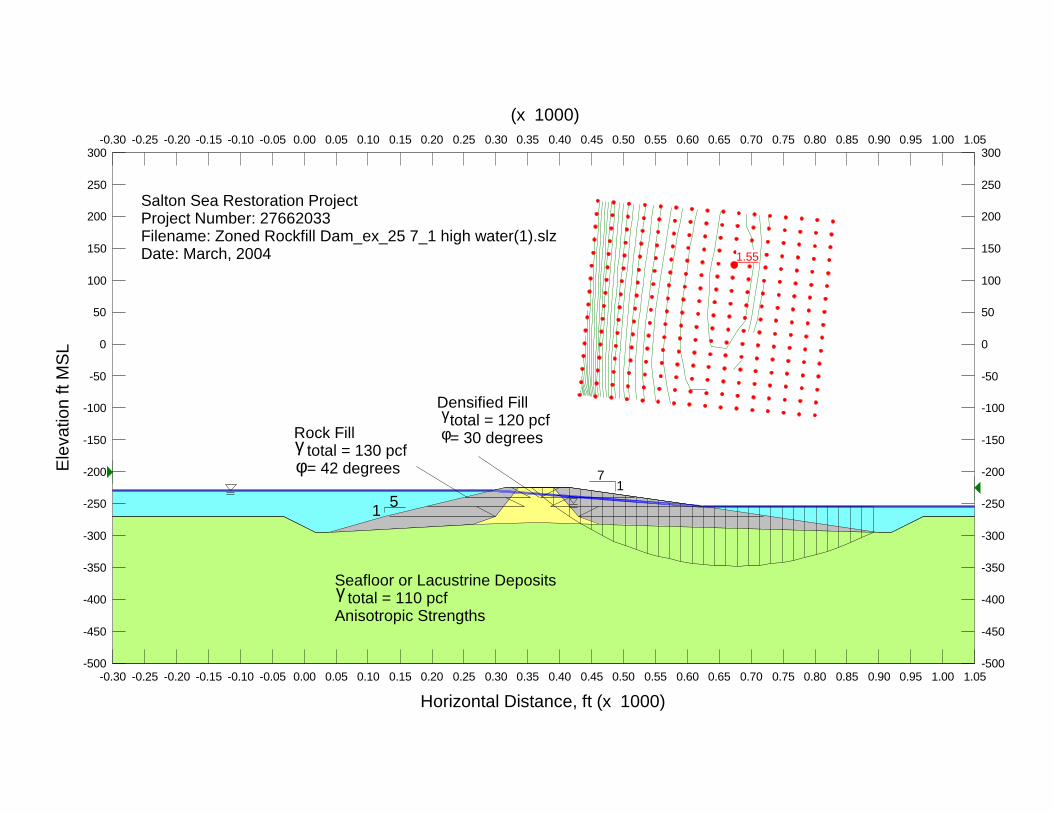
1.55
Salton Sea Restoration Project Project Number: 27662033Filename: Zoned Rockfill Dam_ex_25 7_1 high water(1).slzDate: March, 2004
71
Seafloor or Lacustrine Deposits total = 110 pcfAnisotropic Strengths
γ
Rock Fill total = 130 pcf = 42 degreesγφ
Densified Fill total = 120 pcf = 30 degreesφγ
1 5
Horizontal Distance, ft (x 1000)
-0.30 -0.25 -0.20 -0.15 -0.10 -0.05 0.00 0.05 0.10 0.15 0.20 0.25 0.30 0.35 0.40 0.45 0.50 0.55 0.60 0.65 0.70 0.75 0.80 0.85 0.90 0.95 1.00 1.05-500
-450
-400
-350
-300
-250
-200
-150
-100
-50
0
50
100
150
200
250
300
(x 1000)-0.30 -0.25 -0.20 -0.15 -0.10 -0.05 0.00 0.05 0.10 0.15 0.20 0.25 0.30 0.35 0.40 0.45 0.50 0.55 0.60 0.65 0.70 0.75 0.80 0.85 0.90 0.95 1.00 1.05
Ele
vatio
n ft
MS
L
-500
-450
-400
-350
-300
-250
-200
-150
-100
-50
0
50
100
150
200
250
300
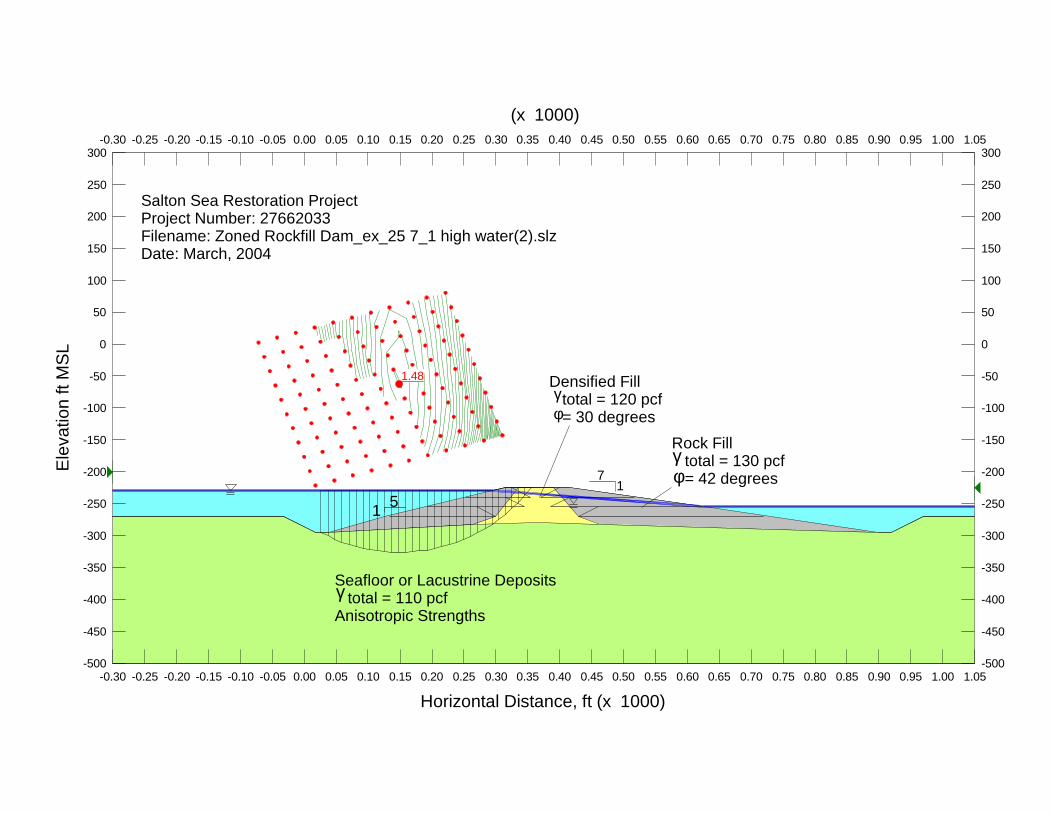
1.48
Salton Sea Restoration Project Project Number: 27662033Filename: Zoned Rockfill Dam_ex_25 7_1 high water(2).slzDate: March, 2004
71
Seafloor or Lacustrine Deposits total = 110 pcfAnisotropic Strengths
γ
Rock Fill total = 130 pcf = 42 degreesγφ
Densified Fill total = 120 pcf = 30 degreesφγ
1 5
Horizontal Distance, ft (x 1000)
-0.30 -0.25 -0.20 -0.15 -0.10 -0.05 0.00 0.05 0.10 0.15 0.20 0.25 0.30 0.35 0.40 0.45 0.50 0.55 0.60 0.65 0.70 0.75 0.80 0.85 0.90 0.95 1.00 1.05-500
-450
-400
-350
-300
-250
-200
-150
-100
-50
0
50
100
150
200
250
300
(x 1000)-0.30 -0.25 -0.20 -0.15 -0.10 -0.05 0.00 0.05 0.10 0.15 0.20 0.25 0.30 0.35 0.40 0.45 0.50 0.55 0.60 0.65 0.70 0.75 0.80 0.85 0.90 0.95 1.00 1.05
Ele
vatio
n ft
MS
L
-500
-450
-400
-350
-300
-250
-200
-150
-100
-50
0
50
100
150
200
250
300
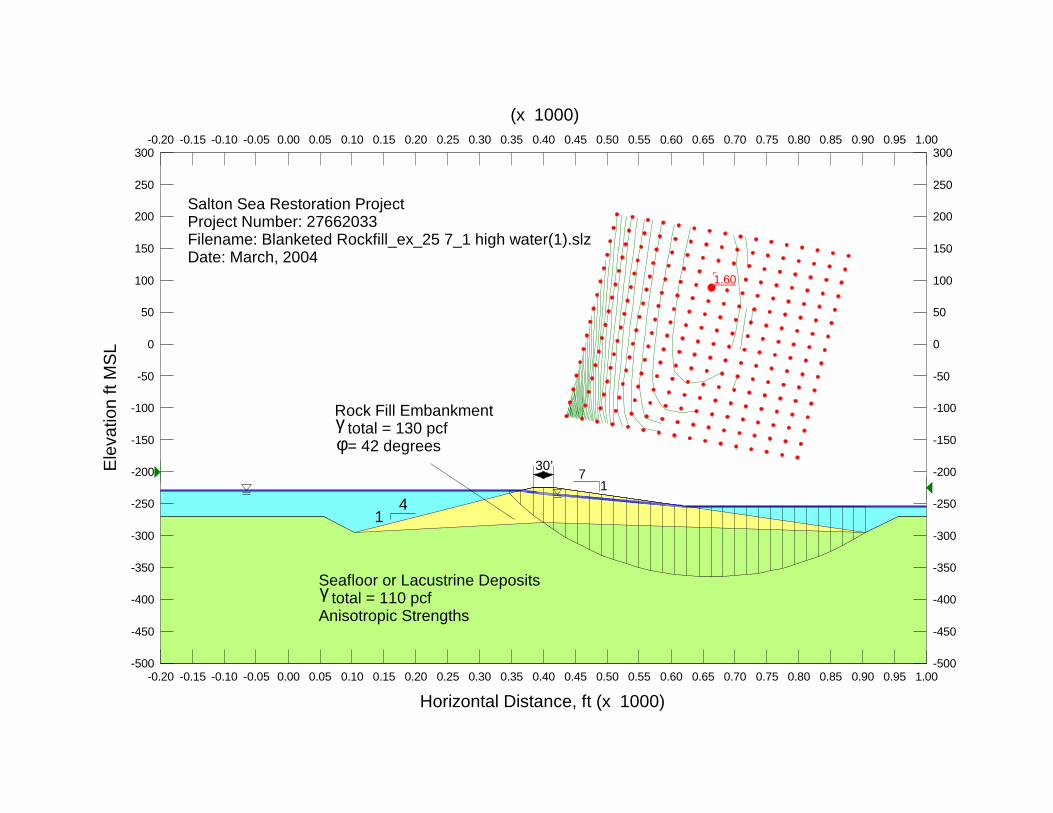
1.60
Salton Sea Restoration Project Project Number: 27662033Filename: Blanketed Rockfill_ex_25 7_1 high water(1).slzDate: March, 2004
71
Seafloor or Lacustrine Deposits total = 110 pcfAnisotropic Strengths
γ
Rock Fill Embankment total = 130 pcf = 42 degreesγφ
30’
14
Horizontal Distance, ft (x 1000)
-0.20 -0.15 -0.10 -0.05 0.00 0.05 0.10 0.15 0.20 0.25 0.30 0.35 0.40 0.45 0.50 0.55 0.60 0.65 0.70 0.75 0.80 0.85 0.90 0.95 1.00-500
-450
-400
-350
-300
-250
-200
-150
-100
-50
0
50
100
150
200
250
300
(x 1000)-0.20 -0.15 -0.10 -0.05 0.00 0.05 0.10 0.15 0.20 0.25 0.30 0.35 0.40 0.45 0.50 0.55 0.60 0.65 0.70 0.75 0.80 0.85 0.90 0.95 1.00
Ele
vatio
n ft
MS
L
-500
-450
-400
-350
-300
-250
-200
-150
-100
-50
0
50
100
150
200
250
300
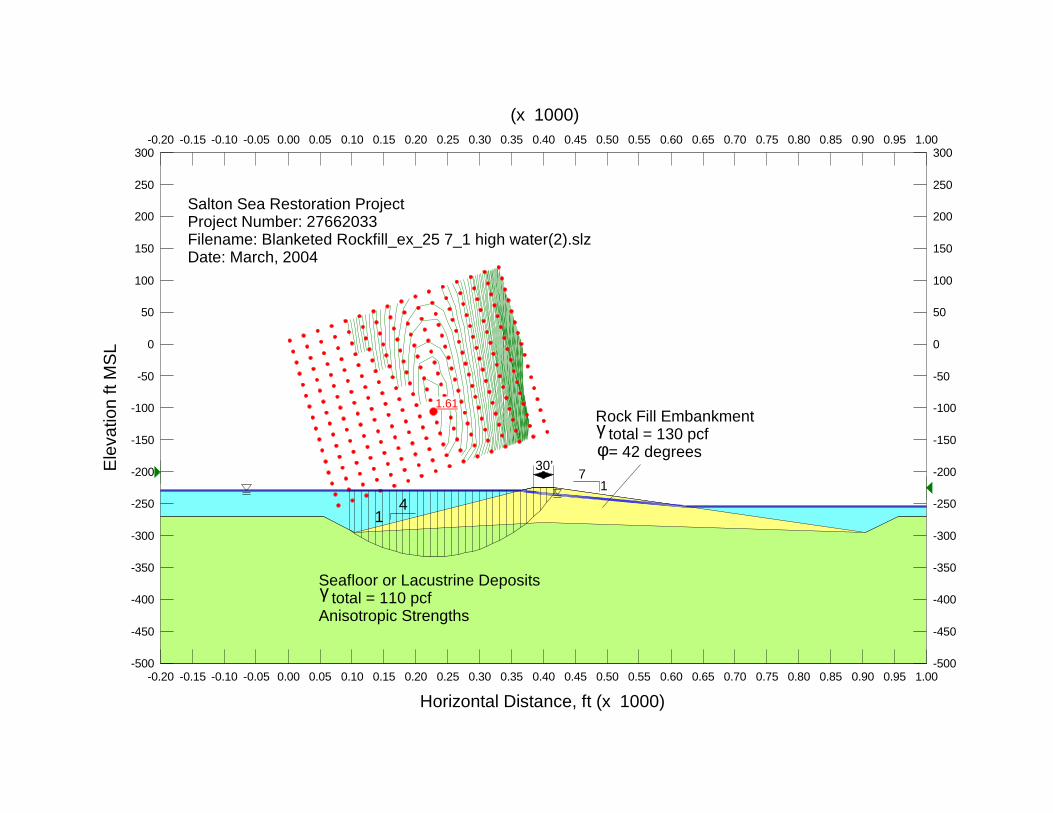
1.61
Salton Sea Restoration Project Project Number: 27662033Filename: Blanketed Rockfill_ex_25 7_1 high water(2).slzDate: March, 2004
71
Seafloor or Lacustrine Deposits total = 110 pcfAnisotropic Strengths
γ
Rock Fill Embankment total = 130 pcf = 42 degreesγφ
30’
14
Horizontal Distance, ft (x 1000)
-0.20 -0.15 -0.10 -0.05 0.00 0.05 0.10 0.15 0.20 0.25 0.30 0.35 0.40 0.45 0.50 0.55 0.60 0.65 0.70 0.75 0.80 0.85 0.90 0.95 1.00-500
-450
-400
-350
-300
-250
-200
-150
-100
-50
0
50
100
150
200
250
300
(x 1000)-0.20 -0.15 -0.10 -0.05 0.00 0.05 0.10 0.15 0.20 0.25 0.30 0.35 0.40 0.45 0.50 0.55 0.60 0.65 0.70 0.75 0.80 0.85 0.90 0.95 1.00
Ele
vatio
n ft
MS
L
-500
-450
-400
-350
-300
-250
-200
-150
-100
-50
0
50
100
150
200
250
300
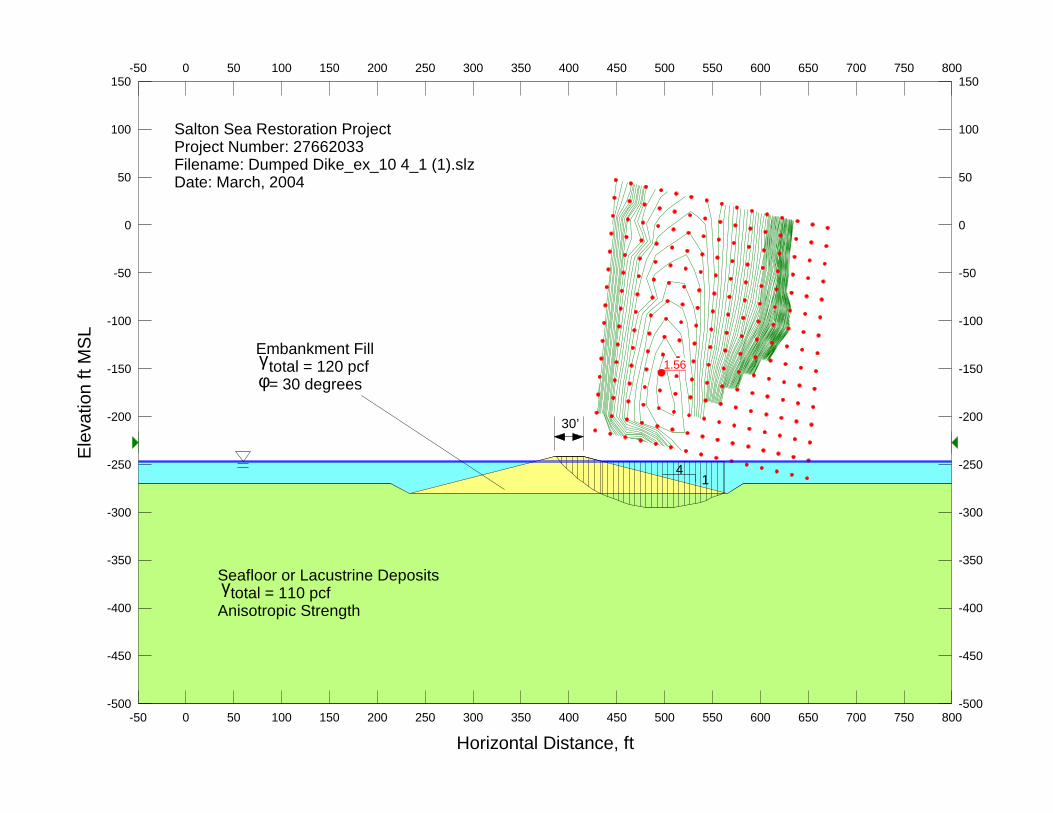
1.56
Salton Sea Restoration Project Project Number: 27662033Filename: Dumped Dike_ex_10 4_1 (1).slzDate: March, 2004
41
Seafloor or Lacustrine Deposits total = 110 pcfAnisotropic Strengthγ
Embankment Fill total = 120 pcf = 30 degrees
γφ
30’
Horizontal Distance, ft
-50 0 50 100 150 200 250 300 350 400 450 500 550 600 650 700 750 800-500
-450
-400
-350
-300
-250
-200
-150
-100
-50
0
50
100
150-50 0 50 100 150 200 250 300 350 400 450 500 550 600 650 700 750 800
Ele
vatio
n ft
MS
L
-500
-450
-400
-350
-300
-250
-200
-150
-100
-50
0
50
100
150
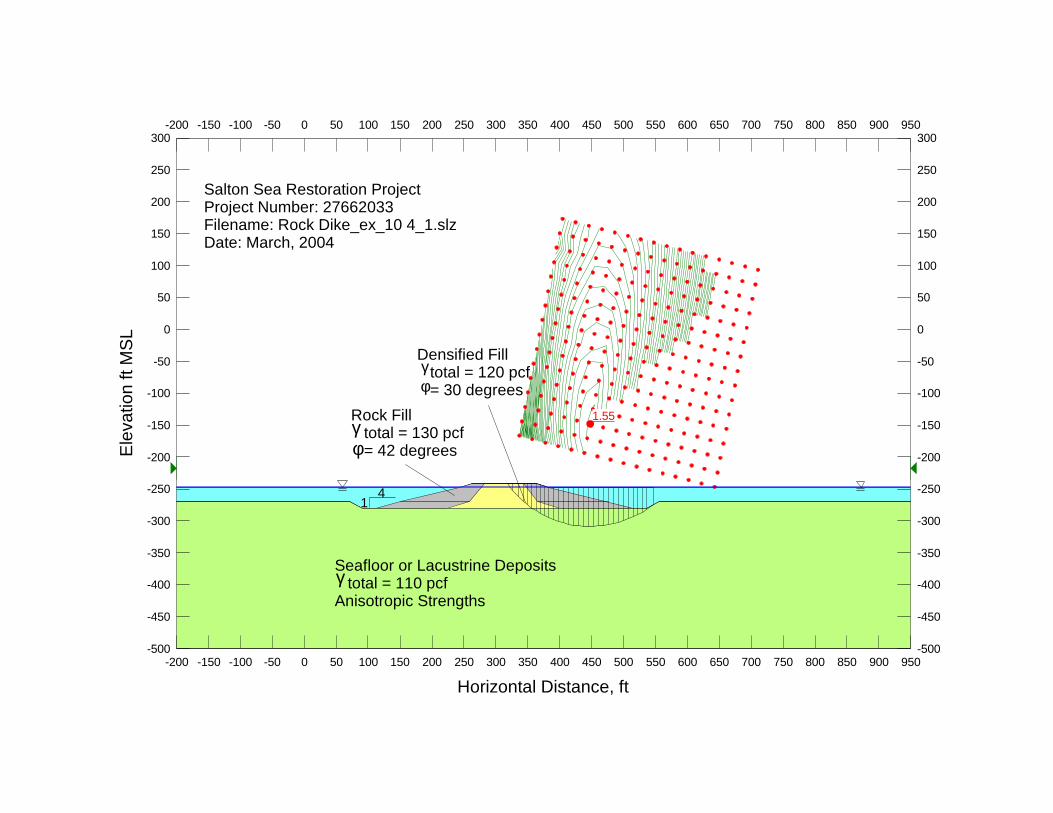
1.55
Salton Sea Restoration Project Project Number: 27662033Filename: Rock Dike_ex_10 4_1.slzDate: March, 2004
41
Seafloor or Lacustrine Deposits total = 110 pcfAnisotropic Strengthsγ
Rock Fill total = 130 pcf = 42 degreesγφ
Densified Fill total = 120 pcf = 30 degreesφγ
Horizontal Distance, ft
-200 -150 -100 -50 0 50 100 150 200 250 300 350 400 450 500 550 600 650 700 750 800 850 900 950-500
-450
-400
-350
-300
-250
-200
-150
-100
-50
0
50
100
150
200
250
300-200 -150 -100 -50 0 50 100 150 200 250 300 350 400 450 500 550 600 650 700 750 800 850 900 950
Ele
vatio
n ft
MS
L
-500
-450
-400
-350
-300
-250
-200
-150
-100
-50
0
50
100
150
200
250
300
APPENDIXB Engineering Workshop Biographical Sketches
W:\27662033\00002-a-r.doc\21-Sep-04\SDG
APPENDIXB Engineering Workshop Biographical Sketches
W:\27662033\00002-a-r.doc\21-Sep-04\SDG B-1
This Appendix contains biographical sketches of the participants at the engineering workshop held on March 23, 2004 in Ontario, California.
Mr. Leo D. Handfelt (Moderator) is a registered civil and geotechnical engineer with URS and over 26 years of engineering experience on complex infrastructure projects throughout southern California and the world. He has worked on numerous projects involving marine construction including new reclamations in the Ports of Los Angeles, Long Beach and San Diego, and the new International Airport in Hong Kong. Practicing in southern California he is fully aware of the seismic design considerations for new reclamations and embankments and methods to mitigate potential hazards. Late last year he was part of a team that performed a due diligence review of the proposed lining projects for the All-American and Coachella Canals. He has also managed the recently completed preliminary geotechnical investigation for the Salton Sea Restoration Project. He received the American Society of Civil Engineering (ASCE) Thomas A. Middlebrooks Award for co-authoring what was judged to be the most outstanding paper published in ASCE’s 1988 Geotechnical Engineering Journal.
William Brownlie Ph.D., P.E. (Co-Moderator) joined Tetra Tech in 1981, and has extensive experience in engineering and program management for water resource projects. He specializes in performance and oversight of major multidisciplinary environmental, civil engineering, and planning investigations. These programs have required preparation of environmental impact documentation, planning studies, environmental engineering design and analysis, and hazardous materials management. Dr. Brownlie has also conducted a large number of watershed management and river and coastal hydraulic engineering projects, including flood hazard assessments and assessments of the environmental effects of water resources programs. Dr. Brownlie participated in the development and validation of a DoD approved cost/schedule control system.
Mr. Jack L. Delp, P.E. is a registered civil engineer and retired from the Bureau of Reclamation in May 2000 and currently is employed by Reclamation for his knowledge and experience in construction management and project development. He had over 37 years with Reclamation on major water resource projects in the states of California and Nevada. Projects consisting of Central Valley Project, California; Southern Nevada Water Project, Second Stage, Nevada; and Boulder Canyon Project, Arizona – Nevada. Responsible Construction Engineer for construction management activities including projects as the Hoover Dam Spillway Modifications, construction of Headgate Rock Power Plant and related facilities, including diversion facilities in Colorado River, Hoover Dam Uprating Program, and Hoover Dam Visitor Center Complex. Currently is representing Reclamation Lower Colorado Regional Engineer as Civil Engineering Consultant on the Coachella Canal and All American Canal Lining Projects.
Mr. Michael P. Forrest, P.E. is a registered civil and geotechnical engineer with URS and has over 34 years of engineering experience. His wide range of responsibilities has included managing site selection studies, geotechnical investigations, feasibility studies, alternatives evaluation, conceptual and final designs, and construction management. He has lead multi-disciplinary teams and has managed many projects for design of major embankment and roller compacted concrete (RCC) dams, tunnels and canals, and has extensive experience in treatment of both soil and rock foundations. He has been extensively involved on projects requiring state and federal agency approvals. Mr. Forrest was the lead dam designer for the Diamond Valley Lake Project in Riverside County. He is currently the project manager for the In-Delta
APPENDIXB Engineering Workshop Biographical Sketches
W:\27662033\00002-a-r.doc\21-Sep-04\SDG B-2
Storage Project, which is a feasibility study for constructing reservoir embankments on very soft clay and peat and loose sands.
Mr. Richard R. Davidson, P.E. is currently Director of the global Geo-Engineering Technology for URS. He has been involved with all types of dams for over twenty-nine years. His breadth of experience ranges from building some of the largest earth-rockfill dams in the United States to rehabilitating century-old puddle clay core dams and masonry dams in Australia, to stabilizing landslides affecting water retention and tailings dams in New Zealand and Peru. He has worked extensively for the Corps of Engineers, Bureau of Reclamation, Goulburn-Murray Water and many major dam owners throughout the world. Mr. Davidson has special expertise in design, dam safety, risk assessments and triple bottom line risk management, hydro power projects, dam rehabilitation, slurry wall cutoffs, landslides, seismic behavior of embankment dams, tailings dams, cofferdams, instrumentation. Relevant to the Salton Sea project, he has extensive experience with building embankments on soft soils such as the Kennecott North Expansion project built out on Salt Lake sediments, Storz Expressway in Omaha, Jackson Lake Dam remediation in Wyoming, Grizzly Gulch dam in South Dakota, and many tailings dams all over the world. He has lectured on various foundation improvement technologies and will be presenting the state of the art at the upcoming professional meeting in St Louis.
Mr. Joseph Ehasz, P.E. is a registered professional civil engineer in California and 29 other states with Washington Group and has 36 years of experience in civil engineering, design and construction aspects of water resources and hydroelectric facilities, dams, tunnels, and power plants. He has the unique capability of understanding both design and construction aspects of projects, from his own experience, and uses that experience in his role as Senior Reviewer. Currently he is the Project Manager assisting the Division of Engineering on the South Delta Improvement Program (SDIP) for the Department of Water Resources, State of California. Recently he served as the Project Construction Manager for the Olivenhain Dam, a 310-foot high RCC Dam, for the San Diego County Water Authority in North San Diego County. He also served as the Design Director for Washington Group on the Metropolitan Water District’s $2 billion Diamond Valley Lake Project, as well as the Owner’s Construction Manager for dams. Mr. Ehasz was also on the Board of Consultants for the $1 billion San Roque Power Project in the Philippines that involved over seven miles of tunnels and adits as well as 200 meter-high embankment dam and 350 MW Power Plant. Mr. Ehasz is a member of U.S. Society on Dams and serves as the Chairman of the Committee on Earthquake Design of Dams. In addition, Mr. Ehasz serves on several FERC Boards of Technical Review on new as well as rehabilitation of dams and hydraulic structures.
Mr. Robert Hall, P.E. is a registered civil with Tetra Tech and has 38 years of experience in the design and construction of multipurpose public works. As Chief of the Design group of the Los Angeles District Corps of Engineers for the 15 years before he retired from government service in 1998, Mr. Hall was responsible for the design of numerous debris basins, and water detention and conveyance facilities. These included new basins in the Phoenix vicinity, Dreamy Draw, Adobe, New River and Cave Creek Dams; new detention basins in the Las Vegas area, Tropicana and Blue Diamond; a new dam in San Bernardino County, Seven Oaks Dam; and major modifications to existing dams, Prado Dam in Riverside County and Painted Rock Dam in Arizona.
Mr. Robert Lofgren is a consulting civil engineer that has been involved with clamshell and hydraulic dredging since 1956. He has been responsible for estimating and managing hundreds of dredging projects,
APPENDIXB Engineering Workshop Biographical Sketches
W:\27662033\00002-a-r.doc\21-Sep-04\SDG B-3
primarily on the West coast of the United States, but also in Canada, Brazil and Iraq. He has also been responsible for the design and building of numerous hydraulic dredges. He has worked on new reclamation fills in the Ports of Oakland, Los Angeles and Long Beach, and beach nourishment projects in Sunset Beach, Port Hueneme, Ventura, and El Segundo (all in California). He was also involved in the work required to restore navigation and flood control channels following the eruption of Mt. St. Helens.
Dr. Wolfgang Roth, P.E. with URS and has 34 years of experience in geotechnical engineering. One of his specialty areas of expertise is the seismic-performance assessment of earthen structures, such as embankment dams, slopes and earth retaining walls. In the early 1980s, Dr. Roth directed a NSF-sponsored research project in a joint venture with Caltech, involving the development of an advanced servo-hydraulic centrifuge shaker, which since has been adopted as prototype by major research institutions worldwide. The scope of this project also included the testing of simple, practice-oriented, nonlinear constitutive laws for their ability to predict shaking-induced permanent deformations of dams. This work, eventually, lead to the first practical application of nonlinear dynamic, effective-stress modeling in 1985, for the seismic-stability assessment of Pleasant Valley Dam for the Los Angeles Department of Water & Power. In 1991/92, Dr. Roth participated in the NSF-sponsored Verification of Liquefaction Analysis by Centrifuge Studies (VELACS); and, with the work performed for Pier J, Port of Long Beach, he also spearheaded the practical application of dynamic, nonlinear soil-structure interaction analyses for pile-supported wharves. Dr. Roth taught graduate geotechnical engineering courses in 1976 and 1977 at the Catholic University of Rio de Janeiro, Brazil, and he has published numerous technical papers and given invited lectures on the subject of seismic analysis of earthen structures and other topics.
Mr. Rob Stroop, P.E. is a registered civil and geotechnical engineer with URS and has over 15 years of engineering experience. Mr. Stroop has been a design manager, team leader, and project engineer on individual geotechnical consulting assignments and multidisciplinary civil engineering projects throughout California and the world. He has worked within diverse and unusual geologic environments that ranged from the saprolites of Hong Kong, the micaceous sands of Bangladesh, the hydro-thermally altered soils of New Zealand and Indonesia and the saline “Sabkha” deposits found in the Middle East. Mr. Stroop has managed the geotechnical analysis and design for projects with characteristics that are similar to the Salton Sea Restoration, such as investigating marine subsurface conditions and the design of improvements on large reclamations. He contributed to the preliminary geotechnical investigation for the Salton Sea Restoration Project.
Mr. Roy Watts is an experienced construction manager, skilled in project controls, construction planning, construction cost estimating and scheduling and claims avoidance. In the past 29 years, 10 with URS, he has acquired diversified experience in design and construction of projects involving dams, canals, transportation and mine closure. Additional responsibilities include construction implementation and quality control, scheduling all levels of project development, construction conceptual and final design cost estimates, planning and scheduling. He is proficient in the use of electronic project management, cost estimating and scheduling software.
Mr. Javier Weckmann P.E. with Tetra Tech has over 25 years of experience in coastal, civil and environmental planning and engineering. He has conducted the remedial investigations, feasibility studies, engineering, design, and planning for several civil design and remedial implementation projects. His responsibilities, on projects such as the Stringfellow and McColl Superfund sites, as well various
APPENDIXB Engineering Workshop Biographical Sketches
W:\27662033\00002-a-r.doc\21-Sep-04\SDG B-4
former MGP sites, have included: dredging analyses, erosion assessments, landfill design, groundwater pump and treat systems, surface runoff control channels, and contaminated soil excavation, treatment, and disposal. Mr. Weckmann has also managed asbestos and other hazardous material abatement projects. His hazardous waste experience includes abatement and remedial action projects for private/commercial clients and for government agencies, such as Inland Valley Development Agency, NORCAL, The Gas Company (Sempra), California EPA- DTSC, and U.S. Air Force. Mr. Weckmann also has provided construction management services on the majority of his projects, and has followed through to completion.
Mr. Richard L. Wiltshire, P.E. is a registered professional (civil/geotechnical) engineer with over 25 years of experience with the U.S. Bureau of Reclamation at its Denver Office. As a Senior Engineer and Principal Designer, he has been responsible for a number of embankment dam projects that involved investigations, analyses, designs, plans, and specifications for replacement of or modifications to existing dams belonging to Reclamation and the Bureau of Indian Affairs located in Colorado, Idaho, Montana, New Mexico, and Utah. Mr. Wiltshire has also directed Reclamation’s technical assistance work on six EPA Superfund sites, including site investigations, analyses, evaluations, remedial designs, and design oversight during construction. He has been a member of Reclamation’s Salton Sea Restoration Project team for over five years. Mr. Wiltshire is a member of the U.S. Society on Dams and serves as Vice-Chairman of its ICOLD Papers Committee.
Mssrs. Frank Bechtold, and Ken Feldhacker (dredging superintendent and dredging engineer, respectively, with Manson Construction Company) also participated in the workshop. Biographical sketches were not available for these individuals.

APPENDIXC Appraisal Level Cost Estimates - Dam Concepts
W:\27662033\00002-a-r.doc\21-Sep-04\SDG
APPENDIXC Appraisal Level Cost Estimates - Dam Concepts
W:\27662033\00002-a-r.doc\21-Sep-04\SDG
For Sea Level at -230 Feet MSL
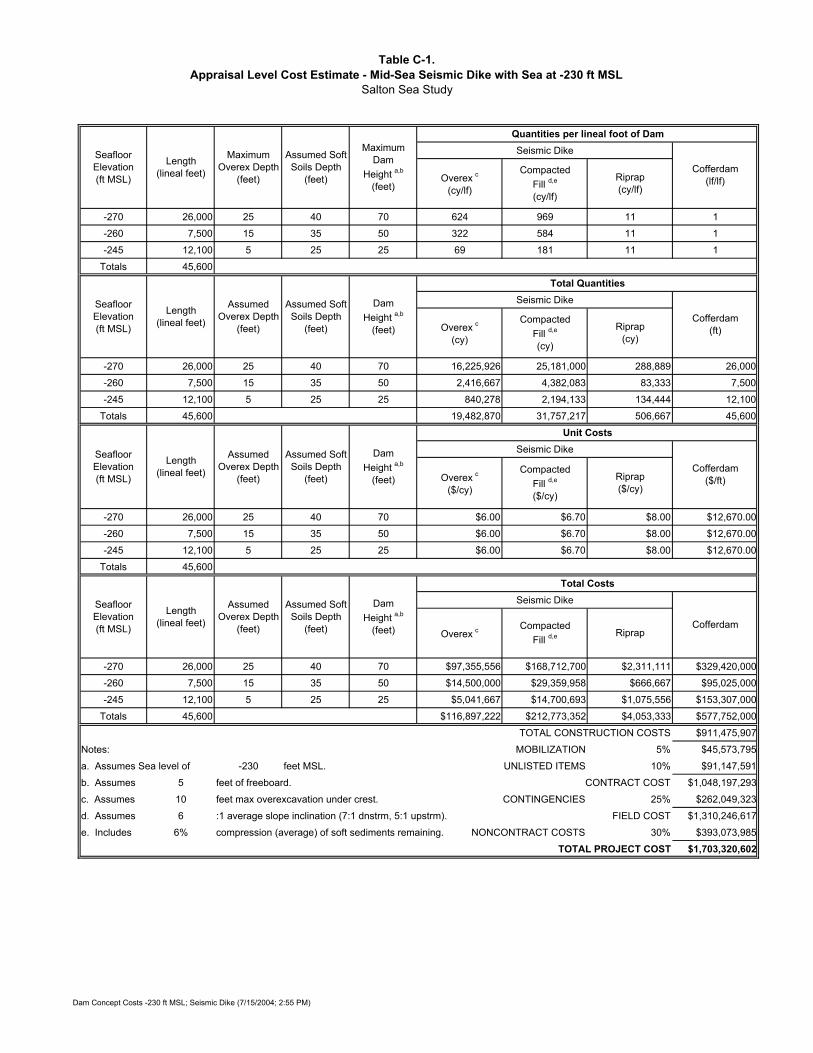
Table C-1.Appraisal Level Cost Estimate - Mid-Sea Seismic Dike with Sea at -230 ft MSL
Salton Sea Study
Quantities per lineal foot of DamSeismic Dike
-270 26,000 25 40 70 624 969 11 1
-260 7,500 15 35 50 322 584 11 1
-245 12,100 5 25 25 69 181 11 1
Totals 45,600
Total QuantitiesSeismic Dike
-270 26,000 25 40 70 16,225,926 25,181,000 288,889 26,000
-260 7,500 15 35 50 2,416,667 4,382,083 83,333 7,500
-245 12,100 5 25 25 840,278 2,194,133 134,444 12,100
Totals 45,600 19,482,870 31,757,217 506,667 45,600
Unit CostsSeismic Dike
-270 26,000 25 40 70 $6.00 $6.70 $8.00 $12,670.00
-260 7,500 15 35 50 $6.00 $6.70 $8.00 $12,670.00
-245 12,100 5 25 25 $6.00 $6.70 $8.00 $12,670.00
Totals 45,600
Total CostsSeismic Dike
-270 26,000 25 40 70 $97,355,556 $168,712,700 $2,311,111 $329,420,000
-260 7,500 15 35 50 $14,500,000 $29,359,958 $666,667 $95,025,000
-245 12,100 5 25 25 $5,041,667 $14,700,693 $1,075,556 $153,307,000
Totals 45,600 $116,897,222 $212,773,352 $4,053,333 $577,752,000
TOTAL CONSTRUCTION COSTS $911,475,907
Notes: MOBILIZATION 5% $45,573,795
a. Assumes Sea level of -230 feet MSL. UNLISTED ITEMS 10% $91,147,591
b. Assumes 5 feet of freeboard. CONTRACT COST $1,048,197,293
c. Assumes 10 feet max overexcavation under crest. CONTINGENCIES 25% $262,049,323
d. Assumes 6 :1 average slope inclination (7:1 dnstrm, 5:1 upstrm). FIELD COST $1,310,246,617
e. Includes 6% compression (average) of soft sediments remaining. NONCONTRACT COSTS 30% $393,073,985
TOTAL PROJECT COST $1,703,320,602
CompactedFill d,e
(cy/lf)
Riprap(cy/lf)
Seafloor Elevation(ft MSL)
Length(lineal feet)
Maximum Overex Depth
(feet)
Maximum Dam
Height a,b
(feet)
Assumed Soft Soils Depth
(feet) Overex c
(cy/lf)
Seafloor Elevation(ft MSL)
Length(lineal feet)
Assumed Overex Depth
(feet)
DamHeight a,b
(feet)
Assumed Soft Soils Depth
(feet)
Seafloor Elevation(ft MSL)
Length(lineal feet)
Assumed Overex Depth
(feet)
DamHeight a,b
(feet)
Assumed Soft Soils Depth
(feet)
Seafloor Elevation(ft MSL)
Length(lineal feet)
Assumed Overex Depth
(feet)
DamHeight a,b
(feet) Overex cCompacted
Fill d,e Riprap
Assumed Soft Soils Depth
(feet)
Overex c
($/cy)
CompactedFill d,e
($/cy)
Riprap($/cy)
Riprap(cy)
Overex c
(cy)
CompactedFill d,e
(cy)
Cofferdam (lf/lf)
Cofferdam(ft)
Cofferdam($/ft)
Cofferdam
Dam Concept Costs -230 ft MSL; Seismic Dike (7/15/2004; 2:55 PM)
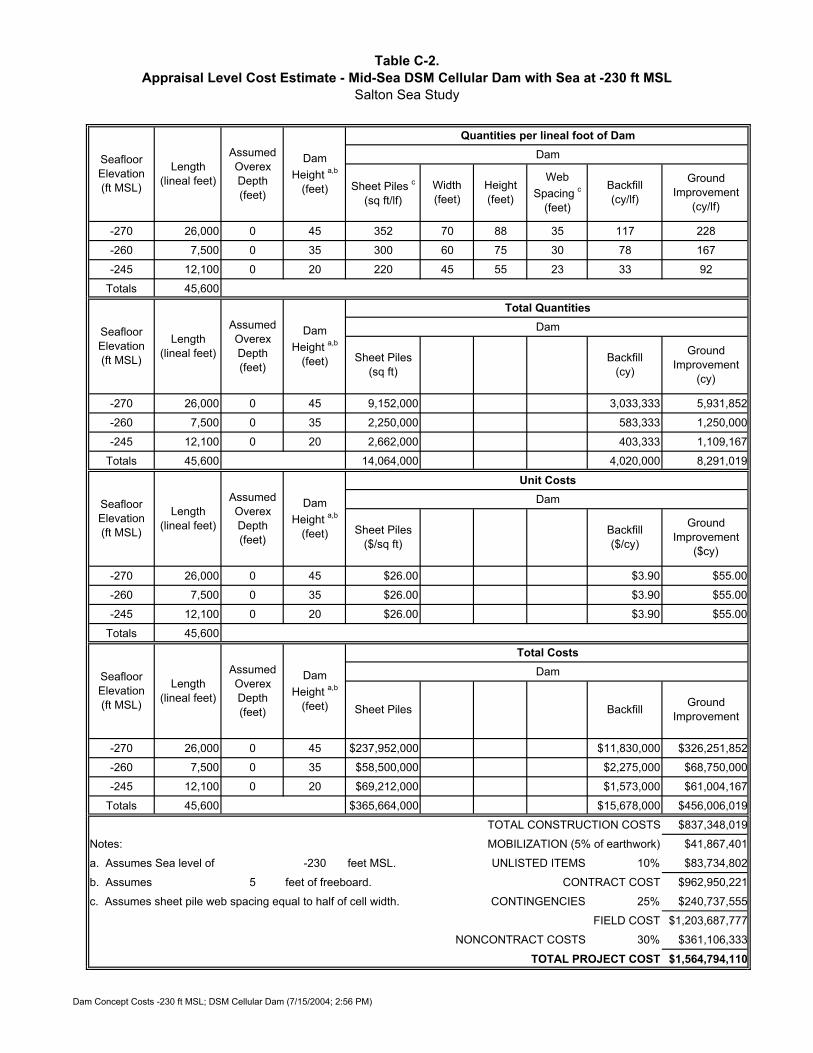
Table C-2.Appraisal Level Cost Estimate - Mid-Sea DSM Cellular Dam with Sea at -230 ft MSL
Salton Sea Study
Quantities per lineal foot of DamDam
-270 26,000 0 45 352 70 88 35 117 228
-260 7,500 0 35 300 60 75 30 78 167
-245 12,100 0 20 220 45 55 23 33 92
Totals 45,600
Total QuantitiesDam
-270 26,000 0 45 9,152,000 3,033,333 5,931,852
-260 7,500 0 35 2,250,000 583,333 1,250,000
-245 12,100 0 20 2,662,000 403,333 1,109,167
Totals 45,600 14,064,000 4,020,000 8,291,019
Unit CostsDam
-270 26,000 0 45 $26.00 $3.90 $55.00
-260 7,500 0 35 $26.00 $3.90 $55.00
-245 12,100 0 20 $26.00 $3.90 $55.00
Totals 45,600
Total CostsDam
-270 26,000 0 45 $237,952,000 $11,830,000 $326,251,852
-260 7,500 0 35 $58,500,000 $2,275,000 $68,750,000
-245 12,100 0 20 $69,212,000 $1,573,000 $61,004,167
Totals 45,600 $365,664,000 $15,678,000 $456,006,019
TOTAL CONSTRUCTION COSTS $837,348,019
Notes: MOBILIZATION (5% of earthwork) $41,867,401
a. Assumes Sea level of -230 feet MSL. UNLISTED ITEMS 10% $83,734,802
b. Assumes 5 feet of freeboard. CONTRACT COST $962,950,221
c. Assumes sheet pile web spacing equal to half of cell width. CONTINGENCIES 25% $240,737,555
FIELD COST $1,203,687,777
NONCONTRACT COSTS 30% $361,106,333
TOTAL PROJECT COST $1,564,794,110
Ground Improvement
Ground Improvement
($cy)
Seafloor Elevation (ft MSL)
Length(lineal feet)
Assumed Overex Depth (feet)
Dam Height a,b
(feet) Sheet Piles Backfill
Ground Improvement
(cy)
Seafloor Elevation (ft MSL)
Length(lineal feet)
Assumed Overex Depth (feet)
Dam Height a,b
(feet) Sheet Piles($/sq ft)
Backfill($/cy)
Sheet Piles(sq ft)
Backfill(cy)
Seafloor Elevation (ft MSL)
Length(lineal feet)
Assumed Overex Depth (feet)
Dam Height a,b
(feet)
Sheet Piles c
(sq ft/lf)Backfill(cy/lf)
Ground Improvement
(cy/lf)
Width(feet)
Web Spacing c
(feet)
Height(feet)
Seafloor Elevation (ft MSL)
Length(lineal feet)
Assumed Overex Depth (feet)
Dam Height a,b
(feet)
Dam Concept Costs -230 ft MSL; DSM Cellular Dam (7/15/2004; 2:56 PM)
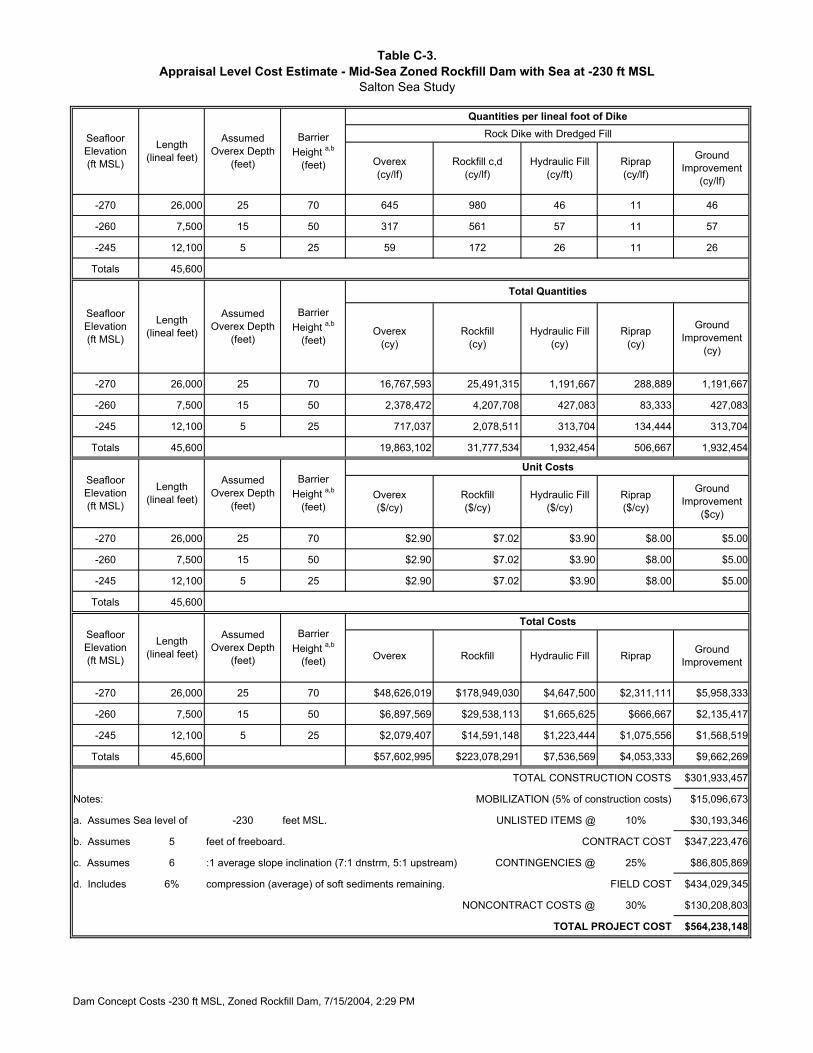
Table C-3.Appraisal Level Cost Estimate - Mid-Sea Zoned Rockfill Dam with Sea at -230 ft MSL
Salton Sea Study
Quantities per lineal foot of DikeRock Dike with Dredged Fill
-270 26,000 25 70 645 980 46 11 46
-260 7,500 15 50 317 561 57 11 57
-245 12,100 5 25 59 172 26 11 26
Totals 45,600
Total Quantities
-270 26,000 25 70 16,767,593 25,491,315 1,191,667 288,889 1,191,667
-260 7,500 15 50 2,378,472 4,207,708 427,083 83,333 427,083
-245 12,100 5 25 717,037 2,078,511 313,704 134,444 313,704
Totals 45,600 19,863,102 31,777,534 1,932,454 506,667 1,932,454
Unit Costs
-270 26,000 25 70 $2.90 $7.02 $3.90 $8.00 $5.00
-260 7,500 15 50 $2.90 $7.02 $3.90 $8.00 $5.00
-245 12,100 5 25 $2.90 $7.02 $3.90 $8.00 $5.00
Totals 45,600
Total Costs
-270 26,000 25 70 $48,626,019 $178,949,030 $4,647,500 $2,311,111 $5,958,333
-260 7,500 15 50 $6,897,569 $29,538,113 $1,665,625 $666,667 $2,135,417
-245 12,100 5 25 $2,079,407 $14,591,148 $1,223,444 $1,075,556 $1,568,519
Totals 45,600 $57,602,995 $223,078,291 $7,536,569 $4,053,333 $9,662,269
TOTAL CONSTRUCTION COSTS $301,933,457
Notes: MOBILIZATION (5% of construction costs) $15,096,673
a. Assumes Sea level of -230 feet MSL. UNLISTED ITEMS @ 10% $30,193,346
b. Assumes 5 feet of freeboard. CONTRACT COST $347,223,476
c. Assumes 6 :1 average slope inclination (7:1 dnstrm, 5:1 upstream) CONTINGENCIES @ 25% $86,805,869
d. Includes 6% compression (average) of soft sediments remaining. FIELD COST $434,029,345
NONCONTRACT COSTS @ 30% $130,208,803
TOTAL PROJECT COST $564,238,148
Ground Improvement
(cy/lf)
Ground Improvement
(cy)
Ground Improvement
($cy)
Ground ImprovementOverex Rockfill RiprapHydraulic Fill
Seafloor Elevation(ft MSL)
Length(lineal feet)
Assumed Overex Depth
(feet)
Barrier Height a,b
(feet)
Overex($/cy)
Rockfill($/cy)
Riprap($/cy)
Hydraulic Fill ($/cy)
Seafloor Elevation(ft MSL)
Length(lineal feet)
Assumed Overex Depth
(feet)
Barrier Height a,b
(feet)
Seafloor Elevation(ft MSL)
Length(lineal feet)
Assumed Overex Depth
(feet)
Barrier Height a,b
(feet)Overex
(cy)Rockfill
(cy)Riprap
(cy)Hydraulic Fill
(cy)
Seafloor Elevation(ft MSL)
Length(lineal feet)
Assumed Overex Depth
(feet)
Barrier Height a,b
(feet) Overex(cy/lf)
Rockfill c,d(cy/lf)
Riprap(cy/lf)
Hydraulic Fill (cy/ft)
Dam Concept Costs -230 ft MSL, Zoned Rockfill Dam, 7/15/2004, 2:29 PM
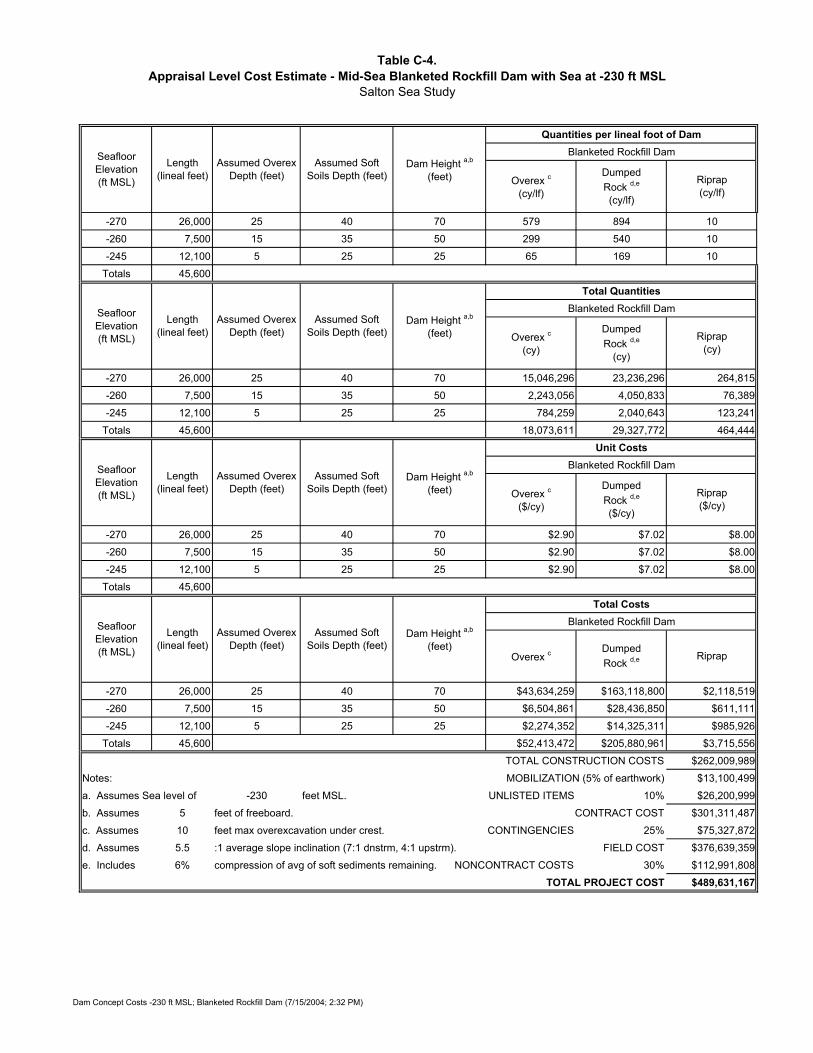
Table C-4.Appraisal Level Cost Estimate - Mid-Sea Blanketed Rockfill Dam with Sea at -230 ft MSL
Salton Sea Study
Quantities per lineal foot of DamBlanketed Rockfill Dam
-270 26,000 25 40 70 579 894 10
-260 7,500 15 35 50 299 540 10
-245 12,100 5 25 25 65 169 10
Totals 45,600
Total QuantitiesBlanketed Rockfill Dam
-270 26,000 25 40 70 15,046,296 23,236,296 264,815
-260 7,500 15 35 50 2,243,056 4,050,833 76,389
-245 12,100 5 25 25 784,259 2,040,643 123,241
Totals 45,600 18,073,611 29,327,772 464,444
Unit CostsBlanketed Rockfill Dam
-270 26,000 25 40 70 $2.90 $7.02 $8.00
-260 7,500 15 35 50 $2.90 $7.02 $8.00
-245 12,100 5 25 25 $2.90 $7.02 $8.00
Totals 45,600
Total CostsBlanketed Rockfill Dam
-270 26,000 25 40 70 $43,634,259 $163,118,800 $2,118,519
-260 7,500 15 35 50 $6,504,861 $28,436,850 $611,111
-245 12,100 5 25 25 $2,274,352 $14,325,311 $985,926
Totals 45,600 $52,413,472 $205,880,961 $3,715,556
TOTAL CONSTRUCTION COSTS $262,009,989
Notes: MOBILIZATION (5% of earthwork) $13,100,499
a. Assumes Sea level of -230 feet MSL. UNLISTED ITEMS 10% $26,200,999
b. Assumes 5 feet of freeboard. CONTRACT COST $301,311,487
c. Assumes 10 feet max overexcavation under crest. CONTINGENCIES 25% $75,327,872
d. Assumes 5.5 :1 average slope inclination (7:1 dnstrm, 4:1 upstrm). FIELD COST $376,639,359
e. Includes 6% compression of avg of soft sediments remaining. NONCONTRACT COSTS 30% $112,991,808
TOTAL PROJECT COST $489,631,167
Overex c
(cy/lf)
DumpedRock d,e
(cy/lf)
Riprap(cy/lf)
Seafloor Elevation(ft MSL)
Length(lineal feet)
Assumed Overex Depth (feet)
Dam Height a,b
(feet)Assumed Soft
Soils Depth (feet)
Overex c
(cy)
DumpedRock d,e
(cy)
Riprap(cy)
Seafloor Elevation(ft MSL)
Length(lineal feet)
Assumed Overex Depth (feet)
Dam Height a,b
(feet)Assumed Soft
Soils Depth (feet)
Overex c
($/cy)
DumpedRock d,e
($/cy)
Riprap($/cy)
Seafloor Elevation(ft MSL)
Length(lineal feet)
Assumed Overex Depth (feet)
Dam Height a,b
(feet)Assumed Soft
Soils Depth (feet)
Overex cDumpedRock d,e Riprap
Seafloor Elevation(ft MSL)
Length(lineal feet)
Assumed Overex Depth (feet)
Dam Height a,b
(feet)Assumed Soft
Soils Depth (feet)
Dam Concept Costs -230 ft MSL; Blanketed Rockfill Dam (7/15/2004; 2:32 PM)
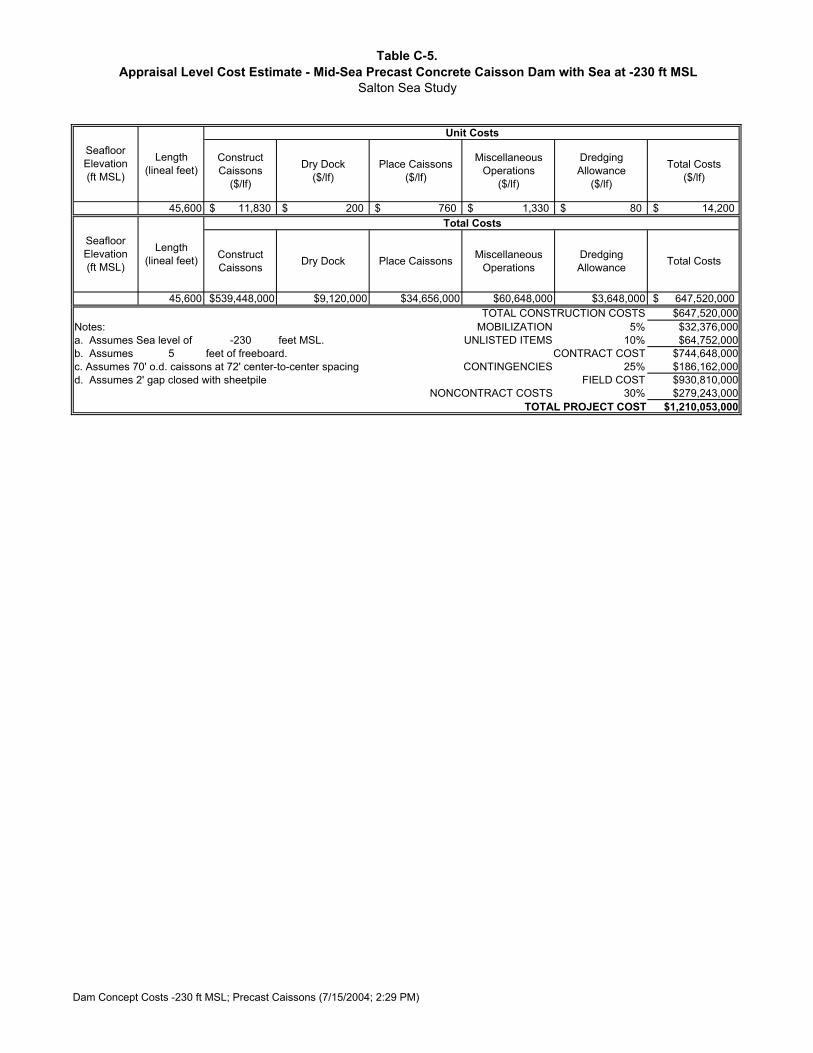
Table C-5.Appraisal Level Cost Estimate - Mid-Sea Precast Concrete Caisson Dam with Sea at -230 ft MSL
Salton Sea Study
Unit Costs
Construct Caissons
($/lf)
Dry Dock ($/lf)
Place Caissons ($/lf)
Miscellaneous Operations
($/lf)
Dredging Allowance
($/lf)
Total Costs($/lf)
45,600 11,830$ 200$ 760$ 1,330$ 80$ 14,200$ Total Costs
Construct Caissons Dry Dock Place Caissons Miscellaneous
OperationsDredging Allowance Total Costs
45,600 $539,448,000 $9,120,000 $34,656,000 $60,648,000 $3,648,000 647,520,000$ TOTAL CONSTRUCTION COSTS $647,520,000
Notes: MOBILIZATION 5% $32,376,000a. Assumes Sea level of -230 feet MSL. UNLISTED ITEMS 10% $64,752,000b. Assumes 5 feet of freeboard. CONTRACT COST $744,648,000c. Assumes 70' o.d. caissons at 72' center-to-center spacing CONTINGENCIES 25% $186,162,000d. Assumes 2' gap closed with sheetpile FIELD COST $930,810,000
NONCONTRACT COSTS 30% $279,243,000TOTAL PROJECT COST $1,210,053,000
Length(lineal feet)
Seafloor Elevation(ft MSL)
Seafloor Elevation(ft MSL)
Length(lineal feet)
Dam Concept Costs -230 ft MSL; Precast Caissons (7/15/2004; 2:29 PM)

Table C-6.Appraisal Level Cost Estimate - Concrete Sheetpile Dam with Sea at -230 ft MSL
Salton Sea Study
Quantities per lineal foot of DamDam
-270 26,000 0 45 176 70 88 117 228
-260 7,500 0 35 150 60 75 78 167
-245 12,100 0 20 110 45 55 33 92
Totals 45,600
Total QuantitiesDam
-270 26,000 0 45 4,576,000 3,033,333 5,931,852
-260 7,500 0 35 1,125,000 583,333 1,250,000
-245 12,100 0 20 1,331,000 403,333 1,109,167
Totals 45,600 7,032,000 4,020,000 8,291,019
Unit CostsDam
-270 26,000 0 45 $65.00 $3.90 $5.00
-260 7,500 0 35 $65.00 $3.90 $5.00
-245 12,100 0 20 $65.00 $3.90 $5.00
Totals 45,600
Total CostsDam
-270 26,000 0 45 $297,440,000 $11,830,000 $29,659,259
-260 7,500 0 35 $73,125,000 $2,275,000 $6,250,000
-245 12,100 0 20 $86,515,000 $1,573,000 $5,545,833
Totals 45,600 $457,080,000 $15,678,000 $41,455,093
TOTAL CONSTRUCTION COSTS $514,213,093
Notes: MOBILIZATION (5% of earthwork) $25,710,655
a. Assumes Sea level of -230 feet MSL. UNLISTED ITEMS 10% $51,421,309
b. Assumes 5 feet of freeboard. CONTRACT COST $591,345,056
CONTINGENCIES 25% $147,836,264
FIELD COST $739,181,321
NONCONTRACT COSTS 30% $221,754,396
TOTAL PROJECT COST $960,935,717
Ground Improvement
Ground Improvement
($cy)
Seafloor Elevation(ft MSL)
Length(lineal feet)
Assumed Overex Depth
(feet)
Dam Height a,b (feet)
Sheet Piles($/sq ft)
Backfill($/cy)
Sheet Piles Backfill
Seafloor Elevation(ft MSL)
Length(lineal feet)
Assumed Overex Depth
(feet)
Dam Height a,b (feet)
Sheet Piles(sq ft)
Backfill(cy)
Ground Improvement
(cy)
Seafloor Elevation(ft MSL)
Length(lineal feet)
Assumed Overex Depth
(feet)
Dam Height a,b (feet)
Sheet Piles c
(sq ft/lf)Backfill(cy/lf)
Ground Improvement
(cy/lf)
Width(feet)
Height(feet)
Seafloor Elevation(ft MSL)
Length(lineal feet)
Assumed Overex Depth
(feet)
Dam Height a,b (feet)
Dam Concept Costs -230 ft MSL; Concrete Sheetpile Dam (7/15/2004; 2:32 PM)
APPENDIXC Appraisal Level Cost Estimates - Dam Concepts
W:\27662033\00002-a-r.doc\21-Sep-04\SDG
For Sea Level at -235 Feet MSL
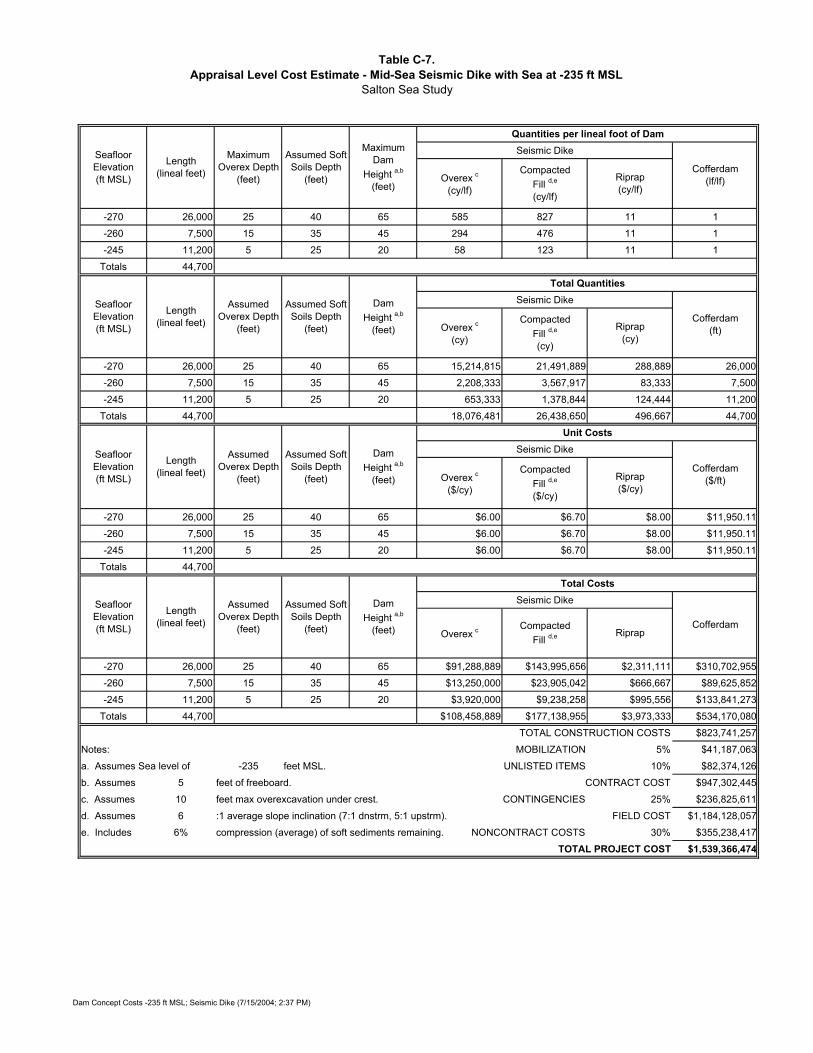
Table C-7.Appraisal Level Cost Estimate - Mid-Sea Seismic Dike with Sea at -235 ft MSL
Salton Sea Study
Quantities per lineal foot of DamSeismic Dike
-270 26,000 25 40 65 585 827 11 1
-260 7,500 15 35 45 294 476 11 1
-245 11,200 5 25 20 58 123 11 1
Totals 44,700
Total QuantitiesSeismic Dike
-270 26,000 25 40 65 15,214,815 21,491,889 288,889 26,000
-260 7,500 15 35 45 2,208,333 3,567,917 83,333 7,500
-245 11,200 5 25 20 653,333 1,378,844 124,444 11,200
Totals 44,700 18,076,481 26,438,650 496,667 44,700
Unit CostsSeismic Dike
-270 26,000 25 40 65 $6.00 $6.70 $8.00 $11,950.11
-260 7,500 15 35 45 $6.00 $6.70 $8.00 $11,950.11
-245 11,200 5 25 20 $6.00 $6.70 $8.00 $11,950.11
Totals 44,700
Total CostsSeismic Dike
-270 26,000 25 40 65 $91,288,889 $143,995,656 $2,311,111 $310,702,955
-260 7,500 15 35 45 $13,250,000 $23,905,042 $666,667 $89,625,852
-245 11,200 5 25 20 $3,920,000 $9,238,258 $995,556 $133,841,273
Totals 44,700 $108,458,889 $177,138,955 $3,973,333 $534,170,080
TOTAL CONSTRUCTION COSTS $823,741,257
Notes: MOBILIZATION 5% $41,187,063
a. Assumes Sea level of -235 feet MSL. UNLISTED ITEMS 10% $82,374,126
b. Assumes 5 feet of freeboard. CONTRACT COST $947,302,445
c. Assumes 10 feet max overexcavation under crest. CONTINGENCIES 25% $236,825,611
d. Assumes 6 :1 average slope inclination (7:1 dnstrm, 5:1 upstrm). FIELD COST $1,184,128,057
e. Includes 6% compression (average) of soft sediments remaining. NONCONTRACT COSTS 30% $355,238,417
TOTAL PROJECT COST $1,539,366,474
CompactedFill d,e
(cy/lf)
Riprap(cy/lf)
Seafloor Elevation(ft MSL)
Length(lineal feet)
Maximum Overex Depth
(feet)
Maximum Dam
Height a,b
(feet)
Assumed Soft Soils Depth
(feet) Overex c
(cy/lf)
Seafloor Elevation(ft MSL)
Length(lineal feet)
Assumed Overex Depth
(feet)
DamHeight a,b
(feet)
Assumed Soft Soils Depth
(feet)
Seafloor Elevation(ft MSL)
Length(lineal feet)
Assumed Overex Depth
(feet)
DamHeight a,b
(feet)
Assumed Soft Soils Depth
(feet)
Seafloor Elevation(ft MSL)
Length(lineal feet)
Assumed Overex Depth
(feet)
DamHeight a,b
(feet) Overex cCompacted
Fill d,e Riprap
Assumed Soft Soils Depth
(feet)
Overex c
($/cy)
CompactedFill d,e
($/cy)
Riprap($/cy)
Riprap(cy)
Overex c
(cy)
CompactedFill d,e
(cy)
Cofferdam (lf/lf)
Cofferdam(ft)
Cofferdam($/ft)
Cofferdam
Dam Concept Costs -235 ft MSL; Seismic Dike (7/15/2004; 2:37 PM)
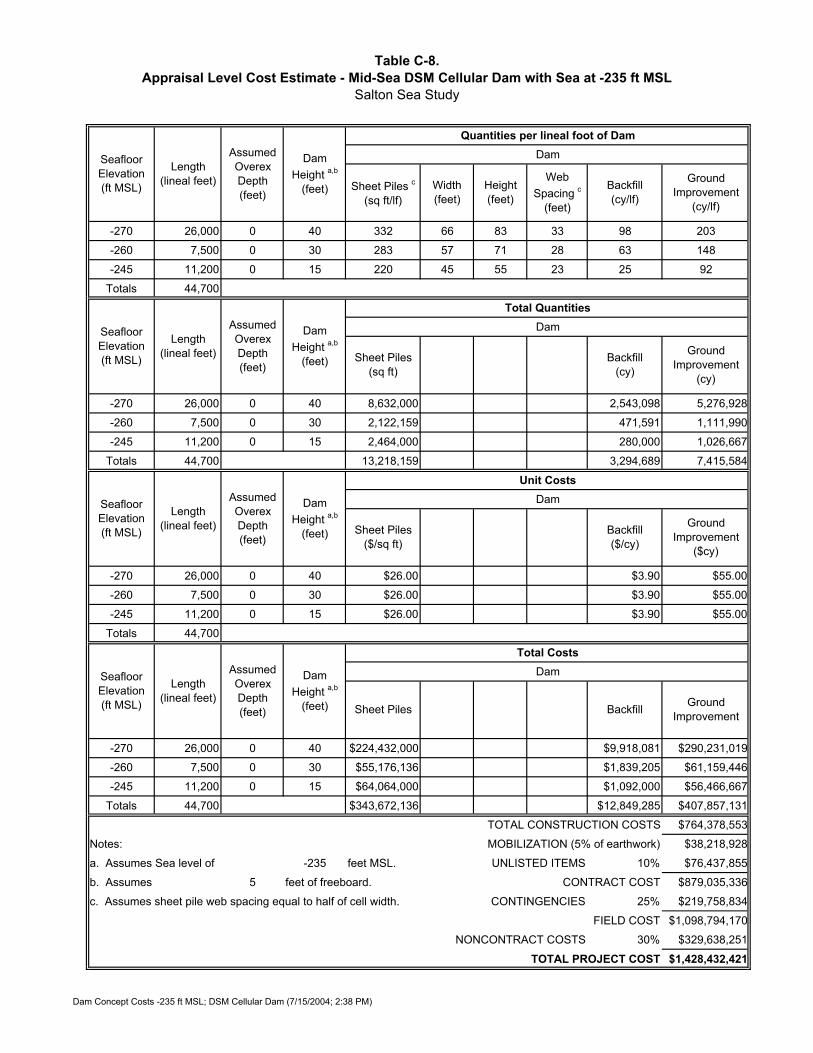
Table C-8.Appraisal Level Cost Estimate - Mid-Sea DSM Cellular Dam with Sea at -235 ft MSL
Salton Sea Study
Quantities per lineal foot of DamDam
-270 26,000 0 40 332 66 83 33 98 203
-260 7,500 0 30 283 57 71 28 63 148
-245 11,200 0 15 220 45 55 23 25 92
Totals 44,700
Total QuantitiesDam
-270 26,000 0 40 8,632,000 2,543,098 5,276,928
-260 7,500 0 30 2,122,159 471,591 1,111,990
-245 11,200 0 15 2,464,000 280,000 1,026,667
Totals 44,700 13,218,159 3,294,689 7,415,584
Unit CostsDam
-270 26,000 0 40 $26.00 $3.90 $55.00
-260 7,500 0 30 $26.00 $3.90 $55.00
-245 11,200 0 15 $26.00 $3.90 $55.00
Totals 44,700
Total CostsDam
-270 26,000 0 40 $224,432,000 $9,918,081 $290,231,019
-260 7,500 0 30 $55,176,136 $1,839,205 $61,159,446
-245 11,200 0 15 $64,064,000 $1,092,000 $56,466,667
Totals 44,700 $343,672,136 $12,849,285 $407,857,131
TOTAL CONSTRUCTION COSTS $764,378,553
Notes: MOBILIZATION (5% of earthwork) $38,218,928
a. Assumes Sea level of -235 feet MSL. UNLISTED ITEMS 10% $76,437,855
b. Assumes 5 feet of freeboard. CONTRACT COST $879,035,336
c. Assumes sheet pile web spacing equal to half of cell width. CONTINGENCIES 25% $219,758,834
FIELD COST $1,098,794,170
NONCONTRACT COSTS 30% $329,638,251
TOTAL PROJECT COST $1,428,432,421
Ground Improvement
Ground Improvement
($cy)
Seafloor Elevation (ft MSL)
Length(lineal feet)
Assumed Overex Depth (feet)
Dam Height a,b
(feet) Sheet Piles Backfill
Ground Improvement
(cy)
Seafloor Elevation (ft MSL)
Length(lineal feet)
Assumed Overex Depth (feet)
Dam Height a,b
(feet) Sheet Piles($/sq ft)
Backfill($/cy)
Sheet Piles(sq ft)
Backfill(cy)
Seafloor Elevation (ft MSL)
Length(lineal feet)
Assumed Overex Depth (feet)
Dam Height a,b
(feet)
Sheet Piles c
(sq ft/lf)Backfill(cy/lf)
Ground Improvement
(cy/lf)
Width(feet)
Web Spacing c
(feet)
Height(feet)
Seafloor Elevation (ft MSL)
Length(lineal feet)
Assumed Overex Depth (feet)
Dam Height a,b
(feet)
Dam Concept Costs -235 ft MSL; DSM Cellular Dam (7/15/2004; 2:38 PM)
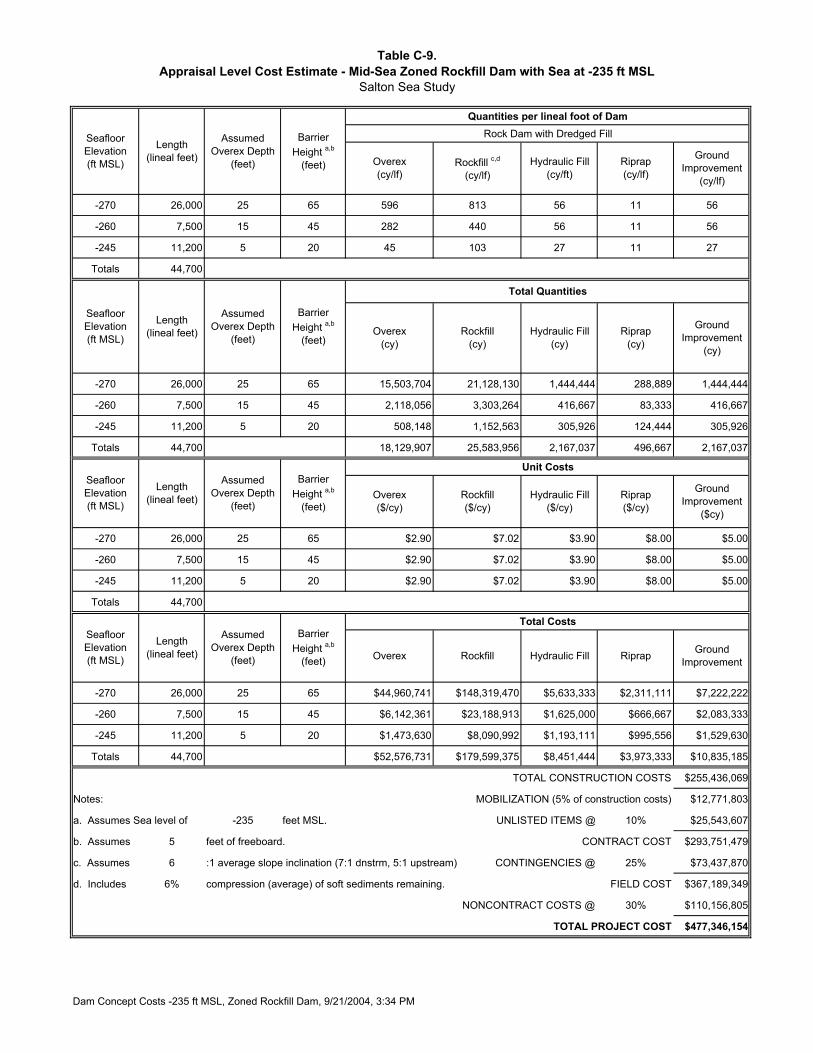
Table C-9.Appraisal Level Cost Estimate - Mid-Sea Zoned Rockfill Dam with Sea at -235 ft MSL
Salton Sea Study
Quantities per lineal foot of DamRock Dam with Dredged Fill
-270 26,000 25 65 596 813 56 11 56
-260 7,500 15 45 282 440 56 11 56
-245 11,200 5 20 45 103 27 11 27
Totals 44,700
Total Quantities
-270 26,000 25 65 15,503,704 21,128,130 1,444,444 288,889 1,444,444
-260 7,500 15 45 2,118,056 3,303,264 416,667 83,333 416,667
-245 11,200 5 20 508,148 1,152,563 305,926 124,444 305,926
Totals 44,700 18,129,907 25,583,956 2,167,037 496,667 2,167,037
Unit Costs
-270 26,000 25 65 $2.90 $7.02 $3.90 $8.00 $5.00
-260 7,500 15 45 $2.90 $7.02 $3.90 $8.00 $5.00
-245 11,200 5 20 $2.90 $7.02 $3.90 $8.00 $5.00
Totals 44,700
Total Costs
-270 26,000 25 65 $44,960,741 $148,319,470 $5,633,333 $2,311,111 $7,222,222
-260 7,500 15 45 $6,142,361 $23,188,913 $1,625,000 $666,667 $2,083,333
-245 11,200 5 20 $1,473,630 $8,090,992 $1,193,111 $995,556 $1,529,630
Totals 44,700 $52,576,731 $179,599,375 $8,451,444 $3,973,333 $10,835,185
TOTAL CONSTRUCTION COSTS $255,436,069
Notes: MOBILIZATION (5% of construction costs) $12,771,803
a. Assumes Sea level of -235 feet MSL. UNLISTED ITEMS @ 10% $25,543,607
b. Assumes 5 feet of freeboard. CONTRACT COST $293,751,479
c. Assumes 6 :1 average slope inclination (7:1 dnstrm, 5:1 upstream) CONTINGENCIES @ 25% $73,437,870
d. Includes 6% compression (average) of soft sediments remaining. FIELD COST $367,189,349
NONCONTRACT COSTS @ 30% $110,156,805
TOTAL PROJECT COST $477,346,154
Overex(cy/lf)
Rockfill c,d
(cy/lf)Riprap(cy/lf)
Hydraulic Fill (cy/ft)
Seafloor Elevation(ft MSL)
Length(lineal feet)
Assumed Overex Depth
(feet)
Barrier Height a,b
(feet)
Overex(cy)
Rockfill(cy)
Riprap(cy)
Hydraulic Fill (cy)
Seafloor Elevation(ft MSL)
Length(lineal feet)
Assumed Overex Depth
(feet)
Barrier Height a,b
(feet)
Seafloor Elevation(ft MSL)
Length(lineal feet)
Assumed Overex Depth
(feet)
Barrier Height a,b
(feet)Overex($/cy)
Rockfill($/cy)
Riprap($/cy)
Hydraulic Fill ($/cy)
Seafloor Elevation(ft MSL)
Length(lineal feet)
Assumed Overex Depth
(feet)
Barrier Height a,b
(feet) Overex Rockfill RiprapHydraulic Fill
Ground Improvement
(cy/lf)
Ground Improvement
(cy)
Ground Improvement
($cy)
Ground Improvement
Dam Concept Costs -235 ft MSL, Zoned Rockfill Dam, 9/21/2004, 3:34 PM

Table C-10.Appraisal Level Cost Estimate - Mid-Sea Blanketed Rockfill Dam with Sea at -235 ft MSL
Salton Sea Study
Quantities per lineal foot of DamBlanketed Rockfill Dam
-270 26,000 25 40 65 543 763 10
-260 7,500 15 35 45 274 440 10
-245 11,200 5 25 20 55 115 10
Totals 44,700
Total QuantitiesBlanketed Rockfill Dam
-270 26,000 25 40 65 14,119,444 19,842,574 264,815
-260 7,500 15 35 45 2,052,083 3,301,042 76,389
-245 11,200 5 25 20 611,852 1,285,926 114,074
Totals 44,700 16,783,380 24,429,542 455,278
Unit CostsBlanketed Rockfill Dam
-270 26,000 25 40 65 $2.90 $7.02 $8.00
-260 7,500 15 35 45 $2.90 $7.02 $8.00
-245 11,200 5 25 20 $2.90 $7.02 $8.00
Totals 44,700
Total CostsBlanketed Rockfill Dam
-270 26,000 25 40 65 $40,946,389 $139,294,870 $2,118,519
-260 7,500 15 35 45 $5,951,042 $23,173,313 $611,111
-245 11,200 5 25 20 $1,774,370 $9,027,200 $912,593
Totals 44,700 $48,671,801 $171,495,383 $3,642,222
TOTAL CONSTRUCTION COSTS $223,809,406
Notes: MOBILIZATION (5% of earthwork) $11,190,470
a. Assumes Sea level of -235 feet MSL. UNLISTED ITEMS 10% $22,380,941
b. Assumes 5 feet of freeboard. CONTRACT COST $257,380,816
c. Assumes 10 feet max overexcavation under crest. CONTINGENCIES 25% $64,345,204
d. Assumes 5.5 :1 average slope inclination (7:1 dnstrm, 4:1 upstrm). FIELD COST $321,726,021
e. Includes 6% compression of avg of soft sediments remaining. NONCONTRACT COSTS 30% $96,517,806
TOTAL PROJECT COST $418,243,827
Overex cDumpedRock d,e Riprap
Seafloor Elevation(ft MSL)
Length(lineal feet)
Assumed Overex Depth (feet)
Dam Height a,b
(feet)Assumed Soft
Soils Depth (feet)
Overex c
($/cy)
DumpedRock d,e
($/cy)
Riprap($/cy)
Seafloor Elevation(ft MSL)
Length(lineal feet)
Assumed Overex Depth (feet)
Dam Height a,b
(feet)Assumed Soft
Soils Depth (feet)
Overex c
(cy)
DumpedRock d,e
(cy)
Riprap(cy)
Seafloor Elevation(ft MSL)
Length(lineal feet)
Assumed Overex Depth (feet)
Dam Height a,b
(feet)Assumed Soft
Soils Depth (feet)
Overex c
(cy/lf)
DumpedRock d,e
(cy/lf)
Riprap(cy/lf)
Seafloor Elevation(ft MSL)
Length(lineal feet)
Assumed Overex Depth (feet)
Dam Height a,b
(feet)Assumed Soft
Soils Depth (feet)
Dam Concept Costs -235 ft MSL; Blanketed Rockfill Dam (7/15/2004; 2:38 PM)

Table C-11.Appraisal Level Cost Estimate - Mid-Sea Precast Concrete Caisson Dam with Sea at -235 ft MSL
Salton Sea Study
Unit Costs
Construct Caissons
($/lf)
Dry Dock ($/lf)
Place Caissons ($/lf)
Miscellaneous Operations
($/lf)
Dredging Allowance
($/lf)
Total Costs($/lf)
44,700 11,158$ 189$ 717$ 1,254$ 75$ 13,393$ Total Costs
Construct Caissons Dry Dock Place Caissons Miscellaneous
OperationsDredging Allowance Total Costs
44,700 $498,755,489 $8,432,045 $32,041,773 $56,073,102 $3,372,818 598,675,227$ TOTAL CONSTRUCTION COSTS $598,675,227
Notes: MOBILIZATION 5% $29,933,761a. Assumes Sea level of -235 feet MSL. UNLISTED ITEMS 10% $59,867,523b. Assumes 5 feet of freeboard. CONTRACT COST $688,476,511c. Assumes 70' o.d. caissons at 72' center-to-center spacing CONTINGENCIES 25% $172,119,128d. Assumes 2' gap closed with sheetpile FIELD COST $860,595,639
NONCONTRACT COSTS 30% $258,178,692TOTAL PROJECT COST $1,118,774,331
Length(lineal feet)
Seafloor Elevation(ft MSL)
Seafloor Elevation(ft MSL)
Length(lineal feet)
Dam Concept Costs -235 ft MSL; Precast Caissons (7/15/2004; 2:35 PM)
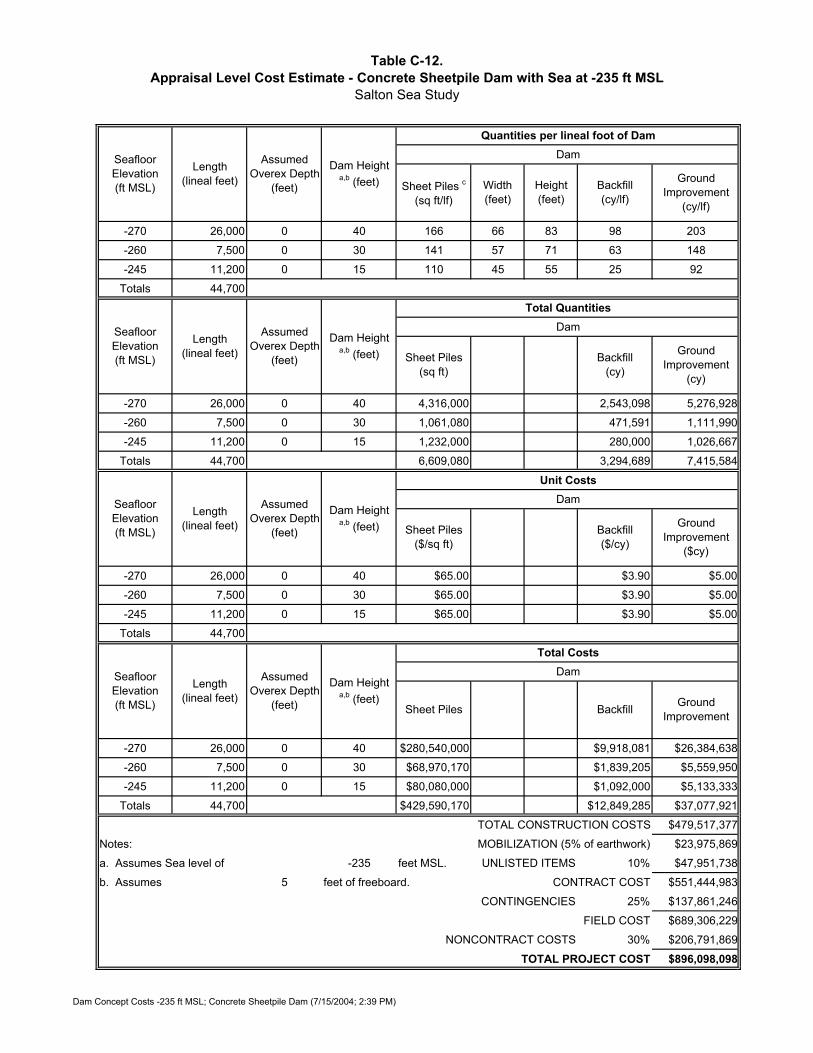
Table C-12.Appraisal Level Cost Estimate - Concrete Sheetpile Dam with Sea at -235 ft MSL
Salton Sea Study
Quantities per lineal foot of DamDam
-270 26,000 0 40 166 66 83 98 203
-260 7,500 0 30 141 57 71 63 148
-245 11,200 0 15 110 45 55 25 92
Totals 44,700
Total QuantitiesDam
-270 26,000 0 40 4,316,000 2,543,098 5,276,928
-260 7,500 0 30 1,061,080 471,591 1,111,990
-245 11,200 0 15 1,232,000 280,000 1,026,667
Totals 44,700 6,609,080 3,294,689 7,415,584
Unit CostsDam
-270 26,000 0 40 $65.00 $3.90 $5.00
-260 7,500 0 30 $65.00 $3.90 $5.00
-245 11,200 0 15 $65.00 $3.90 $5.00
Totals 44,700
Total CostsDam
-270 26,000 0 40 $280,540,000 $9,918,081 $26,384,638
-260 7,500 0 30 $68,970,170 $1,839,205 $5,559,950
-245 11,200 0 15 $80,080,000 $1,092,000 $5,133,333
Totals 44,700 $429,590,170 $12,849,285 $37,077,921
TOTAL CONSTRUCTION COSTS $479,517,377
Notes: MOBILIZATION (5% of earthwork) $23,975,869
a. Assumes Sea level of -235 feet MSL. UNLISTED ITEMS 10% $47,951,738
b. Assumes 5 feet of freeboard. CONTRACT COST $551,444,983
CONTINGENCIES 25% $137,861,246
FIELD COST $689,306,229
NONCONTRACT COSTS 30% $206,791,869
TOTAL PROJECT COST $896,098,098
Seafloor Elevation(ft MSL)
Length(lineal feet)
Assumed Overex Depth
(feet)
Dam Height a,b (feet) Sheet Piles c
(sq ft/lf)Backfill(cy/lf)
Ground Improvement
(cy/lf)
Width(feet)
Height(feet)
Seafloor Elevation(ft MSL)
Length(lineal feet)
Assumed Overex Depth
(feet)
Dam Height a,b (feet) Sheet Piles
(sq ft)Backfill
(cy)
Ground Improvement
(cy)
Seafloor Elevation(ft MSL)
Length(lineal feet)
Assumed Overex Depth
(feet)
Dam Height a,b (feet) Sheet Piles
($/sq ft)Backfill($/cy)
Sheet Piles Backfill
Seafloor Elevation(ft MSL)
Length(lineal feet)
Assumed Overex Depth
(feet)
Dam Height a,b (feet) Ground
Improvement
Ground Improvement
($cy)
Dam Concept Costs -235 ft MSL; Concrete Sheetpile Dam (7/15/2004; 2:39 PM)
APPENDIXC Appraisal Level Cost Estimates - Dam Concepts
W:\27662033\00002-a-r.doc\21-Sep-04\SDG
For Sea Level at -240 Feet MSL

Table C-13.Appraisal Level Cost Estimate - Mid-Sea Seismic Dike with Sea at -240 ft MSL
Salton Sea Study
Quantities per lineal foot of DamSeismic Dike
-270 26,000 25 40 60 546 696 11 1
-260 7,500 15 35 40 267 378 11 1
-245 9,900 5 25 15 47 76 11 1
Totals 43,400
Total QuantitiesSeismic Dike
-270 26,000 25 40 60 14,203,704 18,091,667 288,889 26,000
-260 7,500 15 35 40 2,000,000 2,837,083 83,333 7,500
-245 9,900 5 25 15 467,500 752,400 110,000 9,900
Totals 43,400 16,671,204 21,681,150 482,222 43,400
Unit CostsSeismic Dike
-270 26,000 25 40 60 $6.00 $6.70 $8.00 $11,230.23
-260 7,500 15 35 40 $6.00 $6.70 $8.00 $11,230.23
-245 9,900 5 25 15 $6.00 $6.70 $8.00 $11,230.23
Totals 43,400
Total CostsSeismic Dike
-270 26,000 25 40 60 $85,222,222 $121,214,167 $2,311,111 $291,985,909
-260 7,500 15 35 40 $12,000,000 $19,008,458 $666,667 $84,226,705
-245 9,900 5 25 15 $2,805,000 $5,041,080 $880,000 $111,179,250
Totals 43,400 $100,027,222 $145,263,705 $3,857,778 $487,391,864
TOTAL CONSTRUCTION COSTS $736,540,569
Notes: MOBILIZATION 5% $36,827,028
a. Assumes Sea level of -240 feet MSL. UNLISTED ITEMS 10% $73,654,057
b. Assumes 5 feet of freeboard. CONTRACT COST $847,021,654
c. Assumes 10 feet max overexcavation under crest. CONTINGENCIES 25% $211,755,413
d. Assumes 6 :1 average slope inclination (7:1 dnstrm, 5:1 upstrm). FIELD COST $1,058,777,067
e. Includes 6% compression (average) of soft sediments remaining. NONCONTRACT COSTS 30% $317,633,120
TOTAL PROJECT COST $1,376,410,188
CompactedFill d,e
(cy/lf)
Riprap(cy/lf)
Seafloor Elevation(ft MSL)
Length(lineal feet)
Maximum Overex Depth
(feet)
Maximum Dam
Height a,b
(feet)
Assumed Soft Soils Depth
(feet) Overex c
(cy/lf)
Seafloor Elevation(ft MSL)
Length(lineal feet)
Assumed Overex Depth
(feet)
DamHeight a,b
(feet)
Assumed Soft Soils Depth
(feet)
Seafloor Elevation(ft MSL)
Length(lineal feet)
Assumed Overex Depth
(feet)
DamHeight a,b
(feet)
Assumed Soft Soils Depth
(feet)
Seafloor Elevation(ft MSL)
Length(lineal feet)
Assumed Overex Depth
(feet)
DamHeight a,b
(feet) Overex cCompacted
Fill d,e Riprap
Assumed Soft Soils Depth
(feet)
Overex c
($/cy)
CompactedFill d,e
($/cy)
Riprap($/cy)
Riprap(cy)
Overex c
(cy)
CompactedFill d,e
(cy)
Cofferdam (lf/lf)
Cofferdam(ft)
Cofferdam($/ft)
Cofferdam
Dam Concept Costs -240 ft MSL; Seismic Dike (7/15/2004; 2:41 PM)
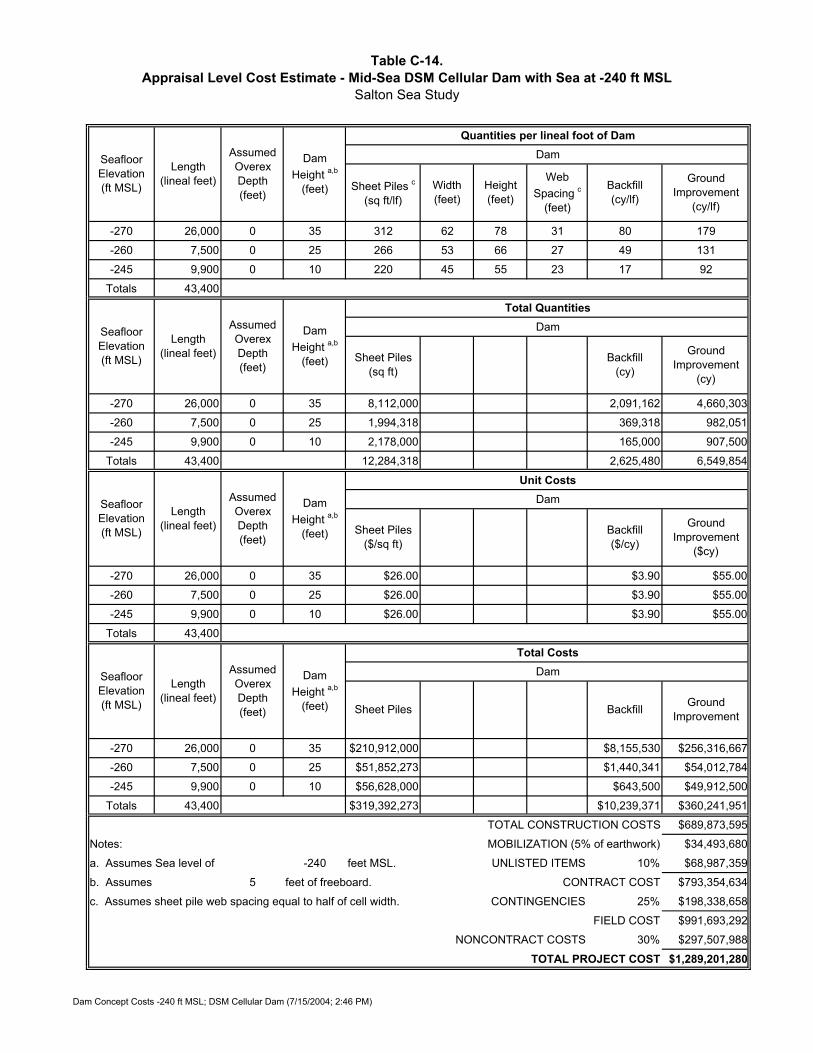
Table C-14.Appraisal Level Cost Estimate - Mid-Sea DSM Cellular Dam with Sea at -240 ft MSL
Salton Sea Study
Quantities per lineal foot of DamDam
-270 26,000 0 35 312 62 78 31 80 179
-260 7,500 0 25 266 53 66 27 49 131
-245 9,900 0 10 220 45 55 23 17 92
Totals 43,400
Total QuantitiesDam
-270 26,000 0 35 8,112,000 2,091,162 4,660,303
-260 7,500 0 25 1,994,318 369,318 982,051
-245 9,900 0 10 2,178,000 165,000 907,500
Totals 43,400 12,284,318 2,625,480 6,549,854
Unit CostsDam
-270 26,000 0 35 $26.00 $3.90 $55.00
-260 7,500 0 25 $26.00 $3.90 $55.00
-245 9,900 0 10 $26.00 $3.90 $55.00
Totals 43,400
Total CostsDam
-270 26,000 0 35 $210,912,000 $8,155,530 $256,316,667
-260 7,500 0 25 $51,852,273 $1,440,341 $54,012,784
-245 9,900 0 10 $56,628,000 $643,500 $49,912,500
Totals 43,400 $319,392,273 $10,239,371 $360,241,951
TOTAL CONSTRUCTION COSTS $689,873,595
Notes: MOBILIZATION (5% of earthwork) $34,493,680
a. Assumes Sea level of -240 feet MSL. UNLISTED ITEMS 10% $68,987,359
b. Assumes 5 feet of freeboard. CONTRACT COST $793,354,634
c. Assumes sheet pile web spacing equal to half of cell width. CONTINGENCIES 25% $198,338,658
FIELD COST $991,693,292
NONCONTRACT COSTS 30% $297,507,988
TOTAL PROJECT COST $1,289,201,280
Ground Improvement
Ground Improvement
($cy)
Seafloor Elevation (ft MSL)
Length(lineal feet)
Assumed Overex Depth (feet)
Dam Height a,b
(feet) Sheet Piles Backfill
Ground Improvement
(cy)
Seafloor Elevation (ft MSL)
Length(lineal feet)
Assumed Overex Depth (feet)
Dam Height a,b
(feet) Sheet Piles($/sq ft)
Backfill($/cy)
Sheet Piles(sq ft)
Backfill(cy)
Seafloor Elevation (ft MSL)
Length(lineal feet)
Assumed Overex Depth (feet)
Dam Height a,b
(feet)
Sheet Piles c
(sq ft/lf)Backfill(cy/lf)
Ground Improvement
(cy/lf)
Width(feet)
Web Spacing c
(feet)
Height(feet)
Seafloor Elevation (ft MSL)
Length(lineal feet)
Assumed Overex Depth (feet)
Dam Height a,b
(feet)
Dam Concept Costs -240 ft MSL; DSM Cellular Dam (7/15/2004; 2:46 PM)
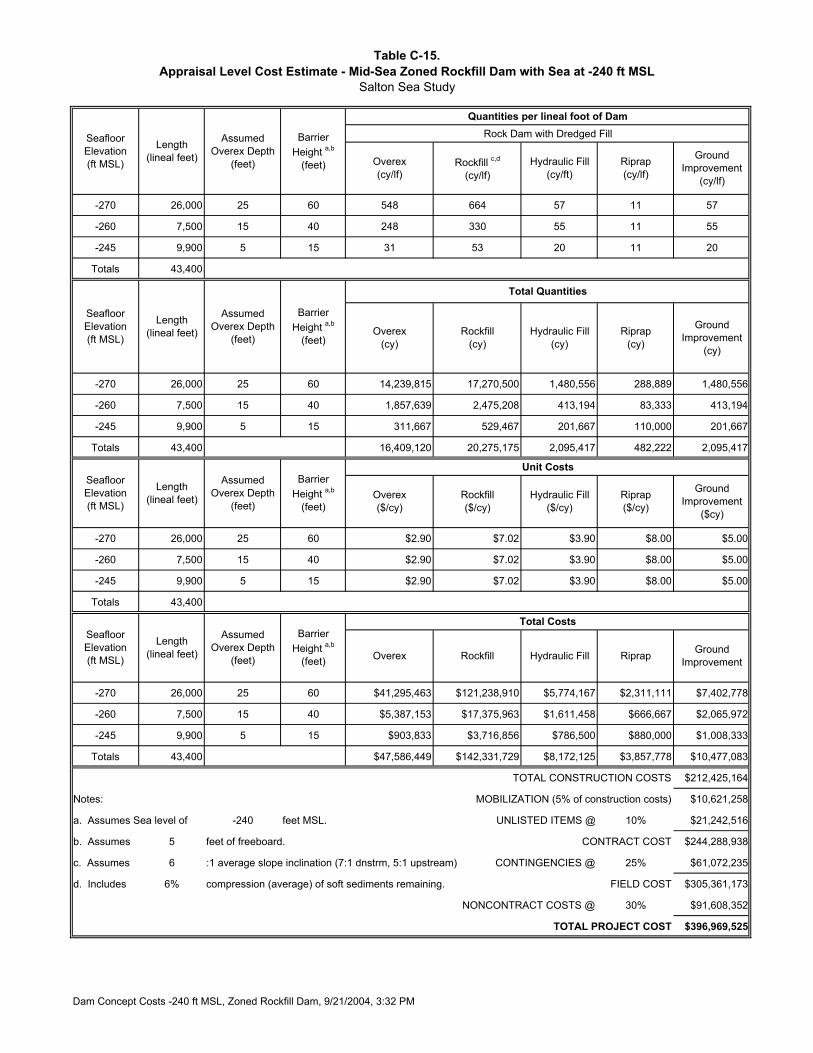
Table C-15.Appraisal Level Cost Estimate - Mid-Sea Zoned Rockfill Dam with Sea at -240 ft MSL
Salton Sea Study
Quantities per lineal foot of DamRock Dam with Dredged Fill
-270 26,000 25 60 548 664 57 11 57
-260 7,500 15 40 248 330 55 11 55
-245 9,900 5 15 31 53 20 11 20
Totals 43,400
Total Quantities
-270 26,000 25 60 14,239,815 17,270,500 1,480,556 288,889 1,480,556
-260 7,500 15 40 1,857,639 2,475,208 413,194 83,333 413,194
-245 9,900 5 15 311,667 529,467 201,667 110,000 201,667
Totals 43,400 16,409,120 20,275,175 2,095,417 482,222 2,095,417
Unit Costs
-270 26,000 25 60 $2.90 $7.02 $3.90 $8.00 $5.00
-260 7,500 15 40 $2.90 $7.02 $3.90 $8.00 $5.00
-245 9,900 5 15 $2.90 $7.02 $3.90 $8.00 $5.00
Totals 43,400
Total Costs
-270 26,000 25 60 $41,295,463 $121,238,910 $5,774,167 $2,311,111 $7,402,778
-260 7,500 15 40 $5,387,153 $17,375,963 $1,611,458 $666,667 $2,065,972
-245 9,900 5 15 $903,833 $3,716,856 $786,500 $880,000 $1,008,333
Totals 43,400 $47,586,449 $142,331,729 $8,172,125 $3,857,778 $10,477,083
TOTAL CONSTRUCTION COSTS $212,425,164
Notes: MOBILIZATION (5% of construction costs) $10,621,258
a. Assumes Sea level of -240 feet MSL. UNLISTED ITEMS @ 10% $21,242,516
b. Assumes 5 feet of freeboard. CONTRACT COST $244,288,938
c. Assumes 6 :1 average slope inclination (7:1 dnstrm, 5:1 upstream) CONTINGENCIES @ 25% $61,072,235
d. Includes 6% compression (average) of soft sediments remaining. FIELD COST $305,361,173
NONCONTRACT COSTS @ 30% $91,608,352
TOTAL PROJECT COST $396,969,525
Overex(cy/lf)
Rockfill c,d
(cy/lf)Riprap(cy/lf)
Hydraulic Fill (cy/ft)
Seafloor Elevation(ft MSL)
Length(lineal feet)
Assumed Overex Depth
(feet)
Barrier Height a,b
(feet)
Overex(cy)
Rockfill(cy)
Riprap(cy)
Hydraulic Fill (cy)
Seafloor Elevation(ft MSL)
Length(lineal feet)
Assumed Overex Depth
(feet)
Barrier Height a,b
(feet)
Seafloor Elevation(ft MSL)
Length(lineal feet)
Assumed Overex Depth
(feet)
Barrier Height a,b
(feet)Overex($/cy)
Rockfill($/cy)
Riprap($/cy)
Hydraulic Fill ($/cy)
Seafloor Elevation(ft MSL)
Length(lineal feet)
Assumed Overex Depth
(feet)
Barrier Height a,b
(feet) Overex Rockfill RiprapHydraulic Fill
Ground Improvement
(cy/lf)
Ground Improvement
(cy)
Ground Improvement
($cy)
Ground Improvement
Dam Concept Costs -240 ft MSL, Zoned Rockfill Dam, 9/21/2004, 3:32 PM

Table C-16.Appraisal Level Cost Estimate - Mid-Sea Blanketed Rockfill Dam with Sea at -240 ft MSL
Salton Sea Study
Quantities per lineal foot of DamBlanketed Rockfill Dam
-270 26,000 25 40 60 507 643 10
-260 7,500 15 35 40 248 350 10
-245 9,900 5 25 15 44 71 10
Totals 43,400
Total QuantitiesBlanketed Rockfill Dam
-270 26,000 25 40 60 13,192,593 16,713,667 264,815
-260 7,500 15 35 40 1,861,111 2,627,639 76,389
-245 9,900 5 25 15 440,000 704,550 100,833
Totals 43,400 15,493,704 20,045,856 442,037
Unit CostsBlanketed Rockfill Dam
-270 26,000 25 40 60 $2.90 $7.02 $8.00
-260 7,500 15 35 40 $2.90 $7.02 $8.00
-245 9,900 5 25 15 $2.90 $7.02 $8.00
Totals 43,400
Total CostsBlanketed Rockfill Dam
-270 26,000 25 40 60 $38,258,519 $117,329,940 $2,118,519
-260 7,500 15 35 40 $5,397,222 $18,446,025 $611,111
-245 9,900 5 25 15 $1,276,000 $4,945,941 $806,667
Totals 43,400 $44,931,741 $140,721,906 $3,536,296
TOTAL CONSTRUCTION COSTS $189,189,943
Notes: MOBILIZATION (5% of earthwork) $9,459,497
a. Assumes Sea level of -240 feet MSL. UNLISTED ITEMS 10% $18,918,994
b. Assumes 5 feet of freeboard. CONTRACT COST $217,568,434
c. Assumes 10 feet max overexcavation under crest. CONTINGENCIES 25% $54,392,109
d. Assumes 5.5 :1 average slope inclination (7:1 dnstrm, 4:1 upstrm). FIELD COST $271,960,543
e. Includes 6% compression of avg of soft sediments remaining. NONCONTRACT COSTS 30% $81,588,163
TOTAL PROJECT COST $353,548,706
Overex cDumpedRock d,e Riprap
Seafloor Elevation(ft MSL)
Length(lineal feet)
Assumed Overex Depth (feet)
Dam Height a,b
(feet)Assumed Soft
Soils Depth (feet)
Overex c
($/cy)
DumpedRock d,e
($/cy)
Riprap($/cy)
Seafloor Elevation(ft MSL)
Length(lineal feet)
Assumed Overex Depth (feet)
Dam Height a,b
(feet)Assumed Soft
Soils Depth (feet)
Overex c
(cy)
DumpedRock d,e
(cy)
Riprap(cy)
Seafloor Elevation(ft MSL)
Length(lineal feet)
Assumed Overex Depth (feet)
Dam Height a,b
(feet)Assumed Soft
Soils Depth (feet)
Overex c
(cy/lf)
DumpedRock d,e
(cy/lf)
Riprap(cy/lf)
Seafloor Elevation(ft MSL)
Length(lineal feet)
Assumed Overex Depth (feet)
Dam Height a,b
(feet)Assumed Soft
Soils Depth (feet)
Dam Concept Costs -240 ft MSL; Blanketed Rockfill Dam (7/15/2004; 2:48 PM)

Table C-17.Appraisal Level Cost Estimate - Mid-Sea Precast Concrete Caisson Dam with Sea at -240 ft MSL
Salton Sea Study
Unit Costs
Construct Caissons
($/lf)
Dry Dock ($/lf)
Place Caissons ($/lf)
Miscellaneous Operations
($/lf)
Dredging Allowance
($/lf)
Total Costs($/lf)
43,400 10,486$ 177$ 674$ 1,179$ 71$ 12,586$ Total Costs
Construct Caissons Dry Dock Place Caissons Miscellaneous
OperationsDredging Allowance Total Costs
43,400 $455,078,591 $7,693,636 $29,235,818 $51,162,682 $3,077,455 546,248,182$ TOTAL CONSTRUCTION COSTS $546,248,182
Notes: MOBILIZATION 5% $27,312,409a. Assumes Sea level of -240 feet MSL. UNLISTED ITEMS 10% $54,624,818b. Assumes 5 feet of freeboard. CONTRACT COST $628,185,409c. Assumes 70' o.d. caissons at 72' center-to-center spacing CONTINGENCIES 25% $157,046,352d. Assumes 2' gap closed with sheetpile FIELD COST $785,231,761
NONCONTRACT COSTS 30% $235,569,528TOTAL PROJECT COST $1,020,801,290
Length(lineal feet)
Seafloor Elevation(ft MSL)
Seafloor Elevation(ft MSL)
Length(lineal feet)
Dam Concept Costs -240 ft MSL; Precast Caissons (7/15/2004; 2:41 PM)
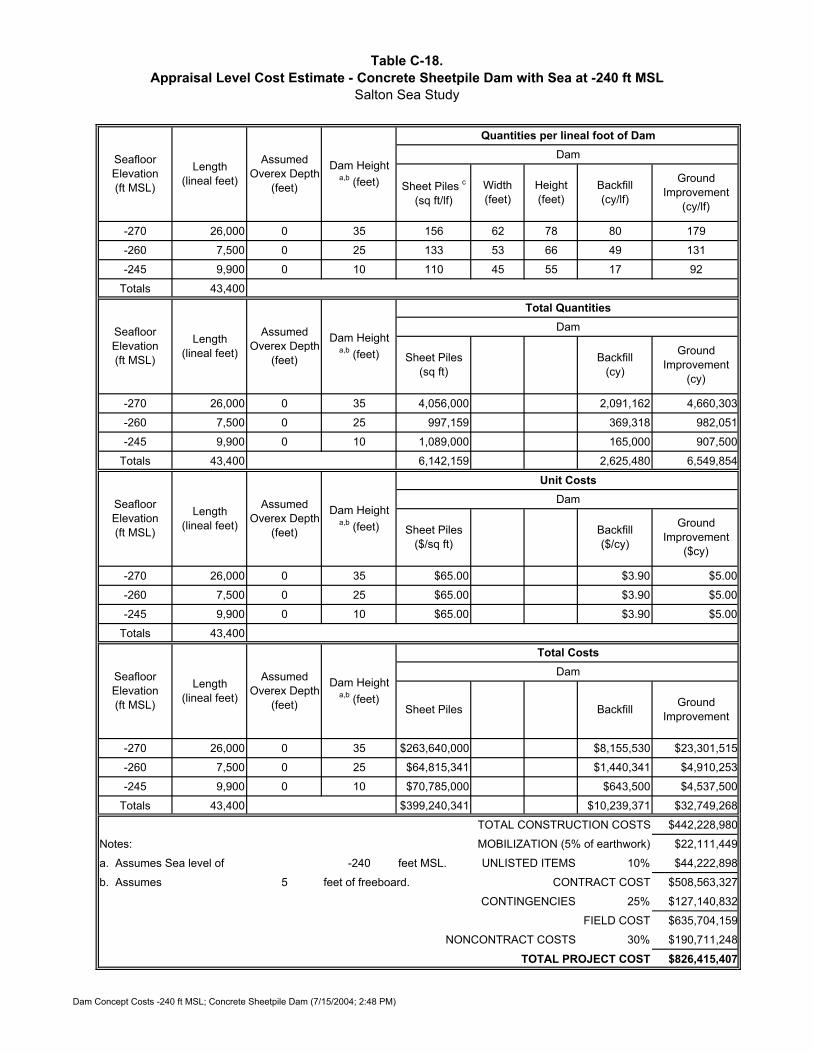
Table C-18.Appraisal Level Cost Estimate - Concrete Sheetpile Dam with Sea at -240 ft MSL
Salton Sea Study
Quantities per lineal foot of DamDam
-270 26,000 0 35 156 62 78 80 179
-260 7,500 0 25 133 53 66 49 131
-245 9,900 0 10 110 45 55 17 92
Totals 43,400
Total QuantitiesDam
-270 26,000 0 35 4,056,000 2,091,162 4,660,303
-260 7,500 0 25 997,159 369,318 982,051
-245 9,900 0 10 1,089,000 165,000 907,500
Totals 43,400 6,142,159 2,625,480 6,549,854
Unit CostsDam
-270 26,000 0 35 $65.00 $3.90 $5.00
-260 7,500 0 25 $65.00 $3.90 $5.00
-245 9,900 0 10 $65.00 $3.90 $5.00
Totals 43,400
Total CostsDam
-270 26,000 0 35 $263,640,000 $8,155,530 $23,301,515
-260 7,500 0 25 $64,815,341 $1,440,341 $4,910,253
-245 9,900 0 10 $70,785,000 $643,500 $4,537,500
Totals 43,400 $399,240,341 $10,239,371 $32,749,268
TOTAL CONSTRUCTION COSTS $442,228,980
Notes: MOBILIZATION (5% of earthwork) $22,111,449
a. Assumes Sea level of -240 feet MSL. UNLISTED ITEMS 10% $44,222,898
b. Assumes 5 feet of freeboard. CONTRACT COST $508,563,327
CONTINGENCIES 25% $127,140,832
FIELD COST $635,704,159
NONCONTRACT COSTS 30% $190,711,248
TOTAL PROJECT COST $826,415,407
Seafloor Elevation(ft MSL)
Length(lineal feet)
Assumed Overex Depth
(feet)
Dam Height a,b (feet) Sheet Piles c
(sq ft/lf)Backfill(cy/lf)
Ground Improvement
(cy/lf)
Width(feet)
Height(feet)
Seafloor Elevation(ft MSL)
Length(lineal feet)
Assumed Overex Depth
(feet)
Dam Height a,b (feet) Sheet Piles
(sq ft)Backfill
(cy)
Ground Improvement
(cy)
Seafloor Elevation(ft MSL)
Length(lineal feet)
Assumed Overex Depth
(feet)
Dam Height a,b (feet) Sheet Piles
($/sq ft)Backfill($/cy)
Sheet Piles Backfill
Seafloor Elevation(ft MSL)
Length(lineal feet)
Assumed Overex Depth
(feet)
Dam Height a,b (feet) Ground
Improvement
Ground Improvement
($cy)
Dam Concept Costs -240 ft MSL; Concrete Sheetpile Dam (7/15/2004; 2:48 PM)
APPENDIXC Appraisal Level Cost Estimates - Dam Concepts
W:\27662033\00002-a-r.doc\21-Sep-04\SDG
Rockfill Dam with Slurry Wall for Various Sea Levels

Table C-19.Appraisal Level Cost Estimate - Mid-Sea Rockfill Dam with Slurry Wall
Salton Sea Study
Quantities per lineal foot of DamBlanketed Rockfill Dam
-270 26,000 25 40 70 579 894 10 90
-260 7,500 15 35 50 299 540 10 70
-245 12,100 5 25 25 65 169 10 45
Totals 45,600
Total QuantitiesBlanketed Rockfill Dam
-270 26,000 25 40 70 15,046,296 23,236,296 264,815 2,340,000
-260 7,500 15 35 50 2,243,056 4,050,833 76,389 525,000
-245 12,100 5 25 25 784,259 2,040,643 123,241 544,500
Totals 45,600 18,073,611 29,327,772 464,444 3,409,500
Unit CostsBlanketed Rockfill Dam
-270 26,000 25 40 70 $2.90 $7.02 $8.00 $12.00
-260 7,500 15 35 50 $2.90 $7.02 $8.00 $12.00
-245 12,100 5 25 25 $2.90 $7.02 $8.00 $12.00
Totals 45,600
Total CostsBlanketed Rockfill Dam
-270 26,000 25 40 70 $43,634,259 $163,118,800 $2,118,519 $28,080,000
-260 7,500 15 35 50 $6,504,861 $28,436,850 $611,111 $6,300,000
-245 12,100 5 25 25 $2,274,352 $14,325,311 $985,926 $6,534,000
Totals 45,600 $52,413,472 $205,880,961 $3,715,556 $40,914,000
TOTAL CONSTRUCTION COSTS $302,923,989
Notes: MOBILIZATION (5% of earthwork) $15,146,199
a. Assumes Sea level of -230 feet MSL. UNLISTED ITEMS 10% $30,292,399
b. Assumes 5 feet of freeboard. CONTRACT COST $348,362,587
c. Assumes 10 feet max overexcavation under crest. CONTINGENCIES 25% $87,090,647
d. Assumes 5.5 :1 average slope inclination (7:1 dnstrm, 4:1 upstrm). FIELD COST $435,453,234
e. Includes 6% compression of avg of soft sediments remaining. NONCONTRACT COSTS 30% $130,635,970
TOTAL PROJECT COST $566,089,204
Slurry Wall($/sq ft)
Slurry Wall
Slurry Wall(sq ft/lf)
Slurry Wall(sq ft/lf)
Overex c
(cy/lf)
DumpedRock d,e
(cy/lf)
Riprap(cy/lf)
Seafloor Elevation(ft MSL)
Length(lineal feet)
Assumed Overex Depth (feet)
Dam Height a,b
(feet)Assumed Soft
Soils Depth (feet)
Overex c
(cy)
DumpedRock d,e
(cy)
Riprap(cy)
Seafloor Elevation(ft MSL)
Length(lineal feet)
Assumed Overex Depth (feet)
Dam Height a,b
(feet)Assumed Soft
Soils Depth (feet)
Overex c
($/cy)
DumpedRock d,e
($/cy)
Riprap($/cy)
Seafloor Elevation(ft MSL)
Length(lineal feet)
Assumed Overex Depth (feet)
Dam Height a,b
(feet)Assumed Soft
Soils Depth (feet)
Overex cDumpedRock d,e Riprap
Seafloor Elevation(ft MSL)
Length(lineal feet)
Assumed Overex Depth (feet)
Dam Height a,b
(feet)Assumed Soft
Soils Depth (feet)
Rockfill Dam vs Sea Level; Slurry Wall with -230 ft MSL (7/15/2004; 2:50 PM)
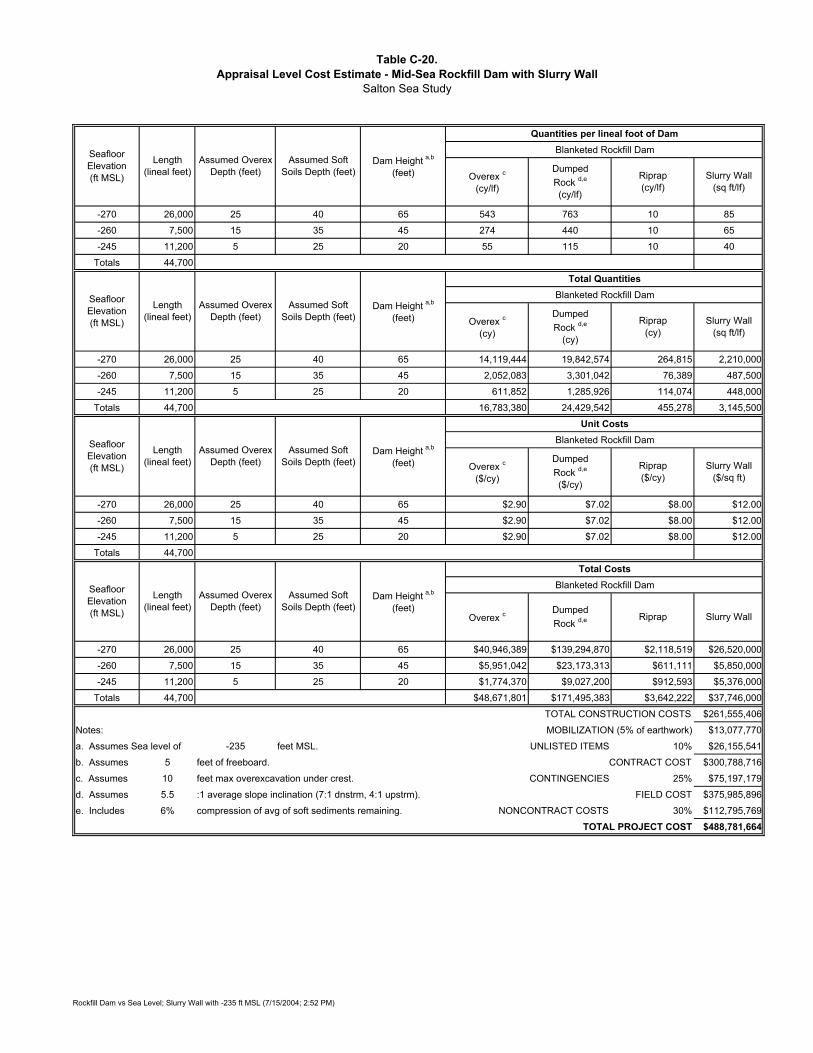
Table C-20.Appraisal Level Cost Estimate - Mid-Sea Rockfill Dam with Slurry Wall
Salton Sea Study
Quantities per lineal foot of DamBlanketed Rockfill Dam
-270 26,000 25 40 65 543 763 10 85
-260 7,500 15 35 45 274 440 10 65
-245 11,200 5 25 20 55 115 10 40
Totals 44,700
Total QuantitiesBlanketed Rockfill Dam
-270 26,000 25 40 65 14,119,444 19,842,574 264,815 2,210,000
-260 7,500 15 35 45 2,052,083 3,301,042 76,389 487,500
-245 11,200 5 25 20 611,852 1,285,926 114,074 448,000
Totals 44,700 16,783,380 24,429,542 455,278 3,145,500
Unit CostsBlanketed Rockfill Dam
-270 26,000 25 40 65 $2.90 $7.02 $8.00 $12.00
-260 7,500 15 35 45 $2.90 $7.02 $8.00 $12.00
-245 11,200 5 25 20 $2.90 $7.02 $8.00 $12.00
Totals 44,700
Total CostsBlanketed Rockfill Dam
-270 26,000 25 40 65 $40,946,389 $139,294,870 $2,118,519 $26,520,000
-260 7,500 15 35 45 $5,951,042 $23,173,313 $611,111 $5,850,000
-245 11,200 5 25 20 $1,774,370 $9,027,200 $912,593 $5,376,000
Totals 44,700 $48,671,801 $171,495,383 $3,642,222 $37,746,000
TOTAL CONSTRUCTION COSTS $261,555,406
Notes: MOBILIZATION (5% of earthwork) $13,077,770
a. Assumes Sea level of -235 feet MSL. UNLISTED ITEMS 10% $26,155,541
b. Assumes 5 feet of freeboard. CONTRACT COST $300,788,716
c. Assumes 10 feet max overexcavation under crest. CONTINGENCIES 25% $75,197,179
d. Assumes 5.5 :1 average slope inclination (7:1 dnstrm, 4:1 upstrm). FIELD COST $375,985,896
e. Includes 6% compression of avg of soft sediments remaining. NONCONTRACT COSTS 30% $112,795,769
TOTAL PROJECT COST $488,781,664
Overex cDumpedRock d,e Riprap
Seafloor Elevation(ft MSL)
Length(lineal feet)
Assumed Overex Depth (feet)
Dam Height a,b
(feet)Assumed Soft
Soils Depth (feet)
Overex c
($/cy)
DumpedRock d,e
($/cy)
Riprap($/cy)
Seafloor Elevation(ft MSL)
Length(lineal feet)
Assumed Overex Depth (feet)
Dam Height a,b
(feet)Assumed Soft
Soils Depth (feet)
Overex c
(cy)
DumpedRock d,e
(cy)
Riprap(cy)
Seafloor Elevation(ft MSL)
Length(lineal feet)
Assumed Overex Depth (feet)
Dam Height a,b
(feet)Assumed Soft
Soils Depth (feet)
Overex c
(cy/lf)
DumpedRock d,e
(cy/lf)
Riprap(cy/lf)
Seafloor Elevation(ft MSL)
Length(lineal feet)
Assumed Overex Depth (feet)
Dam Height a,b
(feet)Assumed Soft
Soils Depth (feet)
Slurry Wall($/sq ft)
Slurry Wall
Slurry Wall(sq ft/lf)
Slurry Wall(sq ft/lf)
Rockfill Dam vs Sea Level; Slurry Wall with -235 ft MSL (7/15/2004; 2:52 PM)

Table C-21.Appraisal Level Cost Estimate - Mid-Sea Rockfill Dam with Slurry Wall
Salton Sea Study
Quantities per lineal foot of DamBlanketed Rockfill Dam
-270 26,000 25 40 60 507 643 10 80
-260 7,500 15 35 40 248 350 10 60
-245 9,900 5 25 15 44 71 10 35
Totals 43,400
Total QuantitiesBlanketed Rockfill Dam
-270 26,000 25 40 60 13,192,593 16,713,667 264,815 2,080,000
-260 7,500 15 35 40 1,861,111 2,627,639 76,389 450,000
-245 9,900 5 25 15 440,000 704,550 100,833 346,500
Totals 43,400 15,493,704 20,045,856 442,037 2,876,500
Unit CostsBlanketed Rockfill Dam
-270 26,000 25 40 60 $2.90 $7.02 $8.00 $12.00
-260 7,500 15 35 40 $2.90 $7.02 $8.00 $12.00
-245 9,900 5 25 15 $2.90 $7.02 $8.00 $12.00
Totals 43,400
Total CostsBlanketed Rockfill Dam
-270 26,000 25 40 60 $38,258,519 $117,329,940 $2,118,519 $24,960,000
-260 7,500 15 35 40 $5,397,222 $18,446,025 $611,111 $5,400,000
-245 9,900 5 25 15 $1,276,000 $4,945,941 $806,667 $4,158,000
Totals 43,400 $44,931,741 $140,721,906 $3,536,296 $34,518,000
TOTAL CONSTRUCTION COSTS $223,707,943
Notes: MOBILIZATION (5% of earthwork) $11,185,397
a. Assumes Sea level of -240 feet MSL. UNLISTED ITEMS 10% $22,370,794
b. Assumes 5 feet of freeboard. CONTRACT COST $257,264,134
c. Assumes 10 feet max overexcavation under crest. CONTINGENCIES 25% $64,316,034
d. Assumes 5.5 :1 average slope inclination (7:1 dnstrm, 4:1 upstrm). FIELD COST $321,580,168
e. Includes 6% compression of avg of soft sediments remaining. NONCONTRACT COSTS 30% $96,474,050
TOTAL PROJECT COST $418,054,219
Slurry Wall($/sq ft)
Slurry Wall
Slurry Wall(sq ft/lf)
Slurry Wall(sq ft/lf)
Overex c
(cy/lf)
DumpedRock d,e
(cy/lf)
Riprap(cy/lf)
Seafloor Elevation(ft MSL)
Length(lineal feet)
Assumed Overex Depth (feet)
Dam Height a,b
(feet)Assumed Soft
Soils Depth (feet)
Overex c
(cy)
DumpedRock d,e
(cy)
Riprap(cy)
Seafloor Elevation(ft MSL)
Length(lineal feet)
Assumed Overex Depth (feet)
Dam Height a,b
(feet)Assumed Soft
Soils Depth (feet)
Overex c
($/cy)
DumpedRock d,e
($/cy)
Riprap($/cy)
Seafloor Elevation(ft MSL)
Length(lineal feet)
Assumed Overex Depth (feet)
Dam Height a,b
(feet)Assumed Soft
Soils Depth (feet)
Overex cDumpedRock d,e Riprap
Seafloor Elevation(ft MSL)
Length(lineal feet)
Assumed Overex Depth (feet)
Dam Height a,b
(feet)Assumed Soft
Soils Depth (feet)
Rockfill Dam vs Sea Level; Slurry Wall with -240 ft MSL (7/15/2004; 2:53 PM)
APPENDIXD Appraisal Level Cost Estimates - Barrier Concepts
W:\27662033\00002-a-r.doc\21-Sep-04\SDG
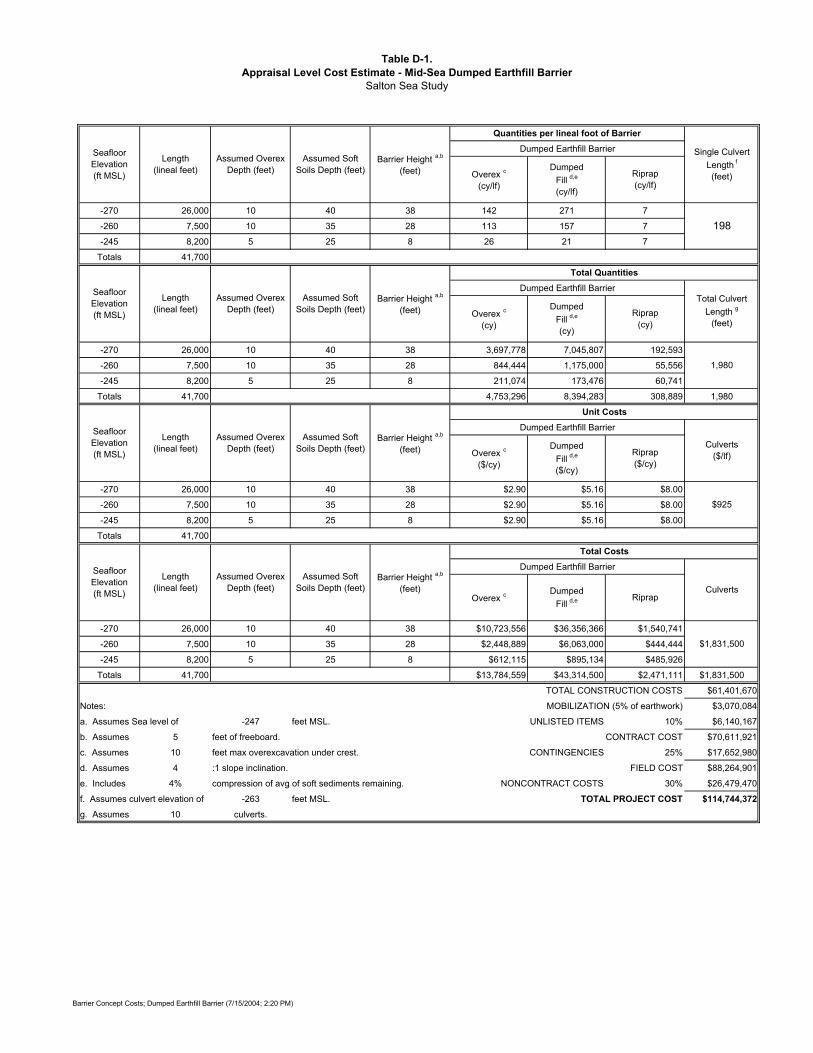
Table D-1.Appraisal Level Cost Estimate - Mid-Sea Dumped Earthfill Barrier
Salton Sea Study
Quantities per lineal foot of BarrierDumped Earthfill Barrier
-270 26,000 10 40 38 142 271 7
-260 7,500 10 35 28 113 157 7
-245 8,200 5 25 8 26 21 7
Totals 41,700
Total QuantitiesDumped Earthfill Barrier
-270 26,000 10 40 38 3,697,778 7,045,807 192,593
-260 7,500 10 35 28 844,444 1,175,000 55,556
-245 8,200 5 25 8 211,074 173,476 60,741
Totals 41,700 4,753,296 8,394,283 308,889 1,980
Unit CostsDumped Earthfill Barrier
-270 26,000 10 40 38 $2.90 $5.16 $8.00
-260 7,500 10 35 28 $2.90 $5.16 $8.00
-245 8,200 5 25 8 $2.90 $5.16 $8.00
Totals 41,700
Total CostsDumped Earthfill Barrier
-270 26,000 10 40 38 $10,723,556 $36,356,366 $1,540,741
-260 7,500 10 35 28 $2,448,889 $6,063,000 $444,444
-245 8,200 5 25 8 $612,115 $895,134 $485,926
Totals 41,700 $13,784,559 $43,314,500 $2,471,111 $1,831,500
TOTAL CONSTRUCTION COSTS $61,401,670
Notes: MOBILIZATION (5% of earthwork) $3,070,084
a. Assumes Sea level of -247 feet MSL. UNLISTED ITEMS 10% $6,140,167
b. Assumes 5 feet of freeboard. CONTRACT COST $70,611,921
c. Assumes 10 feet max overexcavation under crest. CONTINGENCIES 25% $17,652,980
d. Assumes 4 :1 slope inclination. FIELD COST $88,264,901
e. Includes 4% compression of avg of soft sediments remaining. NONCONTRACT COSTS 30% $26,479,470
f. Assumes culvert elevation of -263 feet MSL. TOTAL PROJECT COST $114,744,372g. Assumes 10 culverts.
Overex c
(cy/lf)
DumpedFill d,e
(cy/lf)
Riprap(cy/lf)
Seafloor Elevation(ft MSL)
Length(lineal feet)
Assumed Overex Depth (feet)
Barrier Height a,b
(feet)Assumed Soft
Soils Depth (feet)
Overex c
(cy)
DumpedFill d,e
(cy)
Riprap(cy)
Seafloor Elevation(ft MSL)
Length(lineal feet)
Assumed Overex Depth (feet)
Barrier Height a,b
(feet)Assumed Soft
Soils Depth (feet)
Overex c
($/cy)
DumpedFill d,e
($/cy)
Riprap($/cy)
Seafloor Elevation(ft MSL)
Length(lineal feet)
Assumed Overex Depth (feet)
Barrier Height a,b
(feet)Assumed Soft
Soils Depth (feet)
Overex c DumpedFill d,e Riprap
Seafloor Elevation(ft MSL)
Length(lineal feet)
Assumed Overex Depth (feet)
Barrier Height a,b
(feet)Assumed Soft
Soils Depth (feet)
$925
Culverts ($/lf)
Culverts
$1,831,500
198
Single Culvert Length f
(feet)
Total Culvert Length g
(feet)
1,980
Barrier Concept Costs; Dumped Earthfill Barrier (7/15/2004; 2:20 PM)
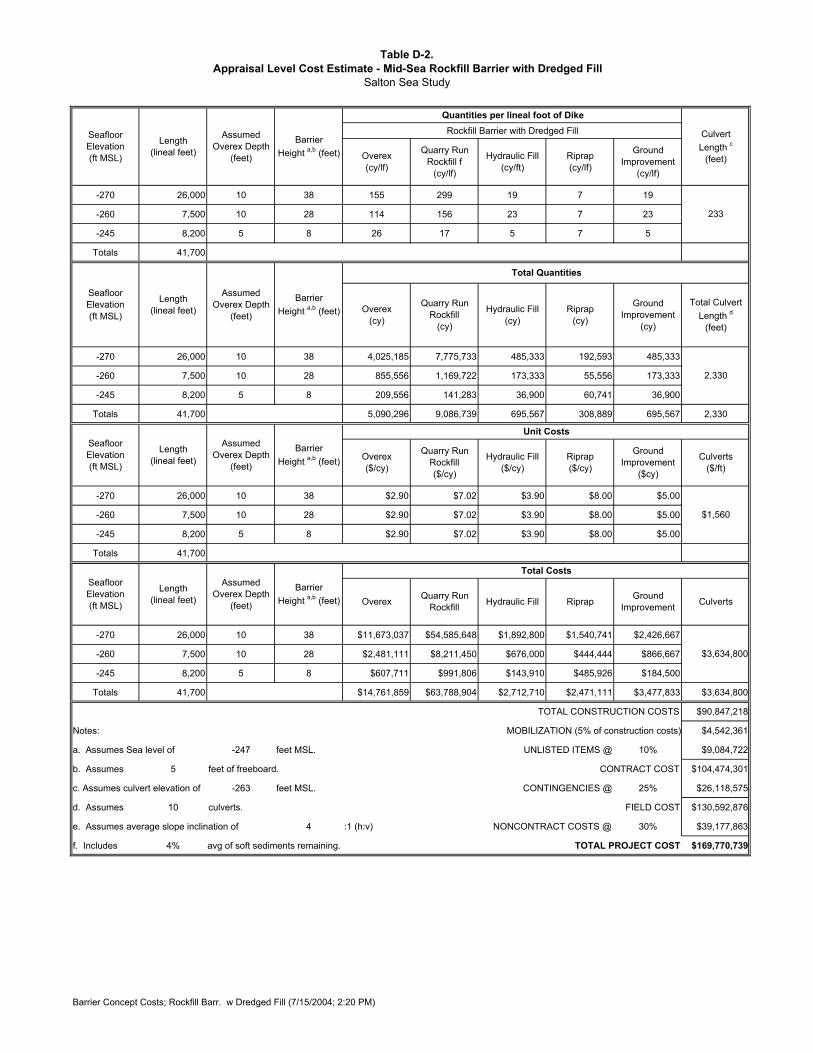
Table D-2.Appraisal Level Cost Estimate - Mid-Sea Rockfill Barrier with Dredged Fill
Salton Sea Study
Quantities per lineal foot of DikeRockfill Barrier with Dredged Fill
-270 26,000 10 38 155 299 19 7 19
-260 7,500 10 28 114 156 23 7 23
-245 8,200 5 8 26 17 5 7 5
Totals 41,700
Total Quantities
-270 26,000 10 38 4,025,185 7,775,733 485,333 192,593 485,333
-260 7,500 10 28 855,556 1,169,722 173,333 55,556 173,333
-245 8,200 5 8 209,556 141,283 36,900 60,741 36,900
Totals 41,700 5,090,296 9,086,739 695,567 308,889 695,567 2,330
Unit Costs
-270 26,000 10 38 $2.90 $7.02 $3.90 $8.00 $5.00
-260 7,500 10 28 $2.90 $7.02 $3.90 $8.00 $5.00
-245 8,200 5 8 $2.90 $7.02 $3.90 $8.00 $5.00
Totals 41,700
Total Costs
-270 26,000 10 38 $11,673,037 $54,585,648 $1,892,800 $1,540,741 $2,426,667
-260 7,500 10 28 $2,481,111 $8,211,450 $676,000 $444,444 $866,667
-245 8,200 5 8 $607,711 $991,806 $143,910 $485,926 $184,500
Totals 41,700 $14,761,859 $63,788,904 $2,712,710 $2,471,111 $3,477,833 $3,634,800
TOTAL CONSTRUCTION COSTS $90,847,218
Notes: MOBILIZATION (5% of construction costs) $4,542,361
a. Assumes Sea level of -247 feet MSL. UNLISTED ITEMS @ 10% $9,084,722
b. Assumes 5 feet of freeboard. CONTRACT COST $104,474,301
c. Assumes culvert elevation of -263 feet MSL. CONTINGENCIES @ 25% $26,118,575
d. Assumes 10 culverts. FIELD COST $130,592,876
e. Assumes average slope inclination of 4 :1 (h:v) NONCONTRACT COSTS @ 30% $39,177,863
f. Includes 4% avg of soft sediments remaining. TOTAL PROJECT COST $169,770,739
Ground Improvement
(cy/lf)
Ground Improvement
(cy)
Ground Improvement
($cy)
Ground ImprovementOverex Quarry Run
Rockfill RiprapHydraulic Fill
Seafloor Elevation(ft MSL)
Length(lineal feet)
Assumed Overex Depth
(feet)
Barrier Height a,b (feet)
Overex($/cy)
Quarry Run Rockfill($/cy)
Riprap($/cy)
Hydraulic Fill ($/cy)
Seafloor Elevation(ft MSL)
Length(lineal feet)
Assumed Overex Depth
(feet)
Barrier Height a,b (feet)
Seafloor Elevation(ft MSL)
Length(lineal feet)
Assumed Overex Depth
(feet)
Barrier Height a,b (feet) Overex
(cy)
Quarry Run Rockfill
(cy)
Riprap(cy)
Hydraulic Fill (cy)
Seafloor Elevation(ft MSL)
Length(lineal feet)
Assumed Overex Depth
(feet)
Barrier Height a,b (feet) Overex
(cy/lf)
Quarry Run Rockfill f
(cy/lf)
Riprap(cy/lf)
Hydraulic Fill (cy/ft)
CulvertLength c
(feet)
Total Culvert Length d
(feet)
233
$3,634,800
$1,560
2,330
Culverts($/ft)
Culverts
Barrier Concept Costs; Rockfill Barr. w Dredged Fill (7/15/2004; 2:20 PM)
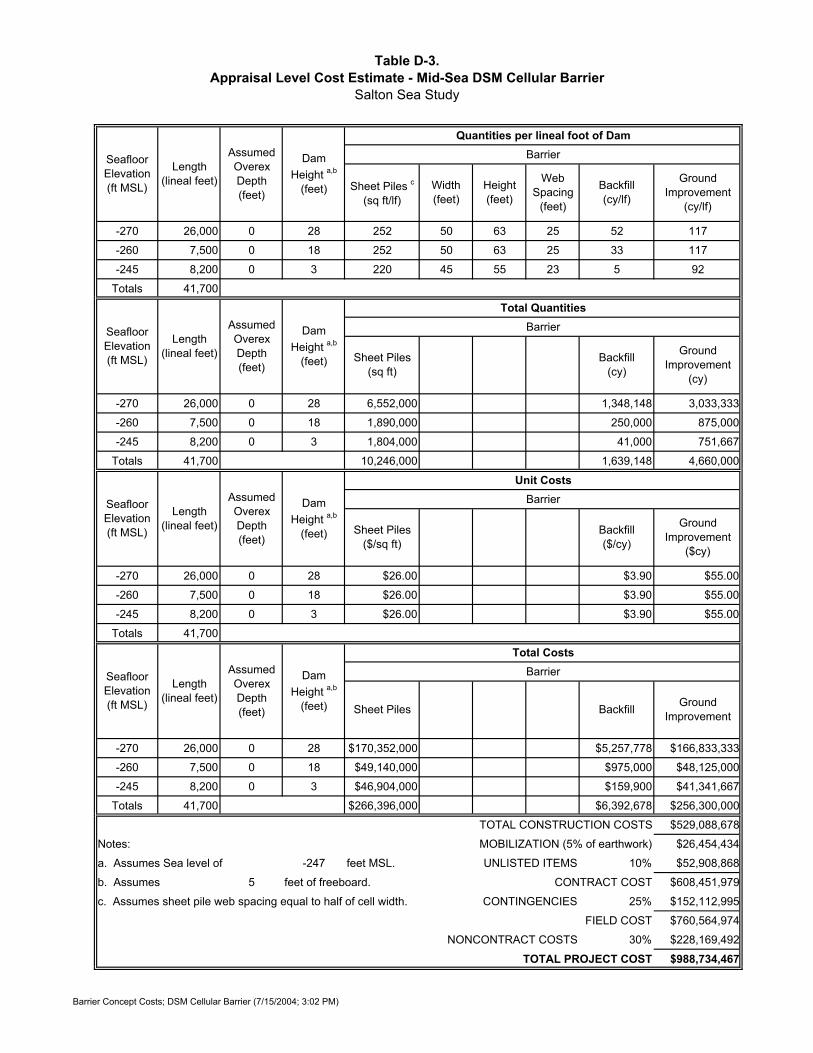
Table D-3.Appraisal Level Cost Estimate - Mid-Sea DSM Cellular Barrier
Salton Sea Study
Quantities per lineal foot of DamBarrier
-270 26,000 0 28 252 50 63 25 52 117
-260 7,500 0 18 252 50 63 25 33 117
-245 8,200 0 3 220 45 55 23 5 92
Totals 41,700
Total QuantitiesBarrier
-270 26,000 0 28 6,552,000 1,348,148 3,033,333
-260 7,500 0 18 1,890,000 250,000 875,000
-245 8,200 0 3 1,804,000 41,000 751,667
Totals 41,700 10,246,000 1,639,148 4,660,000
Unit CostsBarrier
-270 26,000 0 28 $26.00 $3.90 $55.00
-260 7,500 0 18 $26.00 $3.90 $55.00
-245 8,200 0 3 $26.00 $3.90 $55.00
Totals 41,700
Total CostsBarrier
-270 26,000 0 28 $170,352,000 $5,257,778 $166,833,333
-260 7,500 0 18 $49,140,000 $975,000 $48,125,000
-245 8,200 0 3 $46,904,000 $159,900 $41,341,667
Totals 41,700 $266,396,000 $6,392,678 $256,300,000
TOTAL CONSTRUCTION COSTS $529,088,678
Notes: MOBILIZATION (5% of earthwork) $26,454,434
a. Assumes Sea level of -247 feet MSL. UNLISTED ITEMS 10% $52,908,868
b. Assumes 5 feet of freeboard. CONTRACT COST $608,451,979
c. Assumes sheet pile web spacing equal to half of cell width. CONTINGENCIES 25% $152,112,995
FIELD COST $760,564,974
NONCONTRACT COSTS 30% $228,169,492
TOTAL PROJECT COST $988,734,467
Seafloor Elevation (ft MSL)
Length(lineal feet)
Assumed Overex Depth (feet)
Dam Height a,b
(feet) Sheet Piles c
(sq ft/lf)Backfill(cy/lf)
Ground Improvement
(cy/lf)
Width(feet)
Web Spacing
(feet)
Height(feet)
Seafloor Elevation (ft MSL)
Length(lineal feet)
Assumed Overex Depth (feet)
Dam Height a,b
(feet) Sheet Piles(sq ft)
Backfill(cy)
Ground Improvement
(cy)
Seafloor Elevation (ft MSL)
Length(lineal feet)
Assumed Overex Depth (feet)
Dam Height a,b
(feet) Sheet Piles($/sq ft)
Backfill($/cy)
Sheet Piles Backfill
Seafloor Elevation (ft MSL)
Length(lineal feet)
Assumed Overex Depth (feet)
Dam Height a,b
(feet) Ground Improvement
Ground Improvement
($cy)
Barrier Concept Costs; DSM Cellular Barrier (7/15/2004; 3:02 PM)
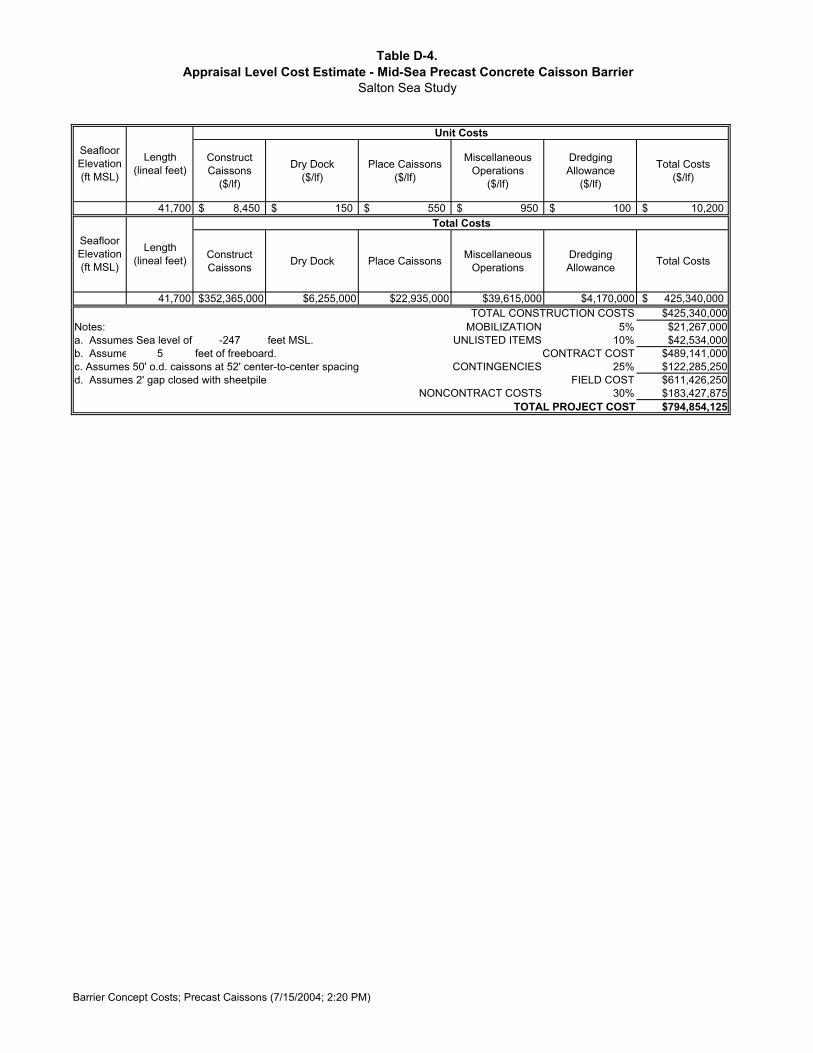
Table D-4.Appraisal Level Cost Estimate - Mid-Sea Precast Concrete Caisson Barrier
Salton Sea Study
Unit Costs
Construct Caissons
($/lf)
Dry Dock ($/lf)
Place Caissons ($/lf)
Miscellaneous Operations
($/lf)
Dredging Allowance
($/lf)
Total Costs($/lf)
41,700 8,450$ 150$ 550$ 950$ 100$ 10,200$ Total Costs
Construct Caissons Dry Dock Place Caissons Miscellaneous
OperationsDredging Allowance Total Costs
41,700 $352,365,000 $6,255,000 $22,935,000 $39,615,000 $4,170,000 425,340,000$ TOTAL CONSTRUCTION COSTS $425,340,000
Notes: MOBILIZATION 5% $21,267,000a. Assumes Sea level of -247 feet MSL. UNLISTED ITEMS 10% $42,534,000b. Assume 5 feet of freeboard. CONTRACT COST $489,141,000c. Assumes 50' o.d. caissons at 52' center-to-center spacing CONTINGENCIES 25% $122,285,250d. Assumes 2' gap closed with sheetpile FIELD COST $611,426,250
NONCONTRACT COSTS 30% $183,427,875TOTAL PROJECT COST $794,854,125
Seafloor Elevation(ft MSL)
Length(lineal feet)
Seafloor Elevation(ft MSL)
Length(lineal feet)
Barrier Concept Costs; Precast Caissons (7/15/2004; 2:20 PM)
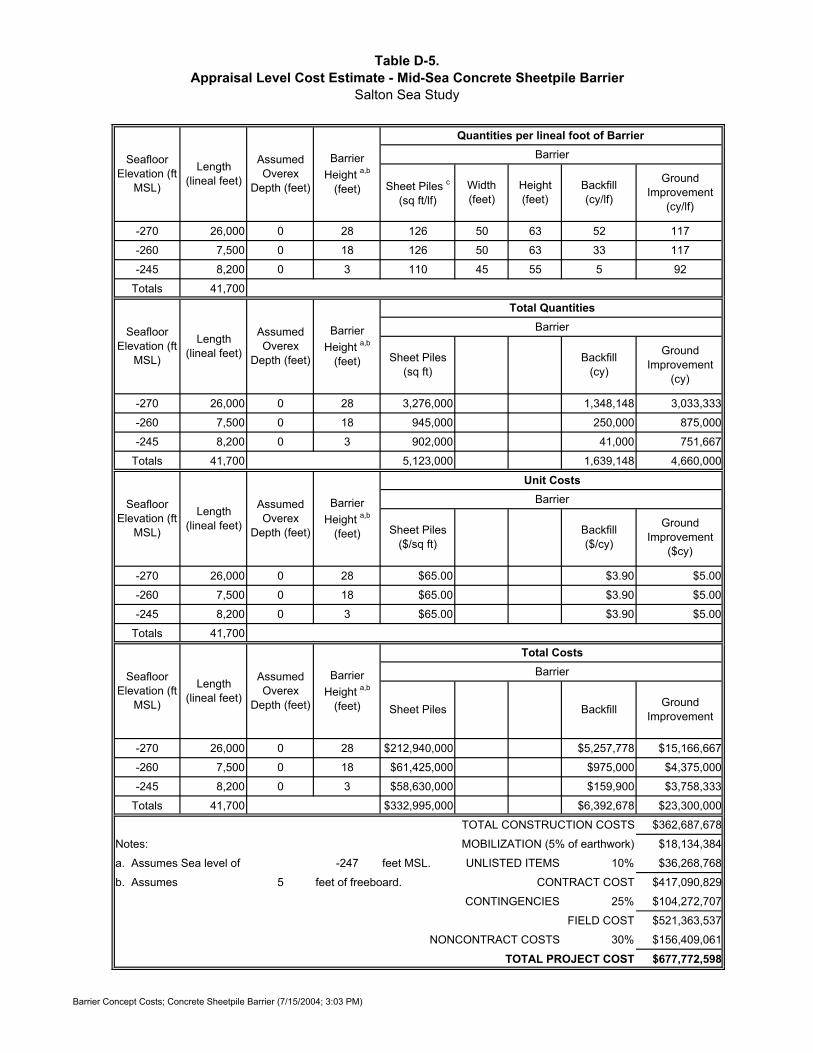
Table D-5.Appraisal Level Cost Estimate - Mid-Sea Concrete Sheetpile Barrier
Salton Sea Study
Quantities per lineal foot of Barrier Barrier
-270 26,000 0 28 126 50 63 52 117
-260 7,500 0 18 126 50 63 33 117
-245 8,200 0 3 110 45 55 5 92
Totals 41,700
Total QuantitiesBarrier
-270 26,000 0 28 3,276,000 1,348,148 3,033,333
-260 7,500 0 18 945,000 250,000 875,000
-245 8,200 0 3 902,000 41,000 751,667
Totals 41,700 5,123,000 1,639,148 4,660,000
Unit CostsBarrier
-270 26,000 0 28 $65.00 $3.90 $5.00
-260 7,500 0 18 $65.00 $3.90 $5.00
-245 8,200 0 3 $65.00 $3.90 $5.00
Totals 41,700
Total CostsBarrier
-270 26,000 0 28 $212,940,000 $5,257,778 $15,166,667
-260 7,500 0 18 $61,425,000 $975,000 $4,375,000
-245 8,200 0 3 $58,630,000 $159,900 $3,758,333
Totals 41,700 $332,995,000 $6,392,678 $23,300,000
TOTAL CONSTRUCTION COSTS $362,687,678
Notes: MOBILIZATION (5% of earthwork) $18,134,384
a. Assumes Sea level of -247 feet MSL. UNLISTED ITEMS 10% $36,268,768
b. Assumes 5 feet of freeboard. CONTRACT COST $417,090,829
CONTINGENCIES 25% $104,272,707
FIELD COST $521,363,537
NONCONTRACT COSTS 30% $156,409,061
TOTAL PROJECT COST $677,772,598
Ground Improvement
Ground Improvement
($cy)
Seafloor Elevation (ft
MSL)
Length(lineal feet)
Assumed Overex
Depth (feet)
Barrier Height a,b
(feet)
Sheet Piles($/sq ft)
Backfill($/cy)
Sheet Piles Backfill
Seafloor Elevation (ft
MSL)
Length(lineal feet)
Assumed Overex
Depth (feet)
Barrier Height a,b
(feet)
Sheet Piles(sq ft)
Backfill(cy)
Ground Improvement
(cy)
Seafloor Elevation (ft
MSL)
Length(lineal feet)
Assumed Overex
Depth (feet)
Barrier Height a,b
(feet)
Sheet Piles c
(sq ft/lf)Backfill(cy/lf)
Ground Improvement
(cy/lf)
Width(feet)
Height(feet)
Seafloor Elevation (ft
MSL)
Length(lineal feet)
Assumed Overex
Depth (feet)
Barrier Height a,b
(feet)
Barrier Concept Costs; Concrete Sheetpile Barrier (7/15/2004; 3:03 PM)
APPENDIXE Salinity and Sea Level Predictions
W:\27662033\00002-a-r.doc\21-Sep-04\SDG
APPENDIXE Salinity and Sea Level Predictions
W:\27662033\00002-a-r.doc\21-Sep-04\SDG E-1
The Bureau of Reclamation (Reclamation), Imperial Irrigation District (IID), and Coachella Valley Water District (CVWD) have studied historic and potential future inflows to Salton Sea in detail (Weghorst, 2001). This hydrology work has served as the basis for the development of the Salton Sea Accounting Model (Model). The Model was used to assess the performance of the structures evaluated in this document, with respect to salinity and elevation and other related variables. The assessment included an evaluation of approved water transfer agreements on conditions in the Salton Sea. The Model is a computer application used to simulate historic and future inflows to the Salton Sea.
E.1 HISTORIC INFLOW, SALINITY AND ELEVATION
Inflows to the Salton Sea are not constant and have varied from a minimum of 1.19 million acre-feet per year (maf/yr) in 1992 to a maximum of 1.50 maf/yr in 1963. Figure E-1a depicts a history of inflows into the Salton Sea for the years 1950 to 1999 (Weghorst, 2001). The average annual inflow for this period was 1.34 maf/yr. The historic salt load into the Salton Sea has also been variable. Figure E-1b presents a history of salt load to the Sea. A minimum load of 3.0 million tons occurred in 1950. A maximum salt load of 6.1 million tons occurred in 1977. The average annual salt load to the Salton Sea for the period 1950 to 1999 was 4.5 million tons per year (ton/yr). It appears that salt loading has leveled off at around 4 million ton/yr.
In 2000-2001, the Salton Sea had an average salinity level of about 44,000 milligrams per liter (mg/L) (Weghorst, 2001). Expectations are that salinity levels within the Sea will continue to increase as a result of evaporation and continuous inflows of salt-laden water from agricultural drainage water from irrigation districts around the Sea and from agricultural and municipal use in Mexico.
IID estimates annual average salinity for the Sea from surface samples taken at Bertam Station, Desert Beach, Sandy Beach, and Salton Sea Beach. A historic record exists from 1950 through present, with data available up to 1999. Figure E-2a depicts historic Salton Sea salinity values through time. Beginning in 1992, the rate of salinity increase in the Sea began declining. A similar, but more pronounced, reduction in salinity occurred between 1972 and 1980. A much more dramatic reduction occurred from 1950 to 1955.
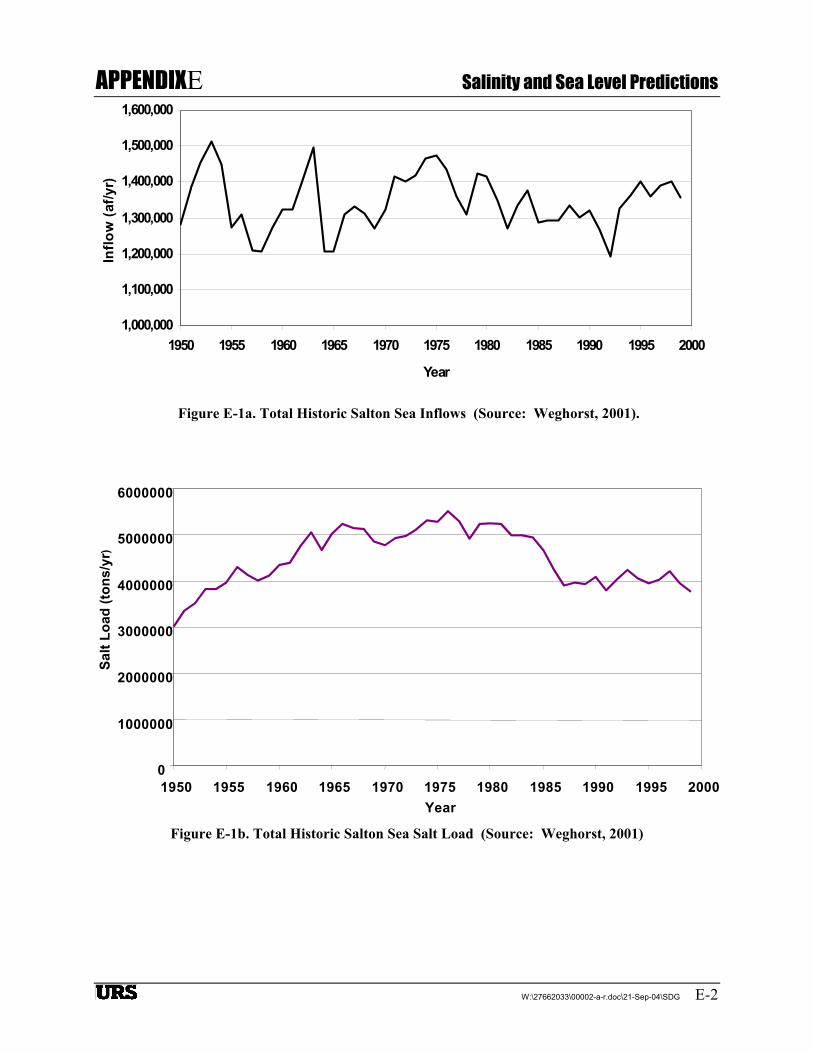
APPENDIXE Salinity and Sea Level Predictions
W:\27662033\00002-a-r.doc\21-Sep-04\SDG E-2
Figure E-1a. Total Historic Salton Sea Inflows (Source: Weghorst, 2001).
Figure E-1b. Total Historic Salton Sea Salt Load (Source: Weghorst, 2001)
1,000,000
1,100,000
1,200,000
1,300,000
1,400,000
1,500,000
1,600,000
1950 1955 1960 1965 1970 1975 1980 1985 1990 1995 2000
Year
Inflo
w (a
f/yr)
0
1000000
2000000
3000000
4000000
5000000
6000000
1950 1955 1960 1965 1970 1975 1980 1985 1990 1995 2000Year
Salt
Load
(ton
s/yr
)
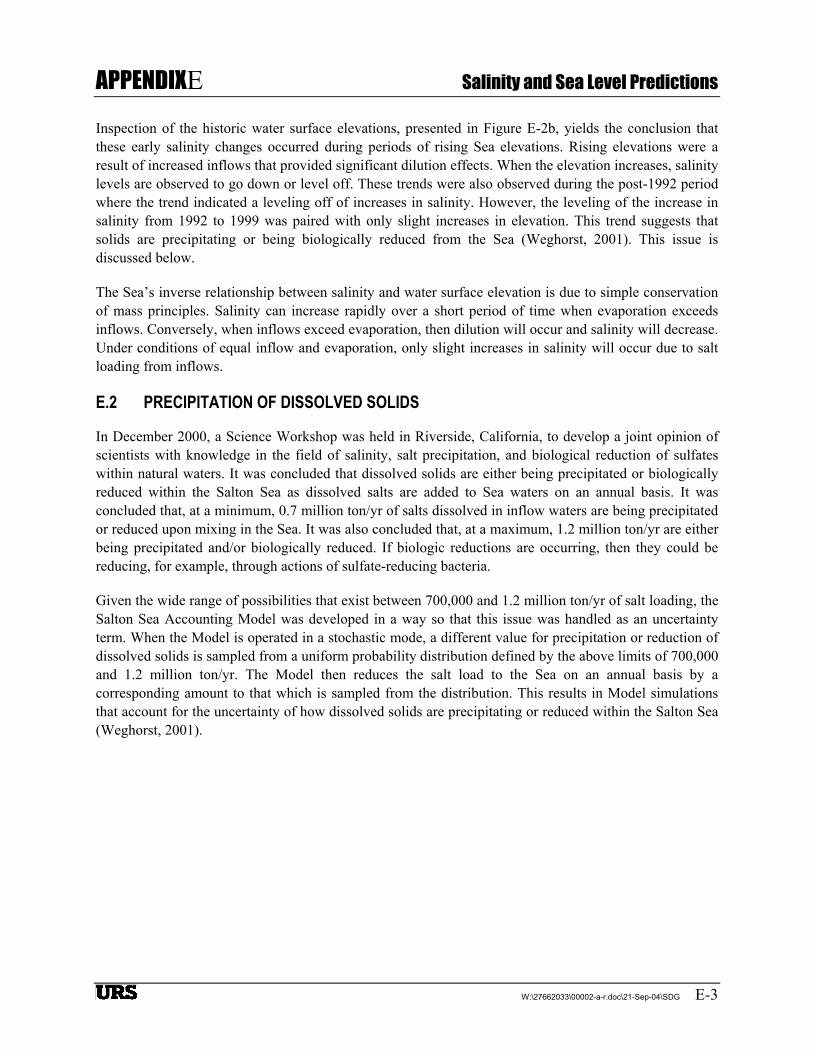
APPENDIXE Salinity and Sea Level Predictions
W:\27662033\00002-a-r.doc\21-Sep-04\SDG E-3
Inspection of the historic water surface elevations, presented in Figure E-2b, yields the conclusion that these early salinity changes occurred during periods of rising Sea elevations. Rising elevations were a result of increased inflows that provided significant dilution effects. When the elevation increases, salinity levels are observed to go down or level off. These trends were also observed during the post-1992 period where the trend indicated a leveling off of increases in salinity. However, the leveling of the increase in salinity from 1992 to 1999 was paired with only slight increases in elevation. This trend suggests that solids are precipitating or being biologically reduced from the Sea (Weghorst, 2001). This issue is discussed below.
The Sea’s inverse relationship between salinity and water surface elevation is due to simple conservation of mass principles. Salinity can increase rapidly over a short period of time when evaporation exceeds inflows. Conversely, when inflows exceed evaporation, then dilution will occur and salinity will decrease. Under conditions of equal inflow and evaporation, only slight increases in salinity will occur due to salt loading from inflows.
E.2 PRECIPITATION OF DISSOLVED SOLIDS
In December 2000, a Science Workshop was held in Riverside, California, to develop a joint opinion of scientists with knowledge in the field of salinity, salt precipitation, and biological reduction of sulfates within natural waters. It was concluded that dissolved solids are either being precipitated or biologically reduced within the Salton Sea as dissolved salts are added to Sea waters on an annual basis. It was concluded that, at a minimum, 0.7 million ton/yr of salts dissolved in inflow waters are being precipitated or reduced upon mixing in the Sea. It was also concluded that, at a maximum, 1.2 million ton/yr are either being precipitated and/or biologically reduced. If biologic reductions are occurring, then they could be reducing, for example, through actions of sulfate-reducing bacteria.
Given the wide range of possibilities that exist between 700,000 and 1.2 million ton/yr of salt loading, the Salton Sea Accounting Model was developed in a way so that this issue was handled as an uncertainty term. When the Model is operated in a stochastic mode, a different value for precipitation or reduction of dissolved solids is sampled from a uniform probability distribution defined by the above limits of 700,000 and 1.2 million ton/yr. The Model then reduces the salt load to the Sea on an annual basis by a corresponding amount to that which is sampled from the distribution. This results in Model simulations that account for the uncertainty of how dissolved solids are precipitating or reduced within the Salton Sea (Weghorst, 2001).
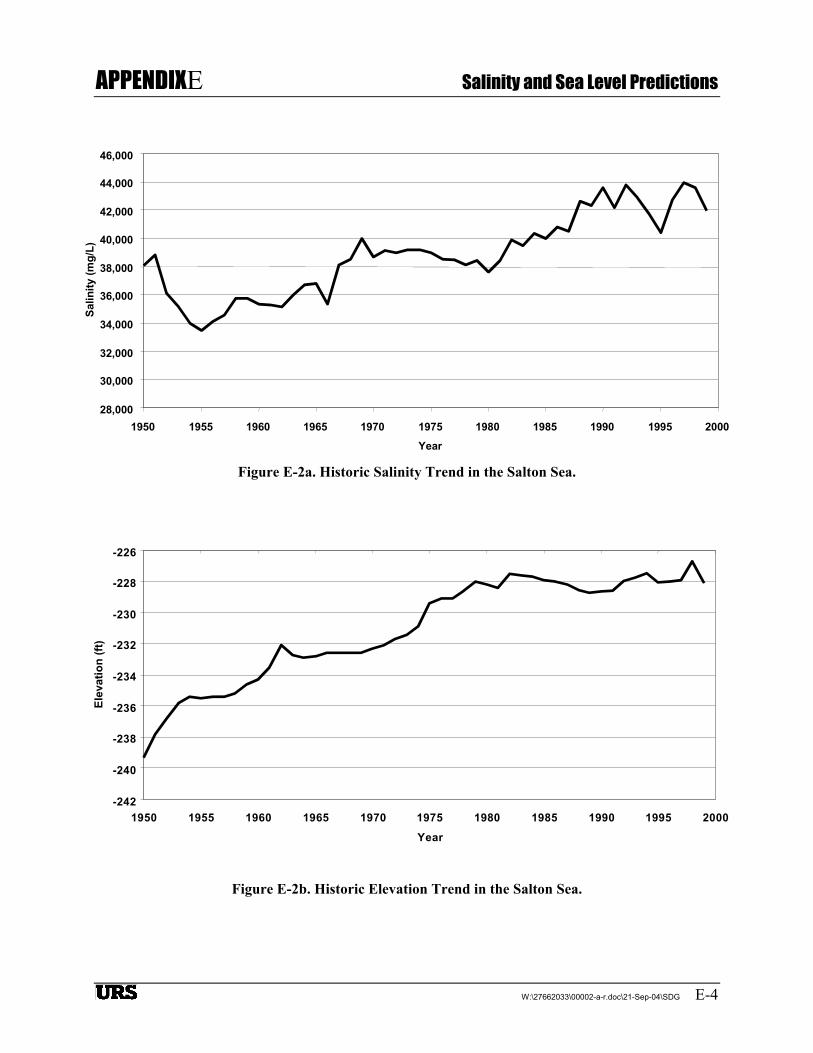
APPENDIXE Salinity and Sea Level Predictions
W:\27662033\00002-a-r.doc\21-Sep-04\SDG E-4
Figure E-2a. Historic Salinity Trend in the Salton Sea.
Figure E-2b. Historic Elevation Trend in the Salton Sea.
28,000
30,000
32,000
34,000
36,000
38,000
40,000
42,000
44,000
46,000
1950 1955 1960 1965 1970 1975 1980 1985 1990 1995 2000
Year
Salin
ity (m
g/L)
-242
-240
-238
-236
-234
-232
-230
-228
-226
1950 1955 1960 1965 1970 1975 1980 1985 1990 1995 2000
Year
Elev
atio
n (ft
)
APPENDIXE Salinity and Sea Level Predictions
W:\27662033\00002-a-r.doc\21-Sep-04\SDG E-5
The Science Workshop participants were not able to come to any conclusions about whether or not the rate of precipitation and/or biological reduction would change at higher or lower salinities relative to current conditions. It was also not possible to ascertain whether or not salts that might have precipitated historically might be brought back into solution at lower salinities. There is good reason to believe that precipitation has not been occurring on a large scale and that biological processes are the dominate influence. Therefore if salts were to be re-dissolved at lower salinities then the amount available would be small. The Salton Sea Accounting Model therefore assumes that the uniform distribution used to stochastically simulate precipitation and/or reduction is applicable at both lower and higher salinities from current conditions.
E.3 BASELINE INFLOW CONDITIONS
There are actions in place that are likely to affect, or have already affected, inflows to the Salton Sea. Included in these are a 4.4 maf/yr normal year limited entitlement to Colorado River water for the State of California, increased salinity in the Colorado River, pre-existing conservation, historic aquifer pumping effects in the Coachella Valley, and activities in Mexico. The effects of these actions combined with meteorological, economic, and demand factors will define the near-term inflows. The exact effects of these historic actions are difficult to assess. For purposes of analysis in this report, the maximum future inflow conditions analyzed are similar to the baseline conditions used in the recently published Draft Environmental Impact Report/Environmental Impact Statement (EIR/EIS) for the IID Water Transfer Program. The average future baseline inflow presented in this document is 1.23 maf/yr.
The Model operates stochastically and, therefore, uses a different future sequence of inflows for each simulation. Figure E-3a presents a sample future inflow sequences with an average annual value of 1.23 maf/yr.
The salt load to the Salton Sea is assumed to be equal to that forecasted by the water districts and presented by Weghorst (2001), which is consistent with an inflow of 1.23 maf/yr. The average annual baseline salt load used in all simulations is 3.8 million ton/yr. Figure E-3b shows a sample stochastic sequence of inflowing salt load from the Model with an average annual value of 3.8 million tons/yr. The salt load is shown decreasing in the future because of Salton Sea water intrusion into the Coachella Aquifer.
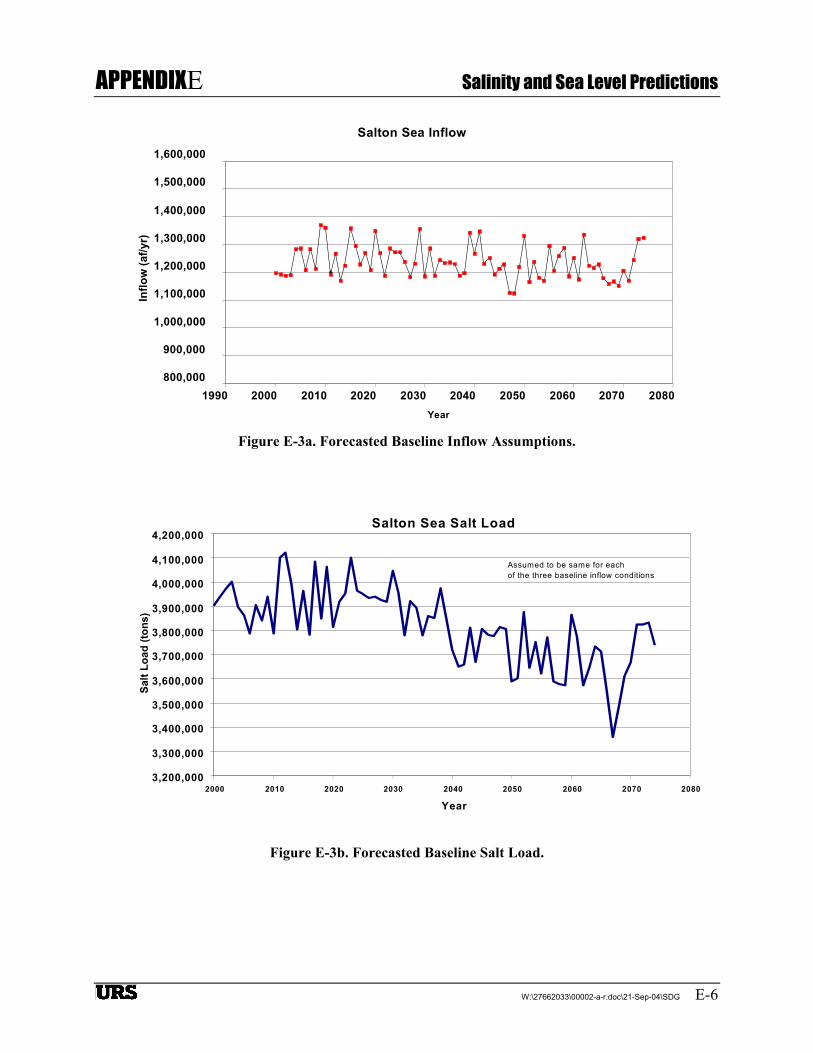
APPENDIXE Salinity and Sea Level Predictions
W:\27662033\00002-a-r.doc\21-Sep-04\SDG E-6
Figure E-3a. Forecasted Baseline Inflow Assumptions.
Figure E-3b. Forecasted Baseline Salt Load.
Salton Sea Inflow
800,000
900,000
1,000,000
1,100,000
1,200,000
1,300,000
1,400,000
1,500,000
1,600,000
1990 2000 2010 2020 2030 2040 2050 2060 2070 2080Year
Inflo
w (a
f/yr)
Salton Sea Salt Load
3,200,000 3,300,000
3,400,000 3,500,000 3,600,000
3,700,000 3,800,000 3,900,000
4,000,000 4,100,000
4,200,000
2000 2010 2020 2030 2040 2050 2060 2070 2080
Year
Salt
Load
(ton
s)
Assumed to be same for each of the three baseline inflow conditions
APPENDIXE Salinity and Sea Level Predictions
W:\27662033\00002-a-r.doc\21-Sep-04\SDG E-7
E.4 FUTURE INFLOW PROJECTIONS
With implementation of the Quantification Settlement Agreement (QSA), the average inflow to the Sea is expected to decrease over about 15 to 20 years from a baseline of 1.23 maf/yr to an expected inflow of about 930,000 af/yr. While the water transfer agreements contain predictable transfer schedules, there is an option for transferring up to 1.6 million acre feet of additional water if the water is not needed to mitigate effects to the Salton Sea. In addition, inflow to the New River from Mexico, where the flow originates, may also be subject to future reductions. For example, reductions in Colorado River flows to Mexico could, in turn, affect New River flows back across the border. It is also possible that the Coachella Valley groundwater management program would affect inflows. These variables translate to an uncertainty with respect to actual Salton Sea inflows. Therefore, three inflow scenarios are considered in this report:
1. The anticipated QSA schedule that includes salinity management deliveries (mitigation water) to offset salinity effects to the Salton Sea over the next 15 years;
2. The QSA schedule with the salinity management water terminated in 2006 and sale of additional water to generate restoration funds; and
3. A schedule that would reduce average inflow to about 800,000 af/yr.
The three inflow scenarios are illustrated in Figure E-4.
Under all three inflow scenarios, without restoration, salinity in the Sea would more than double over a period of 20 to 25 years, while the water surface elevation would decrease by about 20 feet over the same period.
E.5 OVERVIEW OF SALTON SEA ACCOUNTING MODEL
Assessment of the future of the Salton Sea is dependent on the ability to predict the hydrologic response of the Sea to changing conditions. Foreseeable changes include a range of water conservation programs within the Salton Basin, as well as possible restoration activities. Conservation programs would likely change inflows of both water and dissolved solids into the Sea. Predicting hydrologic response due to these possible changes requires a predictive computer model of the Salton Sea.
The Salton Sea Accounting Model was developed to predict hydrologic response to possible changes in the Sea (Weghorst, 2001). It allows the effective evaluation of historic, present, and future conditions within the Sea. Specifically, the Model predicts changes in inflow, elevation, surface area, and salinity. Special operating requirements included the need to simulate:
• Future reductions in inflow • Future changes in salt loads into the Sea • Salt precipitation and/or biological reduction • Imports of water • Exports of water • Dividing the Sea into two basins
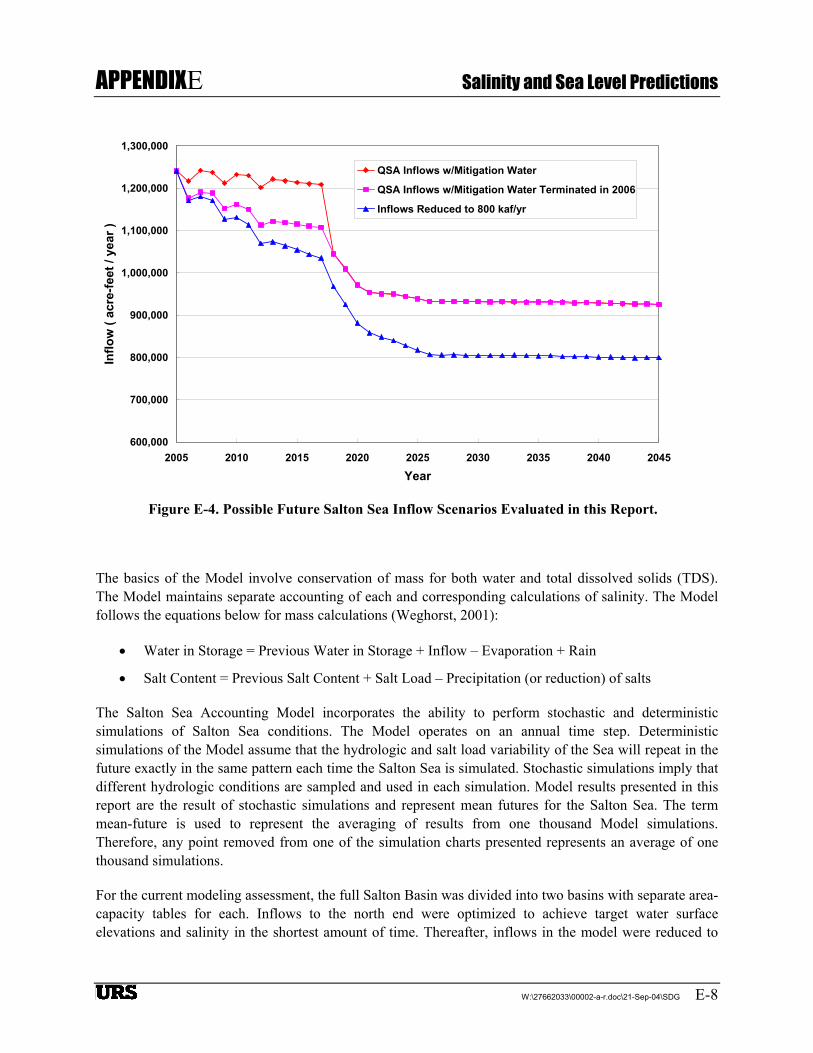
APPENDIXE Salinity and Sea Level Predictions
W:\27662033\00002-a-r.doc\21-Sep-04\SDG E-8
The basics of the Model involve conservation of mass for both water and total dissolved solids (TDS). The Model maintains separate accounting of each and corresponding calculations of salinity. The Model follows the equations below for mass calculations (Weghorst, 2001):
• Water in Storage = Previous Water in Storage + Inflow – Evaporation + Rain
• Salt Content = Previous Salt Content + Salt Load – Precipitation (or reduction) of salts
The Salton Sea Accounting Model incorporates the ability to perform stochastic and deterministic simulations of Salton Sea conditions. The Model operates on an annual time step. Deterministic simulations of the Model assume that the hydrologic and salt load variability of the Sea will repeat in the future exactly in the same pattern each time the Salton Sea is simulated. Stochastic simulations imply that different hydrologic conditions are sampled and used in each simulation. Model results presented in this report are the result of stochastic simulations and represent mean futures for the Salton Sea. The term mean-future is used to represent the averaging of results from one thousand Model simulations. Therefore, any point removed from one of the simulation charts presented represents an average of one thousand simulations.
For the current modeling assessment, the full Salton Basin was divided into two basins with separate area-capacity tables for each. Inflows to the north end were optimized to achieve target water surface elevations and salinity in the shortest amount of time. Thereafter, inflows in the model were reduced to
600,000
700,000
800,000
900,000
1,000,000
1,100,000
1,200,000
1,300,000
2005 2010 2015 2020 2025 2030 2035 2040 2045
Year
Inflo
w (
acre
-feet
/ ye
ar )
QSA Inflows w/Mitigation Water
QSA Inflows w/Mitigation Water Terminated in 2006
Inflows Reduced to 800 kaf/yr
Figure E-4. Possible Future Salton Sea Inflow Scenarios Evaluated in this Report.
APPENDIXE Salinity and Sea Level Predictions
W:\27662033\00002-a-r.doc\21-Sep-04\SDG E-9
provide sufficient inflow to maintain Sea salinity close to the target value of 35,000 milligrams/liter. Any remaining inflows were diverted to the south basin and shallow habitat pond areas. Inflows to the south basin were a combination of diverted river flows and discharges from the north basin. In all model assessments it was assumed that the inflows were reduced as a result of evaporation or other losses in wetlands planned for development along the New and Alamo Rivers.
E.6 SALTON SEA ACCOUNTING MODEL RESULTS WITHOUT PROJECT
Figures E-5a and E-5b illustrate the model results for the three inflow scenarios for salinity and elevation in the Salton Sea, respectively. Note that the QSA inflow case where mitigation water would be provided through 2018 is probably the most likely scenario for the no-project scenario. The model results show that for this case, the salinity would double, reaching 90,000 mg/L in less than 25 years. For this inflow case, Figure E-5b shows that the elevation of the Sea is expected to drop about 20 feet.
E.7 SALTON SEA ACCOUNTING MODEL RESULTS
The Model was run for cases where the mid-Sea structure would act as a dam with elevation control in either the north or south basin and as a barrier without elevation control.
North Basin Lake with Elevation Control. The model was run by Reclamation for nine sets of conditions for the case where an embankment would be constructed across the central area of the Sea to divide it into north and south basins and act as a dam retaining water in the north basin. The sets of runs were based on the three inflow scenarios shown in Figure E-4 and three possible design water surface elevations for the north marine lake: -230 feet above mean sea level (msl); -235 feet, msl; and -240 feet, msl.
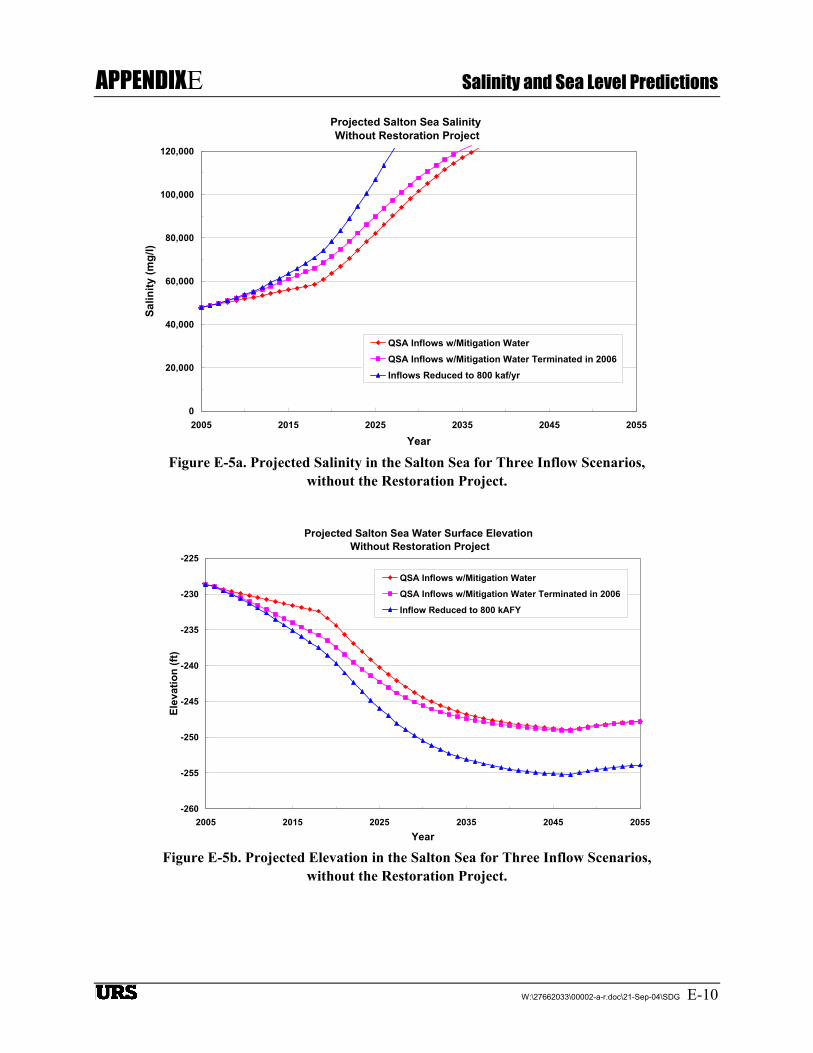
APPENDIXE Salinity and Sea Level Predictions
W:\27662033\00002-a-r.doc\21-Sep-04\SDG E-10
Figure E-5a. Projected Salinity in the Salton Sea for Three Inflow Scenarios, without the Restoration Project.
Figure E-5b. Projected Elevation in the Salton Sea for Three Inflow Scenarios, without the Restoration Project.
Projected Salton Sea Salinity Without Restoration Project
0
20,000
40,000
60,000
80,000
100,000
120,000
2005 2015 2025 2035 2045 2055
Year
Salin
ity (m
g/l)
QSA Inflows w/Mitigation WaterQSA Inflows w/Mitigation Water Terminated in 2006Inflows Reduced to 800 kaf/yr
Projected Salton Sea Water Surface Elevation Without Restoration Project
-260
-255
-250
-245
-240
-235
-230
-225
2005 2015 2025 2035 2045 2055Year
Elev
atio
n (ft
)
QSA Inflows w/Mitigation Water
QSA Inflows w/Mitigation Water Terminated in 2006
Inflow Reduced to 800 kAFY
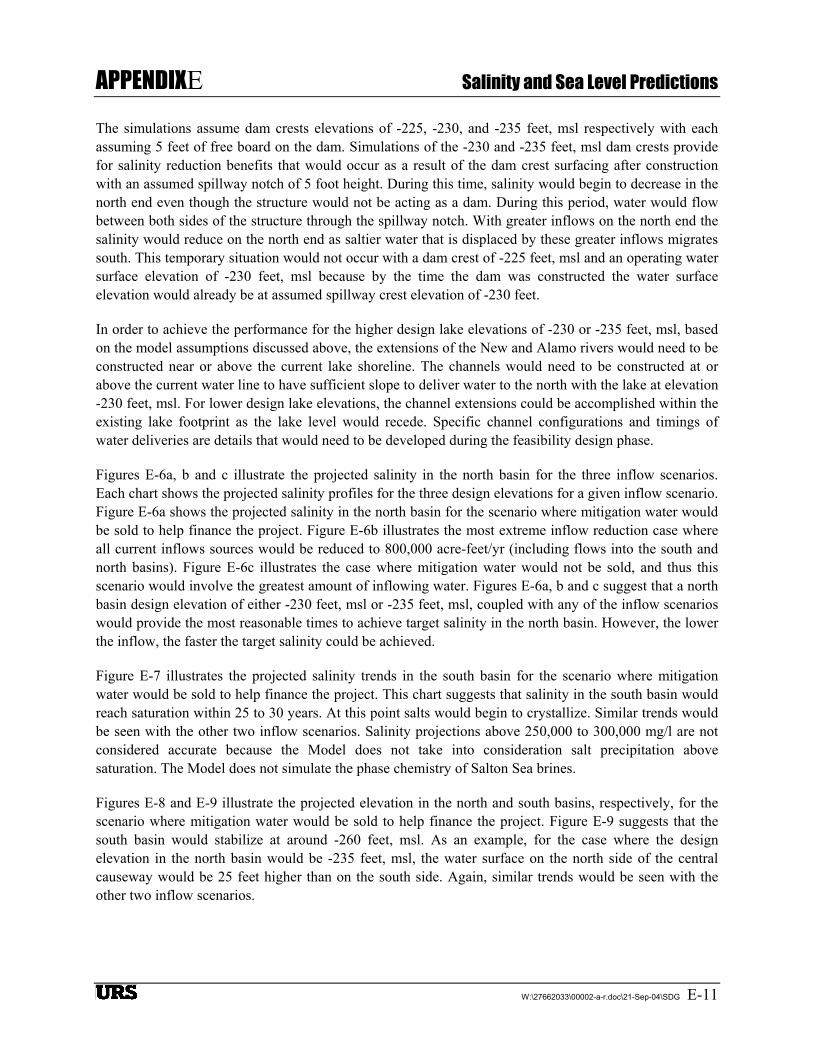
APPENDIXE Salinity and Sea Level Predictions
W:\27662033\00002-a-r.doc\21-Sep-04\SDG E-11
The simulations assume dam crests elevations of -225, -230, and -235 feet, msl respectively with each assuming 5 feet of free board on the dam. Simulations of the -230 and -235 feet, msl dam crests provide for salinity reduction benefits that would occur as a result of the dam crest surfacing after construction with an assumed spillway notch of 5 foot height. During this time, salinity would begin to decrease in the north end even though the structure would not be acting as a dam. During this period, water would flow between both sides of the structure through the spillway notch. With greater inflows on the north end the salinity would reduce on the north end as saltier water that is displaced by these greater inflows migrates south. This temporary situation would not occur with a dam crest of -225 feet, msl and an operating water surface elevation of -230 feet, msl because by the time the dam was constructed the water surface elevation would already be at assumed spillway crest elevation of -230 feet.
In order to achieve the performance for the higher design lake elevations of -230 or -235 feet, msl, based on the model assumptions discussed above, the extensions of the New and Alamo rivers would need to be constructed near or above the current lake shoreline. The channels would need to be constructed at or above the current water line to have sufficient slope to deliver water to the north with the lake at elevation -230 feet, msl. For lower design lake elevations, the channel extensions could be accomplished within the existing lake footprint as the lake level would recede. Specific channel configurations and timings of water deliveries are details that would need to be developed during the feasibility design phase.
Figures E-6a, b and c illustrate the projected salinity in the north basin for the three inflow scenarios. Each chart shows the projected salinity profiles for the three design elevations for a given inflow scenario. Figure E-6a shows the projected salinity in the north basin for the scenario where mitigation water would be sold to help finance the project. Figure E-6b illustrates the most extreme inflow reduction case where all current inflows sources would be reduced to 800,000 acre-feet/yr (including flows into the south and north basins). Figure E-6c illustrates the case where mitigation water would not be sold, and thus this scenario would involve the greatest amount of inflowing water. Figures E-6a, b and c suggest that a north basin design elevation of either -230 feet, msl or -235 feet, msl, coupled with any of the inflow scenarios would provide the most reasonable times to achieve target salinity in the north basin. However, the lower the inflow, the faster the target salinity could be achieved.
Figure E-7 illustrates the projected salinity trends in the south basin for the scenario where mitigation water would be sold to help finance the project. This chart suggests that salinity in the south basin would reach saturation within 25 to 30 years. At this point salts would begin to crystallize. Similar trends would be seen with the other two inflow scenarios. Salinity projections above 250,000 to 300,000 mg/l are not considered accurate because the Model does not take into consideration salt precipitation above saturation. The Model does not simulate the phase chemistry of Salton Sea brines.
Figures E-8 and E-9 illustrate the projected elevation in the north and south basins, respectively, for the scenario where mitigation water would be sold to help finance the project. Figure E-9 suggests that the south basin would stabilize at around -260 feet, msl. As an example, for the case where the design elevation in the north basin would be -235 feet, msl, the water surface on the north side of the central causeway would be 25 feet higher than on the south side. Again, similar trends would be seen with the other two inflow scenarios.

APPENDIXE Salinity and Sea Level Predictions
W:\27662033\00002-a-r.doc\21-Sep-04\SDG E-12
Salinity of North BasinQSA Level Inflows to the Salton SeaWith Mitigation Water Ending in 2006
0
10,000
20,000
30,000
40,000
50,000
60,000
70,000
2005 2015 2025 2035 2045
Year
Salin
ity (m
g/l)
Elevation = -230' mslElevation = -235' mslElevation = -240' msl
Figure E-6a. Projected Salinity in the North Basin for Three Target Lake Elevations, with Mitigation Water Ending in 2006.
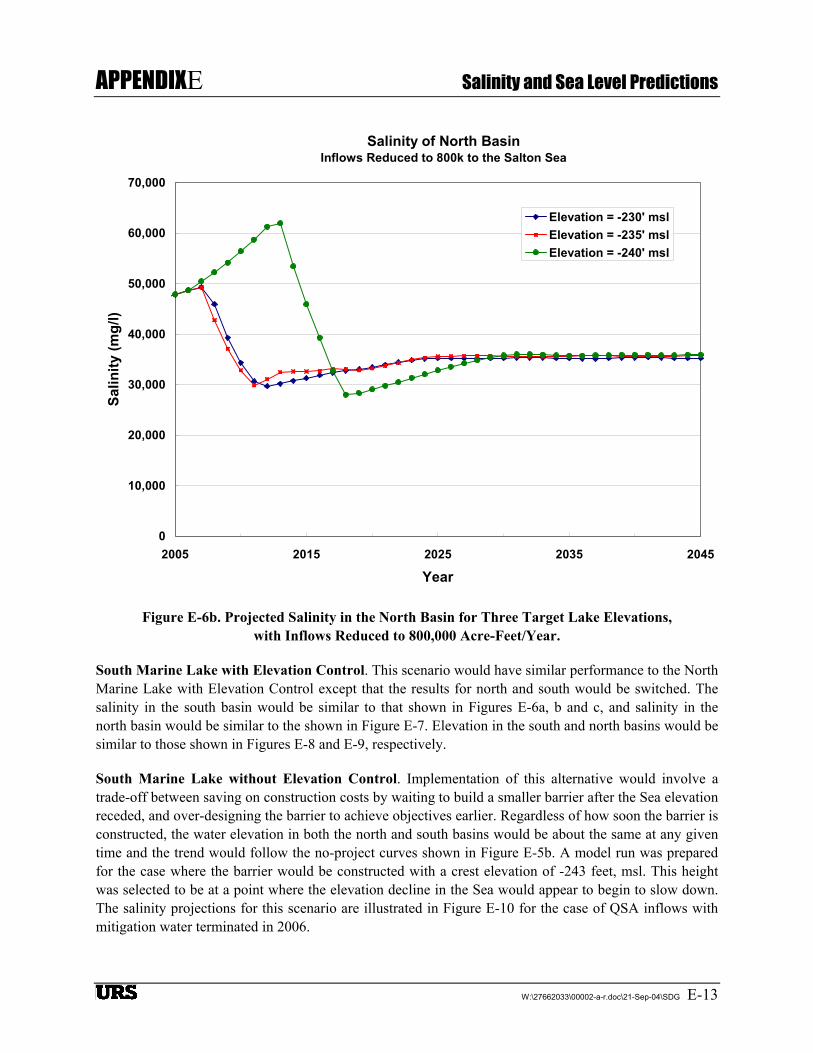
APPENDIXE Salinity and Sea Level Predictions
W:\27662033\00002-a-r.doc\21-Sep-04\SDG E-13
Salinity of North BasinInflows Reduced to 800k to the Salton Sea
0
10,000
20,000
30,000
40,000
50,000
60,000
70,000
2005 2015 2025 2035 2045
Year
Salin
ity (m
g/l)
Elevation = -230' mslElevation = -235' mslElevation = -240' msl
Figure E-6b. Projected Salinity in the North Basin for Three Target Lake Elevations, with Inflows Reduced to 800,000 Acre-Feet/Year.
South Marine Lake with Elevation Control. This scenario would have similar performance to the North Marine Lake with Elevation Control except that the results for north and south would be switched. The salinity in the south basin would be similar to that shown in Figures E-6a, b and c, and salinity in the north basin would be similar to the shown in Figure E-7. Elevation in the south and north basins would be similar to those shown in Figures E-8 and E-9, respectively.
South Marine Lake without Elevation Control. Implementation of this alternative would involve a trade-off between saving on construction costs by waiting to build a smaller barrier after the Sea elevation receded, and over-designing the barrier to achieve objectives earlier. Regardless of how soon the barrier is constructed, the water elevation in both the north and south basins would be about the same at any given time and the trend would follow the no-project curves shown in Figure E-5b. A model run was prepared for the case where the barrier would be constructed with a crest elevation of -243 feet, msl. This height was selected to be at a point where the elevation decline in the Sea would appear to begin to slow down. The salinity projections for this scenario are illustrated in Figure E-10 for the case of QSA inflows with mitigation water terminated in 2006.
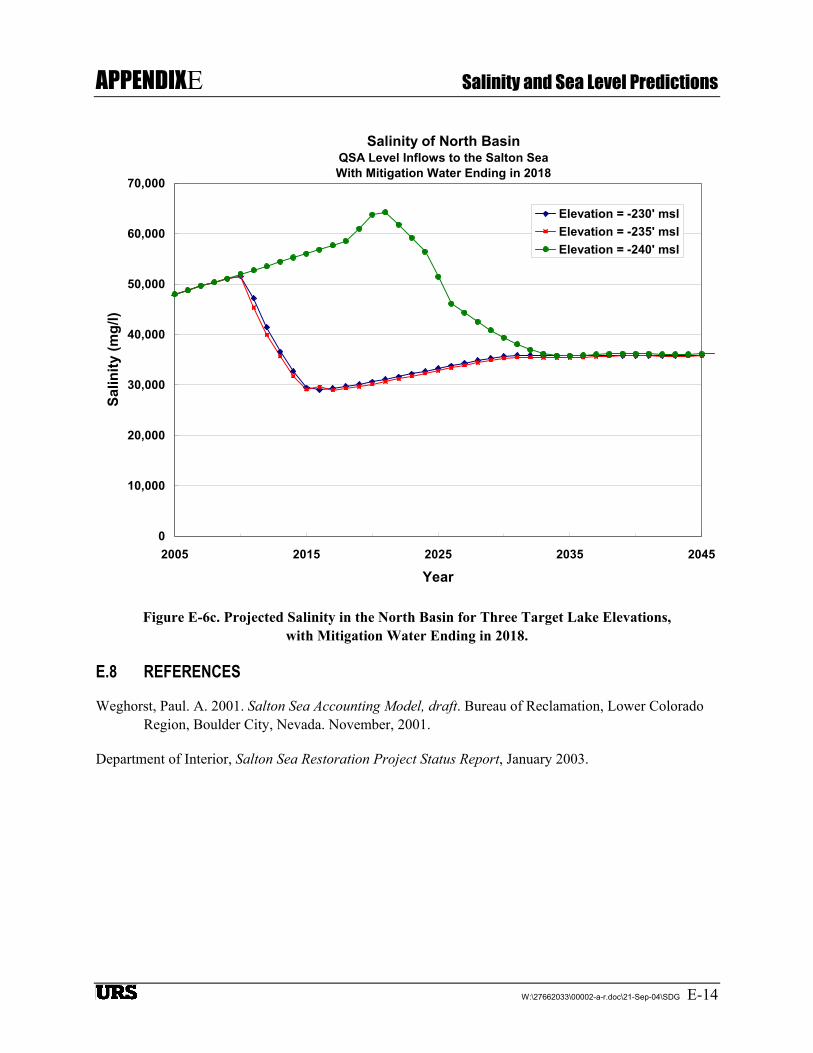
APPENDIXE Salinity and Sea Level Predictions
W:\27662033\00002-a-r.doc\21-Sep-04\SDG E-14
Salinity of North BasinQSA Level Inflows to the Salton SeaWith Mitigation Water Ending in 2018
0
10,000
20,000
30,000
40,000
50,000
60,000
70,000
2005 2015 2025 2035 2045
Year
Salin
ity (m
g/l)
Elevation = -230' mslElevation = -235' mslElevation = -240' msl
Figure E-6c. Projected Salinity in the North Basin for Three Target Lake Elevations, with Mitigation Water Ending in 2018.
E.8 REFERENCES
Weghorst, Paul. A. 2001. Salton Sea Accounting Model, draft. Bureau of Reclamation, Lower Colorado Region, Boulder City, Nevada. November, 2001.
Department of Interior, Salton Sea Restoration Project Status Report, January 2003.
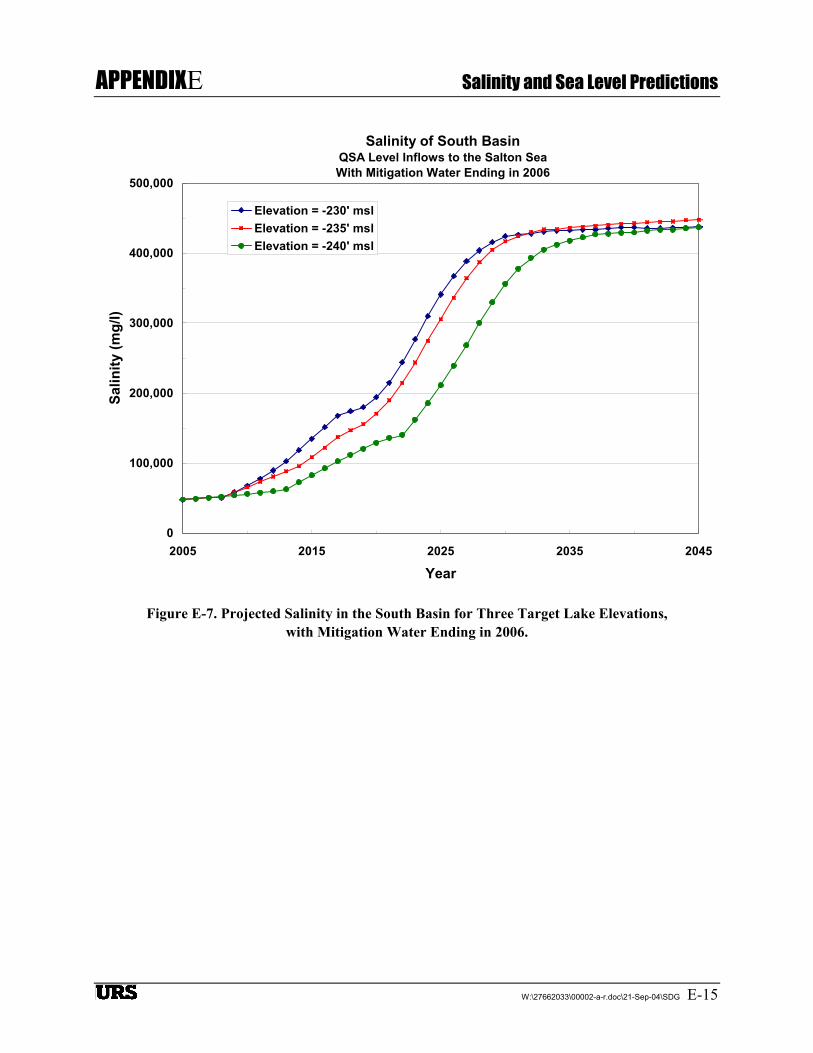
APPENDIXE Salinity and Sea Level Predictions
W:\27662033\00002-a-r.doc\21-Sep-04\SDG E-15
Salinity of South BasinQSA Level Inflows to the Salton SeaWith Mitigation Water Ending in 2006
0
100,000
200,000
300,000
400,000
500,000
2005 2015 2025 2035 2045
Year
Salin
ity (m
g/l)
Elevation = -230' mslElevation = -235' mslElevation = -240' msl
Figure E-7. Projected Salinity in the South Basin for Three Target Lake Elevations, with Mitigation Water Ending in 2006.
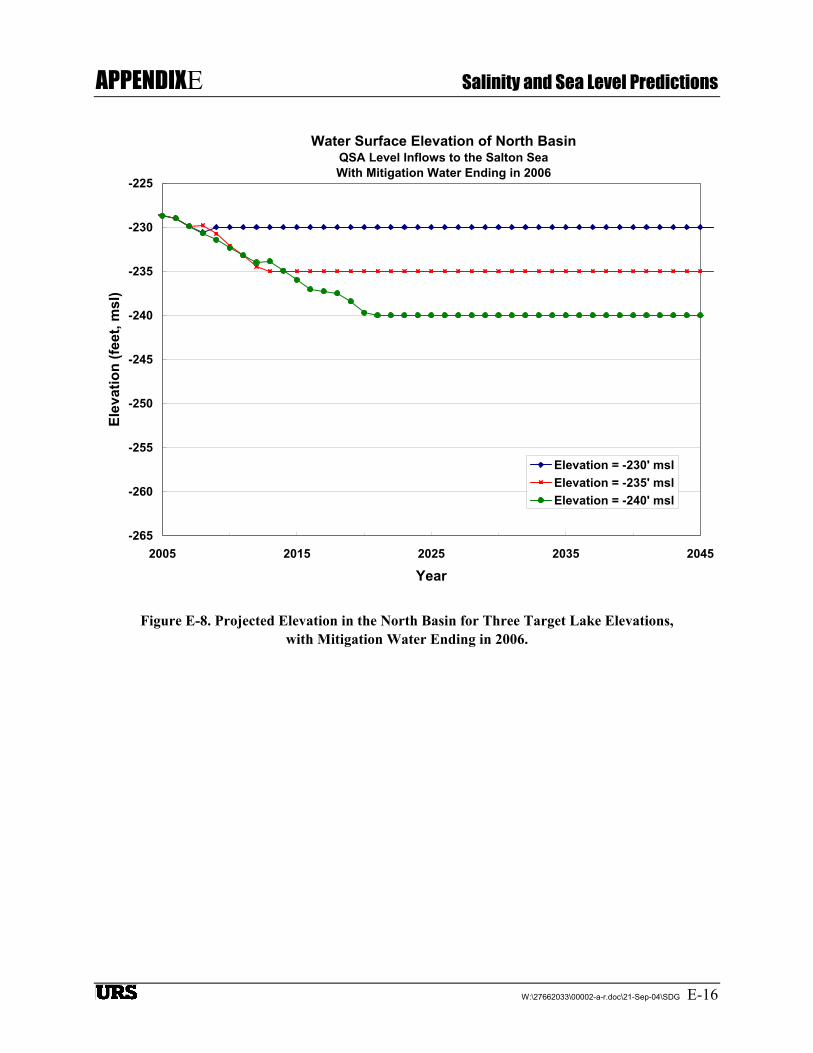
APPENDIXE Salinity and Sea Level Predictions
W:\27662033\00002-a-r.doc\21-Sep-04\SDG E-16
Water Surface Elevation of North BasinQSA Level Inflows to the Salton SeaWith Mitigation Water Ending in 2006
-265
-260
-255
-250
-245
-240
-235
-230
-225
2005 2015 2025 2035 2045
Year
Elev
atio
n (fe
et, m
sl)
Elevation = -230' mslElevation = -235' mslElevation = -240' msl
Figure E-8. Projected Elevation in the North Basin for Three Target Lake Elevations, with Mitigation Water Ending in 2006.
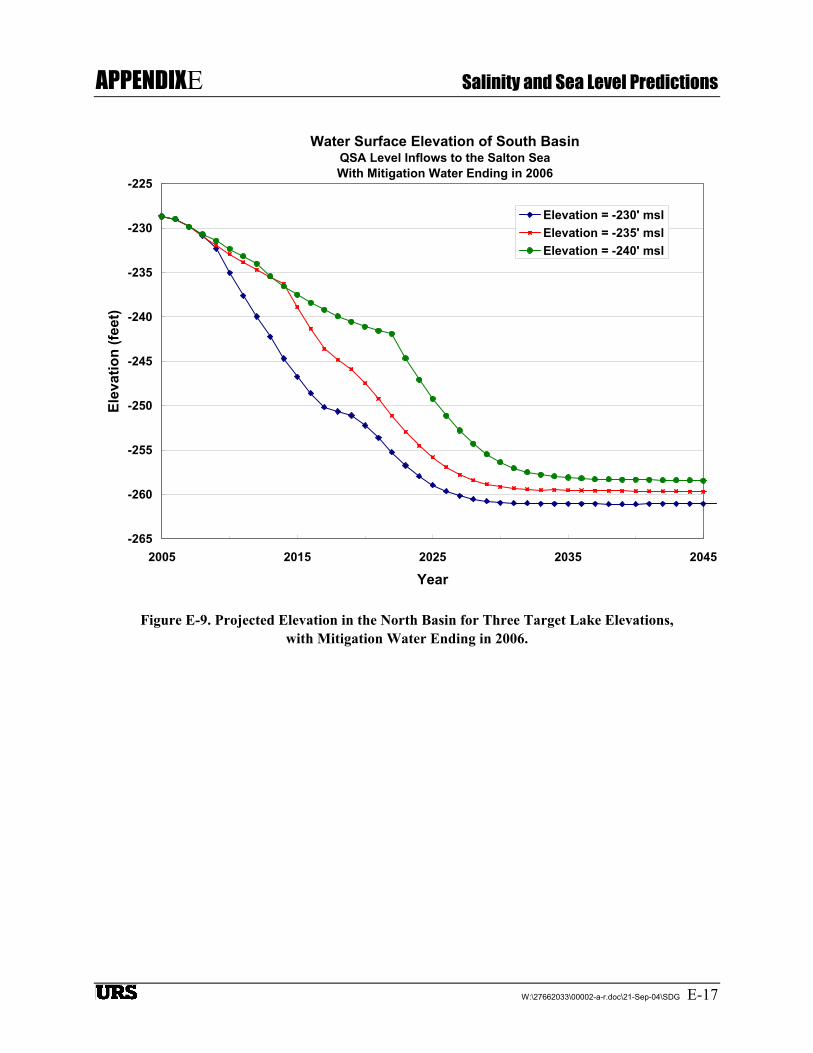
APPENDIXE Salinity and Sea Level Predictions
W:\27662033\00002-a-r.doc\21-Sep-04\SDG E-17
Water Surface Elevation of South BasinQSA Level Inflows to the Salton SeaWith Mitigation Water Ending in 2006
-265
-260
-255
-250
-245
-240
-235
-230
-225
2005 2015 2025 2035 2045
Year
Elev
atio
n (fe
et)
Elevation = -230' mslElevation = -235' mslElevation = -240' msl
Figure E-9. Projected Elevation in the North Basin for Three Target Lake Elevations, with Mitigation Water Ending in 2006.
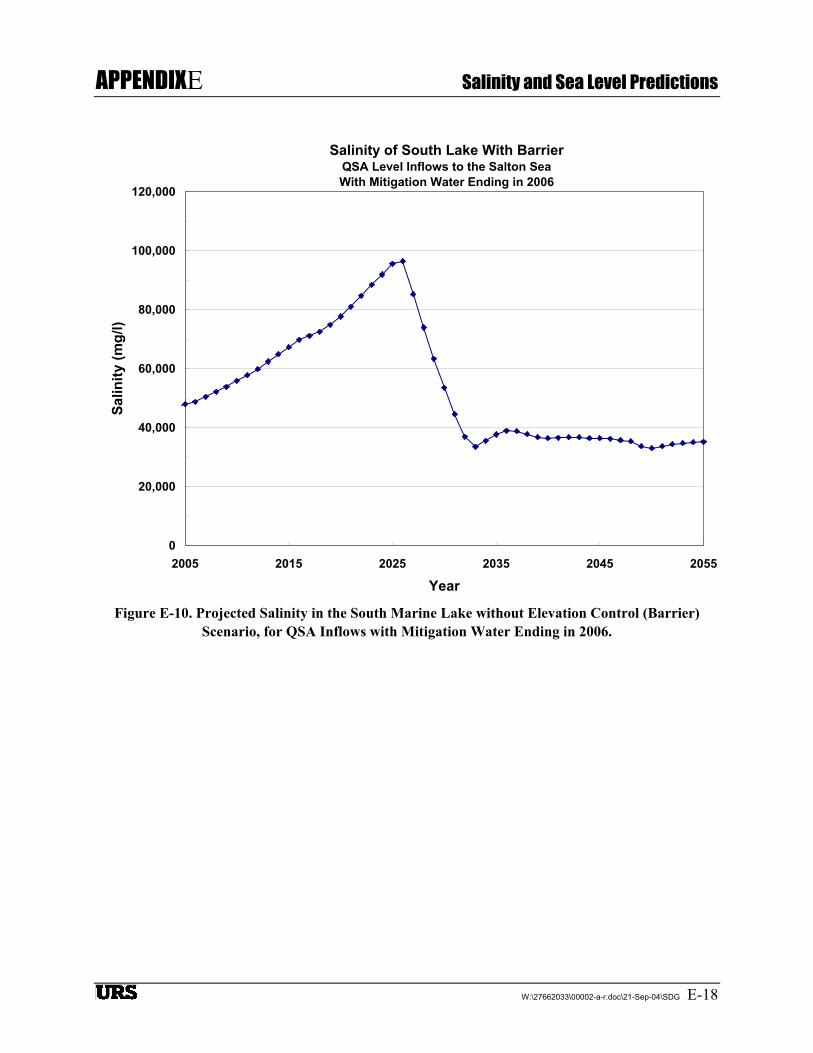
APPENDIXE Salinity and Sea Level Predictions
W:\27662033\00002-a-r.doc\21-Sep-04\SDG E-18
Figure E-10. Projected Salinity in the South Marine Lake without Elevation Control (Barrier) Scenario, for QSA Inflows with Mitigation Water Ending in 2006.
Salinity of South Lake With BarrierQSA Level Inflows to the Salton SeaWith Mitigation Water Ending in 2006
0
20,000
40,000
60,000
80,000
100,000
120,000
2005 2015 2025 2035 2045 2055
Year
Salin
ity (m
g/l)