Particle Size Analysis of Active Pharmaceutical...
1
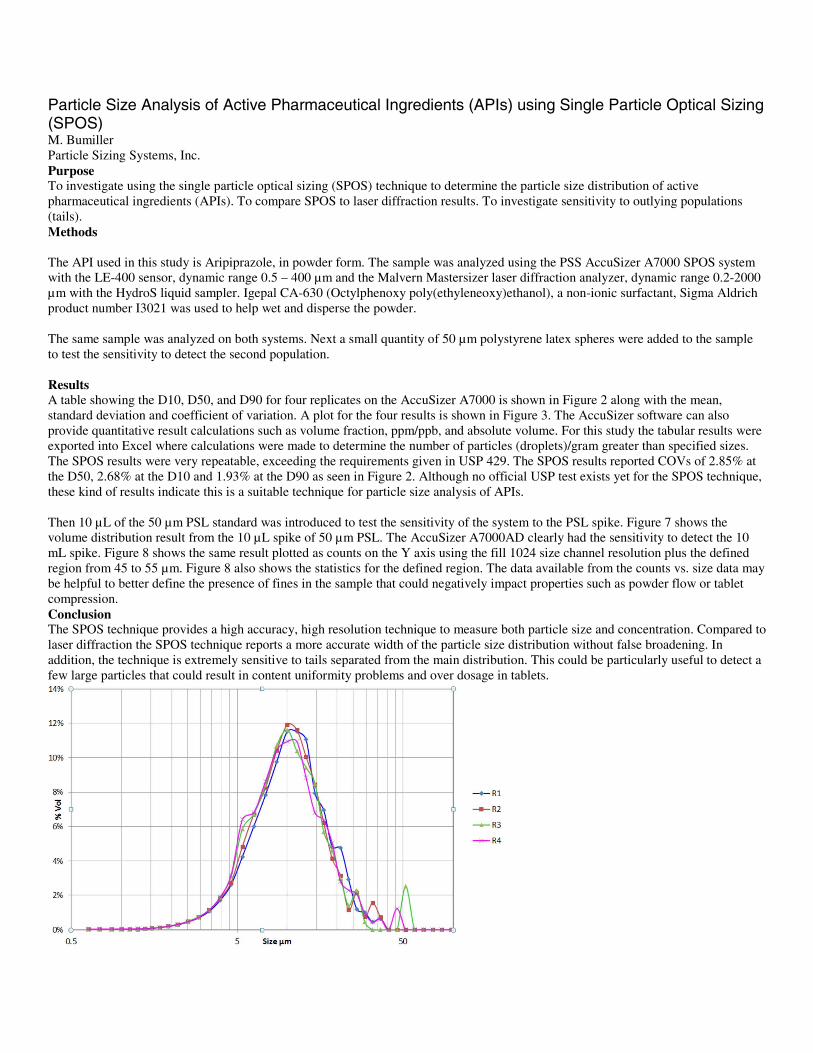
Particle Size Analysis of Active Pharmaceutical Ingredients (APIs) using Single Particle Optical Sizing (SPOS) M. Bumiller Particle Sizing Systems, Inc. Purpose To investigate using the single particle optical sizing (SPOS) technique to determine the particle size distribution of active pharmaceutical ingredients (APIs). To compare SPOS to laser diffraction results. To investigate sensitivity to outlying populations (tails). Methods The API used in this study is Aripiprazole, in powder form. The sample was analyzed using the PSS AccuSizer A7000 SPOS system with the LE-400 sensor, dynamic range 0.5 – 400 μ m and the Malvern Mastersizer laser diffraction analyzer, dynamic range 0.2-2000 μ m with the HydroS liquid sampler. Igepal CA-630 (Octylphenoxy poly(ethyleneoxy)ethanol), a non-ionic surfactant, Sigma Aldrich product number I3021 was used to help wet and disperse the powder. The same sample was analyzed on both systems. Next a small quantity of 50 μ m polystyrene latex spheres were added to the sample to test the sensitivity to detect the second population. Results A table showing the D10, D50, and D90 for four replicates on the AccuSizer A7000 is shown in Figure 2 along with the mean, standard deviation and coefficient of variation. A plot for the four results is shown in Figure 3. The AccuSizer software can also provide quantitative result calculations such as volume fraction, ppm/ppb, and absolute volume. For this study the tabular results were exported into Excel where calculations were made to determine the number of particles (droplets)/gram greater than specified sizes. The SPOS results were very repeatable, exceeding the requirements given in USP 429. The SPOS results reported COVs of 2.85% at the D50, 2.68% at the D10 and 1.93% at the D90 as seen in Figure 2. Although no official USP test exists yet for the SPOS technique, these kind of results indicate this is a suitable technique for particle size analysis of APIs. Then 10 μ L of the 50 μ m PSL standard was introduced to test the sensitivity of the system to the PSL spike. Figure 7 shows the volume distribution result from the 10 μ L spike of 50 μ m PSL. The AccuSizer A7000AD clearly had the sensitivity to detect the 10 mL spike. Figure 8 shows the same result plotted as counts on the Y axis using the fill 1024 size channel resolution plus the defined region from 45 to 55 μ m. Figure 8 also shows the statistics for the defined region. The data available from the counts vs. size data may be helpful to better define the presence of fines in the sample that could negatively impact properties such as powder flow or tablet compression. Conclusion The SPOS technique provides a high accuracy, high resolution technique to measure both particle size and concentration. Compared to laser diffraction the SPOS technique reports a more accurate width of the particle size distribution without false broadening. In addition, the technique is extremely sensitive to tails separated from the main distribution. This could be particularly useful to detect a few large particles that could result in content uniformity problems and over dosage in tablets.
Transcript of Particle Size Analysis of Active Pharmaceutical...
Particle Size Analysis of Active Pharmaceutical Ingredients (APIs) using Single Particle Optical Sizing (SPOS) M. Bumiller Particle Sizing Systems, Inc. Purpose To investigate using the single particle optical sizing (SPOS) technique to determine the particle size distribution of active pharmaceutical ingredients (APIs). To compare SPOS to laser diffraction results. To investigate sensitivity to outlying populations (tails). Methods The API used in this study is Aripiprazole, in powder form. The sample was analyzed using the PSS AccuSizer A7000 SPOS system with the LE-400 sensor, dynamic range 0.5 – 400 μm and the Malvern Mastersizer laser diffraction analyzer, dynamic range 0.2-2000 μm with the HydroS liquid sampler. Igepal CA-630 (Octylphenoxy poly(ethyleneoxy)ethanol), a non-ionic surfactant, Sigma Aldrich product number I3021 was used to help wet and disperse the powder. The same sample was analyzed on both systems. Next a small quantity of 50 μm polystyrene latex spheres were added to the sample to test the sensitivity to detect the second population. Results A table showing the D10, D50, and D90 for four replicates on the AccuSizer A7000 is shown in Figure 2 along with the mean, standard deviation and coefficient of variation. A plot for the four results is shown in Figure 3. The AccuSizer software can also provide quantitative result calculations such as volume fraction, ppm/ppb, and absolute volume. For this study the tabular results were exported into Excel where calculations were made to determine the number of particles (droplets)/gram greater than specified sizes. The SPOS results were very repeatable, exceeding the requirements given in USP 429. The SPOS results reported COVs of 2.85% at the D50, 2.68% at the D10 and 1.93% at the D90 as seen in Figure 2. Although no official USP test exists yet for the SPOS technique, these kind of results indicate this is a suitable technique for particle size analysis of APIs. Then 10 μL of the 50 μm PSL standard was introduced to test the sensitivity of the system to the PSL spike. Figure 7 shows the volume distribution result from the 10 μL spike of 50 μm PSL. The AccuSizer A7000AD clearly had the sensitivity to detect the 10 mL spike. Figure 8 shows the same result plotted as counts on the Y axis using the fill 1024 size channel resolution plus the defined region from 45 to 55 μm. Figure 8 also shows the statistics for the defined region. The data available from the counts vs. size data may be helpful to better define the presence of fines in the sample that could negatively impact properties such as powder flow or tablet compression. Conclusion The SPOS technique provides a high accuracy, high resolution technique to measure both particle size and concentration. Compared to laser diffraction the SPOS technique reports a more accurate width of the particle size distribution without false broadening. In addition, the technique is extremely sensitive to tails separated from the main distribution. This could be particularly useful to detect a few large particles that could result in content uniformity problems and over dosage in tablets.