Page 1 of 38 Carcinogenesis - Spiral: Home Romero1*, Zainab Al-Shareef1 ... which mediate the...
38
Summary Matrix metalloproteases (MMPs) play important roles in tissue morphogenesis and tumor cell invasion. Here we show that MMPs play roles in the cellular responses to Dickkopf-3 during prostate epithelial cell acinar morphogenesis and TGF-β-dependent prostate cancer cell invasion. Keywords Dickkopf-3, metastatic prostate cancer, acinar morphogenesis, RWPE-1, TGF-β, matrix metalloprotease Running head Dkk-3 regulates TGF-β-dependent MMP activation Page 1 of 38 Carcinogenesis 1 2 3 4 5 6 7 8 9 10 11 12 13 14 15 16 17 18 19 20 21 22 23 24 25 26 27 28 29 30 31 32 33 34 35 36 37 38 39 40 41 42 43 44 45 46 47 48 49 50 51 52 53 54 55 56 57 58 59 60
Transcript of Page 1 of 38 Carcinogenesis - Spiral: Home Romero1*, Zainab Al-Shareef1 ... which mediate the...
Summary
Matrix metalloproteases (MMPs) play important roles in tissue morphogenesis and tumor cell
invasion. Here we show that MMPs play roles in the cellular responses to Dickkopf-3 during
prostate epithelial cell acinar morphogenesis and TGF-β-dependent prostate cancer cell
invasion.
Keywords
Dickkopf-3, metastatic prostate cancer, acinar morphogenesis, RWPE-1, TGF-β, matrix
metalloprotease
Running head
Dkk-3 regulates TGF-β-dependent MMP activation
Page 1 of 38 Carcinogenesis
123456789101112131415161718192021222324252627282930313233343536373839404142434445464748495051525354555657585960
llambe
Typewritten Text
llambe
Typewritten Text
Dickkopf-3 regulates prostate epithelial cell acinar morphogenesis and prostate cancer cell invasion by limiting TGF-β-dependent activation of matrix metalloproteases.
llambe
Typewritten Text
llambe
Typewritten Text
Diana Romero1*, Zainab Al-Shareef1, Irantzu Gorroño-Etxebarria2, Stephanie Atkins1, Frances Turrell1, Jyoti Chhetri1, Nora Bengoa-Vergniory2,4, Christoph Zenzmaier3,5, Peter Berger3, Jonathan Waxman1 and Robert Kypta1,2 *
llambe
Typewritten Text
1 Department of Surgery and Cancer, Imperial College London, London, UK 2 Cell Biology and Stem Cells Unit, CIC bioGUNE, Bilbao, Spain 3 Institute for Biomedical Aging Research, University of Innsbruck, Innsbruck, Austria 4 Present address Department of Physiology, Anatomy and Genetics, Oxford University, UK 5 Present address University of Applied Sciences Tyrol, Innsbruck, Austria
llambe
Typewritten Text
llambe
Typewritten Text
2
Abstract
Dickkopf-3 (Dkk-3) is a secreted protein whose expression is downregulated in many types
of cancer. Endogenous Dkk-3 is required for formation of acini in 3D cultures of prostate
epithelial cells, where it inhibits transforming growth factor (TGF)-β/Smad signaling. Here,
we examined the effects of Dkk-3 on the expression and activity of matrix metalloproteases
(MMPs), which mediate the effects of TGF-β on extracellular matrix disassembly during
tissue morphogenesis and promote invasion of tumor cells. Silencing of Dkk-3 in prostate
epithelial cells resulted in increased expression and enzyme activity of MMP-2 and MMP-9.
Inhibition of MMP-9 partially restored normal acinar morphogenesis in Dkk-3-silenced
RWPE-1 prostate epithelial cells. In prostate cancer, Dkk-3 inhibited TGF-β-dependent
migration and invasion. Inhibition was mediated by the Dkk-3 C-terminal cysteine-rich
domain (Cys2), which also inhibited TGF-β-induced expression of MMP9 and MMP13. In
contrast, Dkk-3, but not Cys2, increased formation of normal acini in Dkk-3-silenced prostate
epithelial cells. These observations highlight a role for Dkk-3 in modulating TGF-β/MMP
signals in the prostate, and suggest that the Dkk-3 Cys2 domain can be used as a basis for
therapies that target the tumor promoting effects of TGF-β signaling in advanced prostate
cancer.
Page 2 of 38Carcinogenesis
123456789101112131415161718192021222324252627282930313233343536373839404142434445464748495051525354555657585960
3
Introduction
Dickkopf-3 (Dkk-3) is a member of the Dickkopf family of secreted Wnt antagonists that is
highly expressed in many tissues, including the prostate (reviewed in (1)). Dkk-3, also known
as REIC (Reduced Expression in Immortalised Cells), is downregulated by promoter
hypermethylation in most types of solid tumor and in hematological malignancies, suggesting
it plays a fundamental role in tumor development. Consistent with this, ectopic expression of
Dkk-3 induces apoptosis in the majority of cancer cell lines. However, since Dkk-3-induced
apoptosis involves induction of ER stress (2), this might not be related to the function of
endogenous Dkk-3. In the prostate gland Dkk-3 may play a role in epithelial cell
proliferation, which is increased in the prostates of Dkk3 null mice (3). The pattern of Dkk-3
expression is frequently altered in prostatic disease. Dkk-3 is upregulated in endothelial cells
in benign prostatic hyperplasia (BPH) and its expression is increased in the reactive stroma in
prostate cancer (4,5). In contrast, Dkk-3 is downregulated in prostate tumor epithelial cells
(4,6,7), where reduced expression inversely correlates with high Gleason grade (7).
Consistent with loss of Dkk-3 being important in advanced prostate cancer, studies using an
orthotopic mouse prostate cancer model have demonstrated that Dkk-3 inhibits prostate
tumor metastasis (8).
While Dkk-3 has clear tumor-suppressive properties, less is known about the signaling
mechanisms involved. Similar to other members of the Dickkopf family of secreted
glycoproteins, Dkk-3 has two Cysteine-rich domains (Cys1 and Cys2) (9). The Cys2 domains
in Dkk-1, -2 and -4 bind to LRP5/6 Wnt co-receptors, thereby inhibiting Wnt/β-catenin
signaling (10-13). However, Dkk-3 does not bind to LRP5/6 and its ability to regulate Wnt/β-
catenin signaling remains controversial (1). In addition, there are reports of links between
Dkk-3 and transforming growth factor beta (TGF-β) signaling (14,15). Members of the TGF-
β family regulate many cellular processes by inducing Smad protein phosphorylation, which
leads to regulation of Smad-dependent genes, and through Smad-independent pathways,
mediated by phosphoinositide 3-kinase/Akt, mitogen activated protein kinases and Rho-like
GTPases (reviewed in (16,17)). We previously reported that gene silencing of Dkk-3 disrupts
acinar morphogenesis in prostate epithelial cells by increasing TGF-β/Smad signaling activity
(3). The results of that study suggested the involvement of Smad proteins, since Dkk-3
silencing increased Smad2 phosphorylation and an inhibitor of Smad3 partially rescued the
effects of Dkk-3 silencing on acinar morphogenesis. However, the dowstream effectors of
TGF-β/Smad signaling in this context were not examined.
Page 3 of 38 Carcinogenesis
123456789101112131415161718192021222324252627282930313233343536373839404142434445464748495051525354555657585960
4
TGF-β signaling plays complex roles within the life of a tumor, first acting as a tumor
suppressor in the normal epithelium and then as a tumor promoter in transformed cells (18).
As a tumor promoter, TGF-β can induce the epithelial-to-mesenchymal transition (EMT) and
promote metastasis by stimulating degradation of the extracellular matrix (ECM), cell
migration and invasion, tumor vascularization and immunosuppression (reviewed in (19)).
Among the subset of TGF-β target genes involved in tumor promotion, the matrix
metalloproteinases (MMPs) play an important role in the stimulation of cell migration and
invasion (20,21). MMPs degrade several ECM components and have important roles in tissue
remodeling and homeostasis (22); MMP-2 and -9, in particular, are required for tissue
remodeling during prostate development (23). Moreover, TGF-β increases MMP activity in
metastatic prostate cancer cells (24).
To investigate the potential links between Dkk-3, TGF-β signaling and MMPs, we measured
the effects of Dkk-3 silencing on MMP expression and activity in normal prostate epithelial
cells and on the TGF-β response of metastatic prostate cancer cells. Our results indicate that
loss of Dkk-3 expression in normal prostate epithelial cells leads to increased MMP activity.
They further suggest that loss of Dkk-3 in prostate cancer facilitates TGF-β-driven tumor cell
invasion and that this can be prevented by ectopic expression of the Dkk-3 Cys2 domain.
Materials and methods
Reagents and antibodies
The antibodies used were as follows: goat anti-Dkk-3 (dilution 1:500; R&D Systems,
Abingdon, UK), which is Dkk-3-specific (7), rabbit anti-MMP-13 (dilution 1:1000; H-230,
Santa Cruz Biotechnology, Insight Biotechnology, Wembley, UK), specific for MMP-13
(25), rabbit anti-MMP-9 (dilution 1:1000; ab76003, Abcam, Cambridge, UK), specific for
MMP-9 (for references, see http://www.abcam.com/mmp9-antibody-ep1254-ab76003-
references.html), and anti-GAPDH (dilution 1:5000; 2D4A7, Novus, Abingdon, UK),
specific for GAPDH (for references, see http://www.novusbio.com/GAPDH-Antibody-
2D4A7_NB300-328.html#PublicationsSection). Recombinant human TGF-β1 (R&D
systems) was used at between 1 and 20 ng/ml, as indicated in the figure legends. SB431542
(1 µM) and marimastat (1-10 µM on cells and 500 nM for zymography) were from Sigma
(Gillingham, UK). ARP100 (Santa Cruz Biotechnology) was used at 1 uM, at which it
inhibits MMP-2, -3 and -9 (see http://pubchem.ncbi.nlm.nih.gov/compound/10044321).
MMP-9 Inhibitor I (Millipore, http://pubchem.ncbi.nlm.nih.gov/substance/103265275) was
Page 4 of 38Carcinogenesis
123456789101112131415161718192021222324252627282930313233343536373839404142434445464748495051525354555657585960
5
used at 1 µM on cells and at 50 nM for zymography, and MMP-13 Inhibitor CAS 544678-85-
5 (Millipore) was used at 1 µM on cells and at 500 nM for zymography.
Generation of Dkk-3 deletion mutants
A DNA sequence encoding human Dkk-3 with silent restriction sites was synthesized and
cloned into pSF-CMV-InsulinSP2-His3-IRES-Neo (Oxford Genetics, Oxford, UK), which
was renamed pOG for this study. Restriction enzyme digestion was then used to generate a
series of Dkk-3 mutants: ∆Nt, ∆Cys1 and ∆Cys2, Nt, Cys1 and Cys2. All constructs were
confirmed by sequencing.
Cell culture
Cell lines (RWPE-1 (CRL-11609), PC3 (CRL-143) and DU145 (HTB-8)) were obtained
directly from ATCC (LGC Standards, Teddington, UK and Barcelona, Spain) between 2007
and 2010. ATCC ensures cell line authenticity using short tandem repeat DNA profiling. Cell
lines were immediately expanded upon receipt and frozen in aliquots. Once thawed, early
passage cells were cultured for 2-4 months from a frozen vial of the same batch of cells. Cells
were tested routinely to ensure there was no mycoplasma contamination (Mycoplasma
Detection Kit, Lonza). RWPE-1 cells and their sublines sh6 and NS11 (3) were maintained in
keratinocyte serum-free medium (KSFM) supplemented with bovine pituitary extract (BPE)
and EGF (Invitrogen Life Technologies, Paisley UK), antibiotics (100 units/mL penicillin
and 100 ug/mL streptomycin, Sigma) and puromycin (NS11 and sh6 lines). RWPE-1 cell
lines expressing Dkk-3 and Dkk-3 deletion mutants were generated by transfection of shDkk-
3 (sh6) cells with the constructs described above using Fugene HD (Promega, Southampton,
UK), according to manufacturer’s instructions and selection in medium containing 400 µg/ml
G418 (Invitrogen). Where indicated, experiments were performed using non-supplemented
KSFM (NS KSFM) with antibiotics only. PC3 and DU145 cells were cultured in RPMI-1640
with 10% FCS, 2 mM L-glutamine (Sigma) and antibiotics. Where indicated, experiments
were performed in serum-free RPMI (SF RPMI) with antibiotics and glutamine. Prostate
cancer cell lines expressing Dkk-3 and Dkk-3 deletion mutants were generated by
transfection of PC3 cells using Lipofectamine 2000 (Invitrogen) and DU145 cells using
Fugene HD and selection in medium containing 0.2 mg/ml and 1.2 mg/ml G418,
respectively. Primary human prostate epithelial cell cultures (PrEC) were established as
described previously (4) and transduced using lentiviral vectors expressing Dkk-3 shRNA
and Dkk-3 cDNA, also as previously described (5).
Page 5 of 38 Carcinogenesis
123456789101112131415161718192021222324252627282930313233343536373839404142434445464748495051525354555657585960
6
RNA analysis
RNA preparation, generation of cDNA and analysis by quantitative RT-PCR was carried out
as previously described (3,5,26) with the following additional primers: MMP13
ACCCTGGAGCACTCATGTTTC, GGATGTTTAGGGTTGGGGTCT, MMP9
ACGACGTCTTCCAGTACCGA, TTGGTCCACCTGGTTCAACT and MMP2
CCTCGCAAGCCCAAGTGGGA, TGAGCACTCTCCCCTCCTTT, and for PrECs: MMP9
ACCACCTCGAACTTTGACAG, TGAAGCGGTACATAGGGTACA and MMP2
CTGGATCTACTCAGCCAGCA, GGAAGCCAGGATCCATTTTC.
Protein analysis
Western blotting for Dkk-3 was performed as described previously (3). Briefly, cell
conditioned-media (CM) were collected from cells cultured in NS KSFM or SF RPMI,
centrifuged at 500 g to remove cell debris and resuspended in SDS sample buffer. Where
noted, CM were concentrated by binding to 15 µl StrataClean Resin (Stratagene, Stockport,
UK) per ml of CM. Resin-bound proteins were pelleted by centrifugation and resuspended in
SDS sample buffer.
Immunocytochemistry Cells were plated on coverslips in 12-well plates, transiently transfected with 500 ng pOG
Dkk-3 expression constructs and, after 24 h, washed, fixed, permeabilized and stained as
previously described (3,5,26), using goat anti-Dkk-3 (R&D Systems) at 1:500 dilution.
Gelatin zymography
The activity of secreted MMPs was analyzed by gelatin zymography. 400,000 cells/well
were plated in 12-well tissue culture plates. 24 h after plating, cells were washed with NS
KSFM (RWPE-1 cells) or SF RPMI (PC3 cells) and cultured in NS KSFM or SF RPMI with
treatments, as described. CM were centrifuged to remove cell debris, mixed with SDS sample
buffer without reducing agents and applied to 8% SDS polyacrylamide gels containing 1
mg/ml gelatin. For PC3 cells, CM were concentrated using Amicon Ultra centrifugal filters
(Millipore). Gels were washed twice for 30 min with 2.5% Triton X-100 and for 10 minutes
in 50 mM Tris-HCl pH 7.4 and then placed in 1% Triton X-100/50 mM Tris-HCl pH 7.4/10
mM CaCl2 for 48 h, in some cases in the presence of inhibitors, as indicated in the text. CM
from PrECs were mixed with SDS sample buffer without reducing agents and applied to 10%
SDS polyacrylamide gels containing 1% gelatin and gels were subsequently washed for 1 h in
2.5% Triton X-100 prior to incubation in 50 mM Tris-HCl pH 8.0/1 µM ZnCl2/0.5 mM
Page 6 of 38Carcinogenesis
123456789101112131415161718192021222324252627282930313233343536373839404142434445464748495051525354555657585960
7
CaCl2 for 16 h at 37°C. To visualize gelatin-degrading activity, gels were either stained with
Coomassie Brilliant Blue solution for 1 hour and then destained with 10% acetic acid/20%
methanol until degradation halos were evident, or directly in 0.01% Coomassie Brilliant Blue
in 10% acetic acid and 30% methanol for 3 h without destaining. For the detection of MMP
proteins, CM or lysates obtained as previously described (3) were resolved on SDS-PAGE
gels under denaturing conditions, transferred to PVDF membranes and probed by western
blotting.
Acinar morphogenesis assays
3D culture of RWPE-1 cells was carried out as previously described (3). Briefly, cells were
resuspended in acinar morphogenesis assay medium (KSFM with 5 ng/ml EGF, 2% bovine
calf serum, 2% Cultrex basement membrane extract (BME, Trevigen, AMS Biotechnology,
Abingdon, UK) and 0.375 mg/ml puromycin), and plated on Cultrex basement membrane
extract. MMP inhibitors or vehicle were added at the concentrations described in the Results.
For preparation of conditioned media (CM), RWPE-1-derived cell lines were plated in 100
mm diameter plates. One day after plating, the medium was changed to acinar morphogenesis
assay medium for 48 h. CM were then collected, centrifuged and used directly for acinar
morphogenesis assays or frozen at -80° C. Evaluation of the acinar phenotypes was as
previous described (3,7). At least five images were taken for each insert at 100x
magnification using a Nikon Eclipse TE2000-U microscope and QCapture Pro software
(QImaging, Surrey, BC, Canada). Quantitation was performed using ImageJ software.
Gene reporter assays
TGF-β/Smad reporter assays in RWPE-1 sublines were performed as described previously
(3). PC3 and DU145 cells were plated at 250,000 cells/well in 12-well tissue culture plates
and transfected 24 h later using Lipofectamine 2000. For cells stably expressing the Dkk-3
constructs, PC3 cells were transfected with 100 ng/well pTK renilla and 400 ng/well
CAGA12-luciferase and DU145 cells were transfected with 50 ng/well pTK renilla and 450
ng/well CAGA12-luciferase. When indicated, treatments began 3 h after transfection.
Luciferase and renilla activites were assayed 24 h after transfection using the Dual Glo
system (Promega). Experiments were carried out in duplicate or triplicate in at least three
independent experiments. For Figures 4E and F and Supplementary Figure 3, cells were
transfected with 150 ng pOG empty vector, pOG-Dkk-3 or pOG-Cys2, 50 ng pTK renilla and
300 ng of luciferase reporters: AP-1-luc, ATF-2-luc, 8xSuperTOPFlash, 8xSuperFOFFlash,
Page 7 of 38 Carcinogenesis
123456789101112131415161718192021222324252627282930313233343536373839404142434445464748495051525354555657585960
8
(for references, see (26) and NFkB-luc (Clontech). After 3 h transfection, cells were cultured
in normal growth medium for 3-4 h, then in medium with 0.5% FCS for 24 h prior to
treatment for 24 h with vehicle or 1 ng/ml TGF-β1.
Cell migration and invasion assays
Cell migration and invasion assays were performed using 8 µm pore Polycarbonate
Membrane Transwell Inserts for 24-well plates (Falcon BD Biosciences, Oxford, UK). PC3
and DU145 cells were serum-starved overnight and then re-suspended in serum-free media
with treatments, when indicated. 30,000 cells (PC3) or 50,000 cells (DU145) were plated on
inserts, in duplicate or triplicate. Cells were allowed to migrate for 24 hours at 37 °C, after
which the cells that had not migrated were removed with a cotton tip and the inserts washed
in PBS. Migrated cells were fixed with ice-cold methanol and stained with 0.2% crystal violet
in 20% methanol. At least five images were taken for each insert at 100x magnification using
a Nikon Eclipse TE2000-U microscope and QCapture Pro software. Analysis and
quantitation were performed using ImageJ. Invasion assays were performed as above, except
that inserts were first coated with 100 µg BME overnight, 50,000 PC3 cells were plated per
insert and invasion was allowed to proceed for 48 h. For DU145 cells and some PC3 cell
experiments, coating was for 1 h using 150 µg BME and 30,000 cells. In parallel, similarly
treated cells in 24-well plates were stained using crystal violet and the values used to
normalize for total cell number.
Results
Gene silencing of Dkk3 increases expression and activity of MMP2 and MMP9 in prostate
epithelial cells.
We previously reported that 3D culture of RWPE-1 prostate epithelial cells reduces
expression of a subset of TGF-β/Smad target genes and that silencing of Dkk-3 increases
TGF-β target gene expression (3). Since several MMPs are direct TGF-β/Smad gene targets
and play important roles in tissue morphogenesis (22), we examined their levels in monolayer
and 3D cultures and determined the effects of Dkk-3 gene silencing on their expression.
MMP2 and MMP9, which are TGF-β-regulated gelatinases, were expressed at lower levels in
3D than in monolayer cultures (Figure 1A), as previously observed for the TGF-β target gene
PMEPA1 (3). Silencing of Dkk-3 increased the expression of MMP2 mRNA but not that of
MMP9 (Figure 1A). We also measured MMP-2 and MMP-9 activities in conditioned media
Page 8 of 38Carcinogenesis
123456789101112131415161718192021222324252627282930313233343536373839404142434445464748495051525354555657585960
9
(CM) from NS11 and sh6 cells using gelatin zymography. The predominant activity detected
corresponded to the apparent molecular mass of MMP-9 (80 kDa) (Figure 1B). Treatment of
cells with TGF-β1 increased this activity and the increase was blocked by the TGF-β type I
receptor inhibitor SB431542. Moreover, this activity was higher in Dkk-3-silenced cells than
in control cells (Figure 1B). To determine if Dkk-3 affected MMP expression or activity in
non-immortalized prostate epithelial cells, experiments were carried out using primary
prostate epithelial cells (PrEC) infected with lentiviruses expressing Dkk-3 shRNA or Dkk-3
cDNA (5). Knockdown of Dkk-3 increased mRNA expression of both MMP2 and MMP9
(Figure 1C). In addition, knockdown of Dkk-3 increased the activity of MMP-9, and to a
lesser extent, MMP-2, in PrEC cell CM (Figure 1D). Ectopic expression of Dkk-3, however,
did not affect MMP2/9 expression (Figure 1C) or MMP-2/9 activity (Figure 1D), suggesting
that other endogenous factors are limiting for the regulation of MMPs by Dkk-3. Together
these results demonstrate that silencing of Dkk-3 leads to increased expression and/or activity
of MMP2 and MMP9 in prostate epithelial cells.
Inhibition of MMP-9 partially rescues defective acinar morphogenesis in Dkk-3-silenced
cells.
We previously reported that inhibition of TGF-β/Smad signaling rescues defective acinar
morphogenesis in Dkk-3-silenced RWPE-1 cells (3). Since TGF-β stimulates MMP-9 activity
in RWPE-1 cells, we wished to determine if inhibition of MMPs rescued defective acinar
morphogenesis. To test this possibility, acinar morphogenesis assays were carried out in the
presence of a panel of MMP inhibitors. At six days, as previously observed (3), control NS11
cells mostly formed well-rounded spherical acini, whereas Dkk-3-silenced sh6 cells formed
irregular non-spherical acini (Figure 2A). Addition of the broad-spectrum MMP inhibitor
marimastat increased the proportion of normal acini formed by both NS11 and sh6 cells
(Figures 2A, B). Treatment with ARP100, which inhibits MMP-2, -3 and -9 at the dose used,
and MMP-9 inhibitor I, partially restored normal acinar morphogenesis in Dkk-3-silenced sh6
cells, but did not affect acinar morphogenesis in NS11 cells (Figure 2A, B). Similar results
were obtained for the MMP-9 inhibitor using a second clone of Dkk-3-silenced RWPE-1
cells (sh30, Figure 2C). These results suggest that acinar morphogenesis requires tight control
of MMP activity and that loss of Dkk-3 disrupts normal acinar morphogenesis, in part, by
increasing TGF-β-dependent activation of MMP-9.
Dkk-3 inhibits TGF-β-induced prostate cancer cell migration and invasion.
Page 9 of 38 Carcinogenesis
123456789101112131415161718192021222324252627282930313233343536373839404142434445464748495051525354555657585960
10
Since MMP9 is upregulated in prostate cancer (27-29) and promotes prostate cancer cell
invasion (30,31), we further examined the function of Dkk-3 using PC3 cells, which can be
stimulated to migrate and invade by TGF-β (32). Ectopic expression of Dkk-3 in prostate
cancer cells has been reported to lead to apoptosis (33). Hence, we used conditioned media
(CM) from cells transiently transfected with control or Dkk-3 expression plasmids for these
experiments. Compared to control CM, Dkk-3 CM inhibited TGF-β-induced PC3 cell
migration and invasion, without significantly affecting basal migration or invasion (Figures
3A and B). In order to identify the domain in Dkk-3 responsible for these effects, a series of
Dkk-3 constructs was engineered with deletions in the amino terminal domain (Nt), each of
the cysteine-rich domains (Cys1 and Cys2) or expressing only a single domain (Figure 3C).
All the constructs included the Dkk-3 signal peptide to enable secretion and part of the
carboxyl terminal region to facilitate detection using an antibody to the carboxyl terminal tail.
Western blotting of transiently transfected HEK 293 cells indicated the Dkk-3 deletion
mutants were expressed and secreted, albeit at different levels (Figure 3D). Transiently
transfected PC3 cells also efficiently secreted the Dkk-3 mutants, except for Nt, which was
more difficult to detect by western blotting (Supplementary Figure 1A).
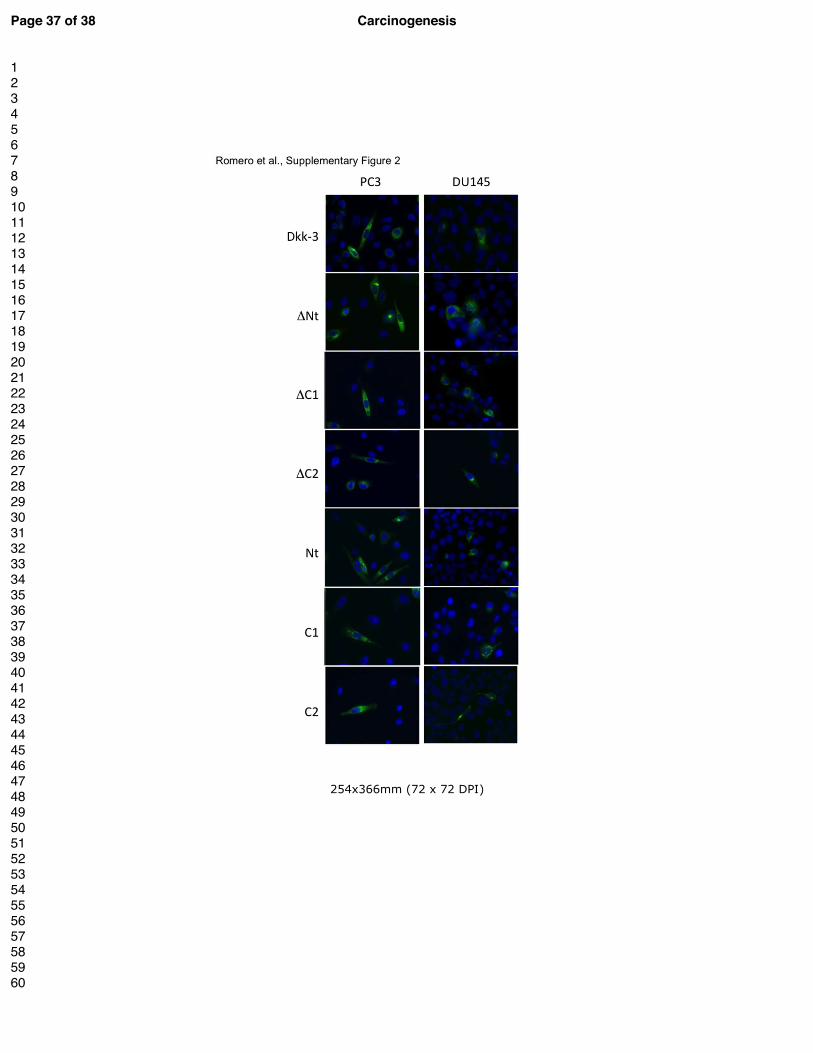
Immunocytochemical staining of transiently transfected cells indicated that all constructs
were similarly localized, showing a staining pattern consistent with localization in the
endoplasmic reticulum (ER) and/or Golgi (Supplementary Figure 2A). Preliminary
experiments using CM from transiently transfected PC3 cells indicated that the Dkk-3 Cys2
domain inhibited TGF-β-induced migration (Supplementary Figure 1B). To study this in
more detail, PC3 cells transfected with plasmids expressing Dkk-3 and Dkk-3 deletion
mutants were selected in order to generate stable pooled cell lines. Western blotting of CM
indicated that several of the Dkk-3 mutants were stably secreted, although at different levels
(Figure 3E). The cell lines expressing Dkk-3, ∆Nt, Cys2 and ∆Cys2 were analyzed in detail.
Gene reporter assays were first conducted to determine the effects of the Dkk-3 mutants on
TGF-β/Smad-dependent transcription. Stable expression of Dkk-3 reduced TGF-β-dependent
transcriptional activity (Figure 3F). TGF-β-dependent transcriptional activity was also
significantly lower in cells expressing ∆Nt and Cys2, whereas in cells expressing ∆Cys2 it
was similar to that in empty vector-transfected control cells. Cell migration assays were then
carried out to determine if the differences observed using gene reporter assays correlated with
effects on cell migration. Stable expression of Dkk-3 inhibited TGF-β-induced migration, as
did stable expression of ∆Nt and of Cys2 (Figure 3G). In contrast, TGF-β-induced migration
Page 10 of 38Carcinogenesis
123456789101112131415161718192021222324252627282930313233343536373839404142434445464748495051525354555657585960
11
of ∆Cys2 cells was similar to that in control cells. Similar results were obtained in cell
invasion assays, where stable expression of Dkk-3 or the Cys2 domain inhibited TGF-β-
induced cell invasion (Figure 3H). There were no differences in proliferation among the cell
lines (data not shown). In summary, the Dkk-3 Cys2 domain is both necessary and sufficient
for Dkk-3 inhibition of TGF-β1-dependent gene expression, migration and invasion in PC3
cells.
To determine if these observations could be extended to other metastatic prostate cancer
cells, experiments were carried out using DU145 cells, which invade in response to TGF-β
(34) but, unlike PC3 cells, express some Dkk-3 (7). Stable pooled DU145 cell lines
expressing empty vector, Dkk-3 and Cys2 were generated and secretion of Dkk-3 and Cys2
confirmed by western blotting (Figure 4A). Expression of Dkk-3 reduced TGF-β-dependent
transcription in DU145 cells (Figure 4B). Cys2 was not expressed as highly as Dkk-3 (Figure
4A) and did not significantly affect transcriptional activity. In contrast to PC3 cells, Dkk-3
increased basal levels of DU145 cell migration (Figure 4C) and invasion (Figure 4D). As a
result of these basal changes, there were apparent reductions in TGF-β fold-activation of
migration and invasion. However, the absolute numbers of migrating and invading cells in
the presence of TGF-β were similar to controls. In contrast� stable expression of Cys2
inhibited TGF-β-induced DU145 cell migration (Figure 4C) and invasion (Figure 4D). Thus,
while DU145 cells respond somewhat differently to full-length Dkk-3, the inhibitory effects
of the Cys2 domain on migration and invasion were similar to those observed in PC3 cells.
In order to determine possible reasons why the Dkk-3 responses of PC3 and DU145 cells
differed, we first examined its localization by immunocytochemistry. However, no
differences in the subcellular localization of Dkk-3 or the other Dkk-3 constructs were
observed (Supplementary Figure 2). Next, we carried out gene reporter assays to compare the
effects of Dkk-3 and Cys2 on different signalling pathways in PC3 and DU145 cells cultured
under conditions used for cell migration and invasion assays. The reporters included
8xTOP/FOPFlash to provide a readout for Wnt/β-catenin signalling, ATF2-luciferase for
noncanonical Wnt signalling, NFkB-luciferase and AP-1-luciferase. None of the reporters
were significantly affected by TGF-β in either cell line. However, Dkk-3 and Cys2 both
inhibited AP-1-luciferase in PC3 cells but not in DU145 cells (Figure 4E). There was also
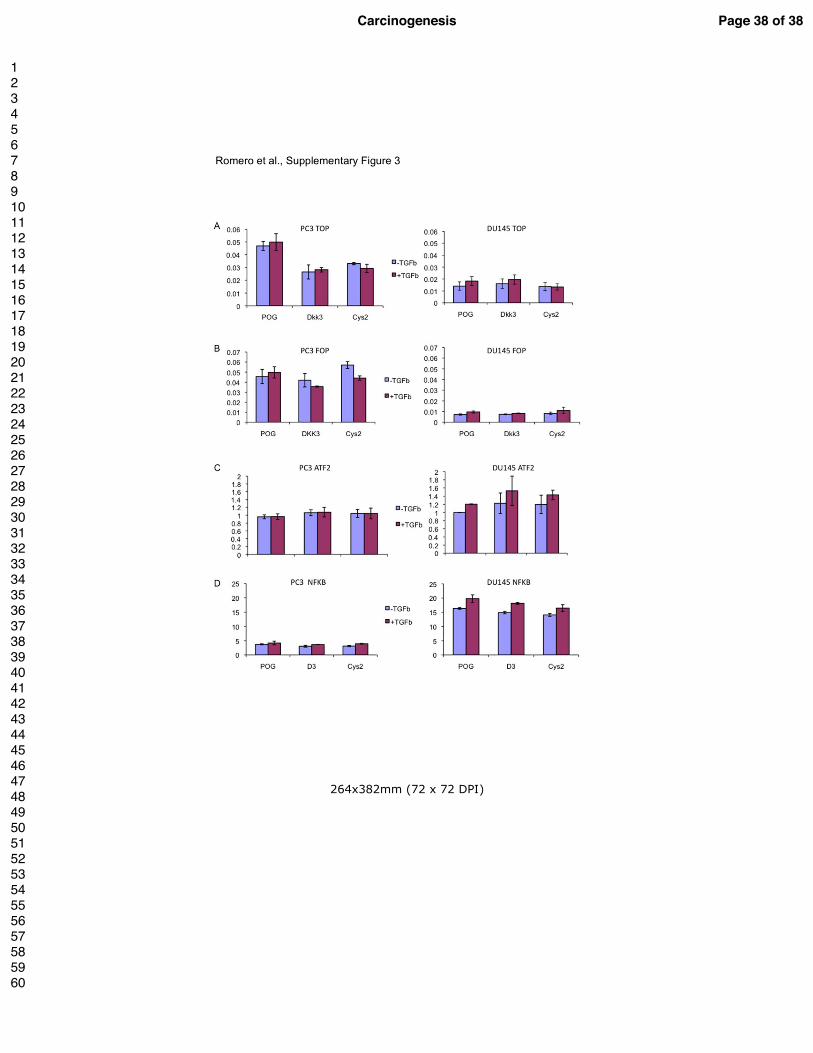
trend for a similar effect using the Wnt/β-catenin signalling reporter (Figure 4F). However,
the activities of the 8xTOPFlash and 8xFOPFlash reporters were very low in both cell lines,
(Supplementary Figures 3A and B). Finally, neither Dkk-3 nor Cys2 significantly affected
Page 11 of 38 Carcinogenesis
123456789101112131415161718192021222324252627282930313233343536373839404142434445464748495051525354555657585960
12
ATF2-luciferase or NFkB-luciferase activities in either cell line. Together, these results
suggest that AP-1 signaling may account for differential responses of PC3 and DU145 cells
to Dkk-3.
The Dkk-3 Cys2 domain inhibits MMP9 and MMP13 expression in prostate cancer cells.
In order to determine whether Dkk-3 regulated the same MMPs in prostate cancer cells as in
prostate epithelial cells, we examined MMP activity in PC3 cell-conditioned media (CM) by
zymography. This revealed the presence of a major gelatinase at 58 kDa, which was
increased in cells treated with TGF-β1 (Figure 5A) and was reduced upon inhibition of TβRI
by SB431542. MMP2 mRNA was not detected in PC3 cells (results not shown), consistent
with previous studies (35,36). PC3 cells did express MMP9 mRNA, and this was increased
by TGF-β1 treatment (Figure 5B). However, the size of the band detected by zymography
was not consistent with it being MMP-9 (which is normally 82-92 kDa), and we were unable
to detect MMP-9 by western blotting (results not shown). PC3 cells have been reported to
express MMP-1 and MMP-13 (36), which are both collagenases that have weak gelatinase
activity in zymography assays (37). MMP-1 was not detected in PC3 cell CM (results not
shown). However, MMP13 was highly expressed and its expression was increased by TGF-β
(Figures 5B and 5C). Moreover, a specific inhibitor of MMP-13 reduced TGF-β-dependent
PC3 cell invasion (Figure 5D). To try to confirm the identity of the 58 kDa gelatinase,
zymography assays were carried out in the presence of MMP inhibitors. The gelatinase was
inhibited by the broad-spectrum MMP inhibitor marimastat but it was not significantly
affected by inhibition of MMP-13 or MMP-9 (Figure 5E). To determine if Dkk-3 might
inhibit PC3 cell invasion via effects on MMPs, the effects of transient transfection of Dkk-3
and Cys2 on MMP mRNA expression were determined. Cys2, but not full-length Dkk-3,
inhibited TGF-β-induced expression of both MMP9 and MMP13 (Figure 5F). In addition,
Dkk-3 inhibited the TGF-β-induced increase in MMP-13 protein, but not its basal level,
which increased (Figure 5G).
Effects of the Dkk-3 Cys2 domain on the TGF-β signaling response in RWPE-1 cells
In order to determine how the Cys2 domain might contribute to Dkk-3 function in prostate
epithelial cells, we carried out gene reporter assays in Dkk-3-silenced (sh6) and control
(NS11) RWPE-1 cells. Ectopic expression of both Dkk-3 and Cys2 inhibited TGF-β-
dependent gene reporter activity in sh6 cells (Figure 6A), restoring the activity to that
Page 12 of 38Carcinogenesis
123456789101112131415161718192021222324252627282930313233343536373839404142434445464748495051525354555657585960
13
measured in control RWPE-1 cells (Figure 6B). Dkk-3 and Cys2 also inhibited gene reporter
activity to some extent in NS11 cells (Figure 6B), but this was less than that observed in Dkk-
3-silenced cells. Interestingly, expression of ∆Cys2 inhibited gene reporter activity in NS11
cells but not in sh6 cells, suggesting it might enhance endogenous Dkk-3 activity, for
example by titrating out a negative regulator. To determine if the Dkk-3 Cys2 domain could
rescue defective acinar morphogenesis in Dkk-3-silenced cells, assays were carried out using
RWPE-1 sh6 cells treated with CM from sh6 cells that had been transfected in parallel with
empty vector and plasmids expressing Dkk-3 and Cys2. Compared to empty vector CM,
Dkk-3 CM increased the proportion of normal acini in sh6 cell cultures (Figure 6C). Cys2
CM appeared to increase the proportion of normal acini in sh6 cells but this was not
statistically significant. In conclusion, while Dkk-3 and the Cys2 domain both inhibit TGF-β-
dependent gene reporter activity, only Dkk-3 is able to rescue acinar morphogenesis in Dkk-
3-silenced cells.
Discussion
Metastasis is responsible for the majority of deaths resulting from solid tumors (38). For
cancer cells to become metastatic they need to acquire genetic and epigenetic changes that
allow them to migrate and invade through the tissue and into the bloodstream or lymph
vessels, and invade and survive at secondary sites. Metastatic prostate cancer is largely
incurable (39), and so research into the signaling events that allow cancer cells to metastasize
is essential. In this respect, research into Dkk-3 is of particular interest, since Dkk-3 has
demonstrated ability to inhibit prostate tumor metastasis in vivo (8). The signaling events
downstream of Dkk-3, however, are not well understood (1). The studies presented here
indicate that Dkk-3 signals affect the activities of MMP-2, MMP-9 and MMP-13, most likely
via effects on TGF-β signaling. Several previous studies have implicated these MMPs in
prostate tumor cell invasion and metastasis (reviewed by (40)).
Silencing of Dkk-3 increased mRNA expression of MMP2 and MMP9 both in RWPE-1
prostate epithelial cells and primary prostate epithelial cell cultures (Figure 1). There was a
stronger fold-effect on MMP2 expression in RWPE-1 cells and on MMP9 expression in PrEC
cells, perhaps reflecting differences between primary and immortalized cells. Ectopic
expression of Dkk-3 did not affect MMP2 or MMP9 expression in PrEC cells (Figure 1C),
suggesting that Dkk-3 signaling does not regulate basal MMP levels. Zymography assays
confirmed the effects of Dkk-3 at the protein level and showed that MMP-9 is more abundant
Page 13 of 38 Carcinogenesis
123456789101112131415161718192021222324252627282930313233343536373839404142434445464748495051525354555657585960
14
than MMP-2, particularly in RWPE-1 cells. Consistent with this, MMP-9 inhibition increased
the proportion of normal acini in Dkk-3-silenced RWPE-1 cells (Figure 2). Marimastat, a
broad-range MMP inhibitor, also improved acinar morphogenesis, suggesting that MMP
activity in general has a negative impact on acinar morphogenesis. The general effect of
MMP inhibition on acinar morphogenesis might be mediated by endogenous Dkk-3, since
Dkk-3 is itself a substrate of MMP-2 and MMP-9 (41), but this remains to be determined.
Nevertheless, the impact of loss of DKK3 gene expression could be potentiated by an
increase in MMP expression leading to degradation of the secreted pool of Dkk-3.
Results from our studies in DU145 and PC3 prostate cancer cell lines, which are derived
from metastatic tumors and express little or no Dkk-3, respectively, revealed some
differences in response to Dkk-3. Dkk-3 inhibited the TGF-β-induced increase in migration
and invasion in PC3 cells (Figures 3G and H) and DU145 cells (Figures 4C and D), but it
also increased basal migration and invasion in DU145 cells. This was in contrast to the Cys2
domain, which inhibited TGF-β-induced migration and invasion in both cell lines without
increasing basal migration and invasion. The reason for the difference in response to Dkk-3 is
not known. However, the two cell lines differ in many respects that could have an impact on
their responses to Dkk-3. For example, DU145 cells express more endogenous DKK3 than
PC3 cells (7), DU145 cells express less TGFβRII and their TGF-β response is weaker than
that of PC3 cells (42), and DU145 cell invasion is more dependent on cathepsin activity than
that of PC3 cells (43). The results of our gene reporter assays also revealed differences
between DU145 and PC3 cells. TGF-β-induced CAGA-luciferase activity was inhibited two-
fold by Dkk-3 and Cys2 in PC3 cells (Figure 3F), whereas it was reduced only 30% by Dkk-3
and not at all by Cys2 in DU145 cells (Figure 4B). These results suggest that Dkk-3
inhibition of TGF-β-induced migration and invasion is not solely mediated through effects on
TGF-β/Smad-dependent transcription. Examination of the effects of Dkk-3 and Cys2 on the
activities of other gene reporters revealed that they inhibited AP-1 signaling and showed a
trend for inhibition of β-catenin/Tcf signaling in PC3 cells but not in DU145 cells (Figures
4E and F). While TGF-β did not affect AP-1- or β-catenin/Tcf-dependent transcriptional
activities, AP-1 family members and β-catenin have the capacity to act as Smad cofactors
(reviewed in (44)). Since β-catenin/Tcf-dependent transcriptional activity was very low in
both cell lines (Supplementary Figures 3A and B), our results favour a role for inhibition of
AP-1 signaling in the response to Dkk-3 in PC3 cells.
Page 14 of 38Carcinogenesis
123456789101112131415161718192021222324252627282930313233343536373839404142434445464748495051525354555657585960
15
Based on what was observed in prostate epithelial cells, the effects of Dkk-3 on PC3 cell
invasion were anticipated to involve MMP-2 and/or MMP-9. However, MMP2 mRNA was
barely detectable by q-PCR and the apparent molecular mass of the gelatinase secreted by
PC3 cells (58 kDa) is lower than that of MMP-9. Moreover, MMP-9 was difficult to detect by
western blotting, consistent with the low level of expression of MMP9 mRNA (results not
shown). One possibility is that the 58 kDa gelatinase is a cleaved form of MMP-9, as has
been reported previously (for references, see (45)), and not recognized by the MMP-9
antibody. Consistent with this possibility, inhibition of MMP-9 showed a trend for inhibition
of the 58 kDa gelatinase (Figure 5E). Although the identity of the 58 kDa gelatinase remains
unclear, transfection of the Dkk-3 Cys2 domain reduced expression of both MMP9 and
MMP13 (Figure 5F), and PC3 cell invasion was reduced by inhibition of MMP-13 (Figure
5D) and has been reported to be reduced by inhibition of MMP-9 (30). Moreover, MMP-9
expression is elevated in prostate cancer (27-29) and promotes prostate cancer cell invasion
(30,31), and MMP-13 expression is elevated in metastatic prostate cancer (29). The
regulation of these two MMPs may be linked, since silencing of MMP13 in metastatic breast
tumor cells reduces expression of MMP9 mRNA and the level of active MMP-9 (46).
Furthermore, cell surface-localized MMP-9 cleaves and activates latent TGF-β (47,48).
Our results point to the Cys2 domain of Dkk-3 as important for the effects of Dkk-3 on
TGF-β-induced migration and invasion. Previous studies have found that the Dkk-1 Cys2
domain is essential for binding to LRP5/6 and inhibition of Wnt/β-catenin signaling (11).
Despite the sequence similarities of the Dkk-1 and Dkk-3 Cys2 domains, the latter is unable
to bind to LRP5/6 (10,49,50). A molecular modeling simulation study has identified a 7-
amino-acid insertion (L249-E255) and a proline residue (P258) unique to human Dkk-3 that
might account for its low affinity for LRP5/6 (51). Whether these differences also confer
binding to Dkk-3 receptors is not known. Mammalian Dkk-3 receptors remain to be
identified, but candidates include integrin family members (52,53). The involvement of
integrins is an intriguing possibility, since αv family integrins and α8β1 play a role in
activation of latent TGF-β (54). However, zebrafish Dkk3 binds integrin α6b (53), so its
mechanism of action might not involve latent TGF-β. There are reports that Dkk-3 also
associates with intracellular proteins (1). However, since exogenously applied Dkk-3 inhibits
migration and invasion and partially rescues acinar morphogenesis, it seems more likely that
Dkk-3 regulates the TGF-β response via a cell-surface receptor.
Page 15 of 38 Carcinogenesis
123456789101112131415161718192021222324252627282930313233343536373839404142434445464748495051525354555657585960
16
While the Cys2 domain of Dkk-3 inhibited prostate cancer cell invasion, it did not
significantly rescue acinar morphogenesis in sh6 cells. This suggests that other domains are
also required for this function of Dkk-3. Although Dkk-3 CM increased the number of
normal acini formed by Dkk-3-silenced cells, the rescue was partial. This is consistent with
our previous study showing that recombinant Dkk-3 partially rescues acinar morphogenesis
(3), which led us to propose that acinar morphogenesis requires controlled levels and/or
localized expression of Dkk-3 (55). The Cys2 domain may be less able than Dkk-3 to play a
role in acinar morphogenesis because it lacks other sequences required for Dkk-3 function.
The different effects of the Cys2 domain on prostate epithelial cells and prostate cancer cells
may be beneficial for the development of Dkk-3-based therapies, since our results suggest
that the Cys2 domain will block invasion of prostate tumor cells without affecting the normal
prostate epithelium.
Conflict of interest
The authors declare they have no potential conflicts of interest.
Acknowledgements
We thank Ewelina Flis (Jagiellonian University, Krakow) for technical assistance and Maria
Vivanco (CIC bioGUNE) for critical reading of the manuscript. This study was supported by
The Garfield Weston Foundation, the Rosetrees Trust, Prostate Cancer UK, the Spanish
Ministry of Education and Science (SAF2011-30494, SAF2014-51966-R), the Government
of the Autonomous Community of the Basque Country Departments of Education, Industry,
Tourism and Trade and Innovation Technology, Imperial Experimental Cancer Medicine
Centre, Imperial NIHR Biomedical Research Centre and Cancer Research UK Imperial
Centre.
Authors’ contributions
DR - conception, design, conduction and analysis of the majority of the experiments and
manuscript writing; ZAS - analysis of acinar morphogenesis assays; IG - conduction and
analysis of qPCR, immunocytochemistry and gene reporter assays in prostate cancer cells;
FT, SA and JC - conduction and analysis of experiments in prostate cancer cells; CZ and PB -
Page 16 of 38Carcinogenesis
123456789101112131415161718192021222324252627282930313233343536373839404142434445464748495051525354555657585960

17
conception, design, conduction and analysis of studies in primary cells; NB - conduction and
analysis of qPCR experiments; JW - helped conceive the study and write the manuscript; RK
- conception, design and interpretation of experiments and manuscript writing.
Page 17 of 38 Carcinogenesis
123456789101112131415161718192021222324252627282930313233343536373839404142434445464748495051525354555657585960
18
References
1. Veeck, J., et al. (2012) Targeting the Wnt pathway in cancer: the emerging role of
Dickkopf-3. Biochim Biophys Acta, 1825, 18-28.
2. Abarzua, F., et al. (2008) An N-terminal 78 amino acid truncation of REIC/Dkk-3
effectively induces apoptosis. Biochem Biophys Res Commun, 375, 614-8.
3. Romero, D., et al. (2013) Downregulation of Dickkopf-3 disrupts prostate acinar
morphogenesis through TGF-beta/Smad signalling. J Cell Sci, 126, 1858-67.
4. Zenzmaier, C., et al. (2008) Dysregulation of Dkk-3 expression in benign and
malignant prostatic tissue. Prostate, 68, 540-7.
5. Zenzmaier, C., et al. (2013) Dickkopf-related protein 3 promotes pathogenic stromal
remodeling in benign prostatic hyperplasia and prostate cancer. Prostate, 73, 1441-52.
6. Lodygin, D., et al. (2005) Functional epigenomics identifies genes frequently silenced
in prostate cancer. Cancer Res, 65, 4218-27.
7. Kawano, Y., et al. (2006) Regulation of prostate cell growth and morphogenesis by
Dickkopf-3. Oncogene, 25, 6528-37.
8. Edamura, K., et al. (2007) Adenovirus-mediated REIC/Dkk-3 gene transfer inhibits
tumor growth and metastasis in an orthotopic prostate cancer model. Cancer Gene Ther, 14,
765-72.
9. Krupnik, V.E., et al. (1999) Functional and structural diversity of the human
Dickkopf gene family. Gene, 238, 301-13.
10. Mao, B., et al. (2002) Kremen proteins are Dickkopf receptors that regulate Wnt/beta-
catenin signalling. Nature, 417, 664-7.
11. Niehrs, C. (2006) Function and biological roles of the Dickkopf family of Wnt
modulators. Oncogene, 25, 7469-81.
Page 18 of 38Carcinogenesis
123456789101112131415161718192021222324252627282930313233343536373839404142434445464748495051525354555657585960
19
12. Semenov, M.V., et al. (2001) Head inducer Dickkopf-1 is a ligand for Wnt coreceptor
LRP6. Curr Biol, 11, 951-61.
13. Bafico, A., et al. (2001) Novel mechanism of Wnt signalling inhibition mediated by
Dickkopf-1 interaction with LRP6/Arrow. Nat Cell Biol, 3, 683-6.
14. Pinho, S., et al. (2007) Dkk3 is required for TGF-beta signaling during Xenopus
mesoderm induction. Differentiation, 75, 957-67.
15. Hsu, R.J., et al. (2011) dickkopf-3-related gene regulates the expression of zebrafish
myf5 gene through phosphorylated p38a-dependent Smad4 activity. J Biol Chem, 286, 6855-
64.
16. Massague, J. (2012) TGFbeta signalling in context. Nat Rev Mol Cell Biol, 13, 616-
30.
17. Moustakas, A., et al. (2014) TGFbeta and matrix-regulated epithelial to mesenchymal
transition. Biochim Biophys Acta, 1840, 2621-34.
18. Ikushima, H., et al. (2010) TGFbeta signalling: a complex web in cancer progression.
Nat Rev Cancer, 10, 415-24.
19. Inman, G.J. (2011) Switching TGFbeta from a tumor suppressor to a tumor promoter.
Curr Opin Genet Dev, 21, 93-9.
20. Pickup, M., et al. (2013) The roles of TGFbeta in the tumour microenvironment. Nat
Rev Cancer, 13, 788-99.
21. Kessenbrock, K., et al. (2015) Matrix metalloproteinases in stem cell regulation and
cancer. Matrix Biol.
22. Page-McCaw, A., et al. (2007) Matrix metalloproteinases and the regulation of tissue
remodelling. Nat Rev Mol Cell Biol, 8, 221-33.
23. Bruni-Cardoso, A., et al. (2010) MMP-2 contributes to the development of the mouse
ventral prostate by impacting epithelial growth and morphogenesis. Dev Dyn, 239, 2386-92.
Page 19 of 38 Carcinogenesis
123456789101112131415161718192021222324252627282930313233343536373839404142434445464748495051525354555657585960
20
24. Sehgal, G., et al. (1998) Requirement for matrix metalloproteinase-9 (gelatinase B)
expression in metastasis by murine prostate carcinoma. Am J Pathol, 152, 591-6.
25. Rasheed, Z., et al. (2009) Green tea polyphenol epigallocatechin-3-gallate inhibits
advanced glycation end product-induced expression of tumor necrosis factor-alpha and
matrix metalloproteinase-13 in human chondrocytes. Arthritis Res Ther, 11, R71.
26. Bengoa-Vergniory, N., et al. (2014) A switch from canonical to noncanonical Wnt
signaling mediates early differentiation of human neural stem cells. Stem Cells, 32, 3196-208.
27. Zhang, L., et al. (2004) Type IV collagenase (matrix metalloproteinase-2 and -9) in
prostate cancer. Prostate Cancer Prostatic Dis, 7, 327-32.
28. Escaff, S., et al. (2010) Study of matrix metalloproteinases and their inhibitors in
prostate cancer. Br J Cancer, 102, 922-9.
29. Morgia, G., et al. (2005) Matrix metalloproteinases as diagnostic (MMP-13) and
prognostic (MMP-2, MMP-9) markers of prostate cancer. Urol Res, 33, 44-50.
30. Aalinkeel, R., et al. (2004) Gene expression of angiogenic factors correlates with
metastatic potential of prostate cancer cells. Cancer Res, 64, 5311-21.
31. Steffan, J.J., et al. (2012) The transcription factor SPDEF suppresses prostate tumor
metastasis. J Biol Chem, 287, 29968-78.
32. Craft, C.S., et al. (2007) Endoglin inhibits prostate cancer motility via activation of
the ALK2-Smad1 pathway. Oncogene, 26, 7240-50.
33. Abarzua, F., et al. (2005) Adenovirus-mediated overexpression of REIC/Dkk-3
selectively induces apoptosis in human prostate cancer cells through activation of c-Jun-
NH2-kinase. Cancer Res, 65, 9617-22.
34. Turley, R.S., et al. (2007) The type III transforming growth factor-beta receptor as a
novel tumor suppressor gene in prostate cancer. Cancer Res, 67, 1090-8.
Page 20 of 38Carcinogenesis
123456789101112131415161718192021222324252627282930313233343536373839404142434445464748495051525354555657585960
21
35. Dong, Z., et al. (2001) Differential regulation of matrix metalloproteinase-9, tissue
inhibitor of metalloproteinase-1 (TIMP-1) and TIMP-2 expression in co-cultures of prostate
cancer and stromal cells. Int J Cancer, 93, 507-15.
36. Daja, M.M., et al. (2003) Characterization of expression of matrix metalloproteinases
and tissue inhibitors of metalloproteinases in prostate cancer cell lines. Prostate Cancer
Prostatic Dis, 6, 15-26.
37. Snoek-van Beurden, P.A., et al. (2005) Zymographic techniques for the analysis of
matrix metalloproteinases and their inhibitors. Biotechniques, 38, 73-83.
38. Gupta, G.P., et al. (2006) Cancer metastasis: building a framework. Cell, 127, 679-95.
39. Bracarda, S., et al. (2014) Clinical implications for a treatment algorithm and
differential indication to hormone therapy and chemotherapy options in metastatic castrate-
resistant prostate cancer: a personal view. Expert Rev Anticancer Ther, 14, 1283-94.
40. Gong, Y., et al. (2014) Roles of matrix metalloproteinases and their natural inhibitors
in prostate cancer progression. Cancers (Basel), 6, 1298-327.
41. Prudova, A., et al. (2010) Multiplex N-terminome analysis of MMP-2 and MMP-9
substrate degradomes by iTRAQ-TAILS quantitative proteomics. Mol Cell Proteomics, 9,
894-911.
42. Walker, L., et al. (2013) Expression of TGFbeta3 and its effects on migratory and
invasive behavior of prostate cancer cells: involvement of PI3-kinase/AKT signaling
pathway. Clin Exp Metastasis, 30, 13-23.
43. Colella, R., et al. (2004) Matrigel invasion by the prostate cancer cell lines, PC3 and
DU145, and cathepsin L+B activity. Biotech Histochem, 79, 121-7.
44. Krstic, J. and Santibanez J. F. (2014) Transforming Growth Factor-Beta and Matrix
Metalloproteinases Functional Interplay in Cancer; Implications in Epithelial to
Mesenchymal Transition Cell Biol: Res Ther, S1-004 doi:10.4172/2324-9293.
Page 21 of 38 Carcinogenesis
123456789101112131415161718192021222324252627282930313233343536373839404142434445464748495051525354555657585960
22
45. Vandooren, J., et al. (2013) Biochemistry and molecular biology of gelatinase B or
matrix metalloproteinase-9 (MMP-9): the next decade. Crit Rev Biochem Mol Biol, 48, 222-
72.
46. Nannuru, K.C., et al. (2010) Matrix metalloproteinase (MMP)-13 regulates mammary
tumor-induced osteolysis by activating MMP9 and transforming growth factor-beta signaling
at the tumor-bone interface. Cancer Res, 70, 3494-504.
47. Wilson, T.J., et al. (2008) Cathepsin G enhances mammary tumor-induced osteolysis
by generating soluble receptor activator of nuclear factor-kappaB ligand. Cancer Res, 68,
5803-11.
48. Yu, Q., et al. (2000) Cell surface-localized matrix metalloproteinase-9 proteolytically
activates TGF-beta and promotes tumor invasion and angiogenesis. Genes Dev, 14, 163-76.
49. Li, L., et al. (2002) Second cysteine-rich domain of Dickkopf-2 activates canonical
Wnt signaling pathway via LRP-6 independently of dishevelled. J Biol Chem, 277, 5977-81.
50. Brott, B.K., et al. (2002) Regulation of Wnt/LRP signaling by distinct domains of
Dickkopf proteins. Mol Cell Biol, 22, 6100-10.
51. Fujii, Y., et al. (2014) Molecular simulation analysis of the structure complex of C2
domains of DKK family members and beta-propeller domains of LRP5/6: explaining why
DKK3 does not bind to LRP5/6. Acta Med Okayama, 68, 63-78.
52. Alfonso, R.J., et al. (2014) Dickkopf-3 alters the morphological response to retinoic
acid during neuronal differentiation of human embryonal carcinoma cells. Dev Neurobiol, 74,
1243-54.
53. Fu, C.Y., et al. (2012) Zebrafish Dkk3a protein regulates the activity of myf5
promoter through interaction with membrane receptor integrin alpha6b. J Biol Chem, 287,
40031-42.
Page 22 of 38Carcinogenesis
123456789101112131415161718192021222324252627282930313233343536373839404142434445464748495051525354555657585960
23
54. Worthington, J.J., et al. (2011) TGFbeta: a sleeping giant awoken by integrins. Trends
Biochem Sci, 36, 47-54.
55. Romero, D., et al. (2013) Dickkopf-3 function in the prostate: implications for
epithelial homeostasis and tumor progression. Bioarchitecture, 3, 42-4.
Page 23 of 38 Carcinogenesis
123456789101112131415161718192021222324252627282930313233343536373839404142434445464748495051525354555657585960
24
Figure Legends
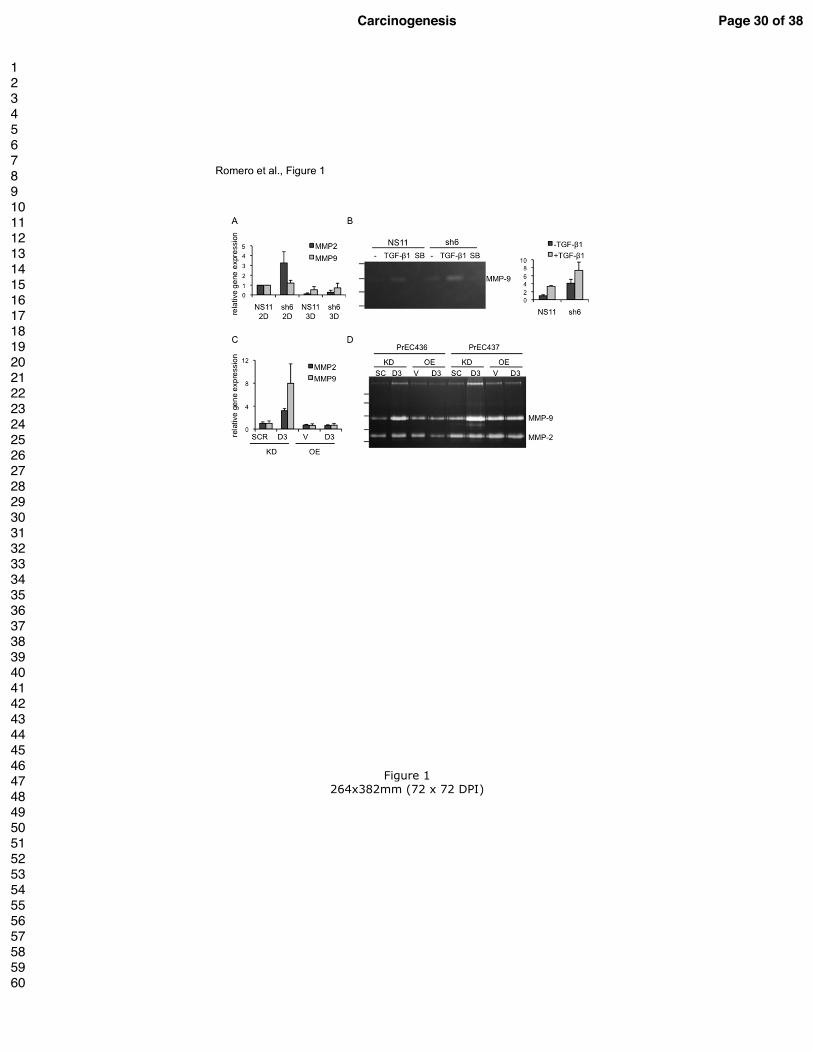
Figure 1. Gene silencing of Dkk3 increases expression and activity of MMP2 and MMP9
in prostate epithelial cells.
(A) qPCR analysis of MMP2 and MMP9 mRNA expression in RWPE-1 cell lines expressing
control shRNA (NS11) or Dkk-3 shRNA (sh6) cultured as a monolayer (2D) or under
conditions used for acinar morphogenesis (3D). MMP2 mRNA was significantly lower in 3D
cultures compared to in 2D in NS11 and sh6 cells (p < 0.05), MMP9 mRNA showed a trend
for lower expression in NS11 cells in 3D compared to in 2D (p = 0.057), MMP2 showed a
trend for higher expression in sh6 in 2D compared to NS11 in 2D (p = 0.07); ANOVA and
Student’s t-test, n = 3 or 4.
(B) Zymography analysis of conditioned media (CM) from NS11 and sh6 cells cultured for
24 h in NS KSFM ± 1 ng/ml TGF-β1 or 1 µM SB431542 (SB). A representative image from
three experiments is shown. The positions of molecular mass markers are indicated on the left
(175, 80, 58 and 46 kDa). Graph shows densitometry analysis of the bands detected in NS11
and sh6 CM untreated or treated with TGF-β1 (the bands for SB were too low to quantify).
(C) MMP2 and MMP9 mRNA expression in PrECs after lentiviral-delivered DKK3 specific
shRNA (KD D3) compared with scrambled control (SCR) and lentiviral-delivered DKK3
overexpression (OE D3) compared with empty vector control virus (V) as determined by
qPCR analysis 72 h post-transduction (n = 4). Gene expression levels were normalized using
the housekeeping gene HMBS and are shown relative to controls.
(D) Zymography analysis of media from PrECs from 2 individual donors (PrEC436,
PrEC437) conditioned for 72 h (day 3-6 post-transduction). The positions of molecular mass
markers are indicated on the left (170, 130, 95, 72 and 55 kDa).
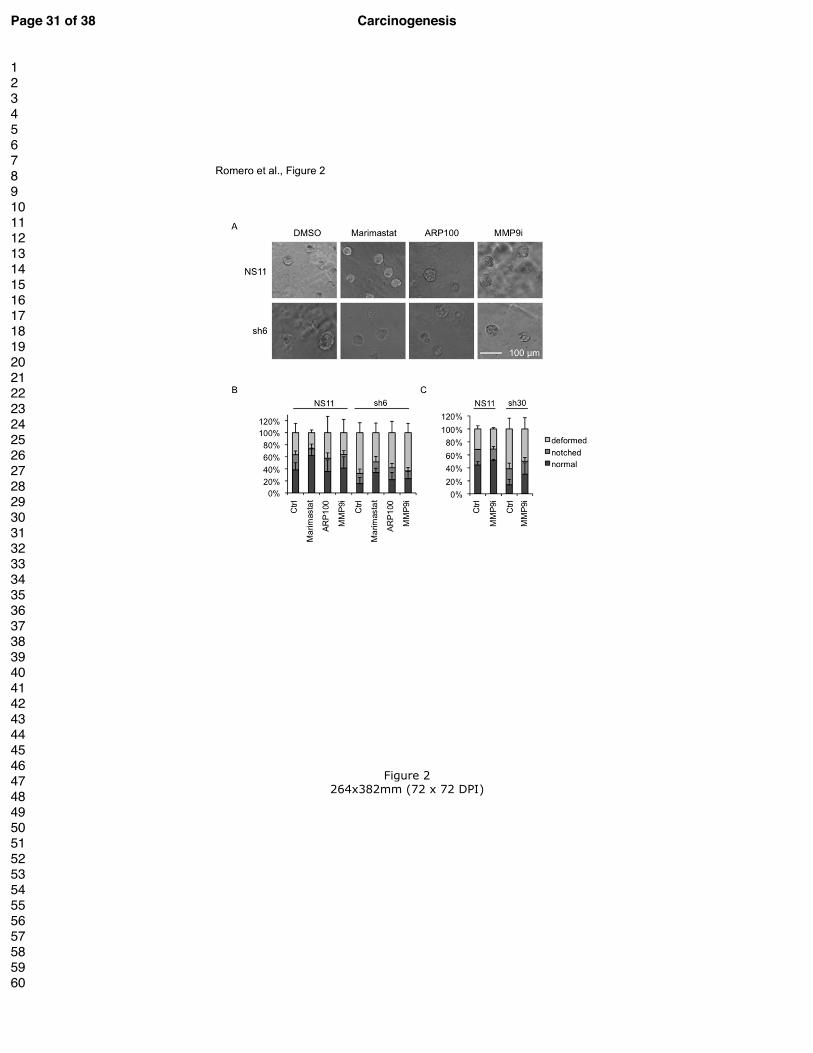
Figure 2. Inhibition of MMP-9 partially rescues defective acinar morphogenesis in Dkk-
3-silenced cells.
(A) Representative images of acini formed at day 6 by control (NS11) and Dkk-3-silenced
(sh6) cells treated with 1 µM marimastat, ARP 100, MMP-9 Inhibitor I or an equivalent
volume of vehicle (DMSO).
(B) Quantitation of acinar morphogenesis results in NS11 and sh6 cells at 6 days, showing
the average and SD from ten fields per sample. (C) Quantitation of acinar morphogenesis
Page 24 of 38Carcinogenesis
123456789101112131415161718192021222324252627282930313233343536373839404142434445464748495051525354555657585960
25
results in NS11 and Dkk-3-silenced (sh30) cells at 6 days, showing the average and SD from
ten fields per sample.
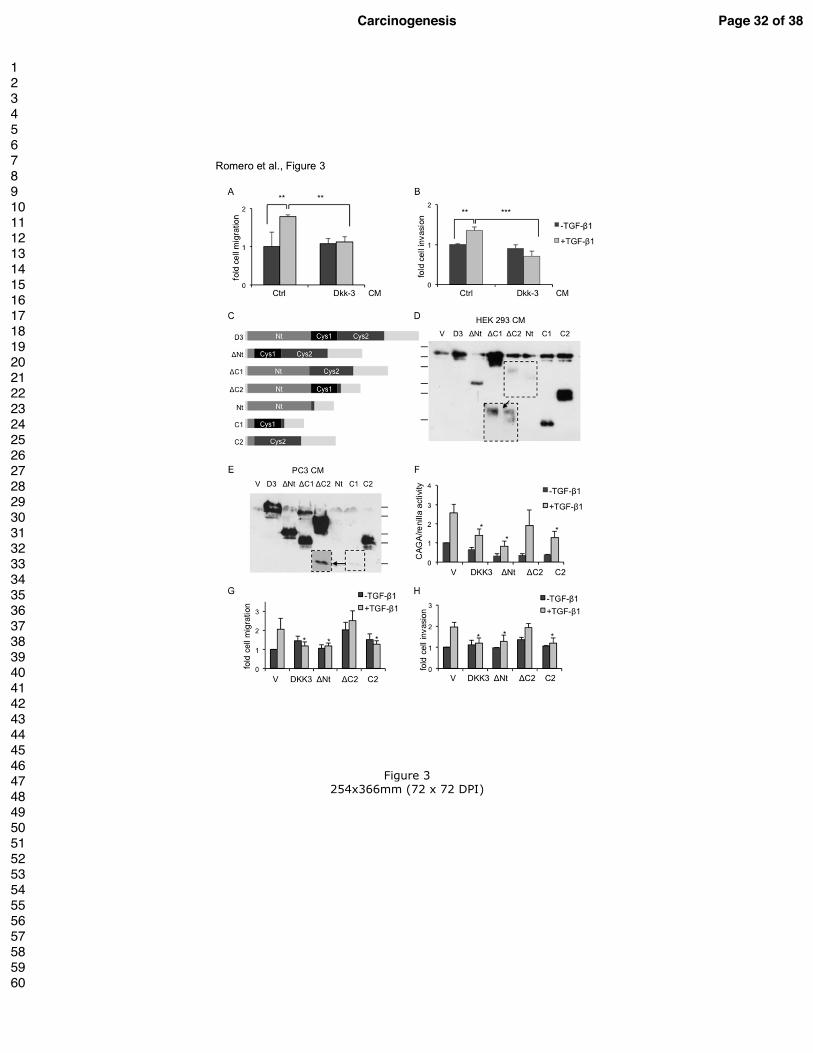
Figure 3. Dkk-3 inhibits TGF-β-induced prostate cancer cell migration and invasion in
PC3 cells.
(A) Transwell cell migration assays using PC3 cells treated with 1 ng/ml TGF-β1 or an
equivalent volume of vehicle (PBS) in the presence of conditioned media (CM) from parallel
cultures of PC3 cells transfected with vector (Ctrl) or Dkk-3 expression plasmid for 24 h.
Pictures were taken and migrated cells counted; graph shows average and SD for 5 fields per
insert. A single experiment is shown using triplicate wells from 3 independent experiments;
** p < 0.01, Student’s t-test.
(B) Transwell invasion assays using PC3 cells treated as in (A) except that invaded cells were
stained and counted after 48 h. A single experiment is shown using triplicate wells from 3
independent experiments; ** p < 0.05, Student’s t-test.
(C) Cartoon depicting Dkk-3 and Dkk-3 deletion mutants with the N-terminal domain (Nt,
residues 1-145) and the cysteine rich domains C1 (Cys1, residues 146-195) and C2 (Cys2,
residues 196-284) indciated. All deletion mutants have the Dkk-3 signal sequence and retain
C-terminal domain residues 285-350 (∆Nt, ∆C1) or 311-350 (Nt, ∆C2).
(D) Anti-Dkk-3 western blots of conditioned media (CM) collected from HEK 293 cells
transiently transfected with empty vector (pOG), Dkk-3 or the indicated Dkk-3 deletion
mutants and cultured without serum for 48 h. The positions of molecular mass markers are
indicated on the left (80, 58, 46, 30, 25 and 17 kDa); inset shows long exposure to visualize
∆C2 and Nt.
(E) Anti-Dkk-3 western blots of CM collected from PC3 cells stably transfected with empty
vector (pOG), Dkk-3 or the indicated Dkk-3 deletion mutants and cultured without serum for
48 h. The positions of molecular mass markers are indicated on the right (80, 58, 46, 30, 25
and 17 kDa); inset shows long exposure to visualize Cys1.
(F) Gene reporter assays using extracts from PC3 cells stably transfected with empty vector,
Dkk-3 and Dkk-3 deletion mutants, transfected with CAGA12-luciferase and renilla reporters
and treated with 1 ng/ml TGF-β1 or PBS as a control for 24 h. Graph shows luciferase/renilla
ratio normalized to control empty vector cells; * p < 0.05, 2-sample t-test, n = 4, each in
duplicate.
Page 25 of 38 Carcinogenesis
123456789101112131415161718192021222324252627282930313233343536373839404142434445464748495051525354555657585960
26
(G) Transwell migration assays using PC3 cells stably transfected with empty vector, Dkk-3
and Dkk-3 deletion mutants and seeded on transwell inserts in serum-free medium with 1
ng/ml TGF-β1 or vehicle (PBS) for 24 h. Averaged numbers of migrated cells were
normalized to control empty vector cells without TGF-β1; * p < 0.05, 2-sample t-test, n = 4,
each in duplicate.
(H) Transwell invasion assays using PC3 cells stably transfected with empty vector, Dkk-3
and Dkk-3 deletion mutants and seeded on transwell inserts coated with Matrigel as in G but
for 48 h. Averaged numbers of invaded cells were normalized to control empty vector cells; *
p < 0.05, 2-sample t-test, n = 4, except for ∆Nt and Cys2, n = 2, all in duplicate.
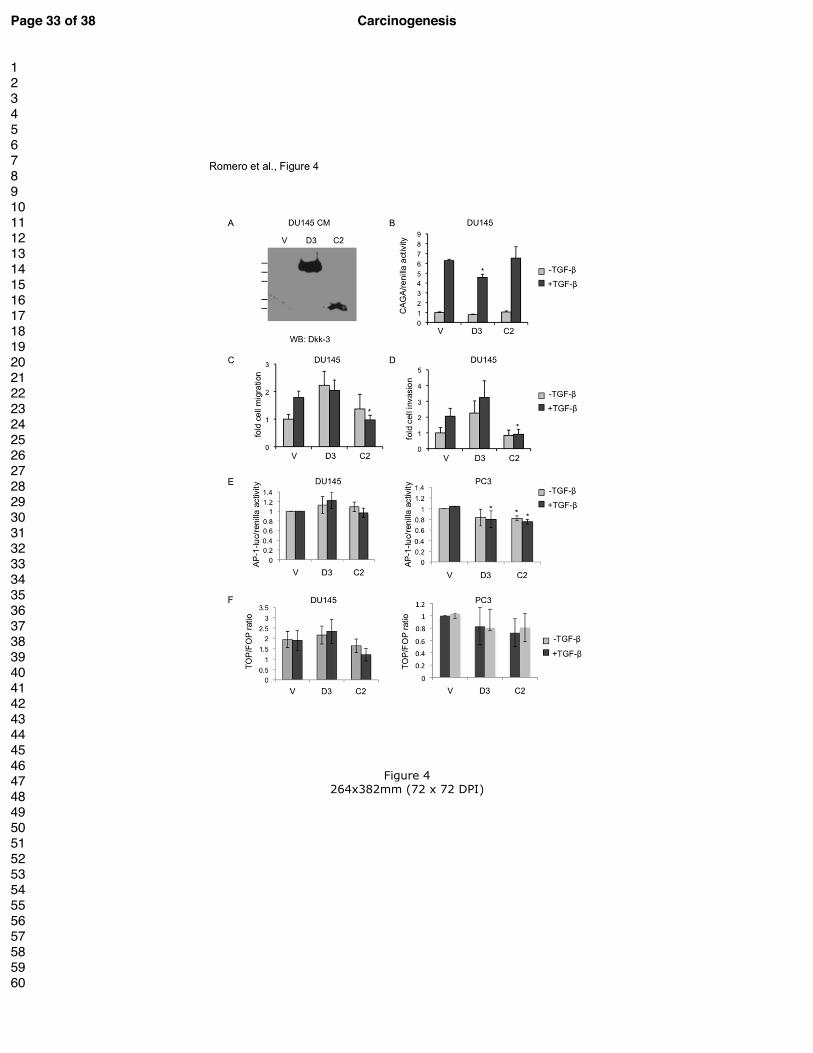
Figure 4. The Dkk-3 Cys2 domain inhibits TGF-β-induced prostate cancer cell
migration and invasion in DU145 cells.
(A) Anti-Dkk-3 western blot of conditioned media (CM) from DU145 cells stably transfected
with empty vector (V), Dkk-3 (D3) and Cys 2 (C2). The positions of molecular mass markers
are indicated on the left (80, 58, 46, 30 and 25 kDa).
(B) Gene reporter assays using extracts from DU145 cells stably transfected with empty
vector, Dkk-3 and Cys2, transfected with CAGA12-luciferase and renilla reporters and
treated with 1 ng/ml TGF-β1 or PBS as a control for 24 h. Graph shows luciferase/renilla
ratio normalized to empty vector control cells; * p < 0.05, n = 4, each in duplicate.
(C) Transwell migration assays using DU145 cells stably transfected with empty vector, Dkk-
3 and Cys2 seeded in serum-free medium with 10 ng/ml TGF-β1 or vehicle (PBS) for 24 h.
Graph shows the ratio between the average number of migrated cells in the presence of TGF-
β1 relative to the average number of migrated cells in the control; * p < 0.05, n = 3.
(D) Transwell invasion assays using DU145 cell lines stably transfected with empty vector,
Dkk-3 and Dkk-3 deletion mutants and seeded on transwell inserts coated with Matrigel as in
C, but for 48 h and numbers of invaded cells normalized as in (C); * p < 0.05, n = 3.
(E) Gene reporter assays using extracts from DU145 cells (left) and PC3 cells (right)
transiently transfected with empty vector, Dkk-3 (D3) or Cys2 (C2) and AP-1-luciferase and
renilla reporters, cultured for 24 h in 0.5% FCS medium and then treated with 1 ng/ml TGF-
β1 or vehicle for 24 h. Graphs show luciferase/renilla ratios normalized to empty vector
control cells; * p < 0.05, n = 3, each in triplicate.
Page 26 of 38Carcinogenesis
123456789101112131415161718192021222324252627282930313233343536373839404142434445464748495051525354555657585960
27
(F) Gene reporter assays using extracts from DU145 cells (left) and PC3 cells (right)
transiently transfected with empty vector, Dkk-3 (D3) or Cys2 (C2) and Super8xTOPFLash
or Super8xFOPFlash and renilla reporters, cultured for 24 h in 0.5% FCS medium and then
treated with 1 ng/ml TGF-β1 or vehicle for 24 h. Graphs show TOP/FOP ratios calculated
from luciferase/renilla ratios; * p < 0.05, n = 2, each in triplicate.
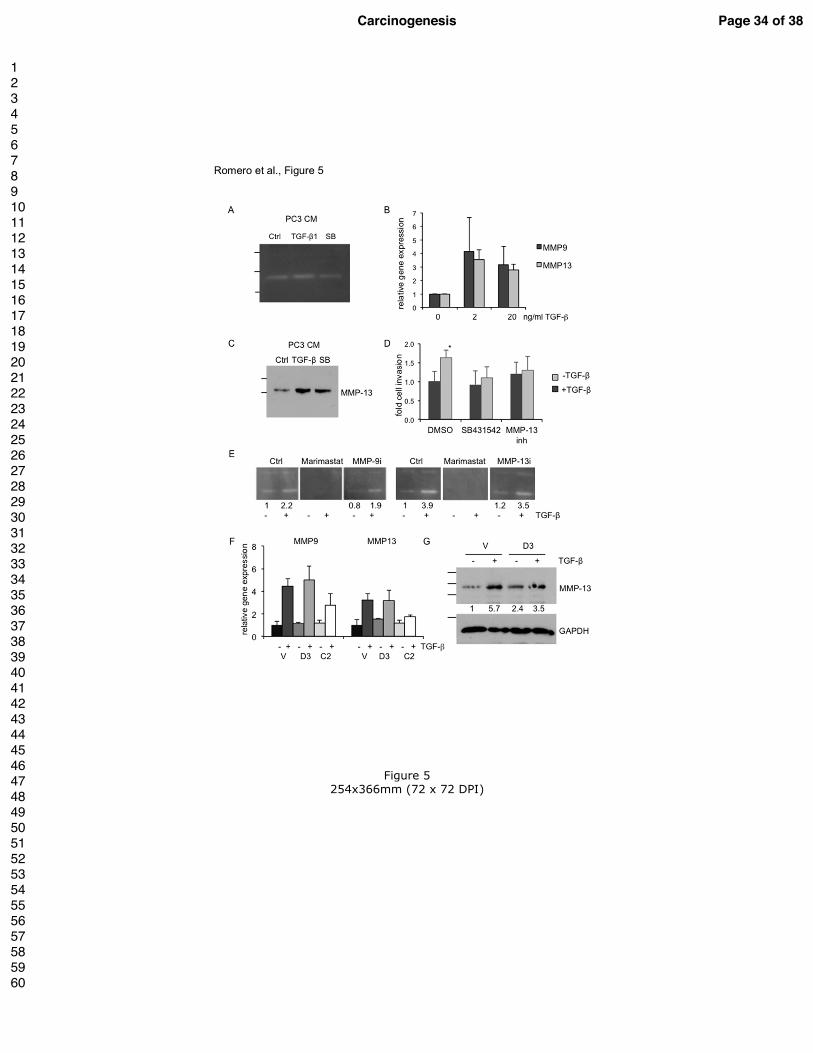
Figure 5. The Dkk-3 Cys2 domain inhibits MMP9 and MMP13 expression in prostate
cancer cells.
(A) Zymography analysis of conditioned media (CM) from PC3 cells cultured for 48 h in
serum-free media ± 1 ng/ml TGF-β1 or 1 µM SB431542 (SB). A representative image from
three experiments is shown. Numbers on the left indicate the positions of molecular mass
markers (80, 58 and 46 kDa).
(B) qPCR analysis of MMP9 and MMP13 mRNA expression in PC3 cell lines treated with
vehicle (-) or 20 ng/ml TGF-β1 (+) for 24 h.
(C) Anti-MMP-13 western blot of CM from PC3 cells cultured for 48 h in serum-free media
with vehicle (Ctrl) or 1 ng/ml TGF-β1 ± 1 µM SB431542 (SB). Numbers on the left indicate
the positions of molecular mass markers (58 and 46 kDa).
(D) Transwell cell invasion assays using PC3 cells treated with 1 ng/ml TGF-β1 or an
equivalent volume of vehicle (PBS) in the presence of the TβRI inhibitor SB431542 or
MMP-13 Inhibitor for 48 h. Graph shows average and SD for 5 fields per insert. A single
experiment is shown using triplicate wells from 3 independent experiments; * p < 0.05,
Student’s t-test.
(E) Zymography analysis of conditioned media (CM) from PC3 cells cultured for 48 h in
serum-free media ± 10 ng/ml TGF-β1. Zymography was carried out in the presence of
vehicle (Ctrl), MMP-13 Inhibitor (MMP-13 i) MMP-9 Inhibitor I (MMP-9 i) and marimastat.
Representative zymograms from two of three independent experiments are shown. Numbers
show relative band intensity, measured by densitometry and normalized to Ctrl (-) in each
experiment.
(F) qPCR analysis of MMP9 and MMP13 mRNA expression in PC3 cells transfected with
empty vector (V), Dickkopf-3 (D3) and Cys2 (C2) plasmids and then treated with vehicle (-)
or 20 ng/ml TGF-β1 (+) for 24 h.
Page 27 of 38 Carcinogenesis
123456789101112131415161718192021222324252627282930313233343536373839404142434445464748495051525354555657585960
28
(G) Representative anti-MMP-13 western blot of extracts from PC3 cells transfected with
empty vector (V) or Dkk-3 expression plasmid (D3) and treated ± 10 ng/ml TGF-β1 for 24 h.
The blot was reprobed for GAPDH as a loading control. Numbers on the left indicate the
positions of molecular mass markers (58, 46 and 32 kDa and 46 and 32 kDa). Numbers show
MMP-13/GAPDH band intensity measured by densitometry analysis, normalized to V (-).
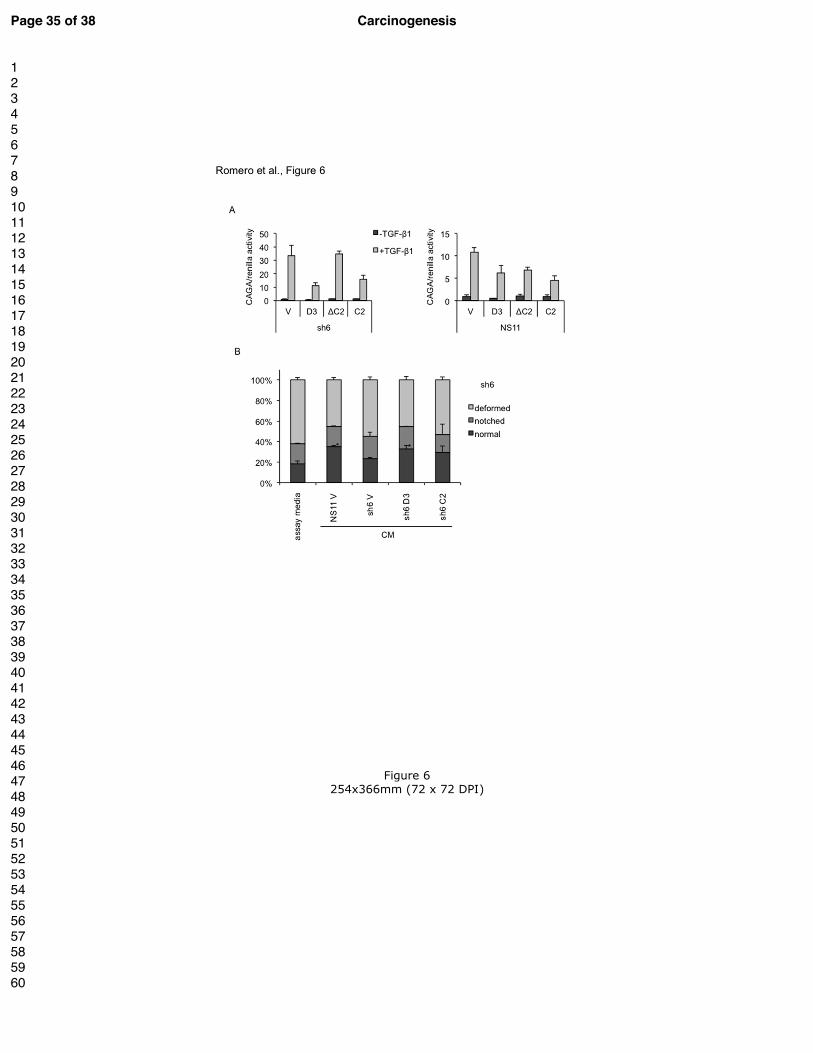
Figure 6. Effects of the Dkk-3 Cys2 domain on the TGF-β signaling response in RWPE-
1 cells
(A) Gene reporter assays using extracts from sh6 and NS11 cells transfected with empty
vector (V), Dkk-3 (D3), delta-Cys2 (∆C2) and Cys2 (C2), together with CAGA12-luciferase
and renilla reporters and treated with 100 pg/ml TGF-β1 or PBS as a control for 24 h. Graph
shows luciferase/renilla ratio normalized to control empty vector cells from a representative
experiment carried out in triplicate wells.
(B) Quantitation of acinar morphogenesis assay results at 6 days from sh6 cells treated with
assay medium alone or assay medium diluted 1:1 with CM from NS11 cells or sh6 cells
transfected with empty vector (V) or sh6 cells transfected with Dkk-3 (D3) or Cys2 (C2)
expression plasmids. NS11 CM and sh6 D3 CM significantly increased the proportion of
normal acini compared to assay media alone (p < 0.05 Students t test).
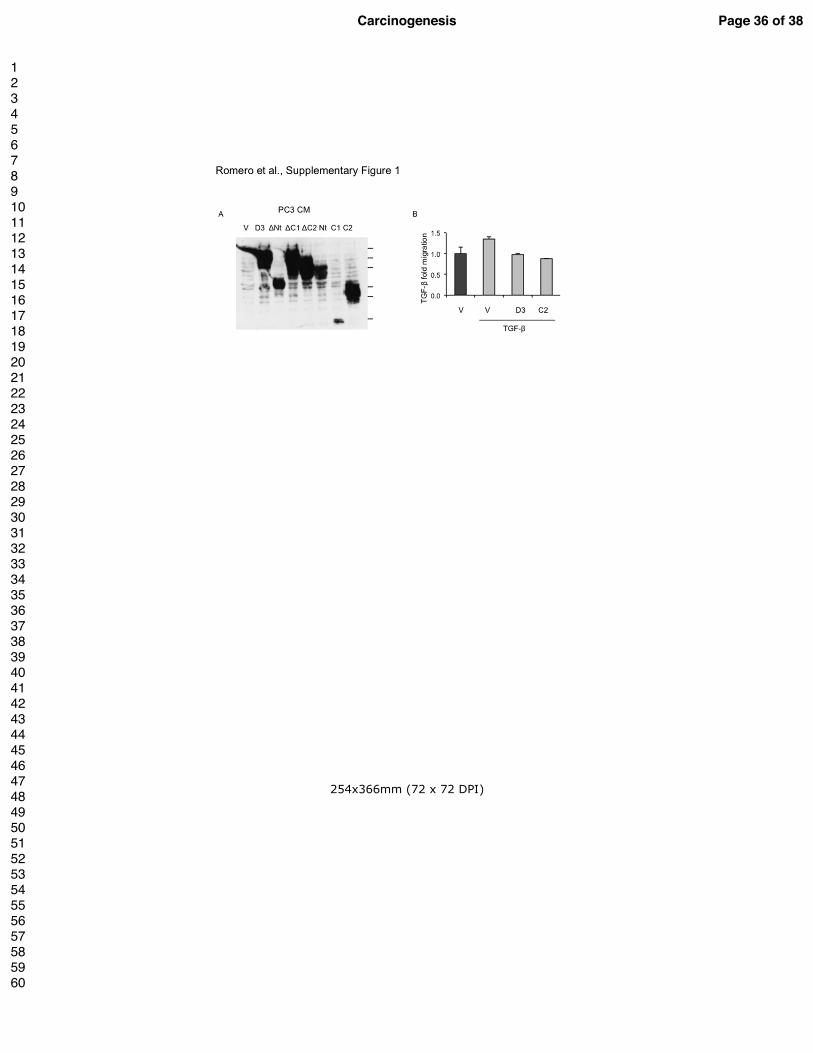
Supplementary Figure 1.
(A) Anti-Dkk-3 western blot of concentrated CM from PC3 cells transiently transfected with
the indicated expression constructs. The positions of molecular mass markers are indicated on
the right (80, 58, 46, 30, 25 and 17 kDa).
(B) Transwell cell migration assays using PC3 cells treated with 1 ng/ml TGF-β1 or an
equivalent volume of vehicle (PBS) in the presence of conditioned media from parallel
cultures of PC3 cells transfected with vector (V), Dkk-3 expression plasmid (D3) or the Dkk-
3 Cys2 domain (C2) for 24 h. Pictures were taken and migrated cells counted; graph shows
average and SD for 5 fields per insert.
Supplementary Figure 2.
Immunocytochemistry of PC3 and DU145 cells transiently transfected with the indicated
constructs for 24 h and stained for Dkk-3 (green) and nuclei (DAPI, blue).
Page 28 of 38Carcinogenesis
123456789101112131415161718192021222324252627282930313233343536373839404142434445464748495051525354555657585960
29
Supplementary Figure 3.
Gene reporter assays using extracts from DU145 cells (left) and PC3 cells (right) transiently
transfected with empty vector, Dkk-3 (D3) or Cys2 (C2), pTK renilla and either
Super8xTOPFlash (A), Super8xFOPFLash (B), ATF-2-luciferase (C) or NFkB-luciferase (D)
and cultured for 24 h in 0.5% FCS medium and then treated with 1 ng/ml TGF-β1 or vehicle
for 24 h. Graphs show luciferase/renilla ratios (in B values are normalized to empty vector
control cells) from representative experiments carried out in triplicate, n=2.
Page 29 of 38 Carcinogenesis
123456789101112131415161718192021222324252627282930313233343536373839404142434445464748495051525354555657585960
For Peer Review
Figure 1 264x382mm (72 x 72 DPI)
Page 30 of 38Carcinogenesis
123456789101112131415161718192021222324252627282930313233343536373839404142434445464748495051525354555657585960
For Peer Review
Figure 2 264x382mm (72 x 72 DPI)
Page 31 of 38 Carcinogenesis
123456789101112131415161718192021222324252627282930313233343536373839404142434445464748495051525354555657585960
For Peer Review
Figure 3 254x366mm (72 x 72 DPI)
Page 32 of 38Carcinogenesis
123456789101112131415161718192021222324252627282930313233343536373839404142434445464748495051525354555657585960
For Peer Review
Figure 4 264x382mm (72 x 72 DPI)
Page 33 of 38 Carcinogenesis
123456789101112131415161718192021222324252627282930313233343536373839404142434445464748495051525354555657585960
For Peer Review
Figure 5
254x366mm (72 x 72 DPI)
Page 34 of 38Carcinogenesis
123456789101112131415161718192021222324252627282930313233343536373839404142434445464748495051525354555657585960
For Peer Review
Figure 6 254x366mm (72 x 72 DPI)
Page 35 of 38 Carcinogenesis
123456789101112131415161718192021222324252627282930313233343536373839404142434445464748495051525354555657585960
For Peer Review
254x366mm (72 x 72 DPI)
Page 36 of 38Carcinogenesis
123456789101112131415161718192021222324252627282930313233343536373839404142434445464748495051525354555657585960
For Peer Review
254x366mm (72 x 72 DPI)
Page 37 of 38 Carcinogenesis
123456789101112131415161718192021222324252627282930313233343536373839404142434445464748495051525354555657585960
For Peer Review
264x382mm (72 x 72 DPI)
Page 38 of 38Carcinogenesis
123456789101112131415161718192021222324252627282930313233343536373839404142434445464748495051525354555657585960