NOνA Update (part one) - Fermilabnova-docdb.fnal.gov/0003/000338/001/nova0038.pdf · • Similar...
45
NO NO ν ν A A Update (part one) : Update (part one) : 1. TASD 1. TASD (Totally Active Scintillator Detector) (Totally Active Scintillator Detector) 2. Compare TASD, Baseline, RPC 2. Compare TASD, Baseline, RPC 3. R&D status and plans 3. R&D status and plans J. Cooper June 20, 2004 @ Fermilab PAC Meeting
Transcript of NOνA Update (part one) - Fermilabnova-docdb.fnal.gov/0003/000338/001/nova0038.pdf · • Similar...
NONOννAA Update (part one) :Update (part one) :1. TASD 1. TASD (Totally Active Scintillator Detector)(Totally Active Scintillator Detector)
2. Compare TASD, Baseline, RPC 2. Compare TASD, Baseline, RPC 3. R&D status and plans3. R&D status and plans
J. CooperJune 20, 2004@ Fermilab PAC Meeting
2
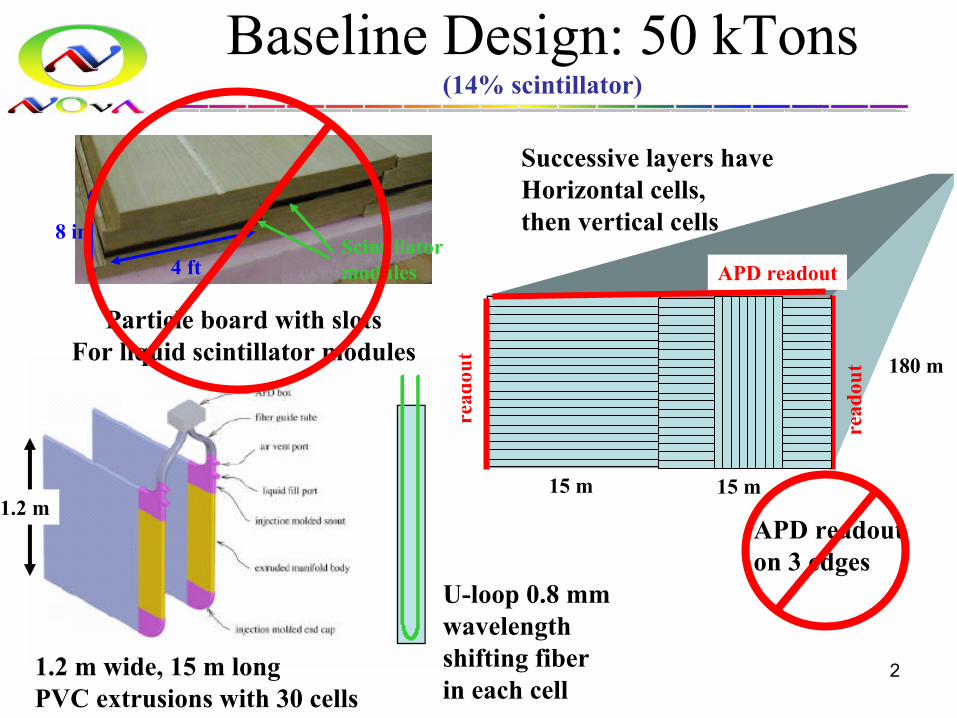
Baseline Design: 50 kTons(14% scintillator)
APD readout
read
out
read
out
15 m 15 m
15 m
Scintillatormodules4 ft
8 in
180 m
U-loop 0.8 mmwavelengthshifting fiberin each cell
1.2 m wide, 15 m long PVC extrusions with 30 cells
APD readouton 3 edges
Particle board with slotsFor liquid scintillator modules
1.2 m
Successive layers have Horizontal cells,then vertical cells
3
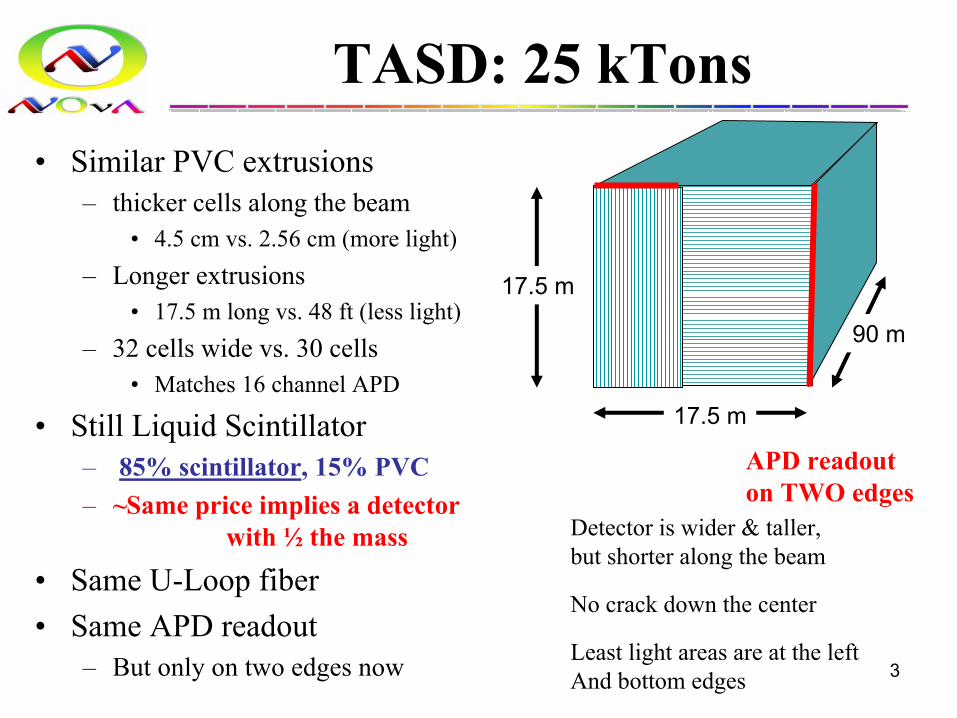
90 m
TASD: 25 kTons• Similar PVC extrusions
– thicker cells along the beam• 4.5 cm vs. 2.56 cm (more light)
– Longer extrusions• 17.5 m long vs. 48 ft (less light)
– 32 cells wide vs. 30 cells• Matches 16 channel APD
• Still Liquid Scintillator– 85% scintillator, 15% PVC– ~Same price implies a detector
with ½ the mass
• Same U-Loop fiber• Same APD readout
– But only on two edges now
APD readouton TWO edges
17.5 m
17.5 m
Detector is wider & taller, but shorter along the beam
No crack down the center
Least light areas are at the leftAnd bottom edges
4
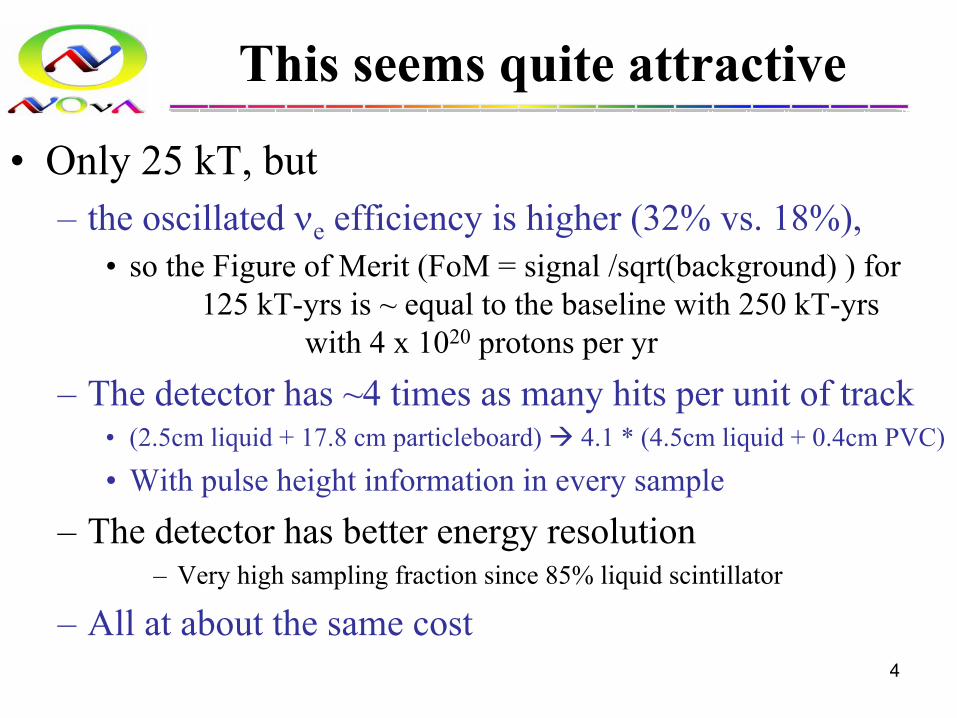
This seems quite attractive
• Only 25 kT, but – the oscillated νe efficiency is higher (32% vs. 18%),
• so the Figure of Merit (FoM = signal /sqrt(background) ) for 125 kT-yrs is ~ equal to the baseline with 250 kT-yrs
with 4 x 10²⁰ protons per yr
– The detector has ~4 times as many hits per unit of track• (2.5cm liquid + 17.8 cm particleboard) 4.1 * (4.5cm liquid + 0.4cm PVC)
• With pulse height information in every sample
– The detector has better energy resolution– Very high sampling fraction since 85% liquid scintillator
– All at about the same cost
5
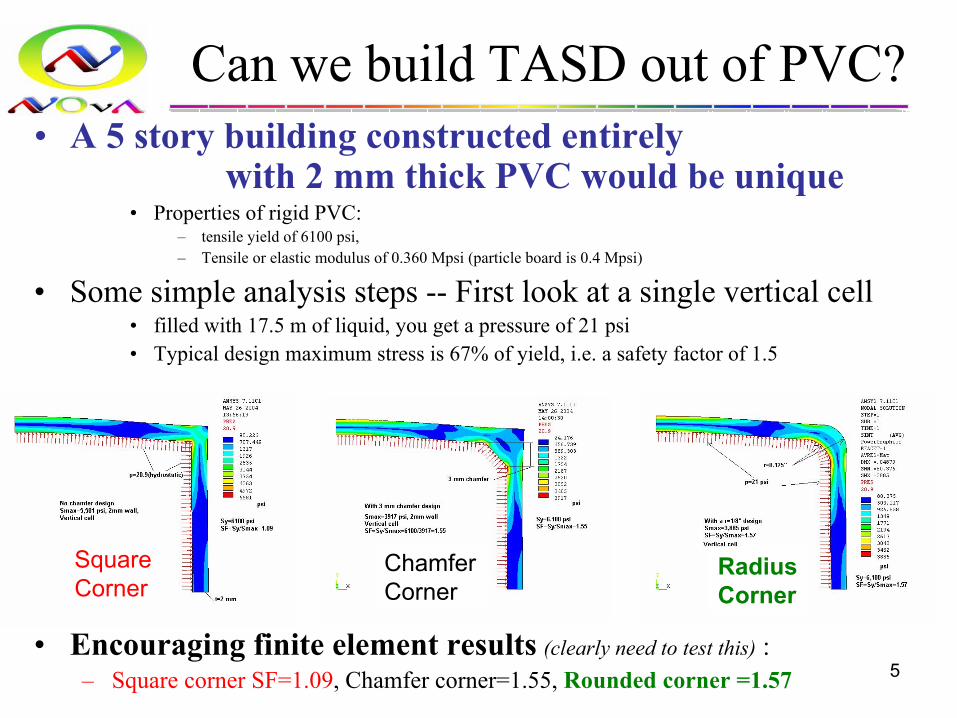
• A 5 story building constructed entirely with 2 mm thick PVC would be unique
• Properties of rigid PVC: – tensile yield of 6100 psi, – Tensile or elastic modulus of 0.360 Mpsi (particle board is 0.4 Mpsi)
• Some simple analysis steps -- First look at a single vertical cell • filled with 17.5 m of liquid, you get a pressure of 21 psi• Typical design maximum stress is 67% of yield, i.e. a safety factor of 1.5
• Encouraging finite element results (clearly need to test this) : – Square corner SF=1.09, Chamfer corner=1.55, Rounded corner =1.57
Can we build TASD out of PVC?
SquareCorner
ChamferCorner
RadiusCorner
6
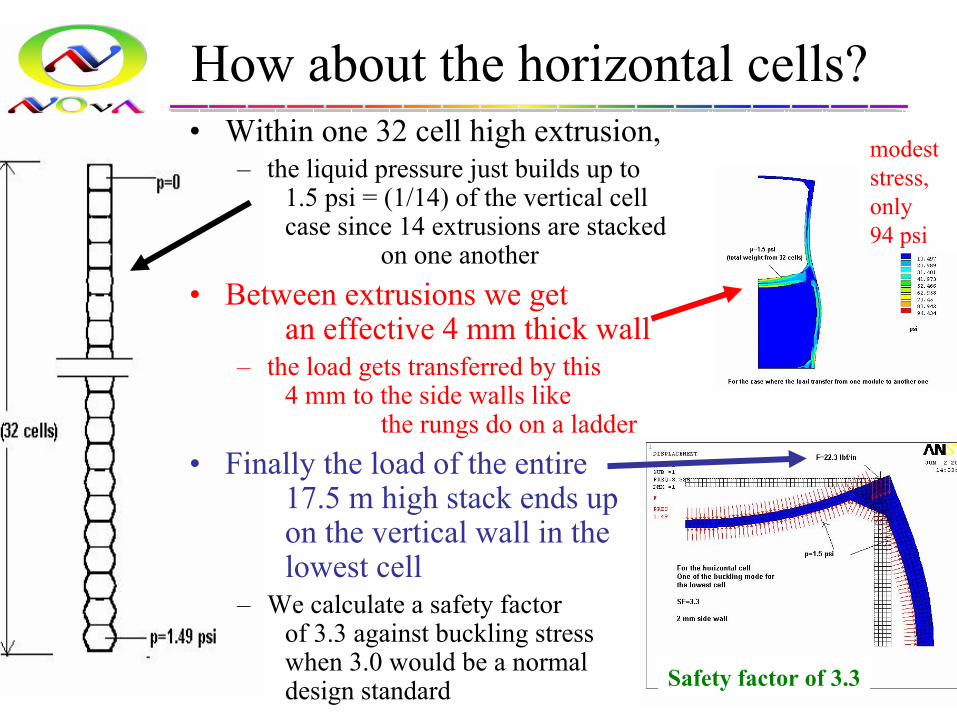
How about the horizontal cells?• Within one 32 cell high extrusion,
– the liquid pressure just builds up to 1.5 psi = (1/14) of the vertical cell case since 14 extrusions are stacked
on one another• Between extrusions we get
an effective 4 mm thick wall– the load gets transferred by this
4 mm to the side walls like the rungs do on a ladder
• Finally the load of the entire 17.5 m high stack ends up on the vertical wall in the lowest cell
– We calculate a safety factor of 3.3 against buckling stress when 3.0 would be a normal design standard
modest stress,only 94 psi
Safety factor of 3.3
7
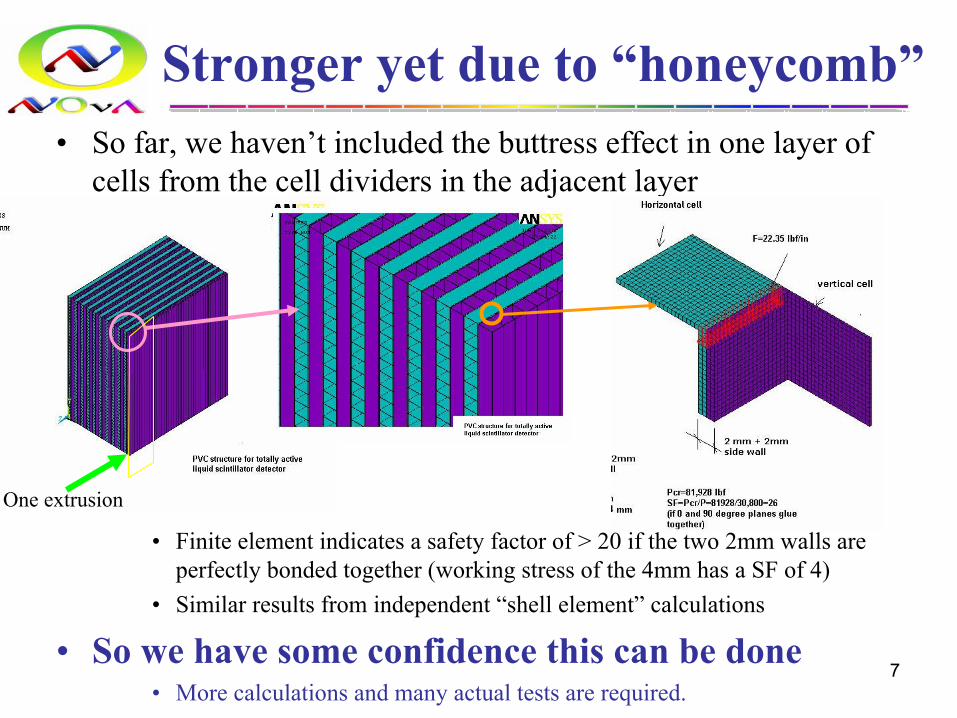
• So far, we haven’t included the buttress effect in one layer of cells from the cell dividers in the adjacent layer
• Finite element indicates a safety factor of > 20 if the two 2mm walls are perfectly bonded together (working stress of the 4mm has a SF of 4)
• Similar results from independent “shell element” calculations
• So we have some confidence this can be done• More calculations and many actual tests are required.
Stronger yet due to “honeycomb”
One extrusion
8
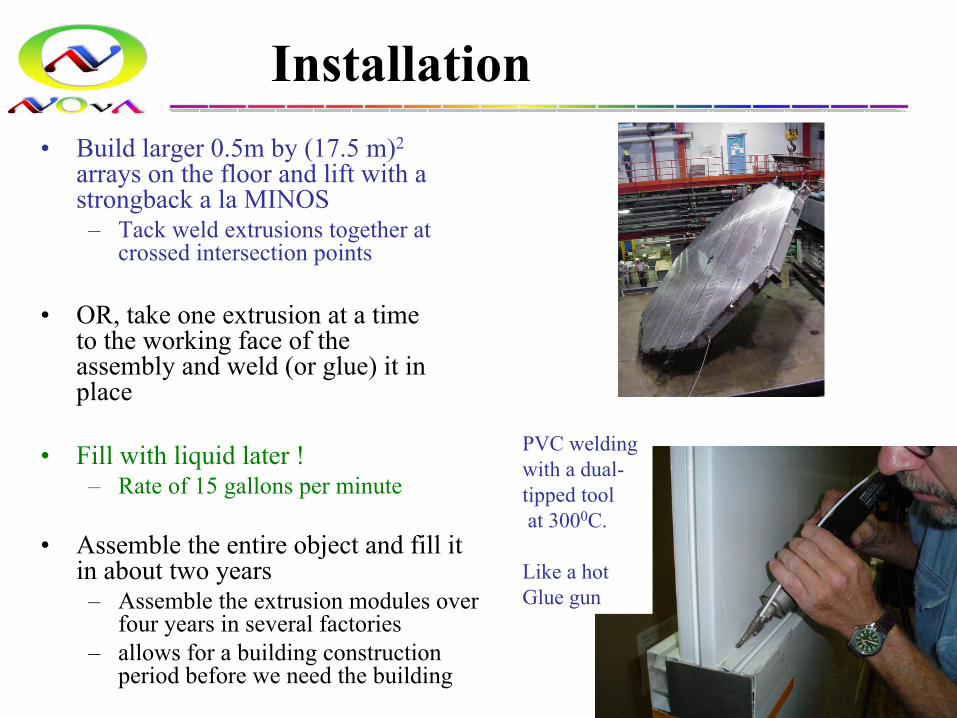
• Build larger 0.5m by (17.5 m)2
arrays on the floor and lift with a strongback a la MINOS– Tack weld extrusions together at
crossed intersection points
• OR, take one extrusion at a time to the working face of the assembly and weld (or glue) it in place
• Fill with liquid later !– Rate of 15 gallons per minute
• Assemble the entire object and fill it in about two years– Assemble the extrusion modules over
four years in several factories – allows for a building construction
period before we need the building
Installation
PVC welding with a dual-tipped toolat 3000C.
Like a hot Glue gun
9
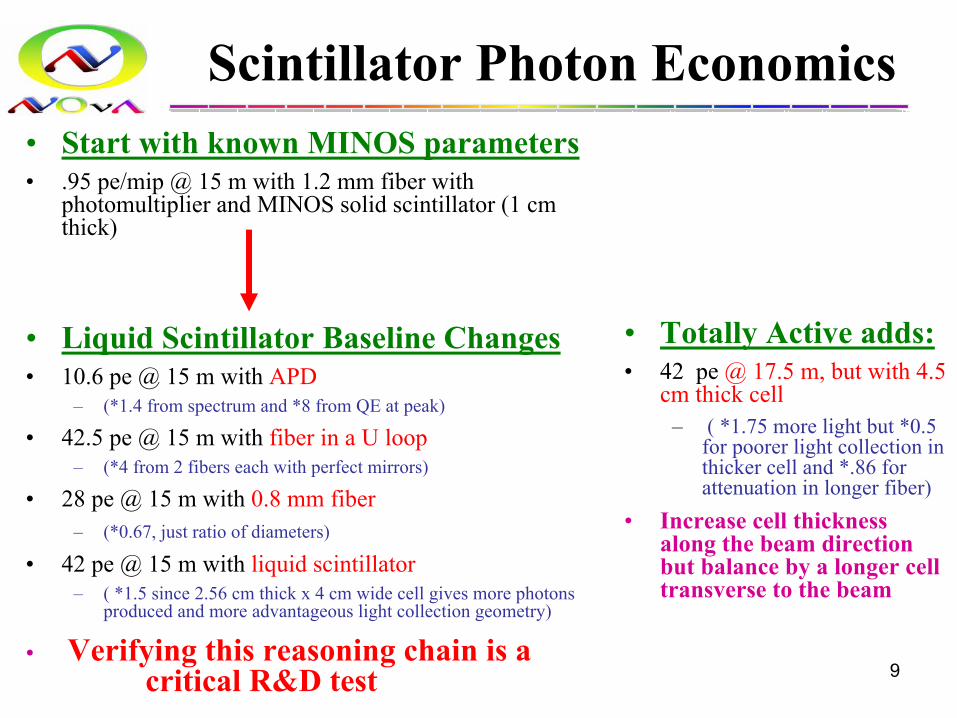
Scintillator Photon Economics• Start with known MINOS parameters• .95 pe/mip @ 15 m with 1.2 mm fiber with
photomultiplier and MINOS solid scintillator (1 cm thick)
• Liquid Scintillator Baseline Changes• 10.6 pe @ 15 m with APD
– (*1.4 from spectrum and *8 from QE at peak)
• 42.5 pe @ 15 m with fiber in a U loop– (*4 from 2 fibers each with perfect mirrors)
• 28 pe @ 15 m with 0.8 mm fiber– (*0.67, just ratio of diameters)
• 42 pe @ 15 m with liquid scintillator– ( *1.5 since 2.56 cm thick x 4 cm wide cell gives more photons
produced and more advantageous light collection geometry)
• Verifying this reasoning chain is a critical R&D test
• Totally Active adds:• 42 pe @ 17.5 m, but with 4.5
cm thick cell– ( *1.75 more light but *0.5
for poorer light collection in thicker cell and *.86 for attenuation in longer fiber)
• Increase cell thickness along the beam direction but balance by a longer cell transverse to the beam
10
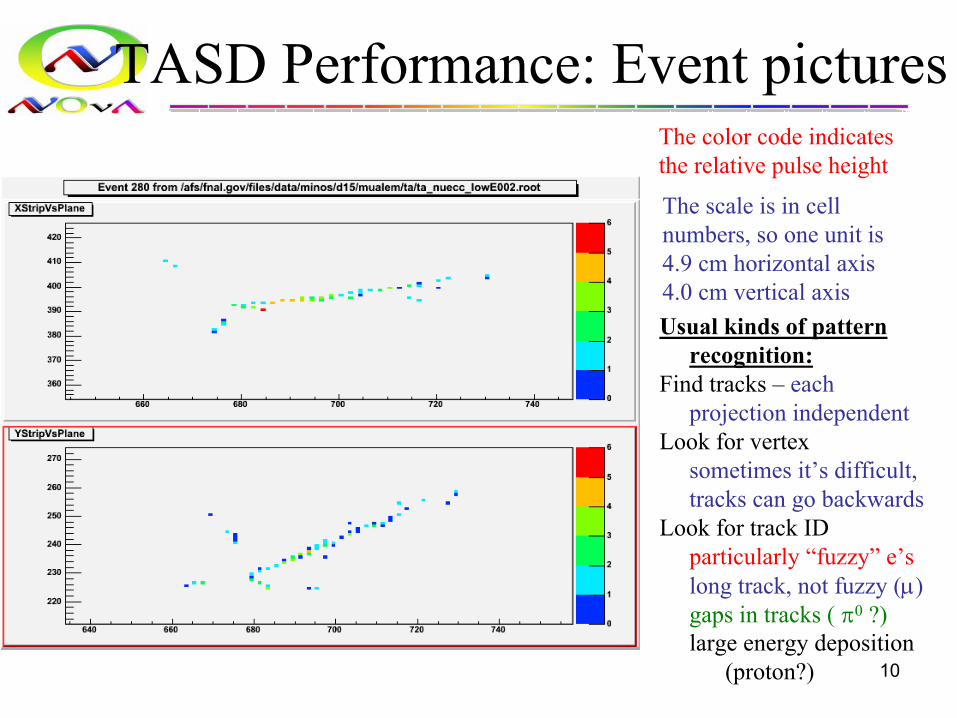
TASD Performance: Event picturesThe color code indicates the relative pulse height
The scale is in cell numbers, so one unit is4.9 cm horizontal axis4.0 cm vertical axisUsual kinds of pattern
recognition:Find tracks – each
projection independentLook for vertex
sometimes it’s difficult,tracks can go backwards
Look for track IDparticularly “fuzzy” e’slong track, not fuzzy (µ)gaps in tracks ( π0 ?)large energy deposition
(proton?)
11
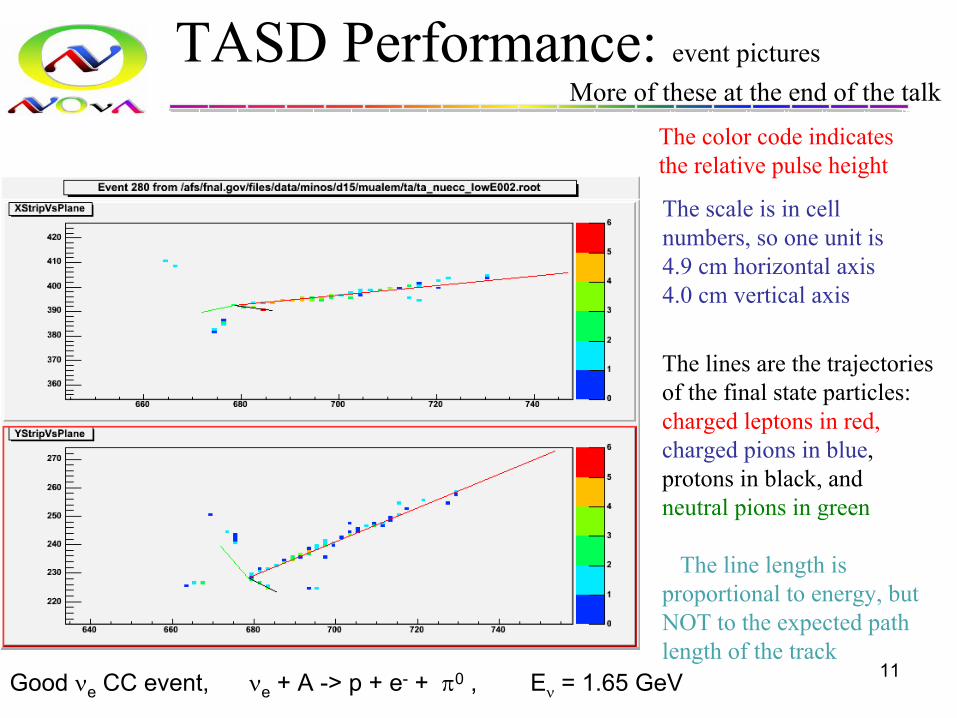
TASD Performance: event picturesMore of these at the end of the talk
Good νe CC event, νe + A -> p + e- + π0 , Eν = 1.65 GeV
The lines are the trajectories of the final state particles: charged leptons in red,charged pions in blue, protons in black, and neutral pions in green
The line length is proportional to energy, but NOT to the expected path length of the track
The color code indicates the relative pulse height
The scale is in cell numbers, so one unit is4.9 cm horizontal axis4.0 cm vertical axis
12
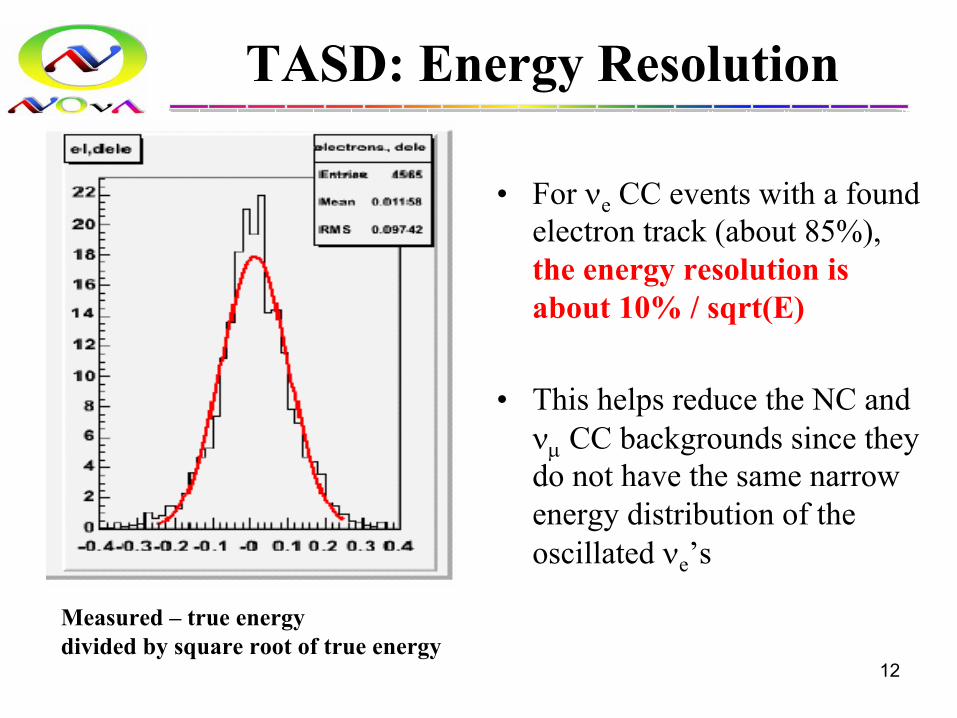
TASD: Energy Resolution
• For νe CC events with a found electron track (about 85%), the energy resolution is about 10% / sqrt(E)
• This helps reduce the NC and νµ CC backgrounds since they do not have the same narrow energy distribution of the oscillated νe’s
Measured – true energy divided by square root of true energy
13
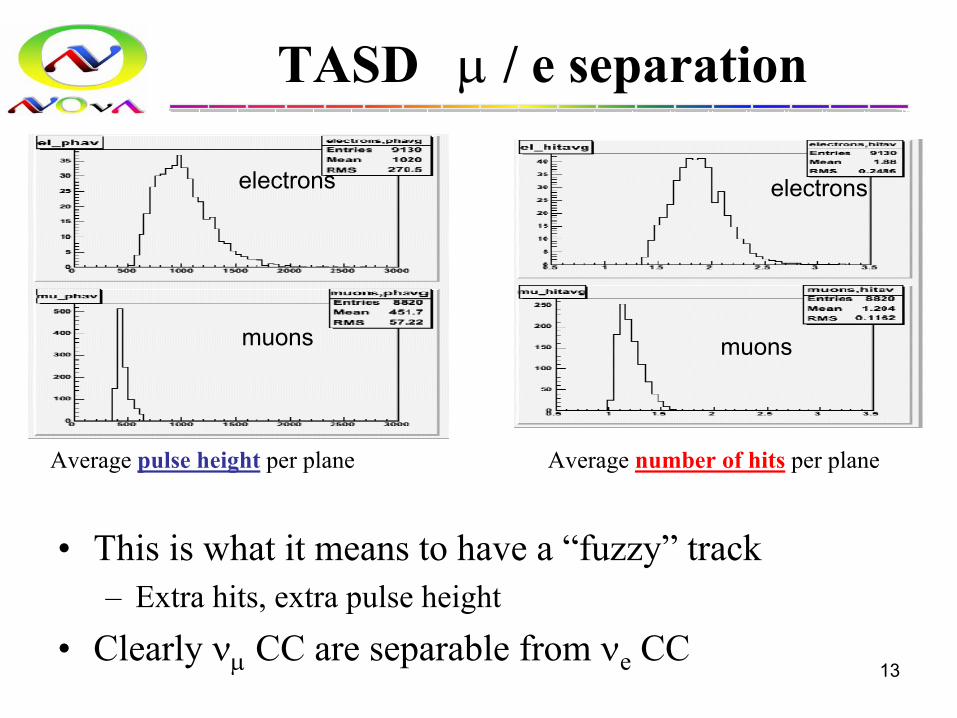
TASD µ / e separation
• This is what it means to have a “fuzzy” track– Extra hits, extra pulse height
• Clearly νµ CC are separable from νe CC
Average pulse height per plane Average number of hits per plane
electrons
muons
electrons
muons
14
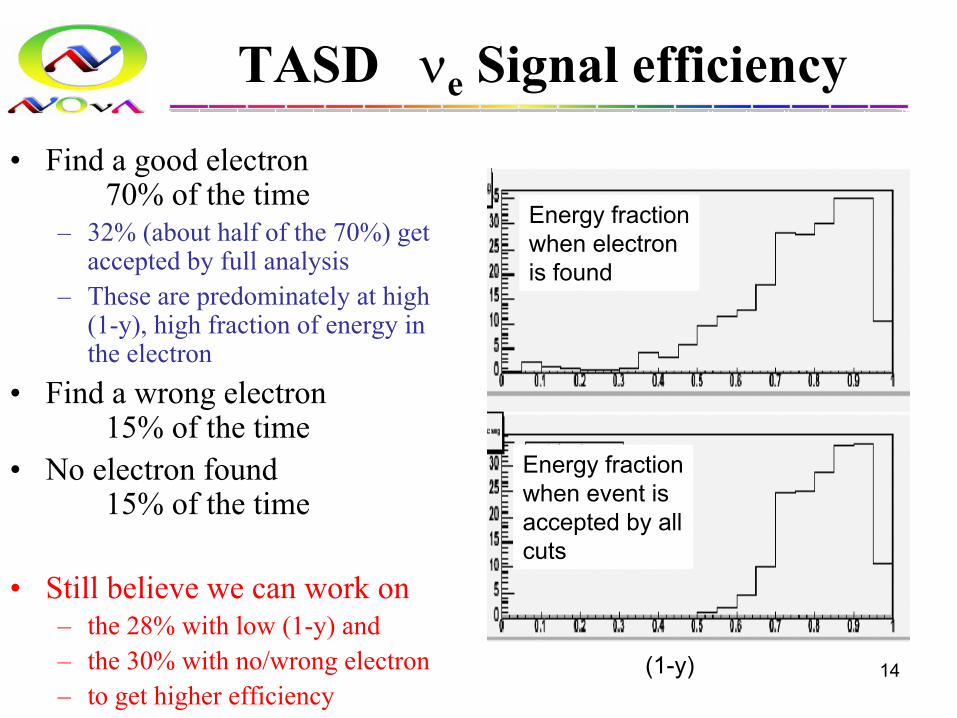
TASD νe Signal efficiency
• Find a good electron 70% of the time
– 32% (about half of the 70%) get accepted by full analysis
– These are predominately at high (1-y), high fraction of energy in the electron
• Find a wrong electron 15% of the time
• No electron found 15% of the time
• Still believe we can work on – the 28% with low (1-y) and – the 30% with no/wrong electron – to get higher efficiency
(1-y)
Energy fractionwhen electronis found
Energy fractionwhen event isaccepted by allcuts
15
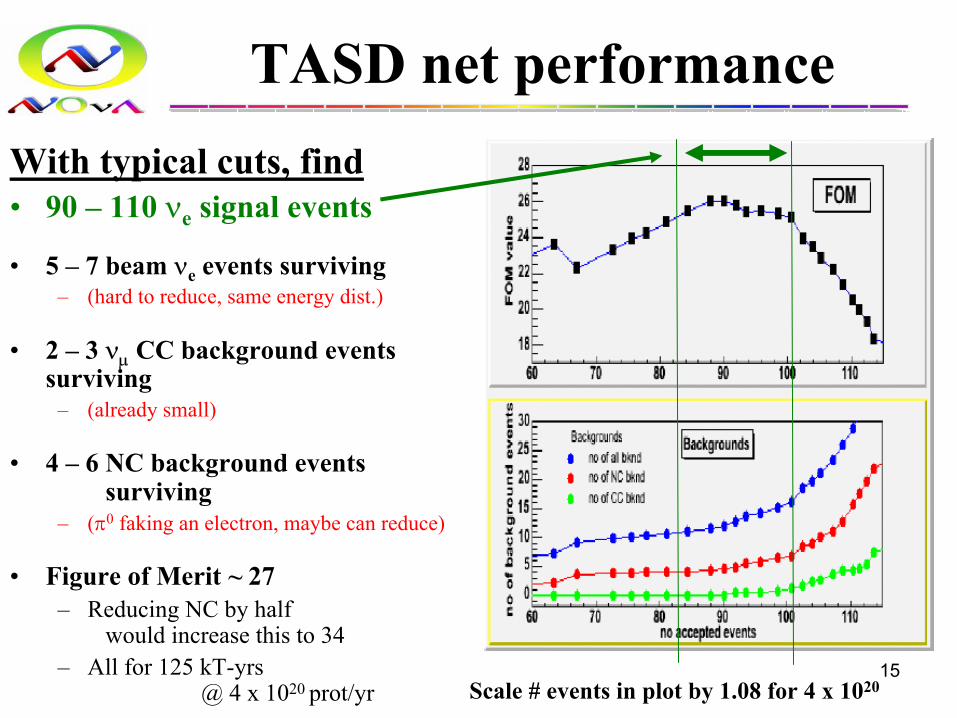
TASD net performanceWith typical cuts, find• 90 – 110 νe signal events
• 5 – 7 beam νe events surviving– (hard to reduce, same energy dist.)
• 2 – 3 νµ CC background events surviving
– (already small)
• 4 – 6 NC background events surviving
– (π0 faking an electron, maybe can reduce)
• Figure of Merit ~ 27– Reducing NC by half
would increase this to 34– All for 125 kT-yrs
@ 4 x 10²⁰ prot/yr Scale # events in plot by 1.08 for 4 x 10²⁰
16
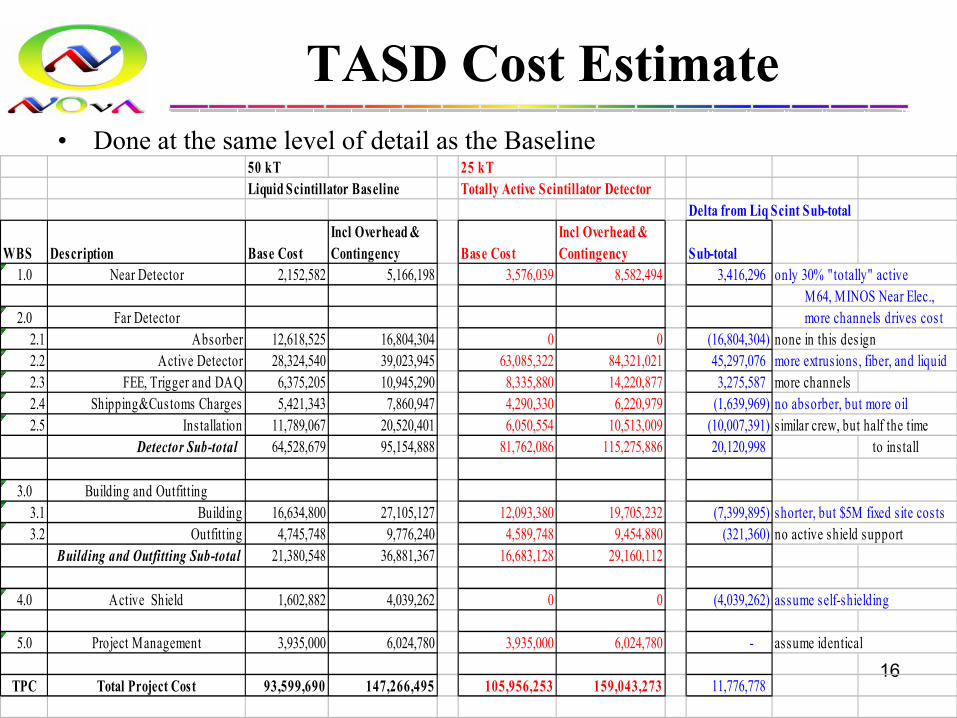
TASD Cost Estimate• Done at the same level of detail as the Baseline
50 kT 25 kTLiquid Scintillator Baseline Totally Active Scintillator Detector
Delta from Liq Scint Sub-total
WBS Description Base CostIncl Overhead & Contingency Base Cost
Incl Overhead & Contingency Sub-total
1.0 Near Detector 2,152,582 5,166,198 3,576,039 8,582,494 3,416,296 only 30% "totally" active M64, MINOS Near Elec.,
2.0 Far Detector more channels drives cos t2.1 Absorber 12,618,525 16,804,304 0 0 (16,804,304) none in this des ign2.2 Active Detector 28,324,540 39,023,945 63,085,322 84,321,021 45,297,076 more extrusions , fiber, and liquid2.3 FEE, Trigger and DAQ 6,375,205 10,945,290 8,335,880 14,220,877 3,275,587 more channels2.4 Shipping&Customs Charges 5,421,343 7,860,947 4,290,330 6,220,979 (1,639,969) no absorber, but more oil2.5 Installation 11,789,067 20,520,401 6,050,554 10,513,009 (10,007,391) s imilar crew, but half the time
Detector Sub-total 64,528,679 95,154,888 81,762,086 115,275,886 20,120,998 to ins tall
3.0 Building and Outfitting3.1 Building 16,634,800 27,105,127 12,093,380 19,705,232 (7,399,895) shorter, but $5M fixed s ite cos ts3.2 Outfitting 4,745,748 9,776,240 4,589,748 9,454,880 (321,360) no active shield support
Building and Outfitting Sub-total 21,380,548 36,881,367 16,683,128 29,160,112
4.0 Active Shield 1,602,882 4,039,262 0 0 (4,039,262) assume self-shielding
5.0 Project Management 3,935,000 6,024,780 3,935,000 6,024,780 - assume identical
TPC Total Project Cost 93,599,690 147,266,495 105,956,253 159,043,273 11,776,778
17
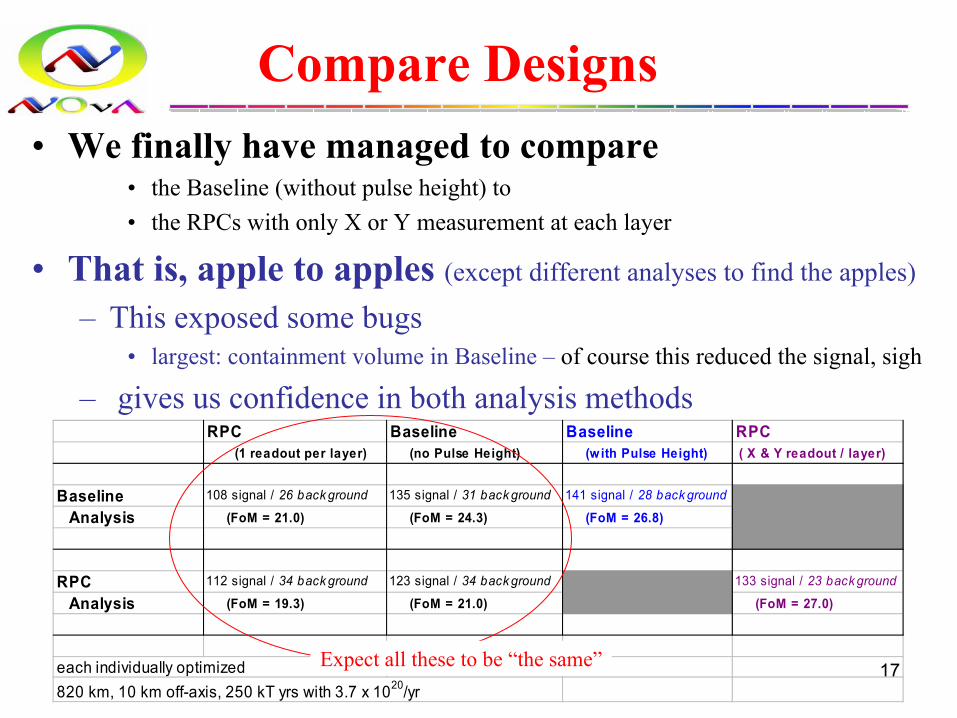
Compare Designs• We finally have managed to compare
• the Baseline (without pulse height) to • the RPCs with only X or Y measurement at each layer
• That is, apple to apples (except different analyses to find the apples)
– This exposed some bugs • largest: containment volume in Baseline – of course this reduced the signal, sigh
– gives us confidence in both analysis methodsRPC Baseline Baseline RPC (1 readout per layer) (no Pulse Height) (w ith Pulse Height) ( X & Y readout / layer)
Baseline 108 signal / 26 back ground 135 signal / 31 back ground 141 signal / 28 back ground
Analysis (FoM = 21.0) (FoM = 24.3) (FoM = 26.8)
RPC 112 signal / 34 back ground 123 signal / 34 back ground 133 signal / 23 back ground
Analysis (FoM = 19.3) (FoM = 21.0) (FoM = 27.0)
each individually optimized820 km, 10 km off-axis, 250 kT yrs with 3.7 x 10²⁰/yr
Expect all these to be “the same”
18
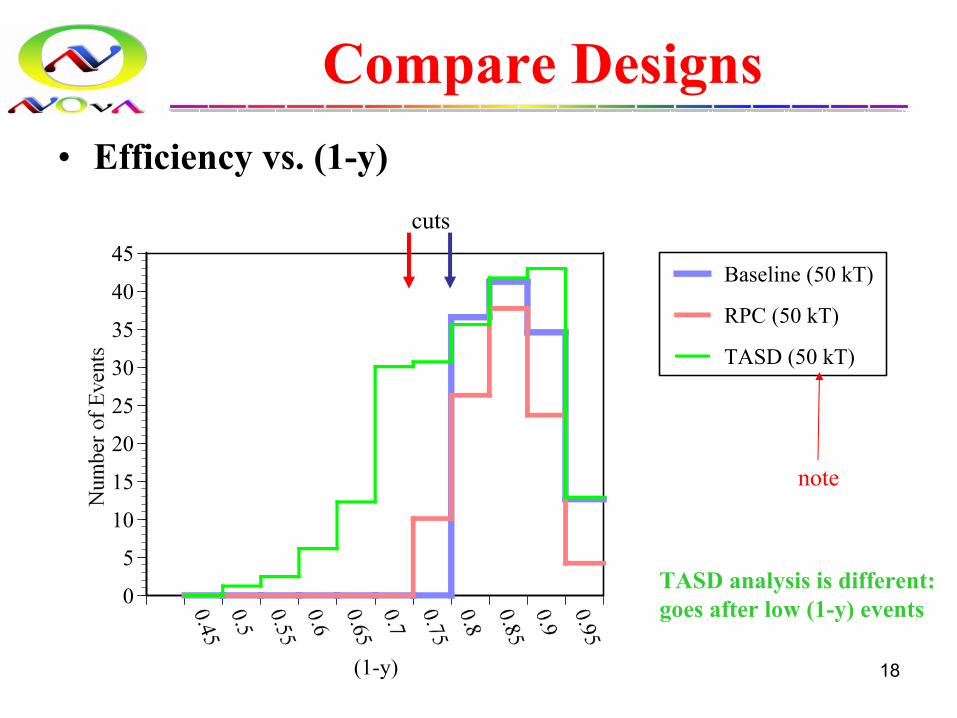
Compare Designs• Efficiency vs. (1-y)
0
5
10
15
20
25
30
35
40
45
(1-y)
Baseline (50 kT)
RPC (50 kT)
TASD (50 kT)
note
cuts
TASD analysis is different:goes after low (1-y) events
19
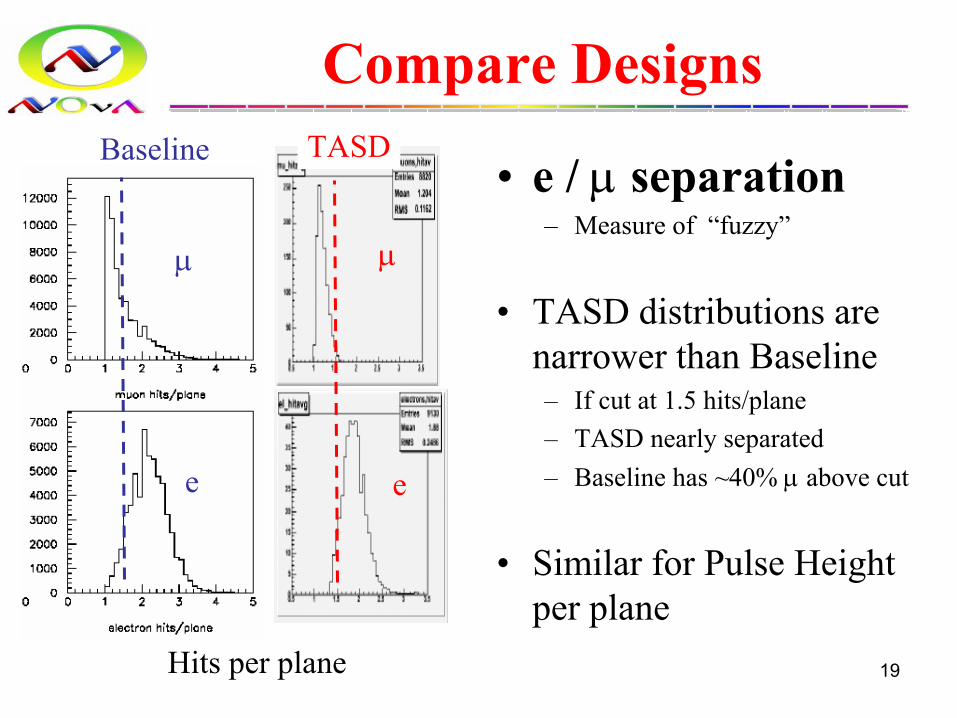
Compare Designs
• e / µ separation– Measure of “fuzzy”
• TASD distributions are narrower than Baseline– If cut at 1.5 hits/plane– TASD nearly separated– Baseline has ~40% µ above cut
• Similar for Pulse Height per plane
Hits per plane
Baseline TASD
e e
µ µ
20
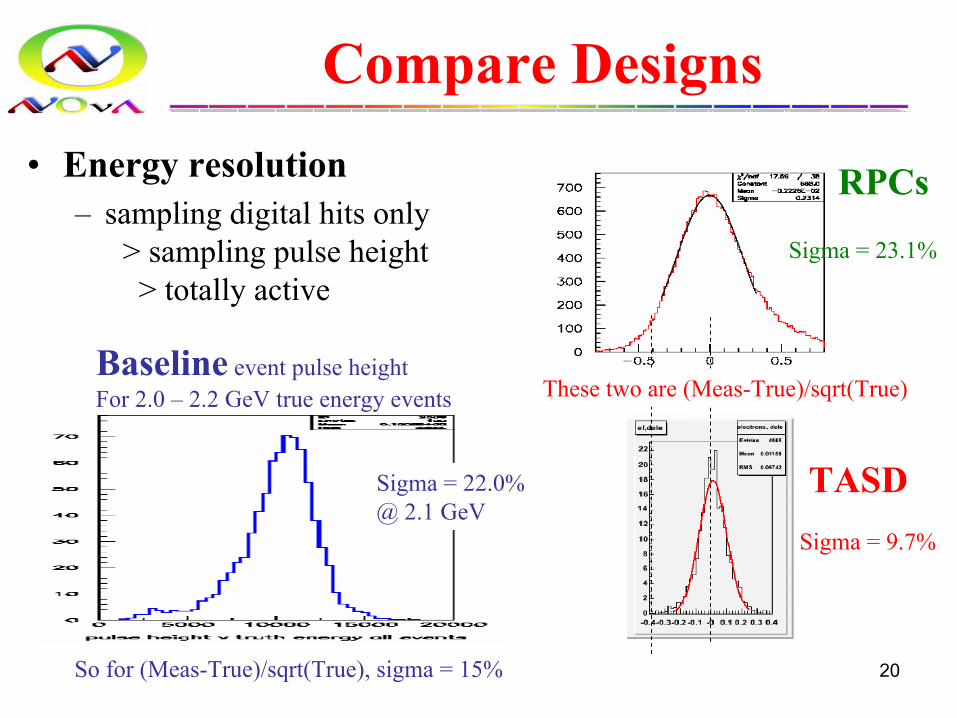
Compare Designs• Energy resolution
– sampling digital hits only > sampling pulse height > totally active
Baseline event pulse heightFor 2.0 – 2.2 GeV true energy events
Sigma = 22.0%@ 2.1 GeV
Sigma = 23.1%
RPCs
TASDSigma = 9.7%
So for (Meas-True)/sqrt(True), sigma = 15%
These two are (Meas-True)/sqrt(True)
21
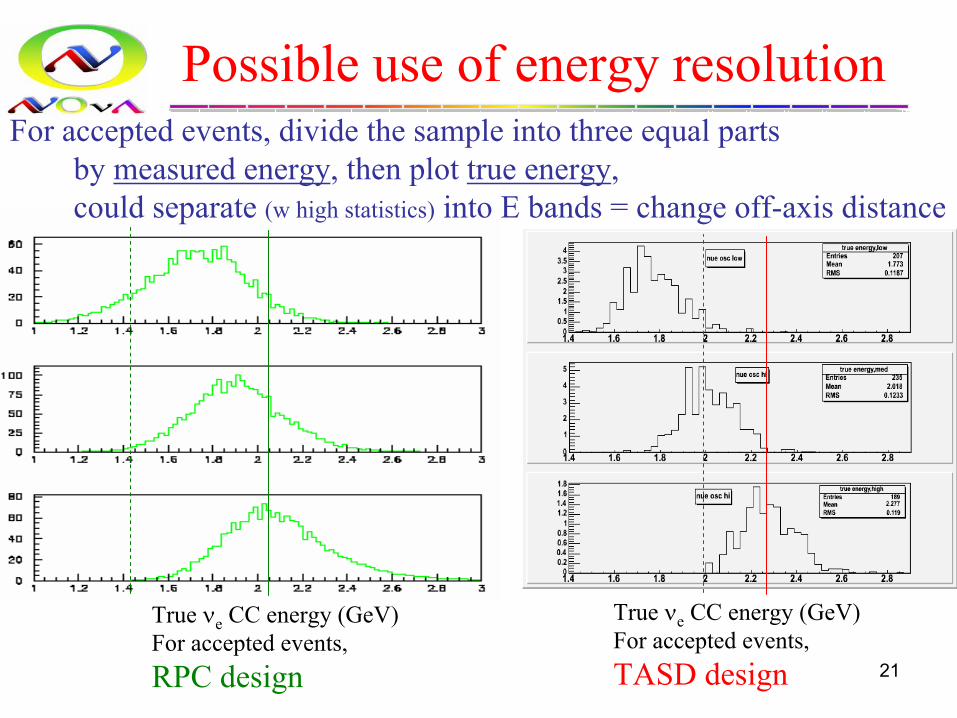
Possible use of energy resolution
True νe CC energy (GeV)For accepted events,RPC design
True νe CC energy (GeV)For accepted events,TASD design
For accepted events, divide the sample into three equal parts by measured energy, then plot true energy, could separate (w high statistics) into E bands = change off-axis distance
22
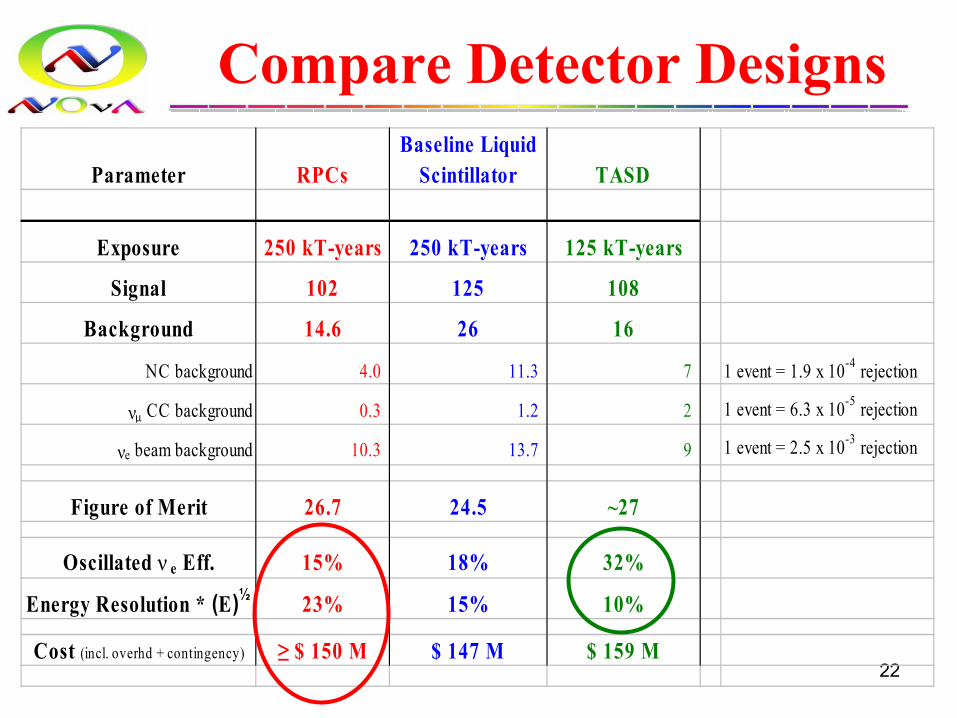
Parameter RPCsBaseline Liquid
Scintillator TASD
Exposure 250 kT-years 250 kT-years 125 kT-years
Signal 102 125 108
Background 14.6 26 16
NC background 4.0 11.3 7 1 event = 1.9 x 10⁻⁴ rejection
νµ CC background 0.3 1.2 2 1 event = 6.3 x 10⁻⁵ rejection
νe beam background 10.3 13.7 9 1 event = 2.5 x 10⁻³ rejection
Figure of Merit 26.7 24.5 ~27
Oscillated ν e Eff. 15% 18% 32%
Energy Resolution * (E)½ 23% 15% 10%
Cost (incl. overhd + contingency) ≥ $ 150 M $ 147 M $ 159 M
Compare Detector Designs
23
R&D Status, Plans• Our R&D efforts are now totally focused on liquid
scintillator designs– Not an official technology decision yet (pending liquid design R&D),
but the collaboration is converging– RPC and solid scintillator are backups on the R&D back burner
• 3 Main efforts– Understand the light output from long liquid scintillator cells, including
the waveshifting fiber and APD readout• More details in a moment
– Cosmic Ray Background test, overburden question• Trying now to get some MINOS solid scintillator modules and MINOS
electronics for this test– More detector simulations and analysis
• Optimize cell width & thickness• Work for higher efficiency and more background rejection• More analyses & tests of the PVC structure
24
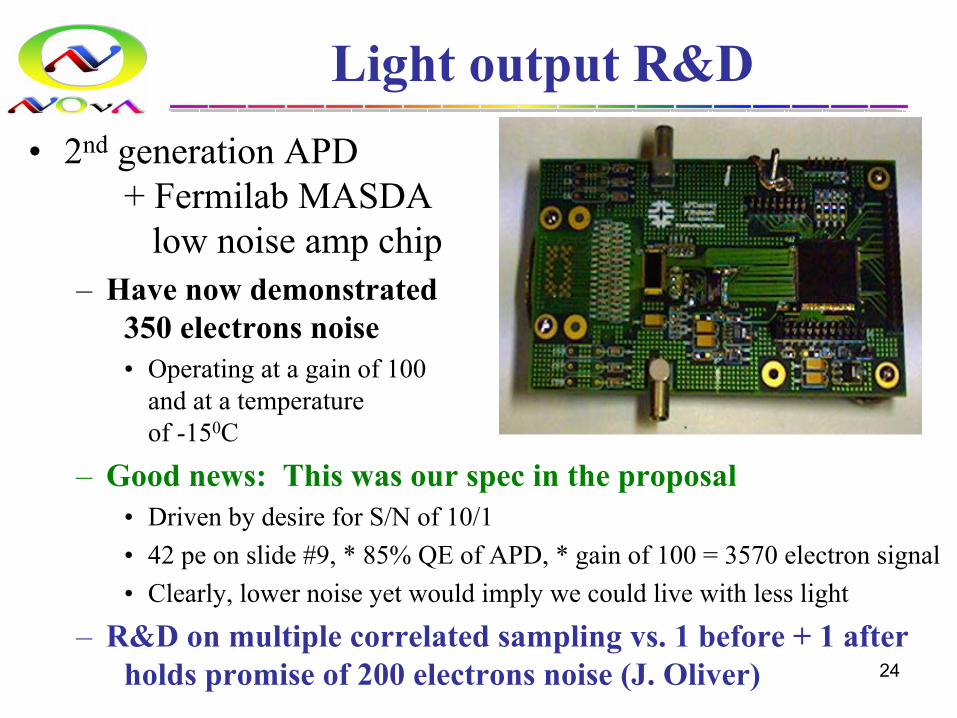
Light output R&D• 2nd generation APD
+ Fermilab MASDA low noise amp chip
– Have now demonstrated 350 electrons noise• Operating at a gain of 100
and at a temperature of -150C
– Good news: This was our spec in the proposal• Driven by desire for S/N of 10/1• 42 pe on slide #9, * 85% QE of APD, * gain of 100 = 3570 electron signal• Clearly, lower noise yet would imply we could live with less light
– R&D on multiple correlated sampling vs. 1 before + 1 after holds promise of 200 electrons noise (J. Oliver)
25
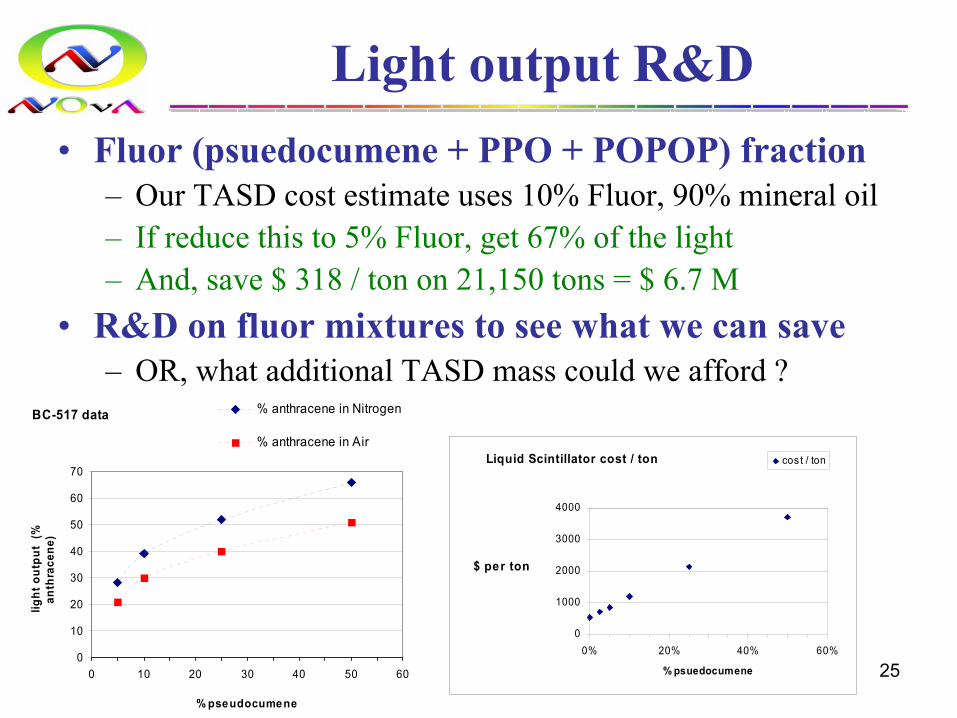
Light output R&D• Fluor (psuedocumene + PPO + POPOP) fraction
– Our TASD cost estimate uses 10% Fluor, 90% mineral oil– If reduce this to 5% Fluor, get 67% of the light– And, save $ 318 / ton on 21,150 tons = $ 6.7 M
• R&D on fluor mixtures to see what we can save– OR, what additional TASD mass could we afford ?
BC-517 data
0
10
20
30
40
50
60
70
0 10 20 30 40 50 60
% pseudocumene
light
out
put
(%
anth
race
ne)
% anthracene in Nitrogen
% anthracene in AirLiquid Scintillator cost / ton
0
1000
2000
3000
4000
0% 20% 40% 60%
% psuedocumene
$ per ton
cos t / ton
26
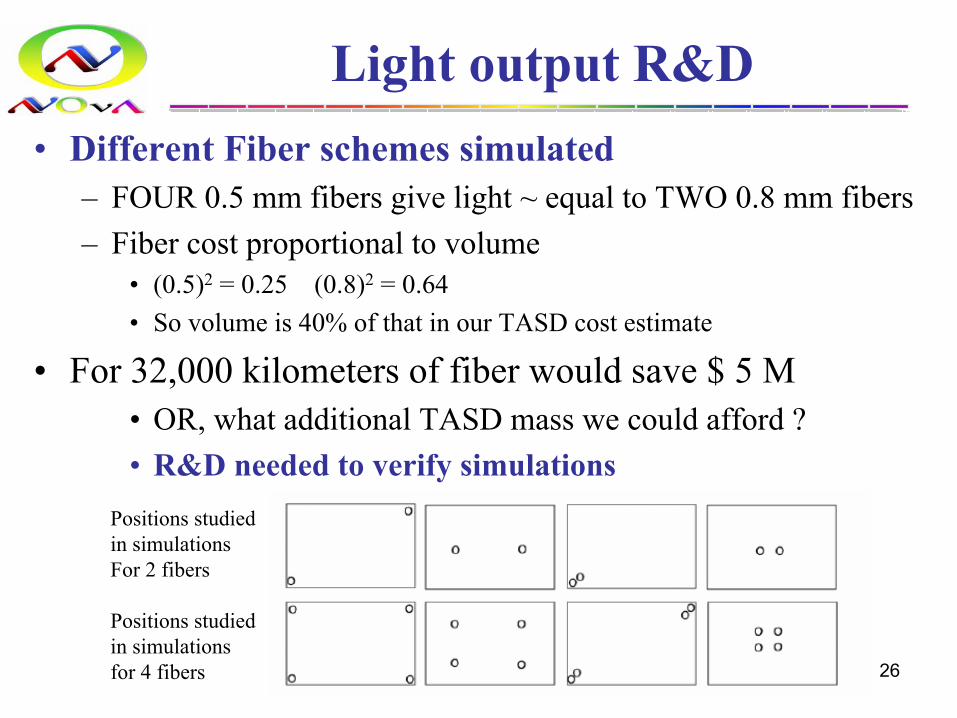
Light output R&D• Different Fiber schemes simulated
– FOUR 0.5 mm fibers give light ~ equal to TWO 0.8 mm fibers– Fiber cost proportional to volume
• (0.5)2 = 0.25 (0.8)2 = 0.64• So volume is 40% of that in our TASD cost estimate
• For 32,000 kilometers of fiber would save $ 5 M• OR, what additional TASD mass we could afford ?• R&D needed to verify simulations
Positions studiedin simulationsFor 2 fibers
Positions studiedin simulationsfor 4 fibers
27
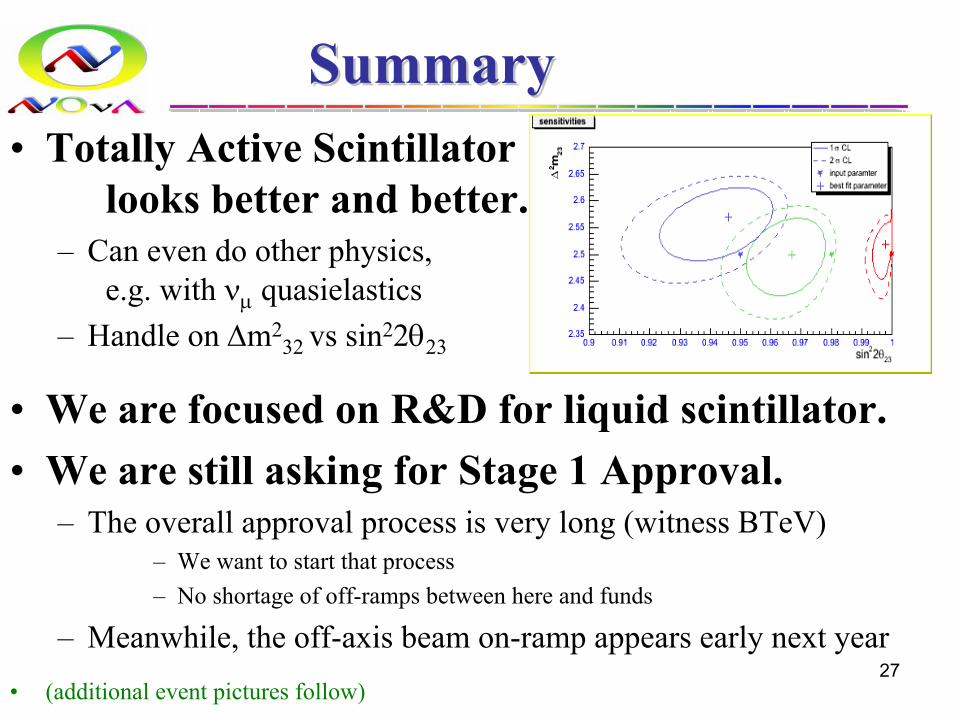
SummarySummary• Totally Active Scintillator
looks better and better.– Can even do other physics,
e.g. with νµ quasielastics– Handle on ∆m2
32 vs sin22θ23
• We are focused on R&D for liquid scintillator.• We are still asking for Stage 1 Approval.
– The overall approval process is very long (witness BTeV)– We want to start that process– No shortage of off-ramps between here and funds
– Meanwhile, the off-axis beam on-ramp appears early next year• (additional event pictures follow)
28
Additional Event Pictures
• The following slides come in pairs:– First picture is just the raw information
• So you can try your own identification
– Second picture has the event identification and tracks
29
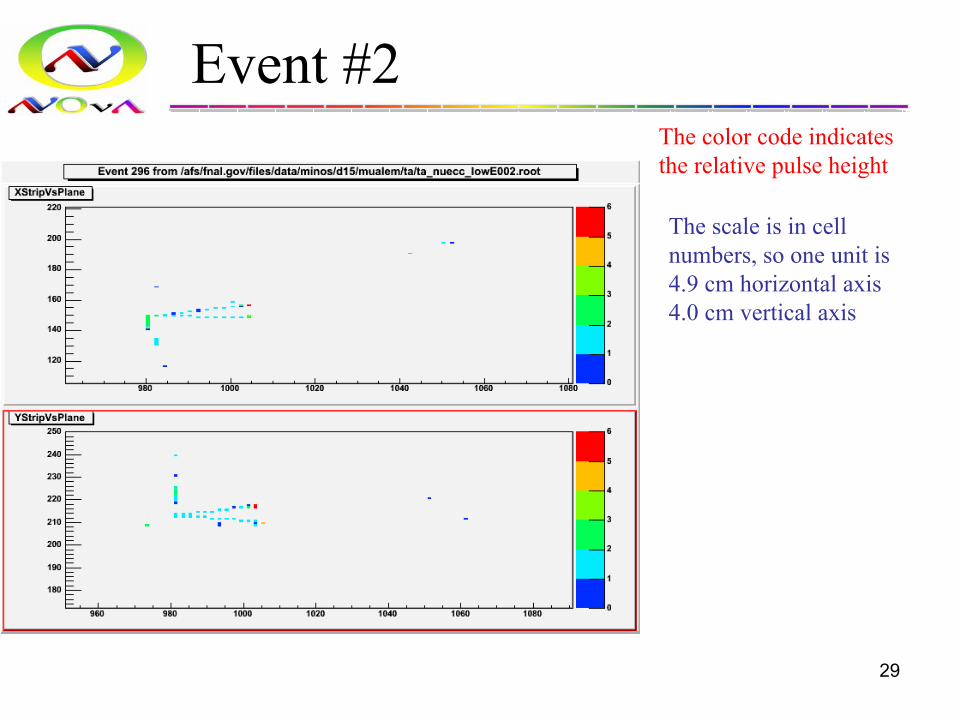
Event #2The color code indicates the relative pulse height
The scale is in cell numbers, so one unit is4.9 cm horizontal axis4.0 cm vertical axis
30
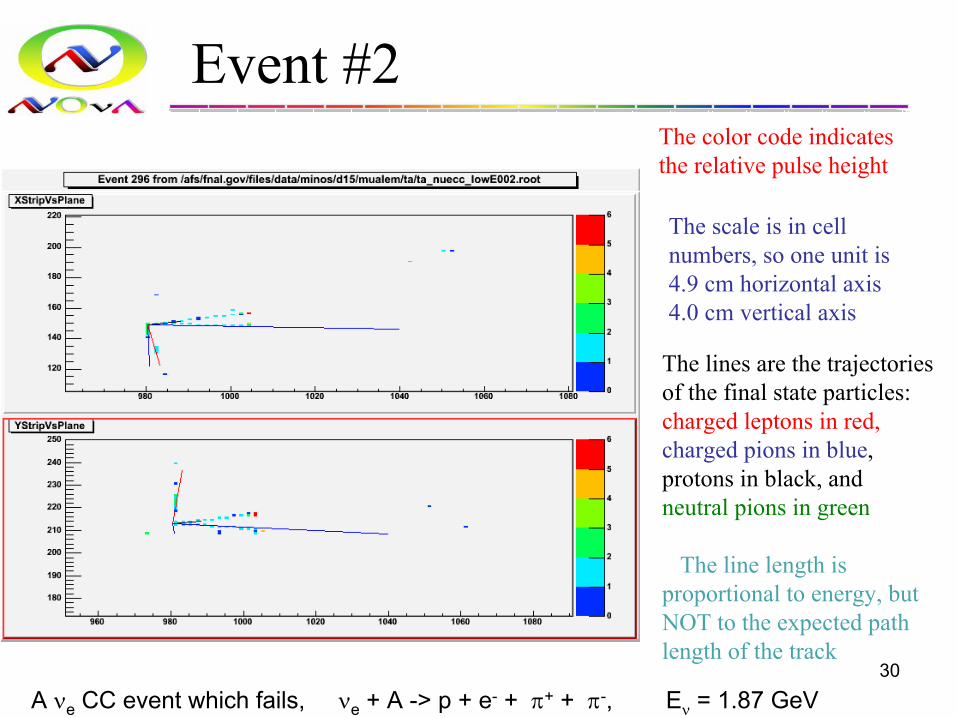
Event #2
A νe CC event which fails, νe + A -> p + e- + π+ + π-, Eν = 1.87 GeV
The lines are the trajectories of the final state particles: charged leptons in red,charged pions in blue, protons in black, and neutral pions in green
The line length is proportional to energy, but NOT to the expected path length of the track
The color code indicates the relative pulse height
The scale is in cell numbers, so one unit is4.9 cm horizontal axis4.0 cm vertical axis
31
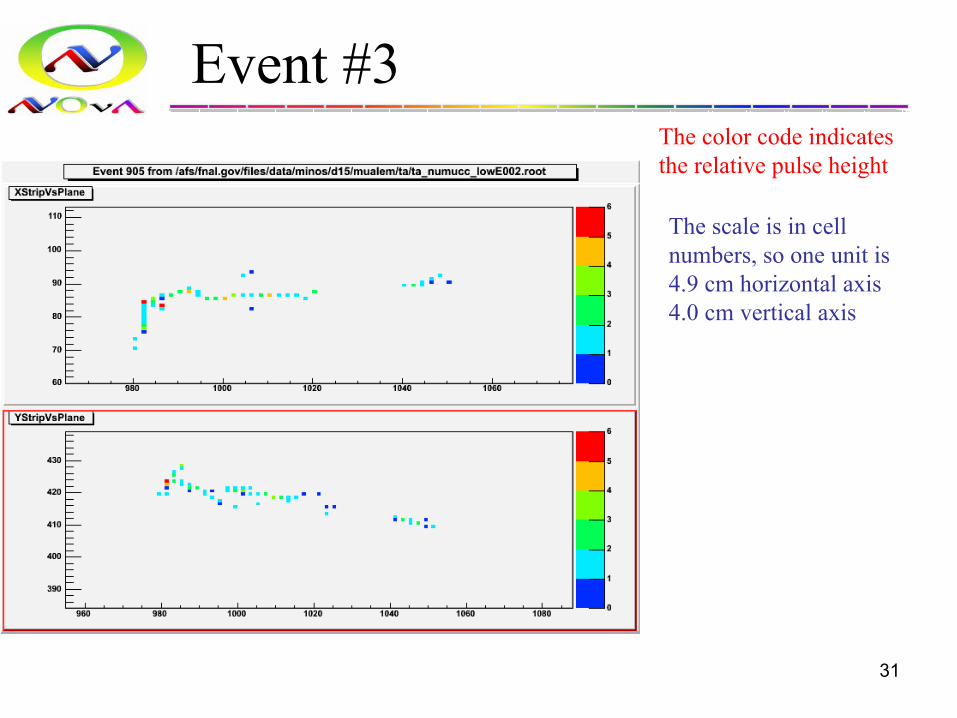
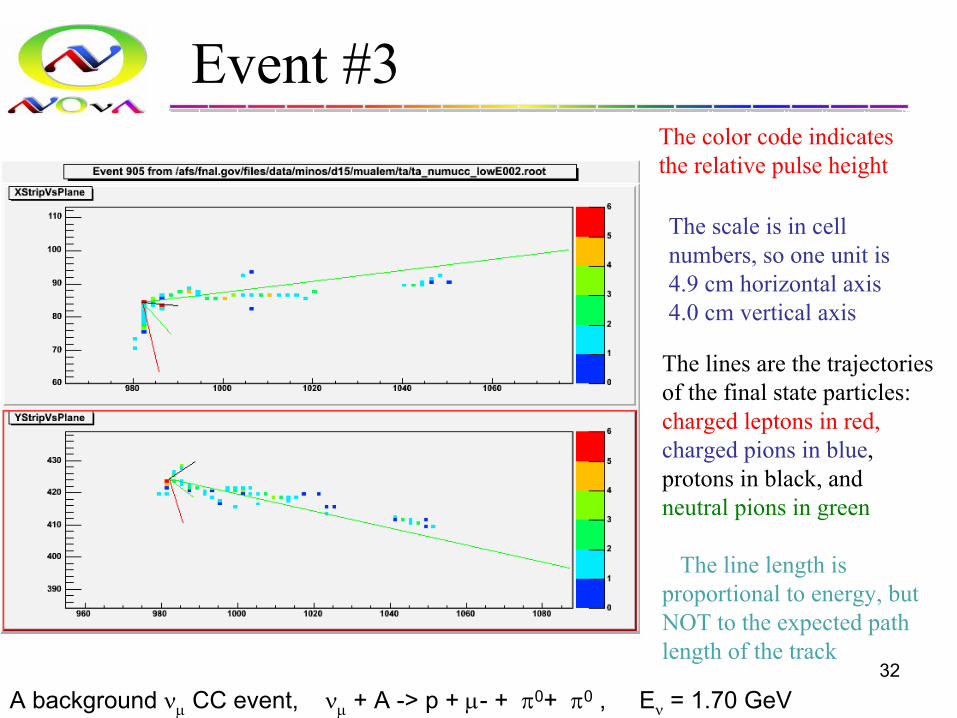
Event #3The color code indicates the relative pulse height
The scale is in cell numbers, so one unit is4.9 cm horizontal axis4.0 cm vertical axis
32
Event #3
A background νµ CC event, νµ + A -> p + µ- + π0+ π0 , Eν = 1.70 GeV
The lines are the trajectories of the final state particles: charged leptons in red,charged pions in blue, protons in black, and neutral pions in green
The line length is proportional to energy, but NOT to the expected path length of the track
The color code indicates the relative pulse height
The scale is in cell numbers, so one unit is4.9 cm horizontal axis4.0 cm vertical axis
33
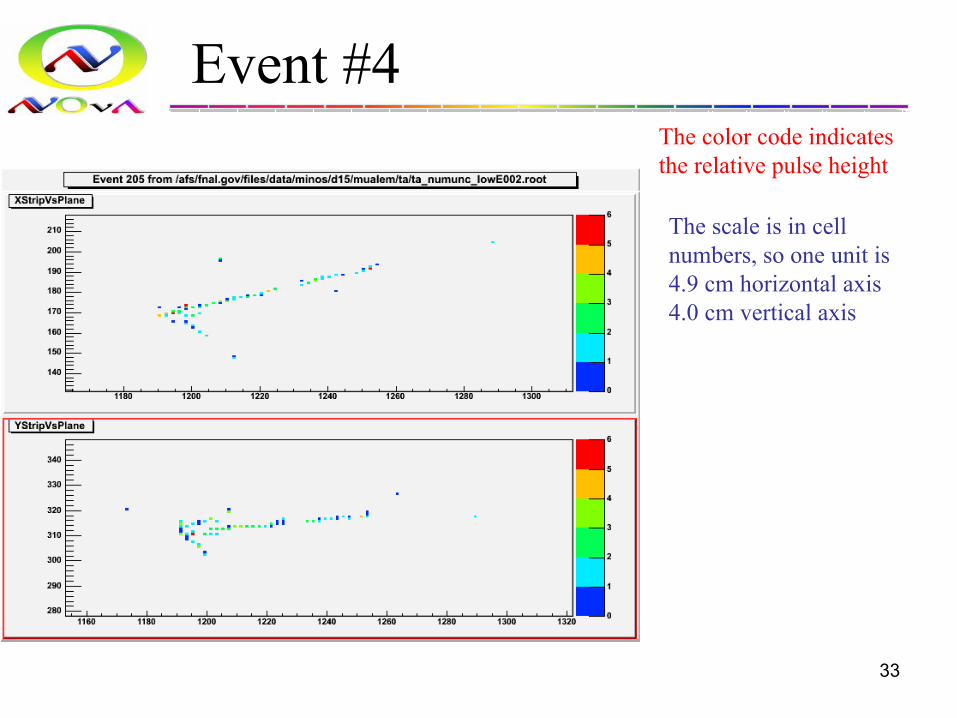
Event #4The color code indicates the relative pulse height
The scale is in cell numbers, so one unit is4.9 cm horizontal axis4.0 cm vertical axis
34
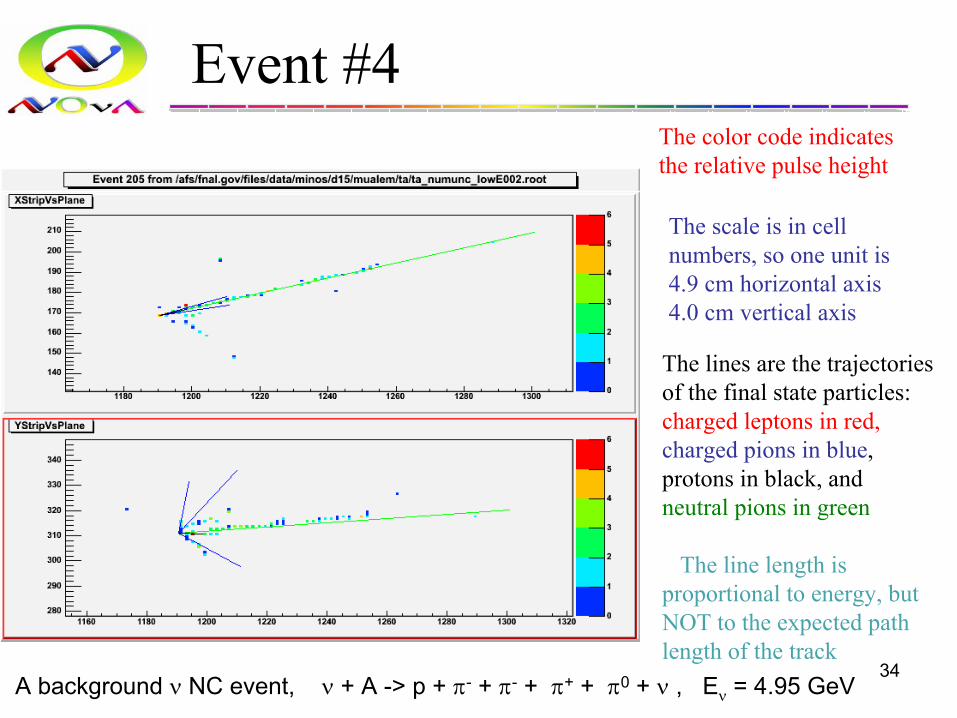
Event #4
A background ν NC event, ν + A -> p + π- + π- + π+ + π0 + ν , Eν = 4.95 GeV
The lines are the trajectories of the final state particles: charged leptons in red,charged pions in blue, protons in black, and neutral pions in green
The line length is proportional to energy, but NOT to the expected path length of the track
The color code indicates the relative pulse height
The scale is in cell numbers, so one unit is4.9 cm horizontal axis4.0 cm vertical axis
35
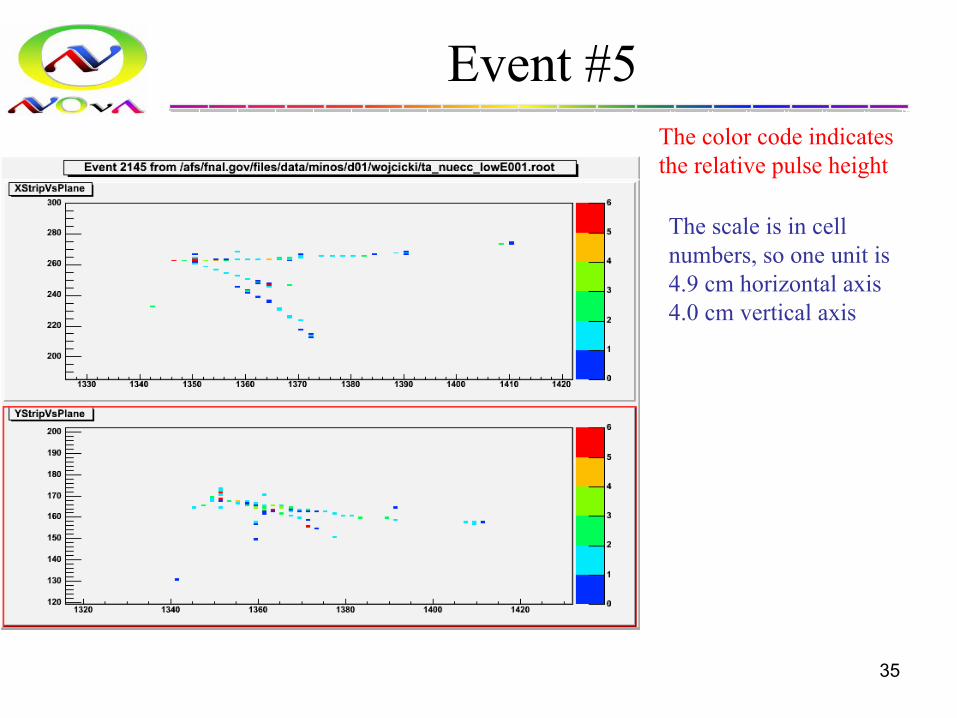
Event #5The color code indicates the relative pulse height
The scale is in cell numbers, so one unit is4.9 cm horizontal axis4.0 cm vertical axis
36
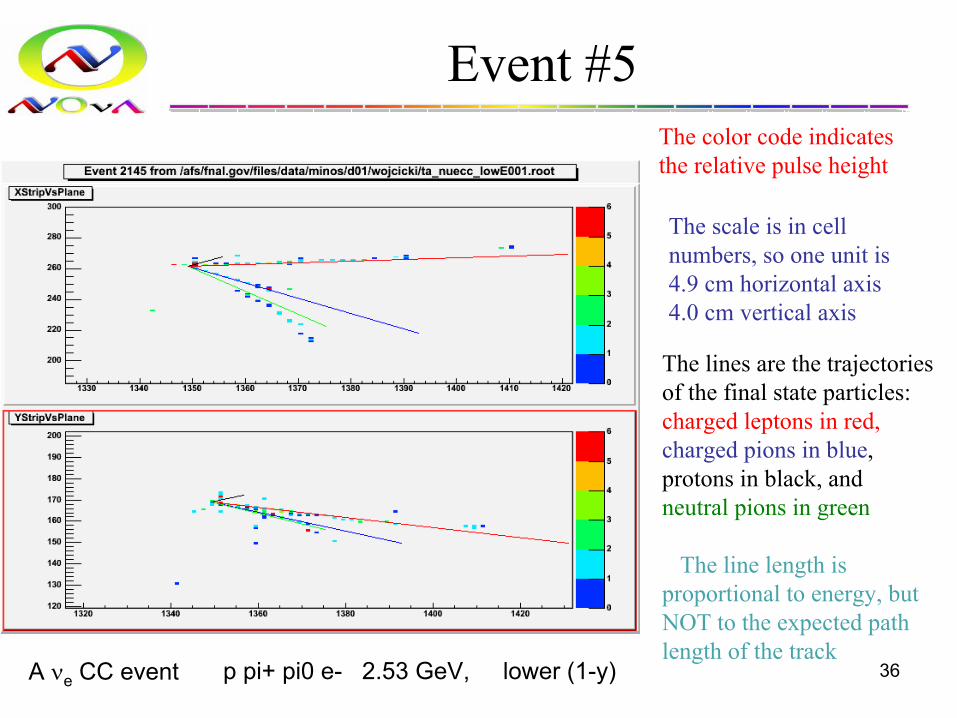
Event #5
The lines are the trajectories of the final state particles: charged leptons in red,charged pions in blue, protons in black, and neutral pions in green
The line length is proportional to energy, but NOT to the expected path length of the track
The color code indicates the relative pulse height
The scale is in cell numbers, so one unit is4.9 cm horizontal axis4.0 cm vertical axis
p pi+ pi0 e- 2.53 GeV, lower (1-y)A νe CC event
37
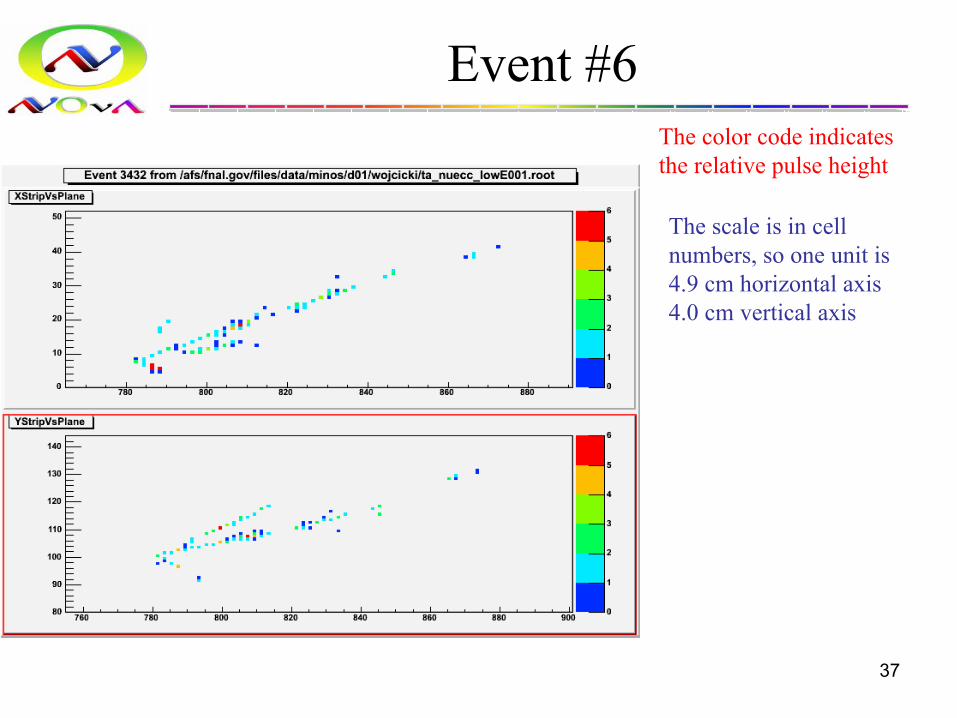
Event #6The color code indicates the relative pulse height
The scale is in cell numbers, so one unit is4.9 cm horizontal axis4.0 cm vertical axis
38
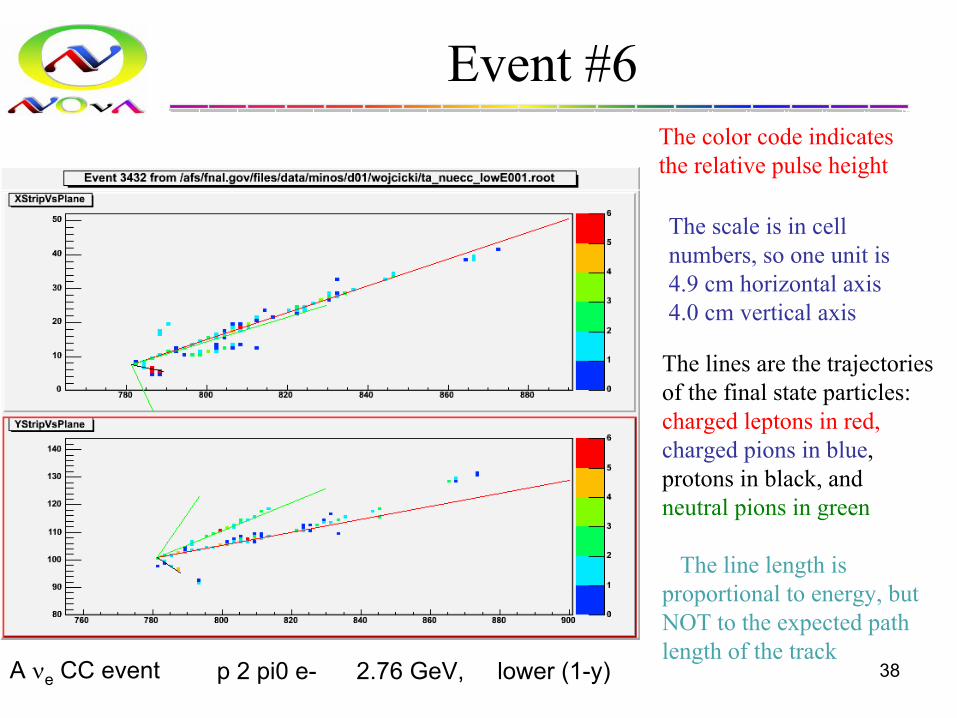
Event #6
The lines are the trajectories of the final state particles: charged leptons in red,charged pions in blue, protons in black, and neutral pions in green
The line length is proportional to energy, but NOT to the expected path length of the track
The color code indicates the relative pulse height
The scale is in cell numbers, so one unit is4.9 cm horizontal axis4.0 cm vertical axis
p 2 pi0 e- 2.76 GeV, lower (1-y)A νe CC event
39
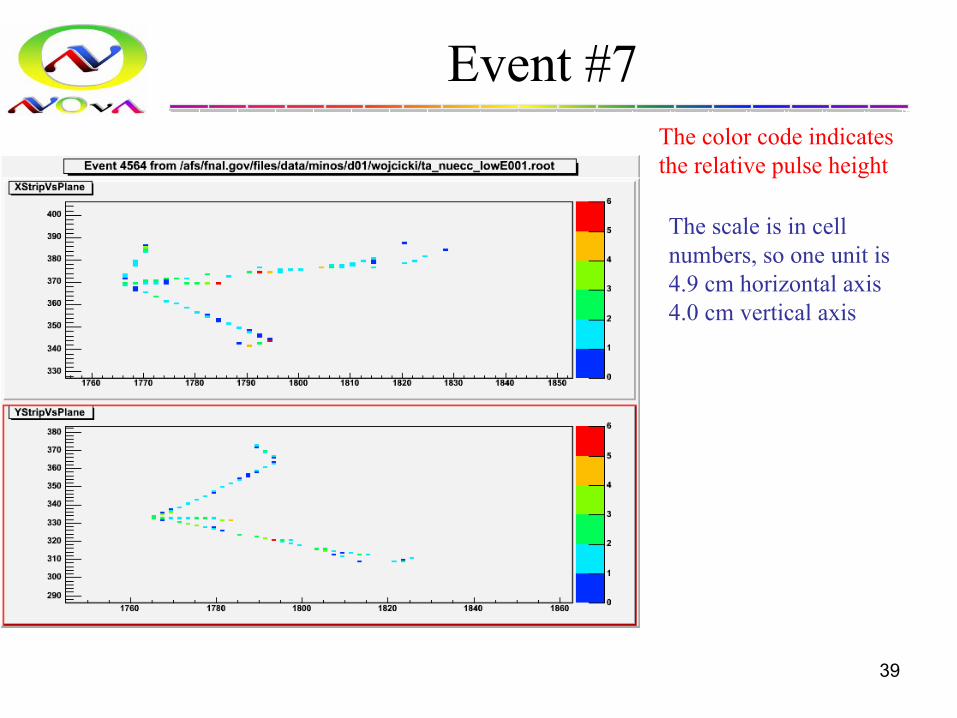
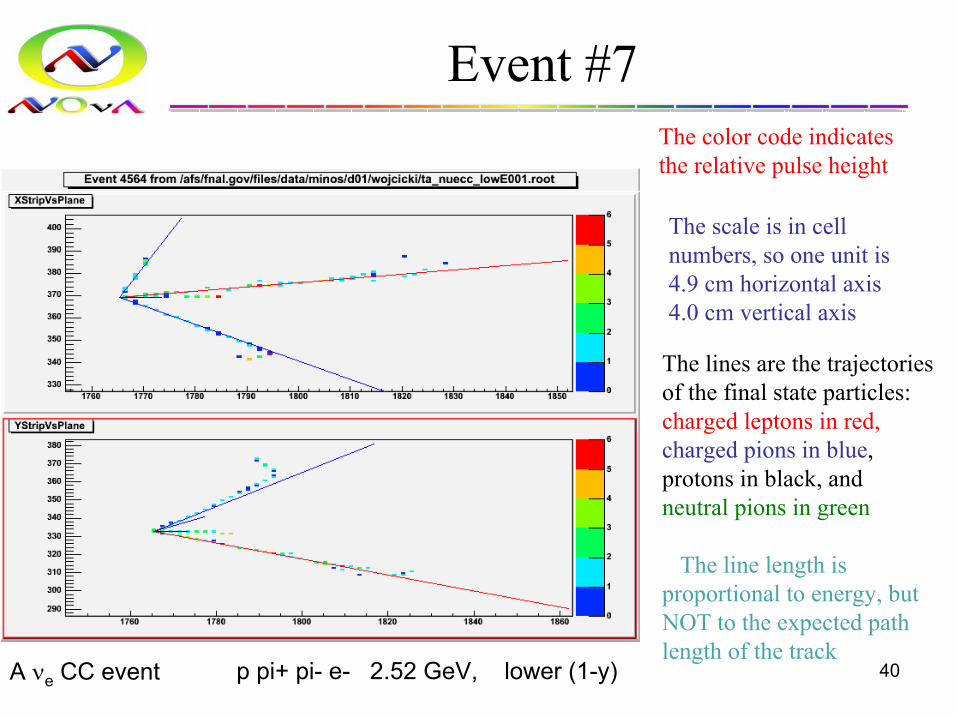
Event #7The color code indicates the relative pulse height
The scale is in cell numbers, so one unit is4.9 cm horizontal axis4.0 cm vertical axis
40
Event #7
The lines are the trajectories of the final state particles: charged leptons in red,charged pions in blue, protons in black, and neutral pions in green
The line length is proportional to energy, but NOT to the expected path length of the track
The color code indicates the relative pulse height
The scale is in cell numbers, so one unit is4.9 cm horizontal axis4.0 cm vertical axis
p pi+ pi- e- 2.52 GeV, lower (1-y)A νe CC event

41
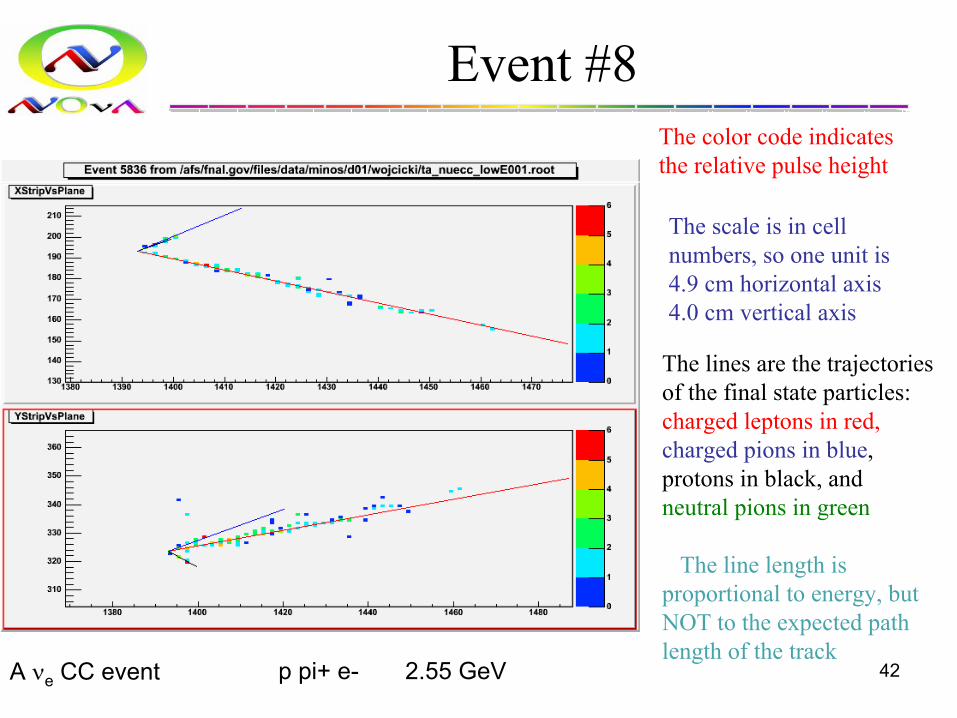
Event #8The color code indicates the relative pulse height
The scale is in cell numbers, so one unit is4.9 cm horizontal axis4.0 cm vertical axis
42
Event #8
The lines are the trajectories of the final state particles: charged leptons in red,charged pions in blue, protons in black, and neutral pions in green
The line length is proportional to energy, but NOT to the expected path length of the track
The color code indicates the relative pulse height
The scale is in cell numbers, so one unit is4.9 cm horizontal axis4.0 cm vertical axis
p pi+ e- 2.55 GeVA νe CC event
43
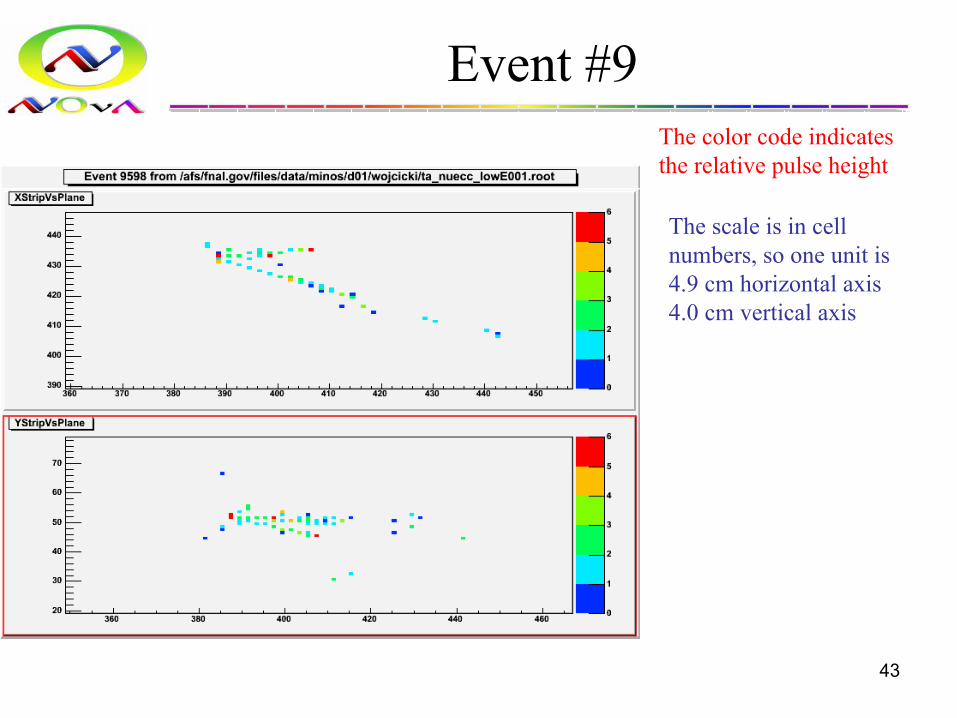
Event #9The color code indicates the relative pulse height
The scale is in cell numbers, so one unit is4.9 cm horizontal axis4.0 cm vertical axis
44
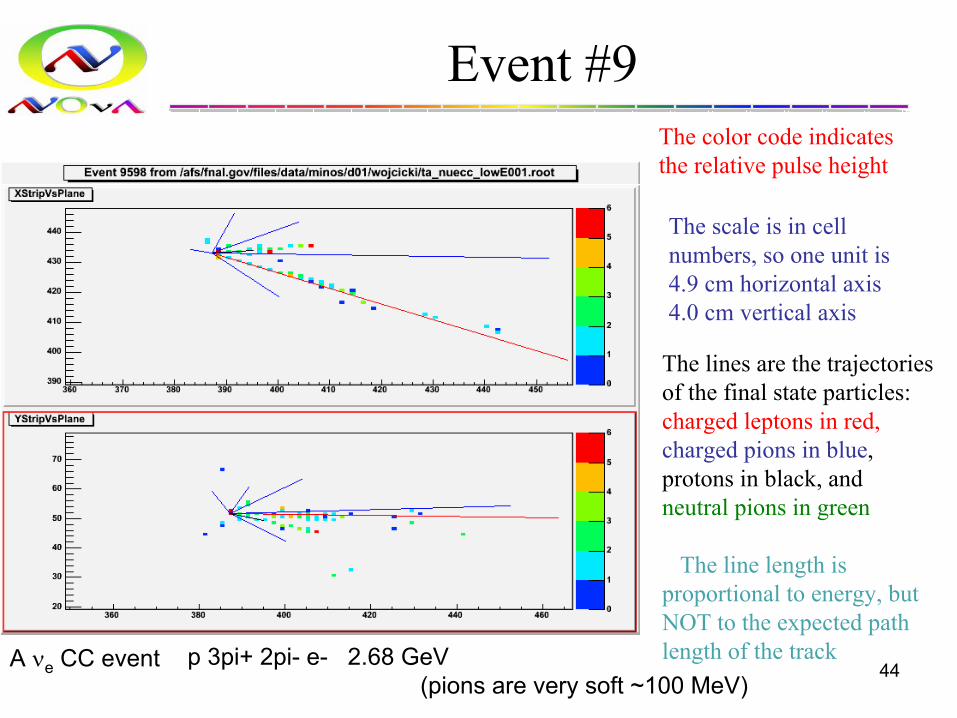
Event #9
The lines are the trajectories of the final state particles: charged leptons in red,charged pions in blue, protons in black, and neutral pions in green
The line length is proportional to energy, but NOT to the expected path length of the track
The color code indicates the relative pulse height
The scale is in cell numbers, so one unit is4.9 cm horizontal axis4.0 cm vertical axis
p 3pi+ 2pi- e- 2.68 GeV (pions are very soft ~100 MeV)
A νe CC event
45
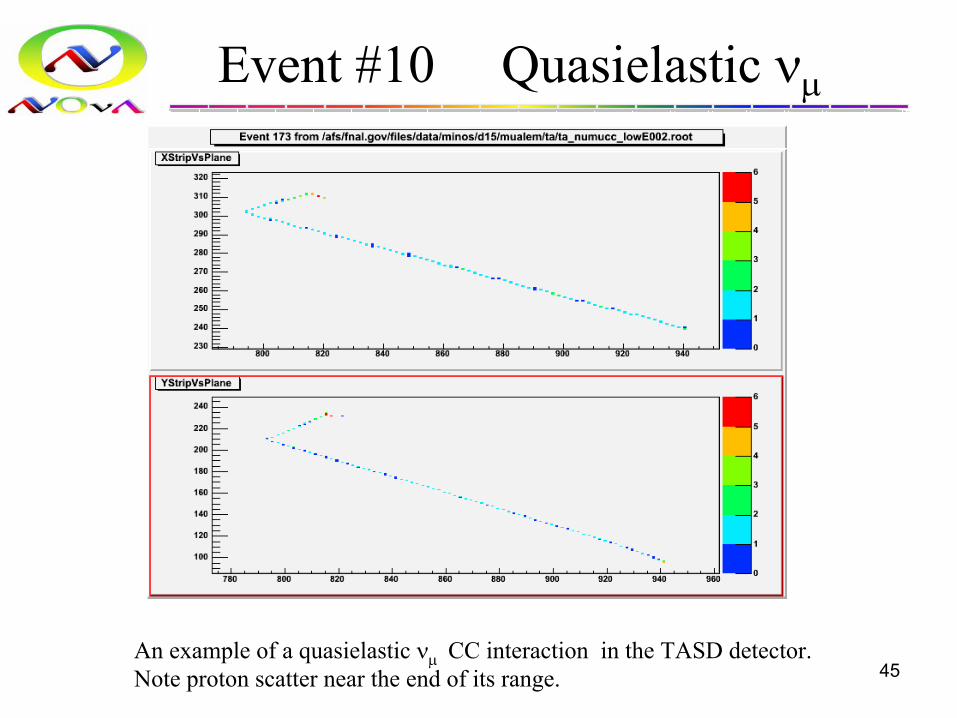
Event #10 Quasielastic νµ
An example of a quasielastic νµ CC interaction in the TASD detector. Note proton scatter near the end of its range.