Alternating copolymers of functionalized α-methyl styrene ...
No.094
Packed SEC Columns for Analysis of Polar Samples: TSKgel α (Alpha)Series
——— Contents ———
1. Introduction
2. Features of Alpha Series
3. Basic Characteristics of Alpha Series
1) Conversion between solvents
2) Calibration curves
3) Effect of temperature
4) Effect of flow rate
5) Effect of sample injection volume
6) Effect of sample injection concentration
7) Effect of adding salt to the Eluent
8) Ionicity and hydrophobicity
9) Elution behavior of solvent peaks
4. Points to Consider before Conducting Analyses
1) Sample preparation procedures
2) To obtain stable analysis results
3) Selecting the Eluent
5. Examples of Separation of Polar Compounds using Various
Eluents
6. Summary
Page
1
1
5
5
5
5
7
7
7
12
12
12
15
15
15
16
16
29
– - 1 - –
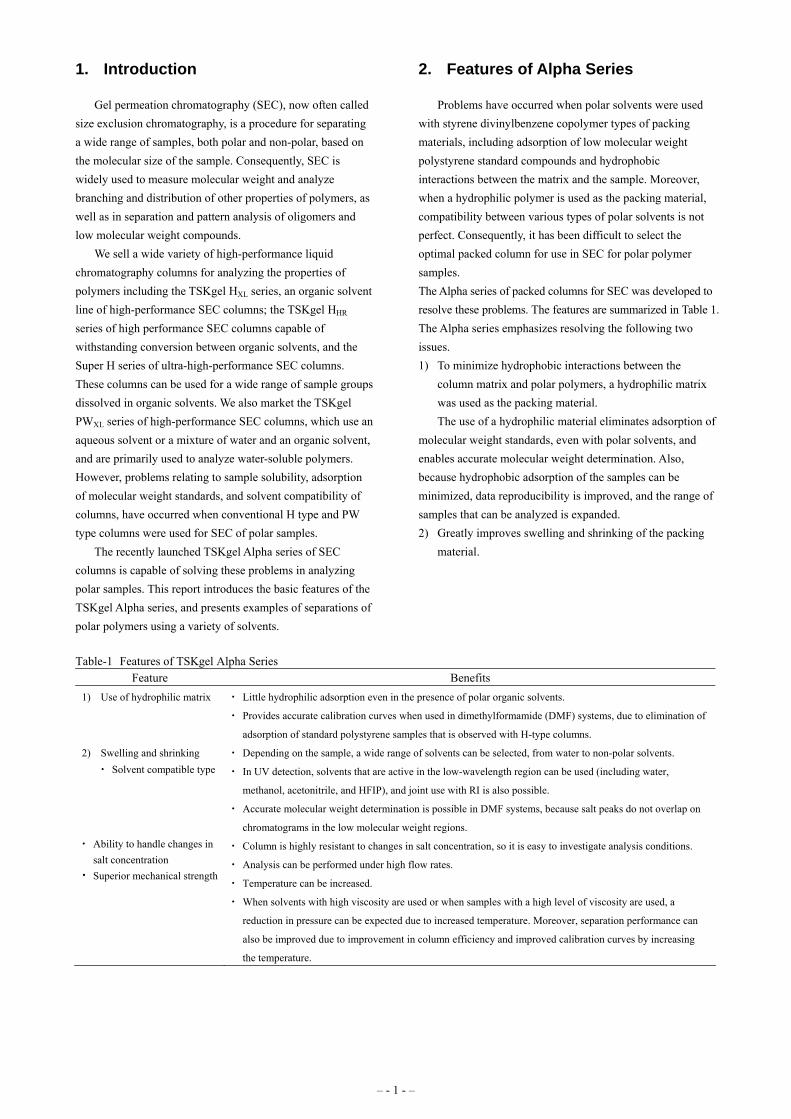
1. Introduction
Gel permeation chromatography (SEC), now often called size exclusion chromatography, is a procedure for separating a wide range of samples, both polar and non-polar, based on the molecular size of the sample. Consequently, SEC is widely used to measure molecular weight and analyze branching and distribution of other properties of polymers, as well as in separation and pattern analysis of oligomers and low molecular weight compounds.
We sell a wide variety of high-performance liquid chromatography columns for analyzing the properties of polymers including the TSKgel HXL series, an organic solvent line of high-performance SEC columns; the TSKgel HHR series of high performance SEC columns capable of withstanding conversion between organic solvents, and the Super H series of ultra-high-performance SEC columns. These columns can be used for a wide range of sample groups dissolved in organic solvents. We also market the TSKgel PWXL series of high-performance SEC columns, which use an aqueous solvent or a mixture of water and an organic solvent, and are primarily used to analyze water-soluble polymers. However, problems relating to sample solubility, adsorption of molecular weight standards, and solvent compatibility of columns, have occurred when conventional H type and PW type columns were used for SEC of polar samples.
The recently launched TSKgel Alpha series of SEC columns is capable of solving these problems in analyzing polar samples. This report introduces the basic features of the TSKgel Alpha series, and presents examples of separations of polar polymers using a variety of solvents.
2. Features of Alpha Series
Problems have occurred when polar solvents were used with styrene divinylbenzene copolymer types of packing materials, including adsorption of low molecular weight polystyrene standard compounds and hydrophobic interactions between the matrix and the sample. Moreover, when a hydrophilic polymer is used as the packing material, compatibility between various types of polar solvents is not perfect. Consequently, it has been difficult to select the optimal packed column for use in SEC for polar polymer samples. The Alpha series of packed columns for SEC was developed to resolve these problems. The features are summarized in Table 1. The Alpha series emphasizes resolving the following two issues. 1) To minimize hydrophobic interactions between the
column matrix and polar polymers, a hydrophilic matrix was used as the packing material. The use of a hydrophilic material eliminates adsorption of
molecular weight standards, even with polar solvents, and enables accurate molecular weight determination. Also, because hydrophobic adsorption of the samples can be minimized, data reproducibility is improved, and the range of samples that can be analyzed is expanded. 2) Greatly improves swelling and shrinking of the packing
material.
Table-1 Features of TSKgel Alpha Series Feature Benefits
1) Use of hydrophilic matrix Little hydrophilic adsorption even in the presence of polar organic solvents.
Provides accurate calibration curves when used in dimethylformamide (DMF) systems, due to elimination of
adsorption of standard polystyrene samples that is observed with H-type columns.
2) Swelling and shrinking Solvent compatible type
Depending on the sample, a wide range of solvents can be selected, from water to non-polar solvents.
In UV detection, solvents that are active in the low-wavelength region can be used (including water,
methanol, acetonitrile, and HFIP), and joint use with RI is also possible.
Accurate molecular weight determination is possible in DMF systems, because salt peaks do not overlap on
chromatograms in the low molecular weight regions. Ability to handle changes in
salt concentration Superior mechanical strength
Column is highly resistant to changes in salt concentration, so it is easy to investigate analysis conditions.
Analysis can be performed under high flow rates.
Temperature can be increased.
When solvents with high viscosity are used or when samples with a high level of viscosity are used, a
reduction in pressure can be expected due to increased temperature. Moreover, separation performance can
also be improved due to improvement in column efficiency and improved calibration curves by increasing
the temperature.
With conventional columns packed with hydrophilic matrices, in the presence of various organic solvents, it is difficult to convert from an aqueous solvent to an organic solvent due to differences in swelling and shrinking that occur. Moreover, the use of polar solvents is greatly restricted. With the Alpha series of columns, the packing material was engineered to minimize swelling and shrinking, which, with no reduction in column performance, results in a carrier in which conversion between solvents is possible, even when a wide range of solvents (from water to mildly polar solvents) is used.
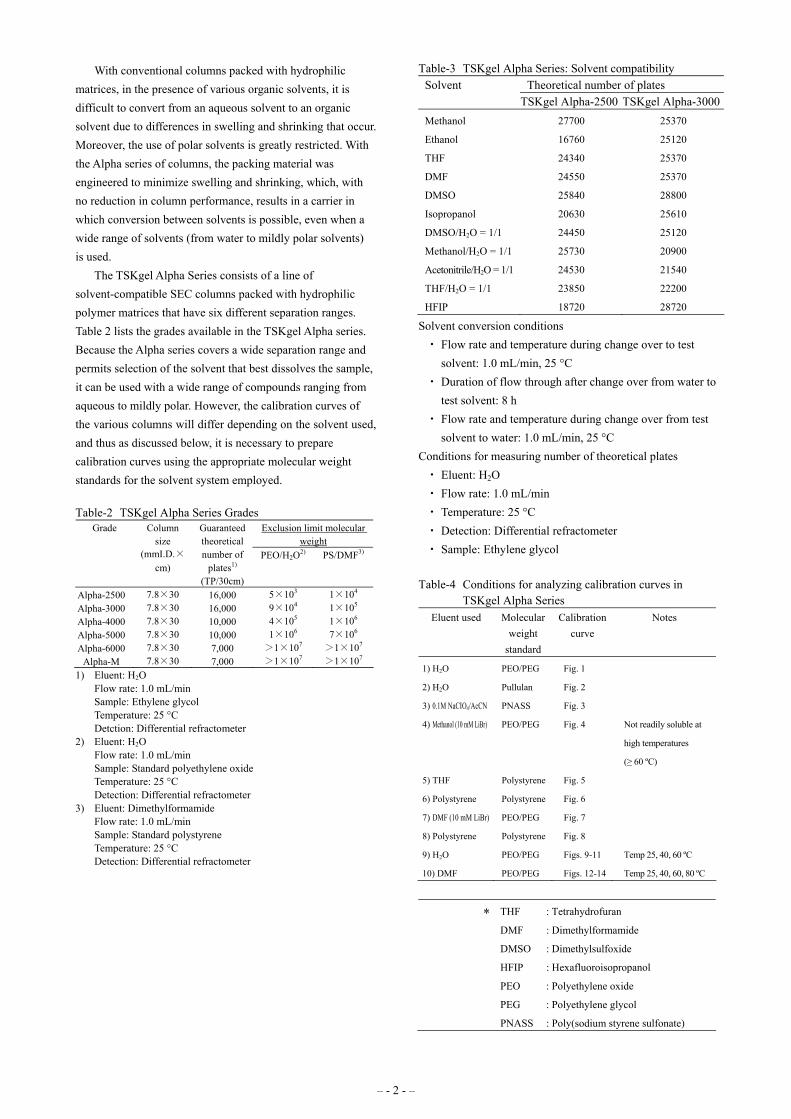
The TSKgel Alpha Series consists of a line of solvent-compatible SEC columns packed with hydrophilic polymer matrices that have six different separation ranges. Table 2 lists the grades available in the TSKgel Alpha series. Because the Alpha series covers a wide separation range and permits selection of the solvent that best dissolves the sample, it can be used with a wide range of compounds ranging from aqueous to mildly polar. However, the calibration curves of the various columns will differ depending on the solvent used, and thus as discussed below, it is necessary to prepare calibration curves using the appropriate molecular weight standards for the solvent system employed.
Table-2 TSKgel Alpha Series Grades
Exclusion limit molecular weight
Grade Column size
(mmI.D.×cm)
Guaranteed theoretical number of
plates1) (TP/30cm)
PEO/H2O2) PS/DMF3)
Alpha-2500 7.8×30 16,000 5×10³ 1×10⁴ Alpha-3000 7.8×30 16,000 9×10⁴ 1×10⁵ Alpha-4000 7.8×30 10,000 4×10⁵ 1×10⁶ Alpha-5000 7.8×30 10,000 1×10⁶ 7×10⁶ Alpha-6000 7.8×30 7,000 >1×10⁷ >1×10⁷
Alpha-M 7.8×30 7,000 >1×10⁷ >1×10⁷ 1) Eluent: H2O
Flow rate: 1.0 mL/min Sample: Ethylene glycol Temperature: 25 °C Detction: Differential refractometer
2) Eluent: H2O Flow rate: 1.0 mL/min Sample: Standard polyethylene oxide Temperature: 25 °C Detection: Differential refractometer
3) Eluent: Dimethylformamide Flow rate: 1.0 mL/min Sample: Standard polystyrene Temperature: 25 °C Detection: Differential refractometer
Table-3 TSKgel Alpha Series: Solvent compatibility Solvent Theoretical number of plates TSKgel Alpha-2500 TSKgel Alpha-3000Methanol 27700 25370
Ethanol 16760 25120
THF 24340 25370
DMF 24550 25370
DMSO 25840 28800
Isopropanol 20630 25610
DMSO/H2O = 1/1 24450 25120
Methanol/H2O = 1/1 25730 20900
Acetonitrile/H2O = 1/1 24530 21540
THF/H2O = 1/1 23850 22200
HFIP 18720 28720
Solvent conversion conditions Flow rate and temperature during change over to test
solvent: 1.0 mL/min, 25 °C Duration of flow through after change over from water to
test solvent: 8 h Flow rate and temperature during change over from test
solvent to water: 1.0 mL/min, 25 °C Conditions for measuring number of theoretical plates
Eluent: H2O Flow rate: 1.0 mL/min Temperature: 25 °C Detection: Differential refractometer Sample: Ethylene glycol
Table-4 Conditions for analyzing calibration curves in TSKgel Alpha Series
Eluent used Molecular weight
standard
Calibration curve
Notes
1) H2O PEO/PEG Fig. 1
2) H2O Pullulan Fig. 2
3) 0.1M NaCIO4/AcCN PNASS Fig. 3
4) Methanol (10 mM LiBr) PEO/PEG Fig. 4 Not readily soluble at
high temperatures
(≥ 60 ºC)
5) THF Polystyrene Fig. 5
6) Polystyrene Polystyrene Fig. 6
7) DMF (10 mM LiBr) PEO/PEG Fig. 7
8) Polystyrene Polystyrene Fig. 8
9) H2O PEO/PEG Figs. 9-11 Temp 25, 40, 60 ºC
10) DMF PEO/PEG Figs. 12-14 Temp 25, 40, 60, 80 ºC
THF : Tetrahydrofuran
DMF : Dimethylformamide
DMSO : Dimethylsulfoxide
HFIP : Hexafluoroisopropanol
PEO : Polyethylene oxide
PEG : Polyethylene glycol
PNASS : Poly(sodium styrene sulfonate)
*
– - 2 - –
Elution Volume (ml)
Log
Mol
ecul
ar W
eigh
t ① α-2500② α-3000③ α-4000④ α-5000⑤ α-6000⑥ α-M
Fig. 1 TSKgel Alpha Series Calibration Curve (H2O/PEO, PEG)
Column: TSKgel Alpha Series Eluent: H2O Flow rate: 1.0 mL/min Temperature: 25 °C Detection: Differential refractometer Sample: Standard polyethylene oxide, PEG and EG
Elution Volume (ml)
Log
Mol
ecul
ar W
eigh
t
① α-2500② α-3000③ α-4000④ α-5000⑤ α-6000⑥ α-M
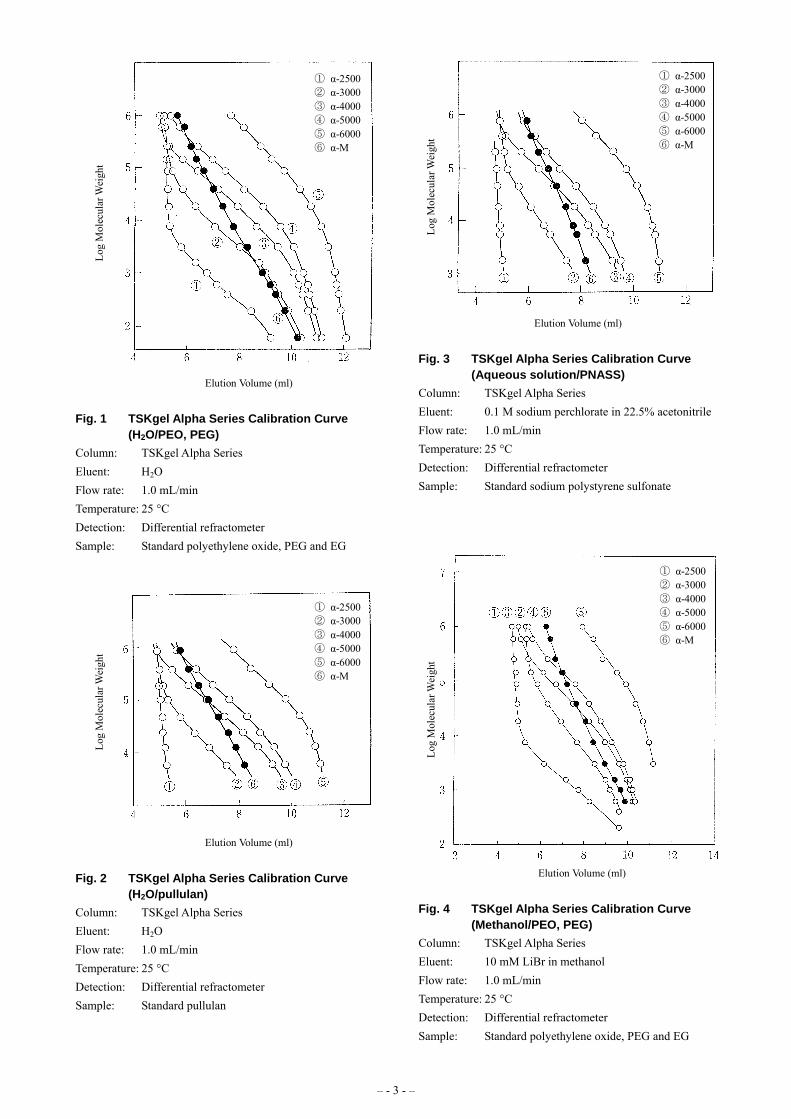
Fig. 2 TSKgel Alpha Series Calibration Curve (H2O/pullulan)
Column: TSKgel Alpha Series Eluent: H2O Flow rate: 1.0 mL/min Temperature: 25 °C Detection: Differential refractometer Sample: Standard pullulan
Elution Volume (ml)
Log
Mol
ecul
ar W
eigh
t
① α-2500② α-3000③ α-4000④ α-5000⑤ α-6000⑥ α-M
Fig. 3 TSKgel Alpha Series Calibration Curve
(Aqueous solution/PNASS) Column: TSKgel Alpha Series Eluent: 0.1 M sodium perchlorate in 22.5% acetonitrile Flow rate: 1.0 mL/min Temperature: 25 °C Detection: Differential refractometer Sample: Standard sodium polystyrene sulfonate
Elution Volume (ml)
Log
Mol
ecul
ar W
eigh
t
① α-2500② α-3000③ α-4000④ α-5000⑤ α-6000⑥ α-M
Fig. 4 TSKgel Alpha Series Calibration Curve
(Methanol/PEO, PEG) Column: TSKgel Alpha Series Eluent: 10 mM LiBr in methanol Flow rate: 1.0 mL/min Temperature: 25 °C Detection: Differential refractometer Sample: Standard polyethylene oxide, PEG and EG
– - 3 - –
Elution Volume (ml)
Log
Mol
ecul
ar W
eigh
t ① α-2500② α-3000③ α-4000④ α-5000⑤ α-6000⑥ α-M
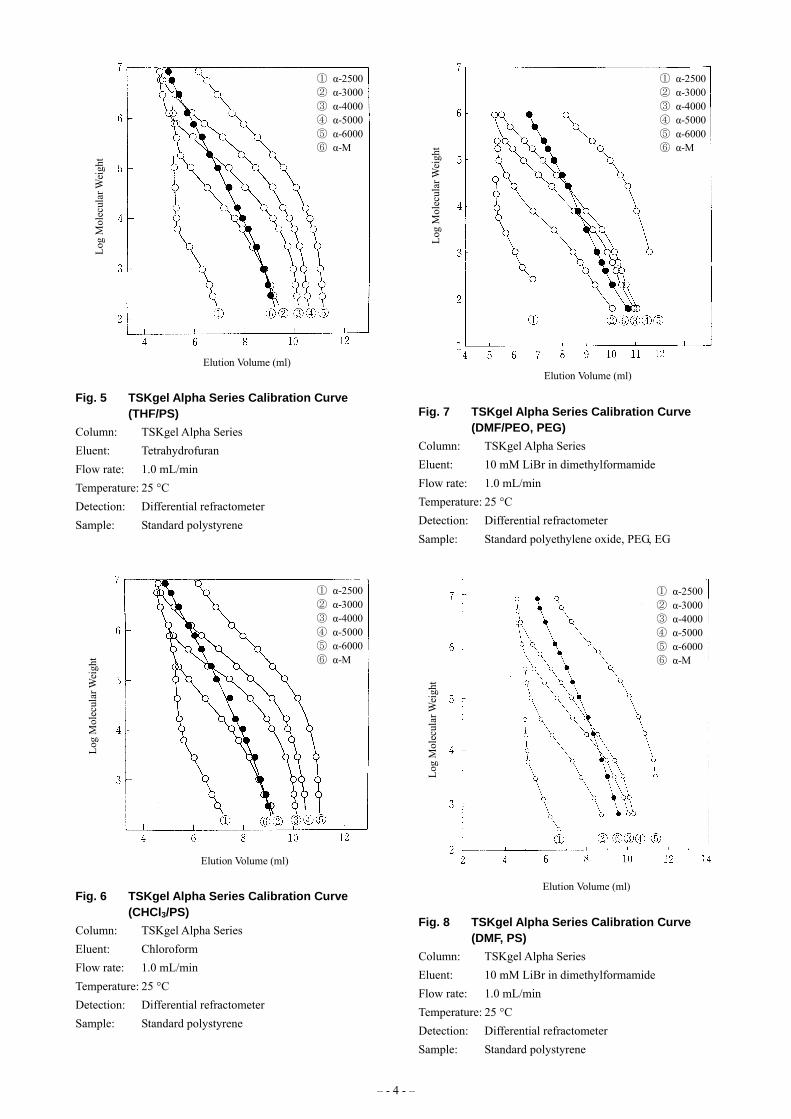
Fig. 5 TSKgel Alpha Series Calibration Curve (THF/PS)
Column: TSKgel Alpha Series Eluent: Tetrahydrofuran Flow rate: 1.0 mL/min Temperature: 25 °C Detection: Differential refractometer Sample: Standard polystyrene
Elution Volume (ml)
Log
Mol
ecul
ar W
eigh
t
① α-2500② α-3000③ α-4000④ α-5000⑤ α-6000⑥ α-M
Fig. 6 TSKgel Alpha Series Calibration Curve (CHCl3/PS)
Column: TSKgel Alpha Series Eluent: Chloroform Flow rate: 1.0 mL/min Temperature: 25 °C Detection: Differential refractometer Sample: Standard polystyrene
Elution Volume (ml)
Log
Mol
ecul
ar W
eigh
t
① α-2500② α-3000③ α-4000④ α-5000⑤ α-6000⑥ α-M
Fig. 7 TSKgel Alpha Series Calibration Curve (DMF/PEO, PEG)
Column: TSKgel Alpha Series Eluent: 10 mM LiBr in dimethylformamide Flow rate: 1.0 mL/min Temperature: 25 °C Detection: Differential refractometer Sample: Standard polyethylene oxide, PEG, EG
Elution Volume (ml)
Log
Mol
ecul
ar W
eigh
t
① α-2500② α-3000③ α-4000④ α-5000⑤ α-6000⑥ α-M
Fig. 8 TSKgel Alpha Series Calibration Curve (DMF, PS)
Column: TSKgel Alpha Series Eluent: 10 mM LiBr in dimethylformamide Flow rate: 1.0 mL/min Temperature: 25 °C Detection: Differential refractometer Sample: Standard polystyrene
– - 4 - –
3. Basic Characteristics of Alpha Series
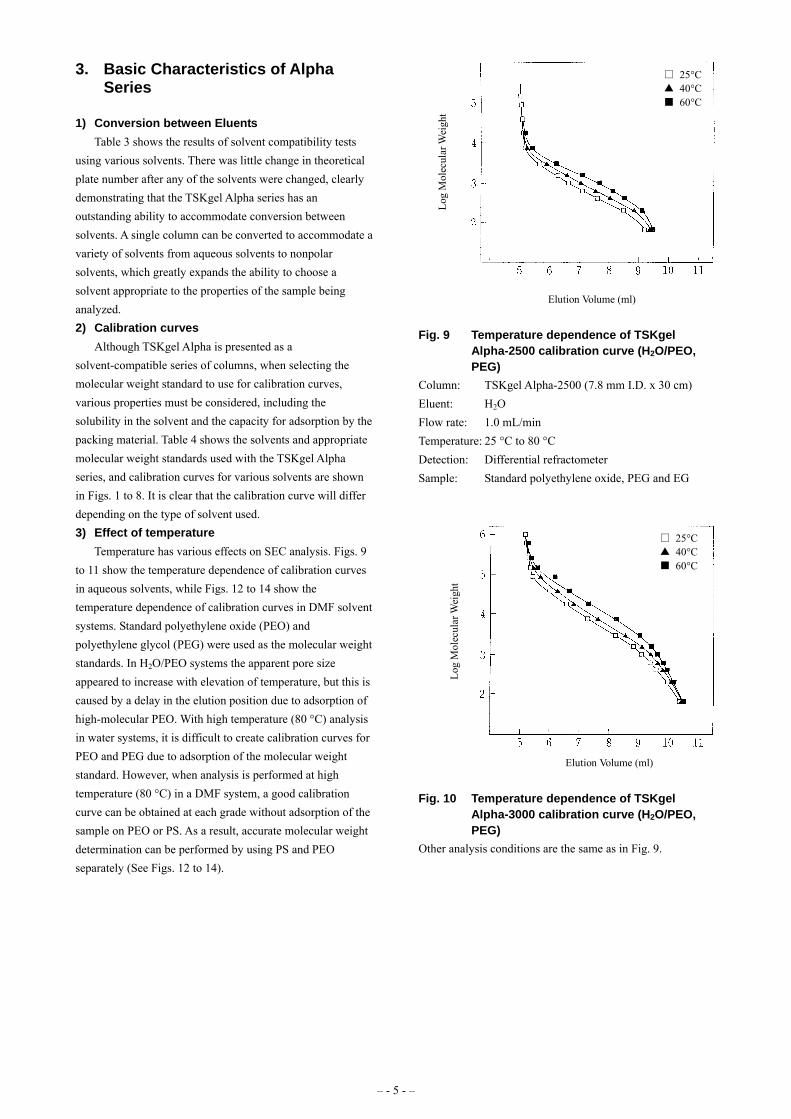
1) Conversion between Eluents Table 3 shows the results of solvent compatibility tests
using various solvents. There was little change in theoretical plate number after any of the solvents were changed, clearly demonstrating that the TSKgel Alpha series has an outstanding ability to accommodate conversion between solvents. A single column can be converted to accommodate a variety of solvents from aqueous solvents to nonpolar solvents, which greatly expands the ability to choose a solvent appropriate to the properties of the sample being analyzed. 2) Calibration curves
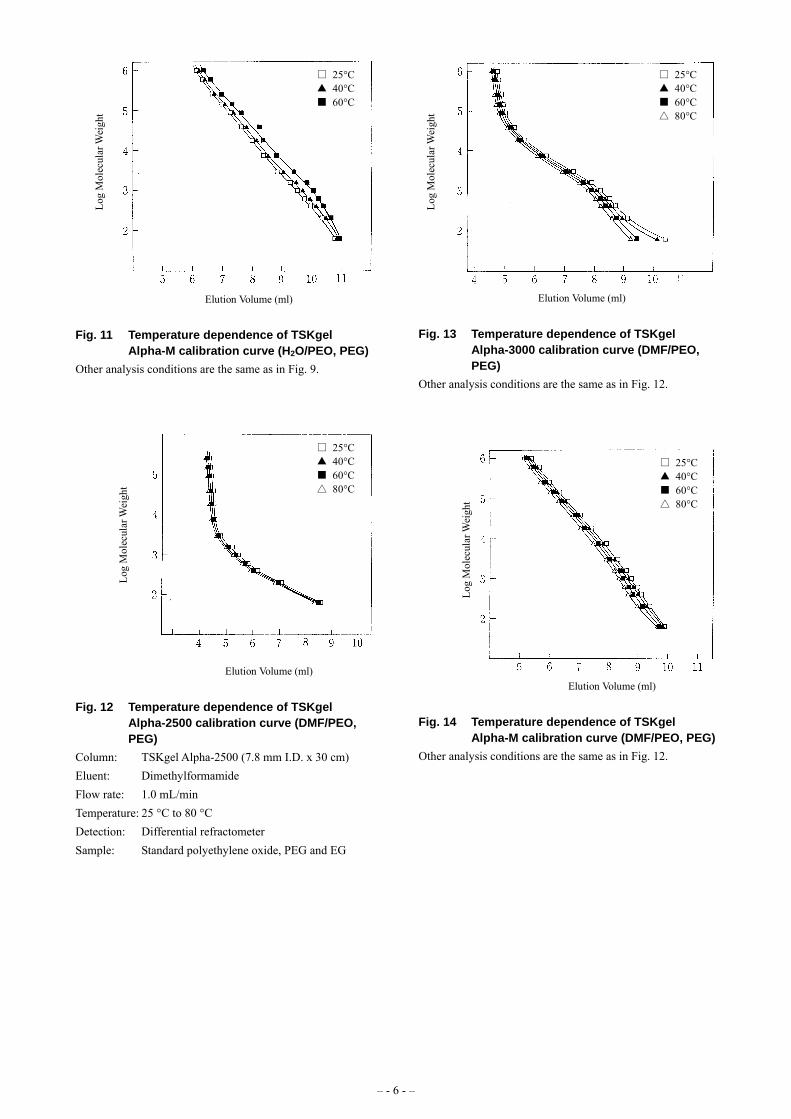
Although TSKgel Alpha is presented as a solvent-compatible series of columns, when selecting the molecular weight standard to use for calibration curves, various properties must be considered, including the solubility in the solvent and the capacity for adsorption by the packing material. Table 4 shows the solvents and appropriate molecular weight standards used with the TSKgel Alpha series, and calibration curves for various solvents are shown in Figs. 1 to 8. It is clear that the calibration curve will differ depending on the type of solvent used. 3) Effect of temperature
Temperature has various effects on SEC analysis. Figs. 9 to 11 show the temperature dependence of calibration curves in aqueous solvents, while Figs. 12 to 14 show the temperature dependence of calibration curves in DMF solvent systems. Standard polyethylene oxide (PEO) and polyethylene glycol (PEG) were used as the molecular weight standards. In H2O/PEO systems the apparent pore size appeared to increase with elevation of temperature, but this is caused by a delay in the elution position due to adsorption of high-molecular PEO. With high temperature (80 °C) analysis in water systems, it is difficult to create calibration curves for PEO and PEG due to adsorption of the molecular weight standard. However, when analysis is performed at high temperature (80 °C) in a DMF system, a good calibration curve can be obtained at each grade without adsorption of the sample on PEO or PS. As a result, accurate molecular weight determination can be performed by using PS and PEO separately (See Figs. 12 to 14).
Elution Volume (ml)
Log
Mol
ecul
ar W
eigh
t
□ 25°C▲ 40°C■ 60°C
Fig. 9 Temperature dependence of TSKgel Alpha-2500 calibration curve (H2O/PEO, PEG)
Column: TSKgel Alpha-2500 (7.8 mm I.D. x 30 cm) Eluent: H2O Flow rate: 1.0 mL/min Temperature: 25 °C to 80 °C Detection: Differential refractometer Sample: Standard polyethylene oxide, PEG and EG
Elution Volume (ml)
Log
Mol
ecul
ar W
eigh
t
□ 25°C▲ 40°C■ 60°C
Fig. 10 Temperature dependence of TSKgel Alpha-3000 calibration curve (H2O/PEO, PEG)
Other analysis conditions are the same as in Fig. 9.
– - 5 - –
Elution Volume (ml)
Log
Mol
ecul
ar W
eigh
t
□ 25°C▲ 40°C■ 60°C
Fig. 11 Temperature dependence of TSKgel Alpha-M calibration curve (H2O/PEO, PEG)
Other analysis conditions are the same as in Fig. 9.
Elution Volume (ml)
Log
Mol
ecul
ar W
eigh
t
□ 25°C▲ 40°C■ 60°C△ 80°C
Fig. 12 Temperature dependence of TSKgel Alpha-2500 calibration curve (DMF/PEO, PEG)
Column: TSKgel Alpha-2500 (7.8 mm I.D. x 30 cm) Eluent: Dimethylformamide Flow rate: 1.0 mL/min Temperature: 25 °C to 80 °C Detection: Differential refractometer Sample: Standard polyethylene oxide, PEG and EG
Elution Volume (ml)
Log
Mol
ecul
ar W
eigh
t
□ 25°C▲ 40°C■ 60°C△ 80°C
Fig. 13 Temperature dependence of TSKgel
Alpha-3000 calibration curve (DMF/PEO, PEG)
Other analysis conditions are the same as in Fig. 12.
Elution Volume (ml)
Log
Mol
ecul
ar W
eigh
t □ 25°C▲ 40°C■ 60°C△ 80°C
Fig. 14 Temperature dependence of TSKgel Alpha-M calibration curve (DMF/PEO, PEG)
Other analysis conditions are the same as in Fig. 12.
– - 6 - –
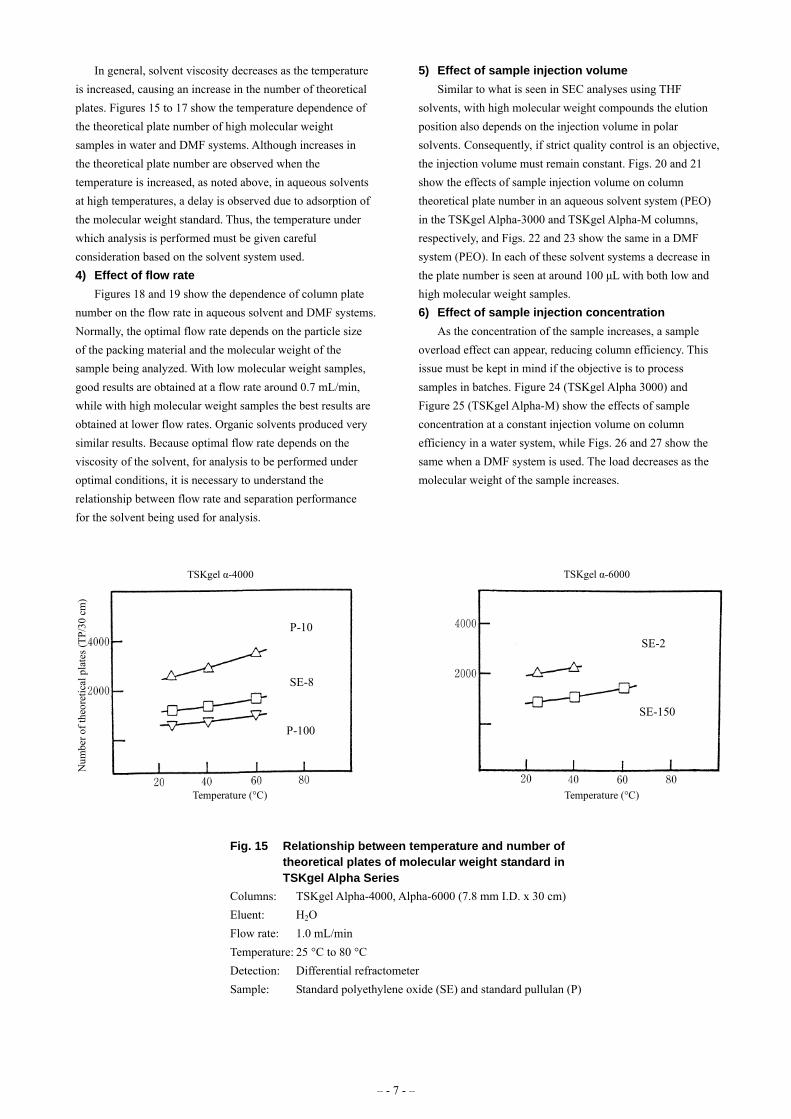
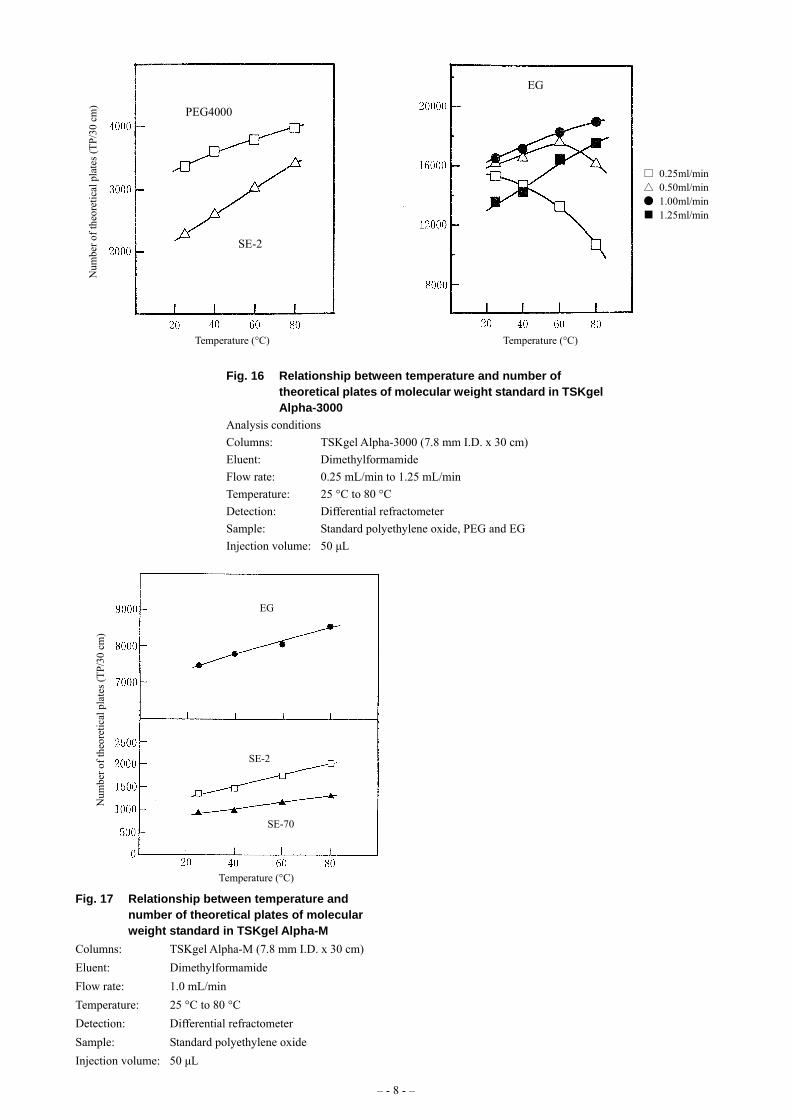
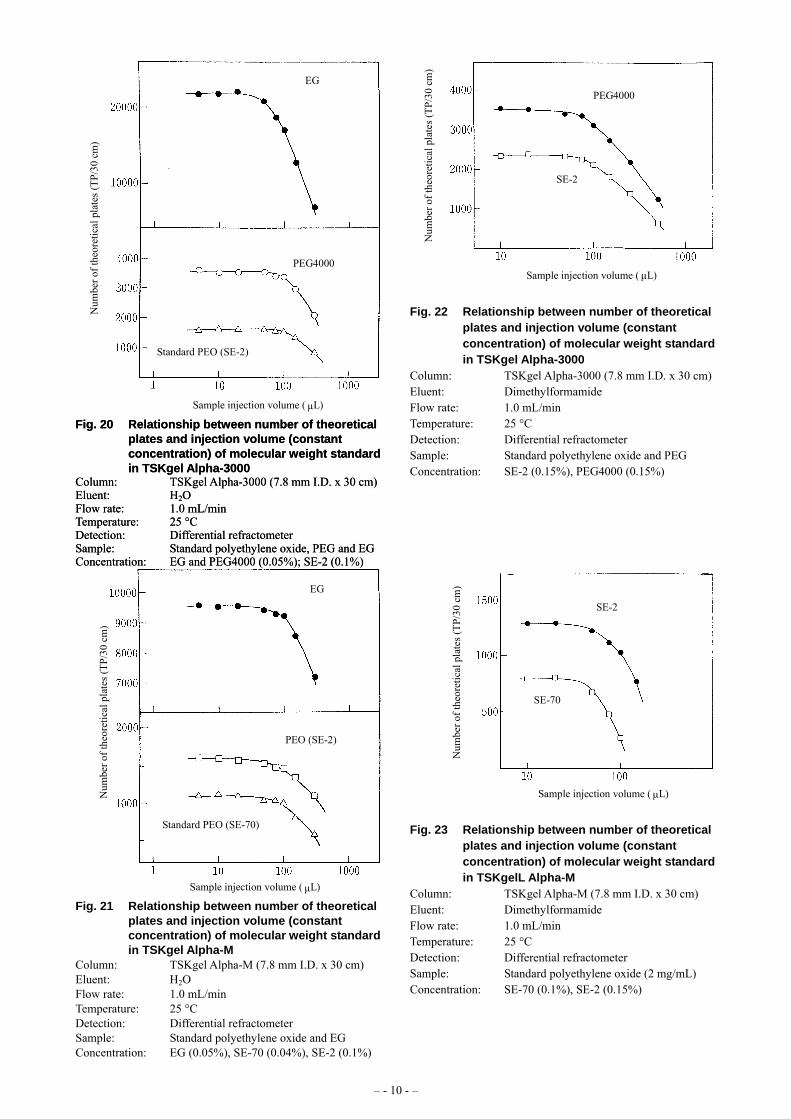
5) Effect of sample injection volume In general, solvent viscosity decreases as the temperature is increased, causing an increase in the number of theoretical plates. Figures 15 to 17 show the temperature dependence of the theoretical plate number of high molecular weight samples in water and DMF systems. Although increases in the theoretical plate number are observed when the temperature is increased, as noted above, in aqueous solvents at high temperatures, a delay is observed due to adsorption of the molecular weight standard. Thus, the temperature under which analysis is performed must be given careful consideration based on the solvent system used.
Similar to what is seen in SEC analyses using THF solvents, with high molecular weight compounds the elution position also depends on the injection volume in polar solvents. Consequently, if strict quality control is an objective, the injection volume must remain constant. Figs. 20 and 21 show the effects of sample injection volume on column theoretical plate number in an aqueous solvent system (PEO) in the TSKgel Alpha-3000 and TSKgel Alpha-M columns, respectively, and Figs. 22 and 23 show the same in a DMF system (PEO). In each of these solvent systems a decrease in the plate number is seen at around 100 μL with both low and high molecular weight samples.
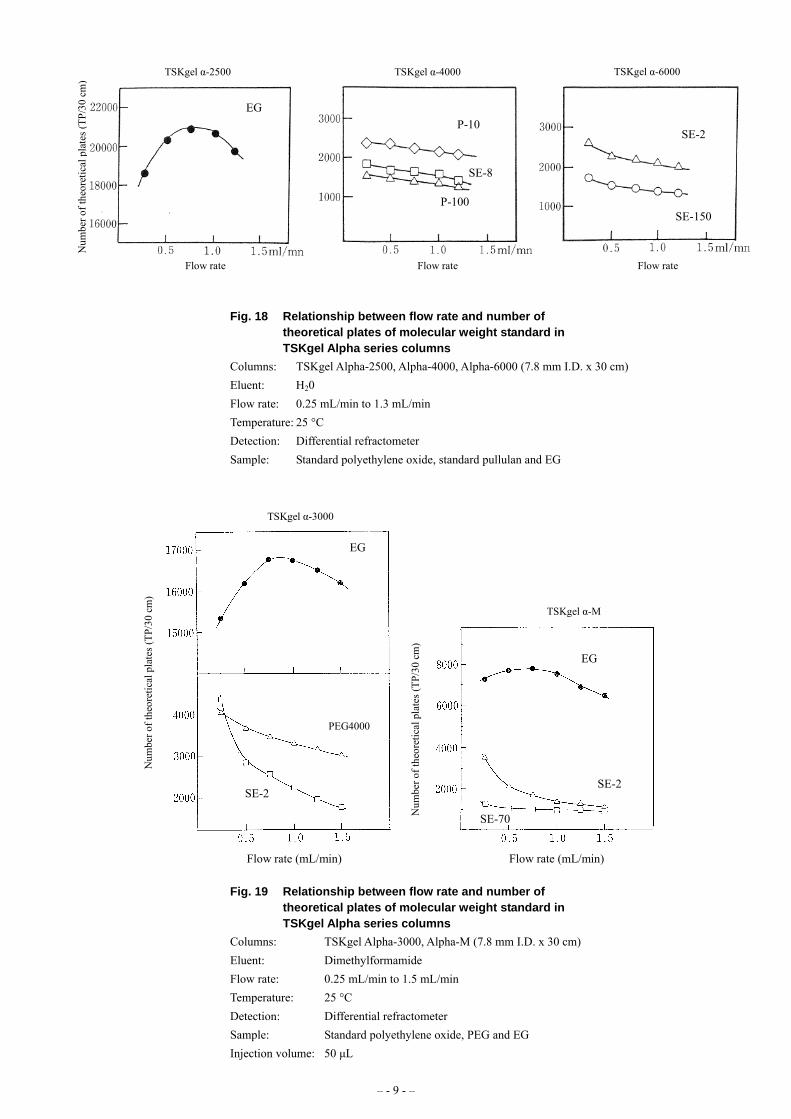
4) Effect of flow rate Figures 18 and 19 show the dependence of column plate
number on the flow rate in aqueous solvent and DMF systems. Normally, the optimal flow rate depends on the particle size of the packing material and the molecular weight of the sample being analyzed. With low molecular weight samples, good results are obtained at a flow rate around 0.7 mL/min, while with high molecular weight samples the best results are obtained at lower flow rates. Organic solvents produced very similar results. Because optimal flow rate depends on the viscosity of the solvent, for analysis to be performed under optimal conditions, it is necessary to understand the relationship between flow rate and separation performance for the solvent being used for analysis.
6) Effect of sample injection concentration As the concentration of the sample increases, a sample
overload effect can appear, reducing column efficiency. This issue must be kept in mind if the objective is to process samples in batches. Figure 24 (TSKgel Alpha 3000) and Figure 25 (TSKgel Alpha-M) show the effects of sample concentration at a constant injection volume on column efficiency in a water system, while Figs. 26 and 27 show the same when a DMF system is used. The load decreases as the molecular weight of the sample increases.
Temperature (°C)
Num
ber o
f the
oret
ical
pla
tes (
TP/3
0 cm
)
Temperature (°C)
TSKgel α-4000 TSKgel α-6000
P-10
SE-8
P-100
SE-2
SE-150
Fig. 15 Relationship between temperature and number of theoretical plates of molecular weight standard in TSKgel Alpha Series
Columns: TSKgel Alpha-4000, Alpha-6000 (7.8 mm I.D. x 30 cm) Eluent: H2O Flow rate: 1.0 mL/min Temperature: 25 °C to 80 °C Detection: Differential refractometer Sample: Standard polyethylene oxide (SE) and standard pullulan (P)
– - 7 - –
Temperature (°C)
Num
ber o
f the
oret
ical
pla
tes (
TP/3
0 cm
)
Temperature (°C)
□ 0.25ml/min△ 0.50ml/min● 1.00ml/min■ 1.25ml/min
PEG4000
SE-2
EG
Fig. 16 Relationship between temperature and number of theoretical plates of molecular weight standard in TSKgel Alpha-3000
Analysis conditions Columns: TSKgel Alpha-3000 (7.8 mm I.D. x 30 cm) Eluent: Dimethylformamide Flow rate: 0.25 mL/min to 1.25 mL/min Temperature: 25 °C to 80 °C Detection: Differential refractometer Sample: Standard polyethylene oxide, PEG and EG Injection volume: 50 μL
Temperature (°C)
Num
ber o
f the
oret
ical
pla
tes (
TP/3
0 cm
)
SE-2
SE-70
EG
Fig. 17 Relationship between temperature and
number of theoretical plates of molecular weight standard in TSKgel Alpha-M
Columns: TSKgel Alpha-M (7.8 mm I.D. x 30 cm) Eluent: Dimethylformamide Flow rate: 1.0 mL/min Temperature: 25 °C to 80 °C Detection: Differential refractometer Sample: Standard polyethylene oxide Injection volume: 50 μL
– - 8 - –
Flow rate
Num
ber o
f the
oret
ical
pla
tes (
TP/3
0 cm
) TSKgel α-2500 TSKgel α-6000
SE-2
TSKgel α-4000
Flow rate Flow rate
SE-150
SE-8
P-100
P-10EG
Fig. 18 Relationship between flow rate and number of theoretical plates of molecular weight standard in TSKgel Alpha series columns
Columns: TSKgel Alpha-2500, Alpha-4000, Alpha-6000 (7.8 mm I.D. x 30 cm) Eluent: H20 Flow rate: 0.25 mL/min to 1.3 mL/min Temperature: 25 °C Detection: Differential refractometer Sample: Standard polyethylene oxide, standard pullulan and EG
PEG4000
Num
ber o
f the
oret
ical
pla
tes (
TP/3
0 cm
)
TSKgel α-3000
TSKgel α-M
EG
Num
ber o
f the
oret
ical
pla
tes (
TP/3
0 cm
)
EG
SE-70
SE-2 SE-2
Flow rate (mL/min) Flow rate (mL/min)
Fig. 19 Relationship between flow rate and number of theoretical plates of molecular weight standard in TSKgel Alpha series columns
Columns: TSKgel Alpha-3000, Alpha-M (7.8 mm I.D. x 30 cm) Eluent: Dimethylformamide Flow rate: 0.25 mL/min to 1.5 mL/min Temperature: 25 °C Detection: Differential refractometer Sample: Standard polyethylene oxide, PEG and EG Injection volume: 50 μL
– - 9 - –
Sample injection volume (
L)
Num
ber o
f the
oret
ical
pla
tes (
TP/3
0 cm
)
Standard PEO (SE-2)
PEG4000
EG
Fig. 20 Relationship between number of theoretical
plates and injection volume (constant concentration) of molecular weight standard in TSKgel Alpha-3000
Fig. 20 Relationship between number of theoretical plates and injection volume (constant concentration) of molecular weight standard in TSKgel Alpha-3000
Column: TSKgel Alpha-3000 (7.8 mm I.D. x 30 cm) Column: TSKgel Alpha-3000 (7.8 mm I.D. x 30 cm) Eluent: H2O Eluent: H2O Flow rate: 1.0 mL/min Flow rate: 1.0 mL/min Temperature: 25 °C Temperature: 25 °C Detection: Differential refractometer Detection: Differential refractometer Sample: Standard polyethylene oxide, PEG and EG Sample: Standard polyethylene oxide, PEG and EG Concentration: EG and PEG4000 (0.05%); SE-2 (0.1%) Concentration: EG and PEG4000 (0.05%); SE-2 (0.1%)
Sample injection volume ( L)
Num
ber o
f the
oret
ical
pla
tes (
TP/3
0 cm
)
Standard PEO (SE-70)
PEO (SE-2)
EG
Fig. 21 Relationship between number of theoretical
plates and injection volume (constant concentration) of molecular weight standard in TSKgel Alpha-M
Column: TSKgel Alpha-M (7.8 mm I.D. x 30 cm) Eluent: H2O Flow rate: 1.0 mL/min Temperature: 25 °C Detection: Differential refractometer Sample: Standard polyethylene oxide and EG Concentration: EG (0.05%), SE-70 (0.04%), SE-2 (0.1%)
Sample injection volume ( L)
Num
ber o
f the
oret
ical
pla
tes (
TP/3
0 cm
)
SE-2
PEG4000
Fig. 22 Relationship between number of theoretical plates and injection volume (constant concentration) of molecular weight standard in TSKgel Alpha-3000
Column: TSKgel Alpha-3000 (7.8 mm I.D. x 30 cm) Eluent: Dimethylformamide Flow rate: 1.0 mL/min Temperature: 25 °C Detection: Differential refractometer Sample: Standard polyethylene oxide and PEG Concentration: SE-2 (0.15%), PEG4000 (0.15%)
Sample injection volume ( )
Num
ber o
f the
oret
ical
pla
tes (
TP/3
0 cm
)
SE-2
PEG4000
L
SE-70
SE-2
Fig. 23 Relationship between number of theoretical plates and injection volume (constant concentration) of molecular weight standard in TSKgelL Alpha-M
Column: TSKgel Alpha-M (7.8 mm I.D. x 30 cm)
μ
μ
μ
μ
Eluent: Dimethylformamide Flow rate: 1.0 mL/min Temperature: 25 °C Detection: Differential refractometer Sample: Standard polyethylene oxide (2 mg/mL) Concentration: SE-70 (0.1%), SE-2 (0.15%)
– - 10 - –
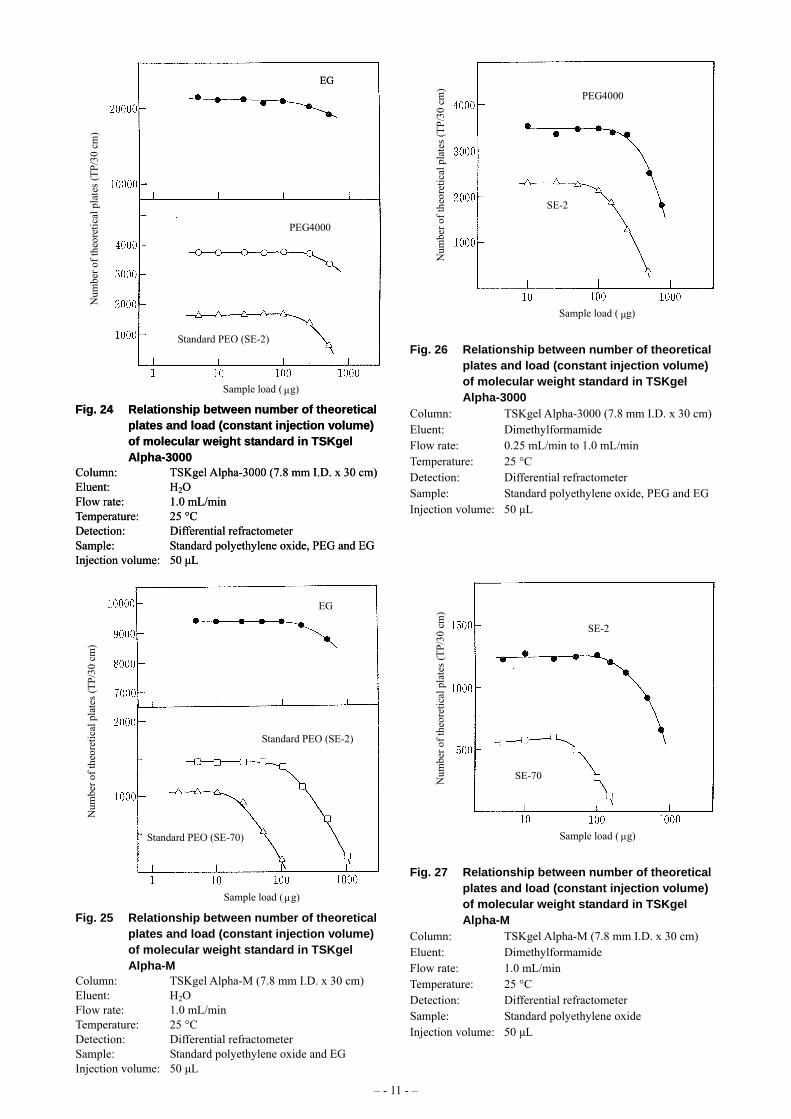
Sample load (
g)
Num
ber o
f the
oret
ical
pla
tes (
TP/3
0 cm
)
Standard PEO (SE-2)
PEG4000
EG EG
Fig. 24 Relationship between number of theoretical
plates and load (constant injection volume) of molecular weight standard in TSKgel Alpha-3000
Fig. 24 Relationship between number of theoretical plates and load (constant injection volume) of molecular weight standard in TSKgel Alpha-3000
Column: TSKgel Alpha-3000 (7.8 mm I.D. x 30 cm) Column: TSKgel Alpha-3000 (7.8 mm I.D. x 30 cm) Eluent: H2O Eluent: H2O Flow rate: 1.0 mL/min Flow rate: 1.0 mL/min Temperature: 25 °C Temperature: 25 °C Detection: Differential refractometer Detection: Differential refractometer Sample: Standard polyethylene oxide, PEG and EG Sample: Standard polyethylene oxide, PEG and EG Injection volume: 50 μL Injection volume: 50 μL
Sample load ( g)
Num
ber o
f the
oret
ical
pla
tes (
TP/3
0 cm
)
Standard PEO (SE-70)
Standard PEO (SE-2)
EG
Fig. 25 Relationship between number of theoretical
plates and load (constant injection volume) of molecular weight standard in TSKgel Alpha-M
Column: TSKgel Alpha-M (7.8 mm I.D. x 30 cm) Eluent: H2O Flow rate: 1.0 mL/min Temperature: 25 °C Detection: Differential refractometer Sample: Standard polyethylene oxide and EG Injection volume: 50 μL
Sample load ( g)
Num
ber o
f the
oret
ical
pla
tes (
TP/3
0 cm
)
SE-2
PEG4000
Fig. 26 Relationship between number of theoretical plates and load (constant injection volume) of molecular weight standard in TSKgel Alpha-3000
Column: TSKgel Alpha-3000 (7.8 mm I.D. x 30 cm) Eluent: Dimethylformamide Flow rate: 0.25 mL/min to 1.0 mL/min Temperature: 25 °C Detection: Differential refractometer Sample: Standard polyethylene oxide, PEG and EG Injection volume: 50 μL
Sample load ( g)
Num
ber o
f the
oret
ical
pla
tes (
TP/3
0 cm
)
SE-70
SE-2
μ
μ
μ
μ
Fig. 27 Relationship between number of theoretical plates and load (constant injection volume) of molecular weight standard in TSKgel Alpha-M
Column: TSKgel Alpha-M (7.8 mm I.D. x 30 cm) Eluent: Dimethylformamide Flow rate: 1.0 mL/min Temperature: 25 °C Detection: Differential refractometer Sample: Standard polyethylene oxide Injection volume: 50 μL
– - 11 - –
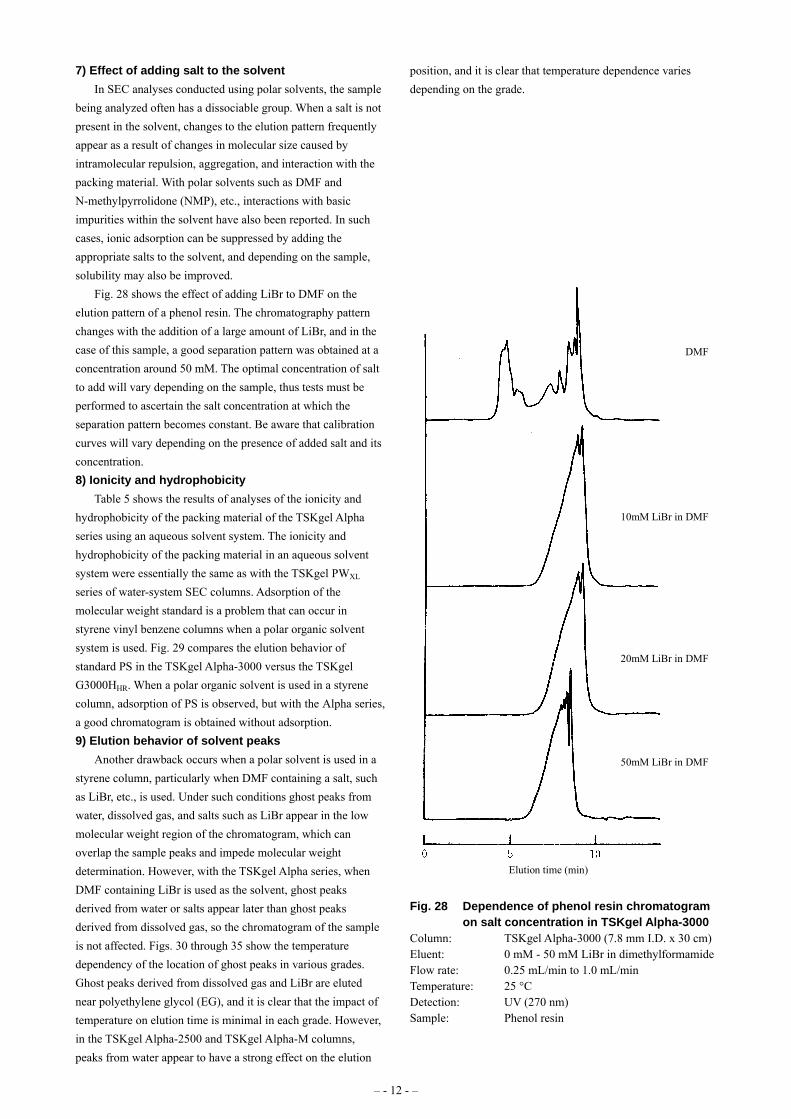
7) Effect of adding salt to the solvent In SEC analyses conducted using polar solvents, the sample
being analyzed often has a dissociable group. When a salt is not present in the solvent, changes to the elution pattern frequently appear as a result of changes in molecular size caused by intramolecular repulsion, aggregation, and interaction with the packing material. With polar solvents such as DMF and N-methylpyrrolidone (NMP), etc., interactions with basic impurities within the solvent have also been reported. In such cases, ionic adsorption can be suppressed by adding the appropriate salts to the solvent, and depending on the sample, solubility may also be improved.
Fig. 28 shows the effect of adding LiBr to DMF on the elution pattern of a phenol resin. The chromatography pattern changes with the addition of a large amount of LiBr, and in the case of this sample, a good separation pattern was obtained at a concentration around 50 mM. The optimal concentration of salt to add will vary depending on the sample, thus tests must be performed to ascertain the salt concentration at which the separation pattern becomes constant. Be aware that calibration curves will vary depending on the presence of added salt and its concentration. 8) Ionicity and hydrophobicity
Table 5 shows the results of analyses of the ionicity and hydrophobicity of the packing material of the TSKgel Alpha series using an aqueous solvent system. The ionicity and hydrophobicity of the packing material in an aqueous solvent system were essentially the same as with the TSKgel PWXL series of water-system SEC columns. Adsorption of the molecular weight standard is a problem that can occur in styrene vinyl benzene columns when a polar organic solvent system is used. Fig. 29 compares the elution behavior of standard PS in the TSKgel Alpha-3000 versus the TSKgel G3000HHR. When a polar organic solvent is used in a styrene column, adsorption of PS is observed, but with the Alpha series, a good chromatogram is obtained without adsorption. 9) Elution behavior of solvent peaks
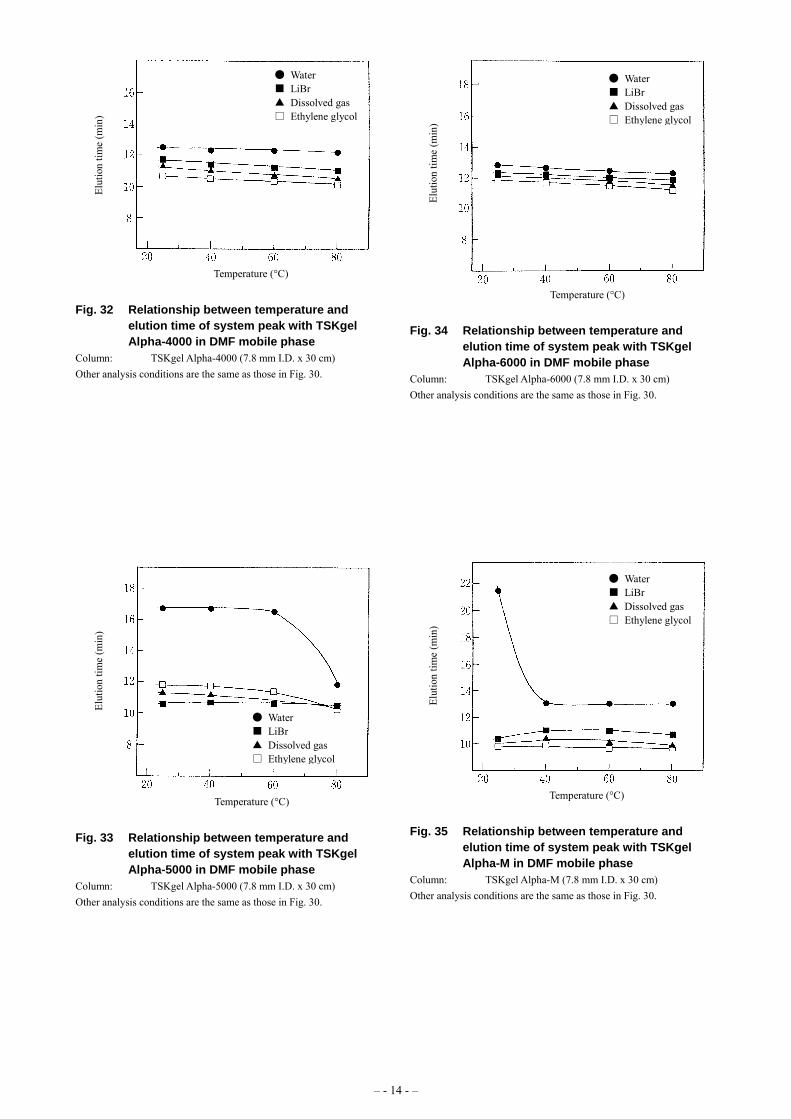
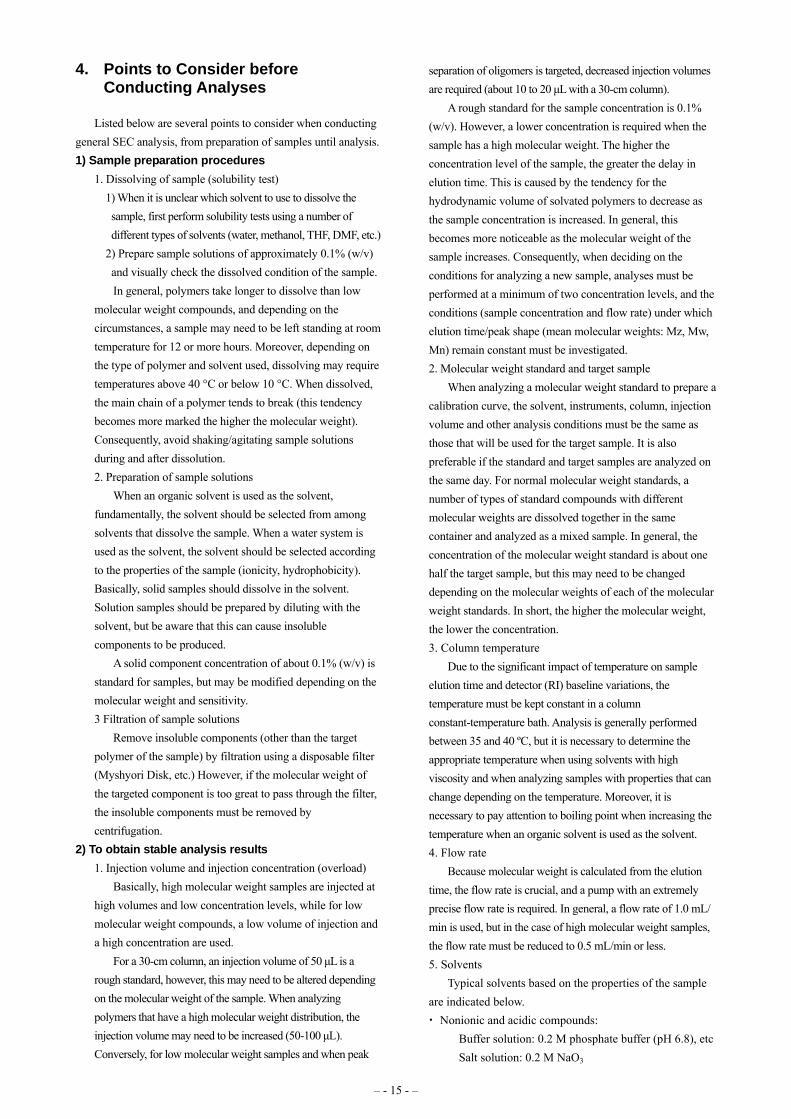
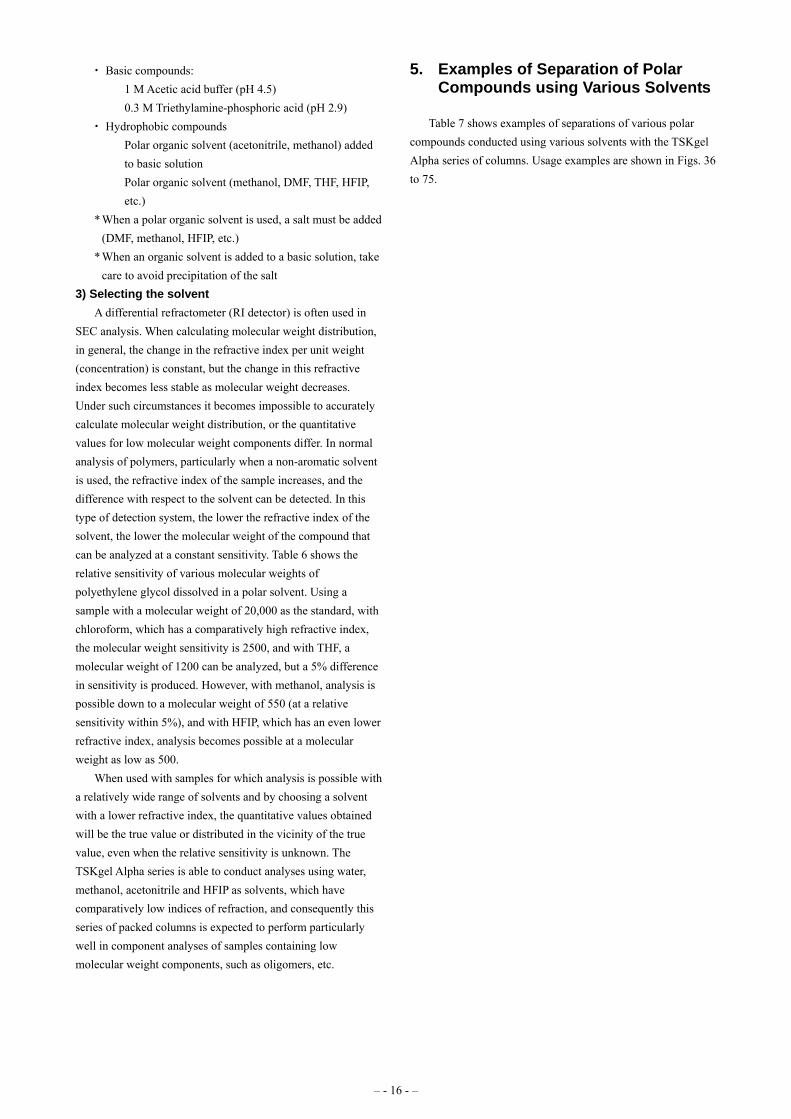
Another drawback occurs when a polar solvent is used in a styrene column, particularly when DMF containing a salt, such as LiBr, etc., is used. Under such conditions ghost peaks from water, dissolved gas, and salts such as LiBr appear in the low molecular weight region of the chromatogram, which can overlap the sample peaks and impede molecular weight determination. However, with the TSKgel Alpha series, when DMF containing LiBr is used as the solvent, ghost peaks derived from water or salts appear later than ghost peaks derived from dissolved gas, so the chromatogram of the sample is not affected. Figs. 30 through 35 show the temperature dependency of the location of ghost peaks in various grades. Ghost peaks derived from dissolved gas and LiBr are eluted near polyethylene glycol (EG), and it is clear that the impact of temperature on elution time is minimal in each grade. However, in the TSKgel Alpha-2500 and TSKgel Alpha-M columns, peaks from water appear to have a strong effect on the elution
position, and it is clear that temperature dependence varies depending on the grade.
Elution time (min)
50mM LiBr in DMF
20mM LiBr in DMF
10mM LiBr in DMF
DMF
Fig. 28 Dependence of phenol resin chromatogram on salt concentration in TSKgel Alpha-3000
Column: TSKgel Alpha-3000 (7.8 mm I.D. x 30 cm) Eluent: 0 mM - 50 mM LiBr in dimethylformamide Flow rate: 0.25 mL/min to 1.0 mL/min Temperature: 25 °C Detection: UV (270 nm) Sample: Phenol resin
– - 12 - –
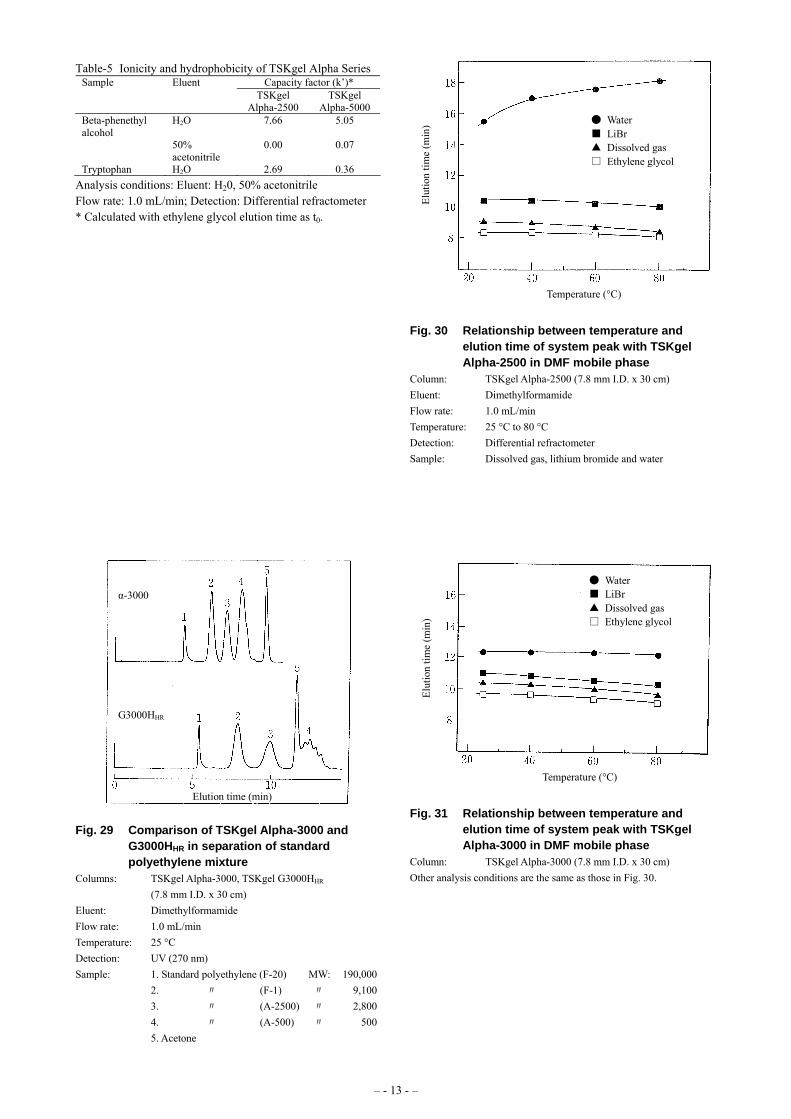
Table-5 Ionicity and hydrophobicity of TSKgel Alpha Series Capacity factor (k’)* Sample Eluent
TSKgel Alpha-2500
TSKgel Alpha-5000
Beta-phenethyl alcohol
H2O 7.66 5.05
50% acetonitrile
0.00 0.07
Tryptophan H2O 2.69 0.36
Analysis conditions: Eluent: H20, 50% acetonitrile Flow rate: 1.0 mL/min; Detection: Differential refractometer * Calculated with ethylene glycol elution time as t0.
Elution time (min)
G3000HHR
α-3000
Fig. 29 Comparison of TSKgel Alpha-3000 and G3000HHR in separation of standard polyethylene mixture
Columns: TSKgel Alpha-3000, TSKgel G3000HHR (7.8 mm I.D. x 30 cm)
Eluent: Dimethylformamide Flow rate: 1.0 mL/min Temperature: 25 °C Detection: UV (270 nm) Sample: 1. Standard polyethylene (F-20) MW: 190,000 2. 〃 (F-1) 〃 9,100 3. 〃 (A-2500) 〃 2,800 4. 〃 (A-500) 〃 500 5. Acetone
Temperature (°C)
Elut
ion
time
(min
) ● Water ■ LiBr ▲ Dissolved gas□ Ethylene glycol
Fig. 30 Relationship between temperature and elution time of system peak with TSKgel Alpha-2500 in DMF mobile phase
Column: TSKgel Alpha-2500 (7.8 mm I.D. x 30 cm) Eluent: Dimethylformamide Flow rate: 1.0 mL/min Temperature: 25 °C to 80 °C Detection: Differential refractometer Sample: Dissolved gas, lithium bromide and water
Temperature (°C)
Elut
ion
time
(min
)
● Water ■ LiBr ▲ Dissolved gas□ Ethylene glycol
Fig. 31 Relationship between temperature and elution time of system peak with TSKgel Alpha-3000 in DMF mobile phase
Column: TSKgel Alpha-3000 (7.8 mm I.D. x 30 cm) Other analysis conditions are the same as those in Fig. 30.
– - 13 - –
Temperature (°C)
Elut
ion
time
(min
)
● Water ■ LiBr ▲ Dissolved gas□ Ethylene glycol
Temperature (°C)
Elut
ion
time
(min
) ● Water ■ LiBr ▲ Dissolved gas□ Ethylene glycol
Fig. 32 Relationship between temperature and elution time of system peak with TSKgel Alpha-4000 in DMF mobile phase
Fig. 34 Relationship between temperature and
elution time of system peak with TSKgel Alpha-6000 in DMF mobile phase Column: TSKgel Alpha-4000 (7.8 mm I.D. x 30 cm)
Other analysis conditions are the same as those in Fig. 30. Column: TSKgel Alpha-6000 (7.8 mm I.D. x 30 cm) Other analysis conditions are the same as those in Fig. 30.
Temperature (°C)
Elut
ion
time
(min
)
● Water ■ LiBr ▲ Dissolved gas□ Ethylene glycol
Temperature (°C)
Elut
ion
time
(min
)
● Water ■ LiBr ▲ Dissolved gas□ Ethylene glycol
Fig. 35 Relationship between temperature and
elution time of system peak with TSKgel Alpha-M in DMF mobile phase
Fig. 33 Relationship between temperature and elution time of system peak with TSKgel Alpha-5000 in DMF mobile phase
Column: TSKgel Alpha-M (7.8 mm I.D. x 30 cm) Column: TSKgel Alpha-5000 (7.8 mm I.D. x 30 cm) Other analysis conditions are the same as those in Fig. 30. Other analysis conditions are the same as those in Fig. 30.
– - 14 - –
4. Points to Consider before Conducting Analyses
Listed below are several points to consider when conducting general SEC analysis, from preparation of samples until analysis. 1) Sample preparation procedures
1. Dissolving of sample (solubility test) 1) When it is unclear which solvent to use to dissolve the sample, first perform solubility tests using a number of different types of solvents (water, methanol, THF, DMF, etc.)
2) Prepare sample solutions of approximately 0.1% (w/v) and visually check the dissolved condition of the sample. In general, polymers take longer to dissolve than low
molecular weight compounds, and depending on the circumstances, a sample may need to be left standing at room temperature for 12 or more hours. Moreover, depending on the type of polymer and solvent used, dissolving may require temperatures above 40 °C or below 10 °C. When dissolved, the main chain of a polymer tends to break (this tendency becomes more marked the higher the molecular weight). Consequently, avoid shaking/agitating sample solutions during and after dissolution. 2. Preparation of sample solutions
When an organic solvent is used as the solvent, fundamentally, the solvent should be selected from among solvents that dissolve the sample. When a water system is used as the solvent, the solvent should be selected according to the properties of the sample (ionicity, hydrophobicity). Basically, solid samples should dissolve in the solvent. Solution samples should be prepared by diluting with the solvent, but be aware that this can cause insoluble components to be produced.
A solid component concentration of about 0.1% (w/v) is standard for samples, but may be modified depending on the molecular weight and sensitivity. 3 Filtration of sample solutions
Remove insoluble components (other than the target polymer of the sample) by filtration using a disposable filter (Myshyori Disk, etc.) However, if the molecular weight of the targeted component is too great to pass through the filter, the insoluble components must be removed by centrifugation.
2) To obtain stable analysis results 1. Injection volume and injection concentration (overload)
Basically, high molecular weight samples are injected at high volumes and low concentration levels, while for low molecular weight compounds, a low volume of injection and a high concentration are used.
For a 30-cm column, an injection volume of 50 μL is a rough standard, however, this may need to be altered depending on the molecular weight of the sample. When analyzing polymers that have a high molecular weight distribution, the injection volume may need to be increased (50-100 μL). Conversely, for low molecular weight samples and when peak
separation of oligomers is targeted, decreased injection volumes are required (about 10 to 20 μL with a 30-cm column).
A rough standard for the sample concentration is 0.1% (w/v). However, a lower concentration is required when the sample has a high molecular weight. The higher the concentration level of the sample, the greater the delay in elution time. This is caused by the tendency for the hydrodynamic volume of solvated polymers to decrease as the sample concentration is increased. In general, this becomes more noticeable as the molecular weight of the sample increases. Consequently, when deciding on the conditions for analyzing a new sample, analyses must be performed at a minimum of two concentration levels, and the conditions (sample concentration and flow rate) under which elution time/peak shape (mean molecular weights: Mz, Mw, Mn) remain constant must be investigated. 2. Molecular weight standard and target sample
When analyzing a molecular weight standard to prepare a calibration curve, the solvent, instruments, column, injection volume and other analysis conditions must be the same as those that will be used for the target sample. It is also preferable if the standard and target samples are analyzed on the same day. For normal molecular weight standards, a number of types of standard compounds with different molecular weights are dissolved together in the same container and analyzed as a mixed sample. In general, the concentration of the molecular weight standard is about one half the target sample, but this may need to be changed depending on the molecular weights of each of the molecular weight standards. In short, the higher the molecular weight, the lower the concentration. 3. Column temperature
Due to the significant impact of temperature on sample elution time and detector (RI) baseline variations, the temperature must be kept constant in a column constant-temperature bath. Analysis is generally performed between 35 and 40 ºC, but it is necessary to determine the appropriate temperature when using solvents with high viscosity and when analyzing samples with properties that can change depending on the temperature. Moreover, it is necessary to pay attention to boiling point when increasing the temperature when an organic solvent is used as the solvent. 4. Flow rate
Because molecular weight is calculated from the elution time, the flow rate is crucial, and a pump with an extremely precise flow rate is required. In general, a flow rate of 1.0 mL/ min is used, but in the case of high molecular weight samples, the flow rate must be reduced to 0.5 mL/min or less. 5. Solvents
Typical solvents based on the properties of the sample are indicated below. Nonionic and acidic compounds:
Buffer solution: 0.2 M phosphate buffer (pH 6.8), etc Salt solution: 0.2 M NaO3
– - 15 - –
Basic compounds: 1 M Acetic acid buffer (pH 4.5) 0.3 M Triethylamine-phosphoric acid (pH 2.9)
Hydrophobic compounds Polar organic solvent (acetonitrile, methanol) added to basic solution Polar organic solvent (methanol, DMF, THF, HFIP, etc.)
* When a polar organic solvent is used, a salt must be added (DMF, methanol, HFIP, etc.)
* When an organic solvent is added to a basic solution, take care to avoid precipitation of the salt
3) Selecting the solvent A differential refractometer (RI detector) is often used in
SEC analysis. When calculating molecular weight distribution, in general, the change in the refractive index per unit weight (concentration) is constant, but the change in this refractive index becomes less stable as molecular weight decreases. Under such circumstances it becomes impossible to accurately calculate molecular weight distribution, or the quantitative values for low molecular weight components differ. In normal analysis of polymers, particularly when a non-aromatic solvent is used, the refractive index of the sample increases, and the difference with respect to the solvent can be detected. In this type of detection system, the lower the refractive index of the solvent, the lower the molecular weight of the compound that can be analyzed at a constant sensitivity. Table 6 shows the relative sensitivity of various molecular weights of polyethylene glycol dissolved in a polar solvent. Using a sample with a molecular weight of 20,000 as the standard, with chloroform, which has a comparatively high refractive index, the molecular weight sensitivity is 2500, and with THF, a molecular weight of 1200 can be analyzed, but a 5% difference in sensitivity is produced. However, with methanol, analysis is possible down to a molecular weight of 550 (at a relative sensitivity within 5%), and with HFIP, which has an even lower refractive index, analysis becomes possible at a molecular weight as low as 500.
When used with samples for which analysis is possible with a relatively wide range of solvents and by choosing a solvent with a lower refractive index, the quantitative values obtained will be the true value or distributed in the vicinity of the true value, even when the relative sensitivity is unknown. The TSKgel Alpha series is able to conduct analyses using water, methanol, acetonitrile and HFIP as solvents, which have comparatively low indices of refraction, and consequently this series of packed columns is expected to perform particularly well in component analyses of samples containing low molecular weight components, such as oligomers, etc.
5. Examples of Separation of Polar Compounds using Various Solvents
Table 7 shows examples of separations of various polar compounds conducted using various solvents with the TSKgel Alpha series of columns. Usage examples are shown in Figs. 36 to 75.
– - 16 - –
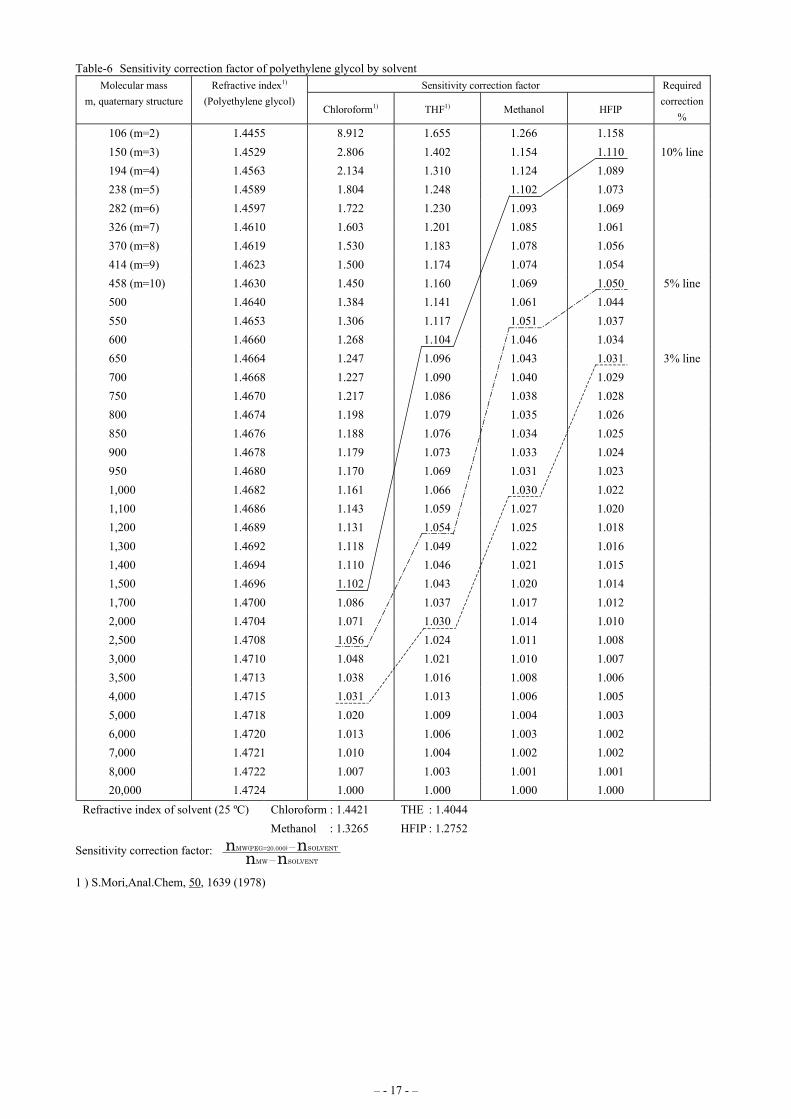
Table-6 Sensitivity correction factor of polyethylene glycol by solvent
– - 17 - –
nMW(PEG=20.000)-nSOLVENT
Sensitivity correction factor Molecular mass m, quaternary structure
Refractive index1) (Polyethylene glycol)
Chloroform1) THF1) Methanol HFIP
Required correction
% 106 (m=2) 1.4455 8.912 1.655 1.266 1.158 150 (m=3) 1.4529 2.806 1.402 1.154 1.110 10% line194 (m=4) 1.4563 2.134 1.310 1.124 1.089 238 (m=5) 1.4589 1.804 1.248 1.102 1.073 282 (m=6) 1.4597 1.722 1.230 1.093 1.069 326 (m=7) 1.4610 1.603 1.201 1.085 1.061 370 (m=8) 1.4619 1.530 1.183 1.078 1.056 414 (m=9) 1.4623 1.500 1.174 1.074 1.054 458 (m=10) 1.4630 1.450 1.160 1.069 1.050 5% line500 1.4640 1.384 1.141 1.061 1.044 550 1.4653 1.306 1.117 1.051 1.037 600 1.4660 1.268 1.104 1.046 1.034 650 1.4664 1.247 1.096 1.043 1.031 3% line700 1.4668 1.227 1.090 1.040 1.029 750 1.4670 1.217 1.086 1.038 1.028 800 1.4674 1.198 1.079 1.035 1.026 850 1.4676 1.188 1.076 1.034 1.025 900 1.4678 1.179 1.073 1.033 1.024 950 1.4680 1.170 1.069 1.031 1.023 1,000 1.4682 1.161 1.066 1.030 1.022 1,100 1.4686 1.143 1.059 1.027 1.020 1,200 1.4689 1.131 1.054 1.025 1.018 1,300 1.4692 1.118 1.049 1.022 1.016 1,400 1.4694 1.110 1.046 1.021 1.015 1,500 1.4696 1.102 1.043 1.020 1.014 1,700 1.4700 1.086 1.037 1.017 1.012 2,000 1.4704 1.071 1.030 1.014 1.010 2,500 1.4708 1.056 1.024 1.011 1.008 3,000 1.4710 1.048 1.021 1.010 1.007 3,500 1.4713 1.038 1.016 1.008 1.006 4,000 1.4715 1.031 1.013 1.006 1.005 5,000 1.4718 1.020 1.009 1.004 1.003 6,000 1.4720 1.013 1.006 1.003 1.002 7,000 1.4721 1.010 1.004 1.002 1.002 8,000 1.4722 1.007 1.003 1.001 1.001 20,000 1.4724 1.000 1.000 1.000 1.000
Refractive index of solvent (25 ºC) Chloroform : 1.4421 THE : 1.4044 Methanol : 1.3265 HFIP : 1.2752
Sensitivity correction factor: nMW-nSOLVENT 1 ) S.Mori,Anal.Chem, 50, 1639 (1978)
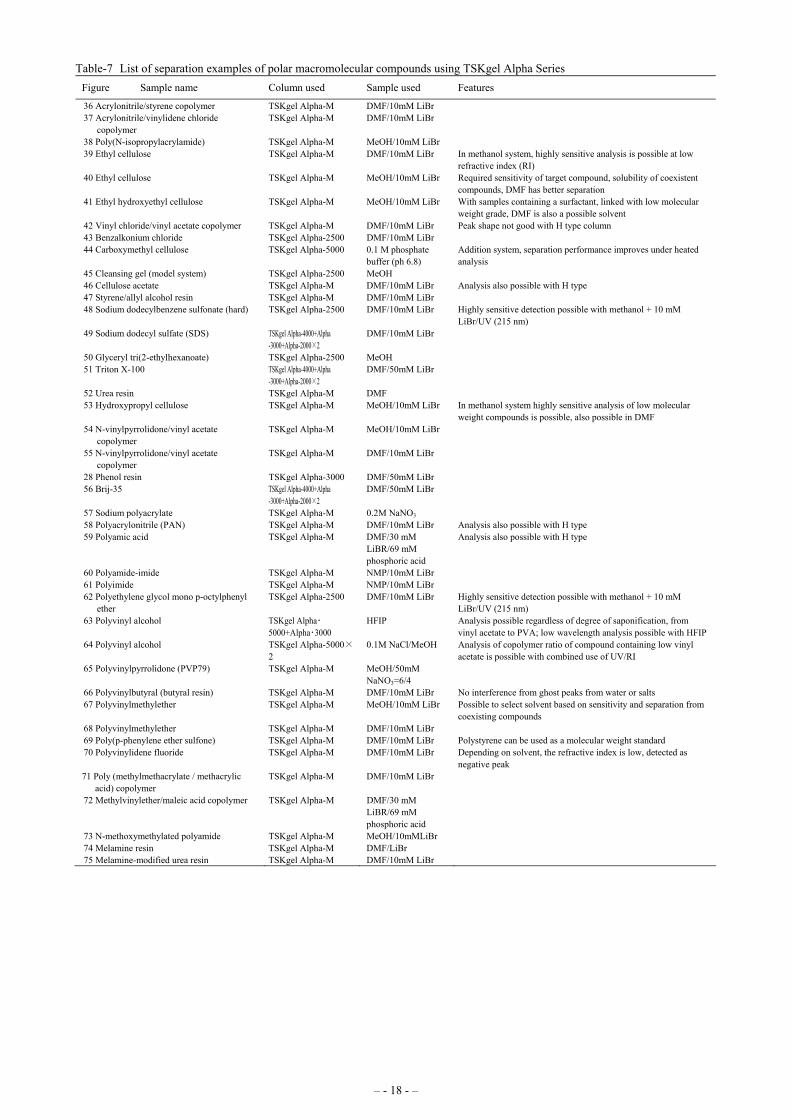
Table-7 List of separation examples of polar macromolecular compounds using TSKgel Alpha Series Figure Sample name Column used Sample used Features
36 Acrylonitrile/styrene copolymer TSKgel Alpha-M DMF/10mM LiBr 37 Acrylonitrile/vinylidene chloride
copolymer TSKgel Alpha-M DMF/10mM LiBr
38 Poly(N-isopropylacrylamide) TSKgel Alpha-M MeOH/10mM LiBr 39 Ethyl cellulose TSKgel Alpha-M DMF/10mM LiBr In methanol system, highly sensitive analysis is possible at low
refractive index (RI) 40 Ethyl cellulose TSKgel Alpha-M MeOH/10mM LiBr Required sensitivity of target compound, solubility of coexistent
compounds, DMF has better separation 41 Ethyl hydroxyethyl cellulose TSKgel Alpha-M MeOH/10mM LiBr With samples containing a surfactant, linked with low molecular
weight grade, DMF is also a possible solvent 42 Vinyl chloride/vinyl acetate copolymer TSKgel Alpha-M DMF/10mM LiBr Peak shape not good with H type column 43 Benzalkonium chloride TSKgel Alpha-2500 DMF/10mM LiBr 44 Carboxymethyl cellulose TSKgel Alpha-5000 0.1 M phosphate
buffer (ph 6.8) Addition system, separation performance improves under heated analysis
45 Cleansing gel (model system) TSKgel Alpha-2500 MeOH 46 Cellulose acetate TSKgel Alpha-M DMF/10mM LiBr Analysis also possible with H type 47 Styrene/allyl alcohol resin TSKgel Alpha-M DMF/10mM LiBr 48 Sodium dodecylbenzene sulfonate (hard) TSKgel Alpha-2500 DMF/10mM LiBr Highly sensitive detection possible with methanol + 10 mM
LiBr/UV (215 nm) 49 Sodium dodecyl sulfate (SDS) TSKgel Alpha-4000+Alpha
-3000+Alpha-2000×2 DMF/10mM LiBr
50 Glyceryl tri(2-ethylhexanoate) TSKgel Alpha-2500 MeOH 51 Triton X-100 TSKgel Alpha-4000+Alpha
-3000+Alpha-2000×2 DMF/50mM LiBr
52 Urea resin TSKgel Alpha-M DMF 53 Hydroxypropyl cellulose TSKgel Alpha-M MeOH/10mM LiBr In methanol system highly sensitive analysis of low molecular
weight compounds is possible, also possible in DMF 54 N-vinylpyrrolidone/vinyl acetate
copolymer TSKgel Alpha-M MeOH/10mM LiBr
55 N-vinylpyrrolidone/vinyl acetate copolymer
TSKgel Alpha-M DMF/10mM LiBr
28 Phenol resin TSKgel Alpha-3000 DMF/50mM LiBr 56 Brij-35 TSKgel Alpha-4000+Alpha
-3000+Alpha-2000×2 DMF/50mM LiBr
57 Sodium polyacrylate TSKgel Alpha-M 0.2M NaNO3 58 Polyacrylonitrile (PAN) TSKgel Alpha-M DMF/10mM LiBr Analysis also possible with H type 59 Polyamic acid TSKgel Alpha-M DMF/30 mM
LiBR/69 mM phosphoric acid
Analysis also possible with H type
60 Polyamide-imide TSKgel Alpha-M NMP/10mM LiBr 61 Polyimide TSKgel Alpha-M NMP/10mM LiBr 62 Polyethylene glycol mono p-octylphenyl
ether TSKgel Alpha-2500 DMF/10mM LiBr Highly sensitive detection possible with methanol + 10 mM
LiBr/UV (215 nm) 63 Polyvinyl alcohol TSKgel Alpha・
5000+Alpha・3000 HFIP Analysis possible regardless of degree of saponification, from
vinyl acetate to PVA; low wavelength analysis possible with HFIP 64 Polyvinyl alcohol TSKgel Alpha-5000×
2 0.1M NaCl/MeOH Analysis of copolymer ratio of compound containing low vinyl
acetate is possible with combined use of UV/RI 65 Polyvinylpyrrolidone (PVP79) TSKgel Alpha-M MeOH/50mM
NaNO3=6/4
66 Polyvinylbutyral (butyral resin) TSKgel Alpha-M DMF/10mM LiBr No interference from ghost peaks from water or salts 67 Polyvinylmethylether TSKgel Alpha-M MeOH/10mM LiBr Possible to select solvent based on sensitivity and separation from
coexisting compounds 68 Polyvinylmethylether TSKgel Alpha-M DMF/10mM LiBr 69 Poly(p-phenylene ether sulfone) TSKgel Alpha-M DMF/10mM LiBr Polystyrene can be used as a molecular weight standard 70 Polyvinylidene fluoride TSKgel Alpha-M DMF/10mM LiBr Depending on solvent, the refractive index is low, detected as
negative peak 71 Poly (methylmethacrylate / methacrylic
acid) copolymer TSKgel Alpha-M DMF/10mM LiBr
72 Methylvinylether/maleic acid copolymer TSKgel Alpha-M DMF/30 mM LiBR/69 mM phosphoric acid
73 N-methoxymethylated polyamide TSKgel Alpha-M MeOH/10mMLiBr 74 Melamine resin TSKgel Alpha-M DMF/LiBr 75 Melamine-modified urea resin TSKgel Alpha-M DMF/10mM LiBr
– - 18 - –
[mV]
[min]
[mV]
[min]
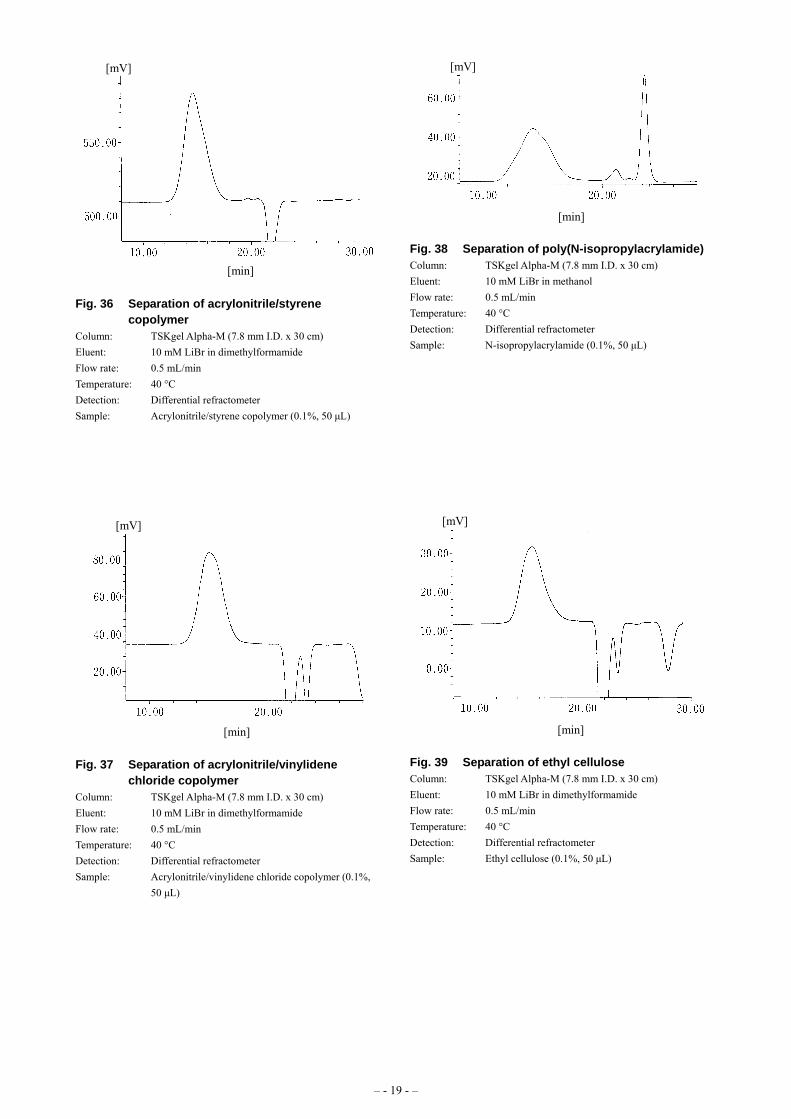
Fig. 38 Separation of poly(N-isopropylacrylamide) Column: TSKgel Alpha-M (7.8 mm I.D. x 30 cm) Eluent: 10 mM LiBr in methanol Flow rate: 0.5 mL/min Fig. 36 Separation of acrylonitrile/styrene
copolymer Temperature: 40 °C Detection: Differential refractometer
Column: TSKgel Alpha-M (7.8 mm I.D. x 30 cm) Sample: N-isopropylacrylamide (0.1%, 50 μL)
Eluent: 10 mM LiBr in dimethylformamide
Flow rate: 0.5 mL/min
Temperature: 40 °C
Detection: Differential refractometer
Sample: Acrylonitrile/styrene copolymer (0.1%, 50 μL)
[mV]
[min]
[mV]
[min]
Fig. 39 Separation of ethyl cellulose Fig. 37 Separation of acrylonitrile/vinylidene chloride copolymer Column: TSKgel Alpha-M (7.8 mm I.D. x 30 cm)
Eluent: 10 mM LiBr in dimethylformamide Column: TSKgel Alpha-M (7.8 mm I.D. x 30 cm) Flow rate: 0.5 mL/min Eluent: 10 mM LiBr in dimethylformamide Temperature: 40 °C Flow rate: 0.5 mL/min Detection: Differential refractometer Temperature: 40 °C Sample: Ethyl cellulose (0.1%, 50 μL) Detection: Differential refractometer
Sample: Acrylonitrile/vinylidene chloride copolymer (0.1%, 50 μL)
– - 19 - –
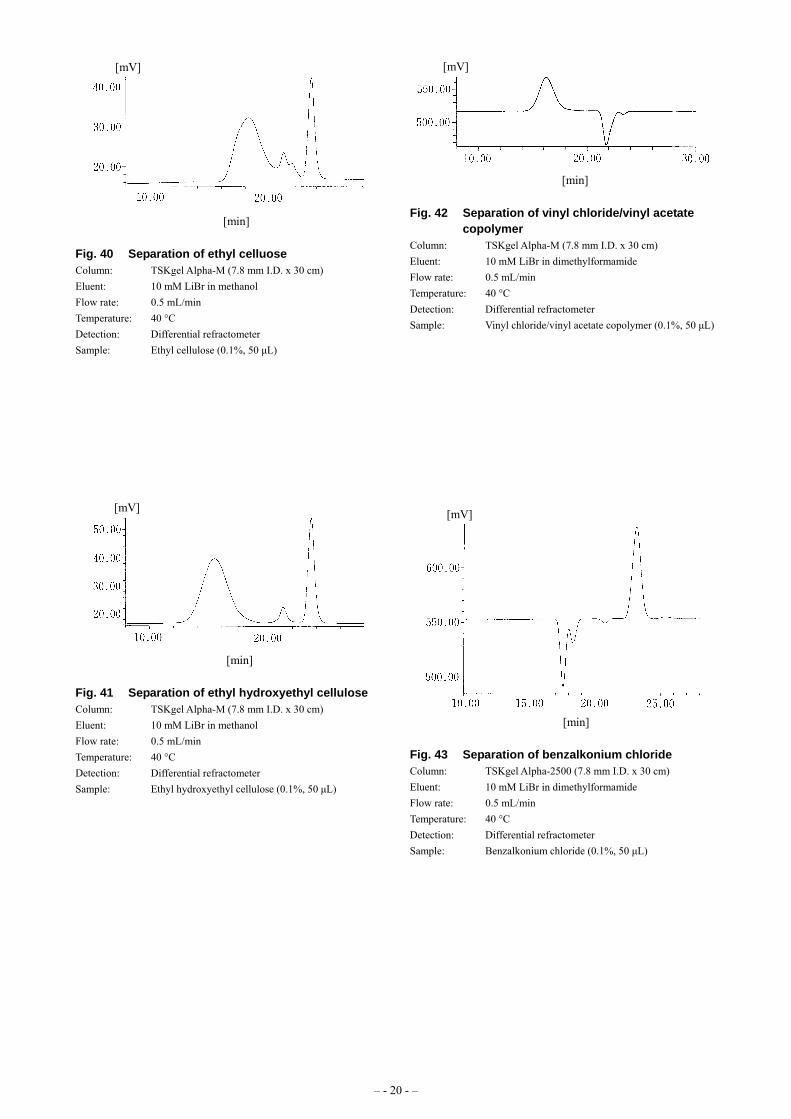
[mV]
[min]
Fig. 40 Separation of ethyl celluose Column: TSKgel Alpha-M (7.8 mm I.D. x 30 cm) Eluent: 10 mM LiBr in methanol Flow rate: 0.5 mL/min Temperature: 40 °C Detection: Differential refractometer Sample: Ethyl cellulose (0.1%, 50 μL)
[mV]
[min]
Fig. 41 Separation of ethyl hydroxyethyl cellulose Column: TSKgel Alpha-M (7.8 mm I.D. x 30 cm) Eluent: 10 mM LiBr in methanol Flow rate: 0.5 mL/min Temperature: 40 °C Detection: Differential refractometer Sample: Ethyl hydroxyethyl cellulose (0.1%, 50 μL)
[mV]
[min]
Fig. 42 Separation of vinyl chloride/vinyl acetate copolymer
Column: TSKgel Alpha-M (7.8 mm I.D. x 30 cm) Eluent: 10 mM LiBr in dimethylformamide Flow rate: 0.5 mL/min Temperature: 40 °C Detection: Differential refractometer Sample: Vinyl chloride/vinyl acetate copolymer (0.1%, 50 μL)
[mV]
[min]
Fig. 43 Separation of benzalkonium chloride Column: TSKgel Alpha-2500 (7.8 mm I.D. x 30 cm) Eluent: 10 mM LiBr in dimethylformamide Flow rate: 0.5 mL/min Temperature: 40 °C Detection: Differential refractometer Sample: Benzalkonium chloride (0.1%, 50 μL)
– - 20 - –
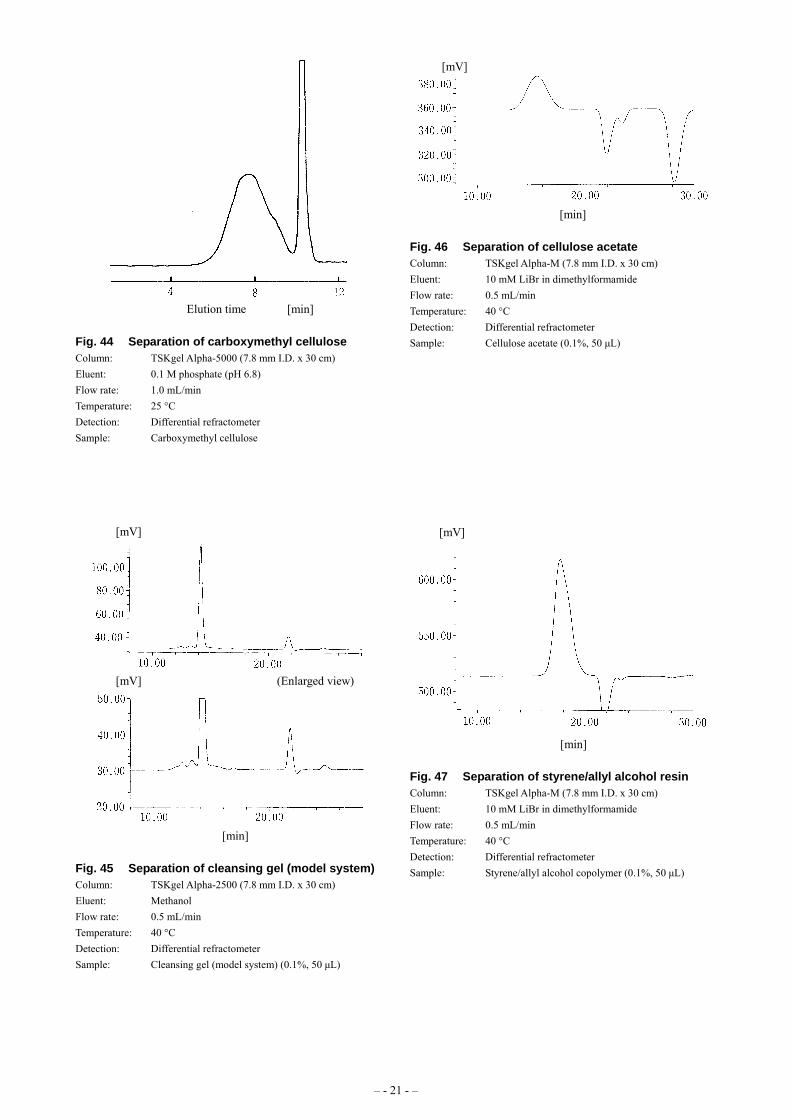
[min] Elution time
Fig. 44 Separation of carboxymethyl cellulose Column: TSKgel Alpha-5000 (7.8 mm I.D. x 30 cm) Eluent: 0.1 M phosphate (pH 6.8) Flow rate: 1.0 mL/min Temperature: 25 °C Detection: Differential refractometer Sample: Carboxymethyl cellulose
[mV]
[min]
[mV] (Enlarged view)
Fig. 45 Separation of cleansing gel (model system) Column: TSKgel Alpha-2500 (7.8 mm I.D. x 30 cm) Eluent: Methanol Flow rate: 0.5 mL/min Temperature: 40 °C Detection: Differential refractometer Sample: Cleansing gel (model system) (0.1%, 50 μL)
[mV]
[min]
Fig. 46 Separation of cellulose acetate Column: TSKgel Alpha-M (7.8 mm I.D. x 30 cm) Eluent: 10 mM LiBr in dimethylformamide Flow rate: 0.5 mL/min Temperature: 40 °C Detection: Differential refractometer Sample: Cellulose acetate (0.1%, 50 μL)
[mV]
[min]
Fig. 47 Separation of styrene/allyl alcohol resin Column: TSKgel Alpha-M (7.8 mm I.D. x 30 cm) Eluent: 10 mM LiBr in dimethylformamide Flow rate: 0.5 mL/min Temperature: 40 °C Detection: Differential refractometer Sample: Styrene/allyl alcohol copolymer (0.1%, 50 μL)
– - 21 - –
[mV]
[min]
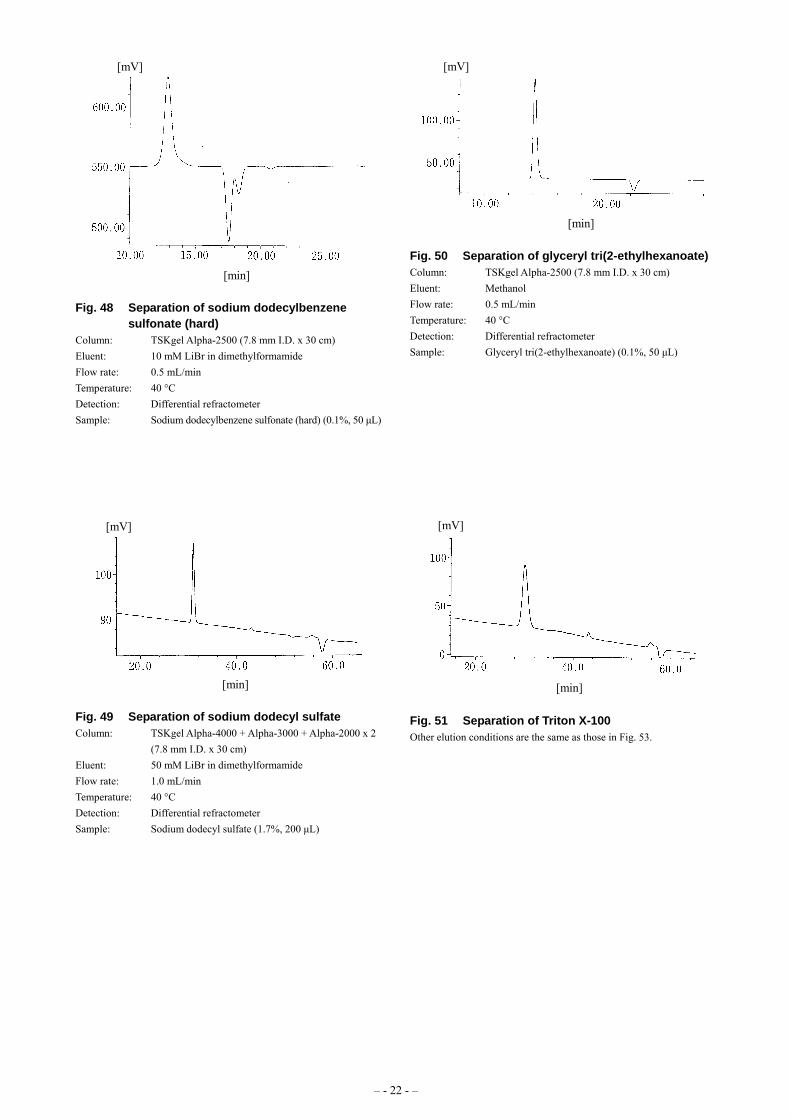
Fig. 48 Separation of sodium dodecylbenzene sulfonate (hard)
Column: TSKgel Alpha-2500 (7.8 mm I.D. x 30 cm) Eluent: 10 mM LiBr in dimethylformamide Flow rate: 0.5 mL/min Temperature: 40 °C Detection: Differential refractometer Sample: Sodium dodecylbenzene sulfonate (hard) (0.1%, 50 μL)
[mV]
[min]
Fig. 49 Separation of sodium dodecyl sulfate Column: TSKgel Alpha-4000 + Alpha-3000 + Alpha-2000 x 2
(7.8 mm I.D. x 30 cm) Eluent: 50 mM LiBr in dimethylformamide Flow rate: 1.0 mL/min Temperature: 40 °C Detection: Differential refractometer Sample: Sodium dodecyl sulfate (1.7%, 200 μL)
[mV]
[min]
Fig. 50 Separation of glyceryl tri(2-ethylhexanoate) Column: TSKgel Alpha-2500 (7.8 mm I.D. x 30 cm) Eluent: Methanol Flow rate: 0.5 mL/min Temperature: 40 °C Detection: Differential refractometer Sample: Glyceryl tri(2-ethylhexanoate) (0.1%, 50 μL)
[mV]
[min]
Fig. 51 Separation of Triton X-100 Other elution conditions are the same as those in Fig. 53.
– - 22 - –
[mV]
[min]
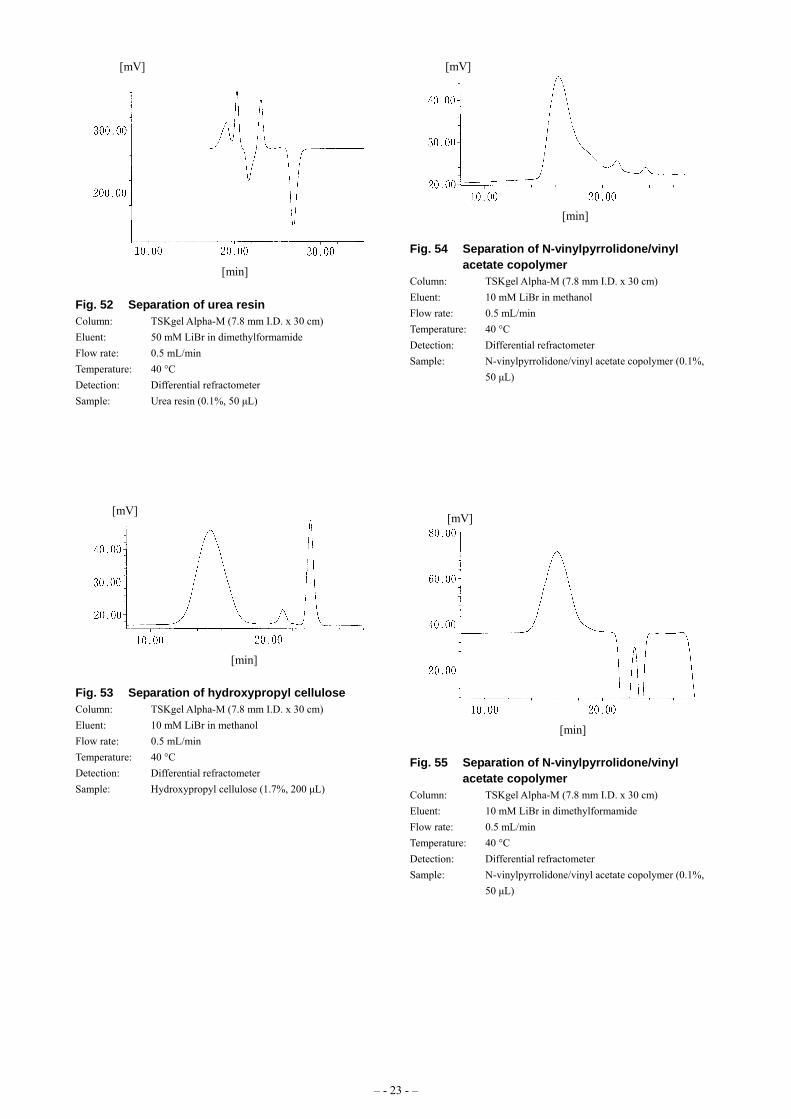
Fig. 52 Separation of urea resin Column: TSKgel Alpha-M (7.8 mm I.D. x 30 cm) Eluent: 50 mM LiBr in dimethylformamide Flow rate: 0.5 mL/min Temperature: 40 °C Detection: Differential refractometer Sample: Urea resin (0.1%, 50 μL)
[mV]
[min]
Fig. 53 Separation of hydroxypropyl cellulose Column: TSKgel Alpha-M (7.8 mm I.D. x 30 cm) Eluent: 10 mM LiBr in methanol Flow rate: 0.5 mL/min Temperature: 40 °C Detection: Differential refractometer Sample: Hydroxypropyl cellulose (1.7%, 200 μL)
[mV]
[min]
Fig. 54 Separation of N-vinylpyrrolidone/vinyl acetate copolymer
Column: TSKgel Alpha-M (7.8 mm I.D. x 30 cm) Eluent: 10 mM LiBr in methanol Flow rate: 0.5 mL/min Temperature: 40 °C Detection: Differential refractometer Sample: N-vinylpyrrolidone/vinyl acetate copolymer (0.1%,
50 μL)
[mV]
[min]
Fig. 55 Separation of N-vinylpyrrolidone/vinyl acetate copolymer
Column: TSKgel Alpha-M (7.8 mm I.D. x 30 cm) Eluent: 10 mM LiBr in dimethylformamide Flow rate: 0.5 mL/min Temperature: 40 °C Detection: Differential refractometer Sample: N-vinylpyrrolidone/vinyl acetate copolymer (0.1%,
50 μL)
– - 23 - –
[mV]
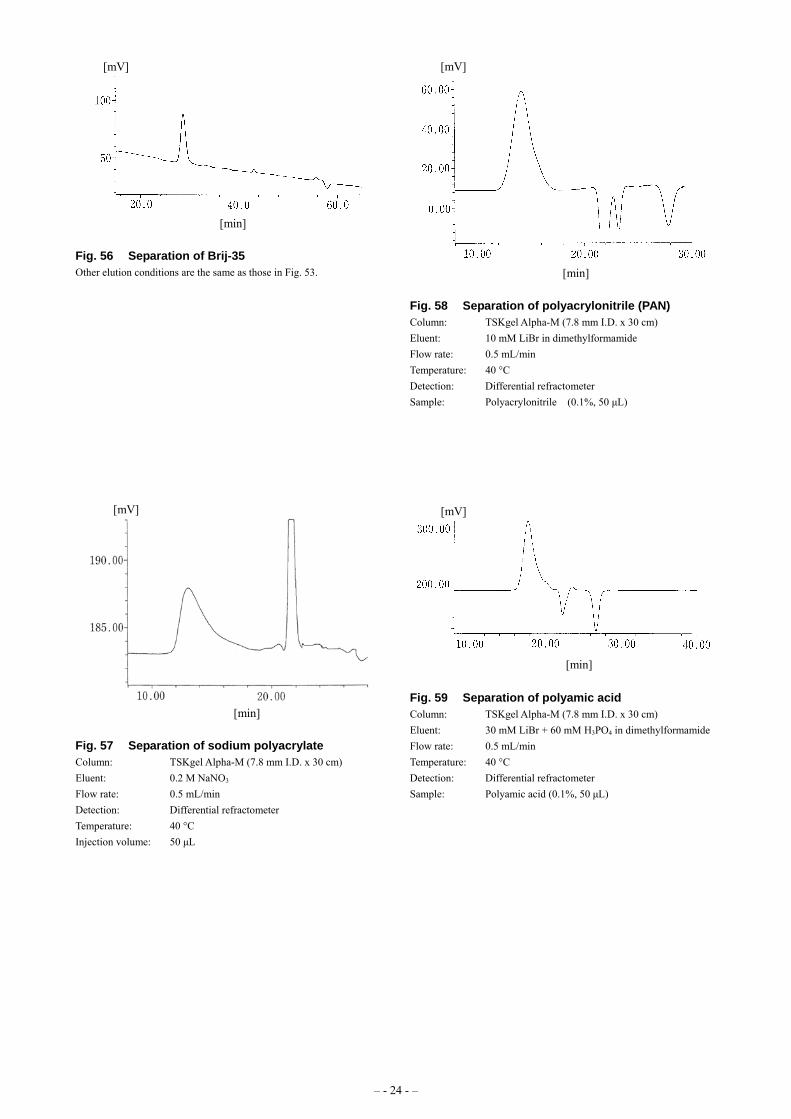
[min]
Fig. 56 Separation of Brij-35 Other elution conditions are the same as those in Fig. 53.
[mV]
[min]
Fig. 57 Separation of sodium polyacrylate Column: TSKgel Alpha-M (7.8 mm I.D. x 30 cm) Eluent: 0.2 M NaNO3 Flow rate: 0.5 mL/min Detection: Differential refractometer Temperature: 40 °C Injection volume: 50 μL
[mV]
[min]
Fig. 58 Separation of polyacrylonitrile (PAN) Column: TSKgel Alpha-M (7.8 mm I.D. x 30 cm) Eluent: 10 mM LiBr in dimethylformamide Flow rate: 0.5 mL/min Temperature: 40 °C Detection: Differential refractometer Sample: Polyacrylonitrile (0.1%, 50 μL)
[mV]
[min]
Fig. 59 Separation of polyamic acid Column: TSKgel Alpha-M (7.8 mm I.D. x 30 cm) Eluent: 30 mM LiBr + 60 mM H3PO4 in dimethylformamide Flow rate: 0.5 mL/min Temperature: 40 °C Detection: Differential refractometer Sample: Polyamic acid (0.1%, 50 μL)
– - 24 - –
[mV]
[min]
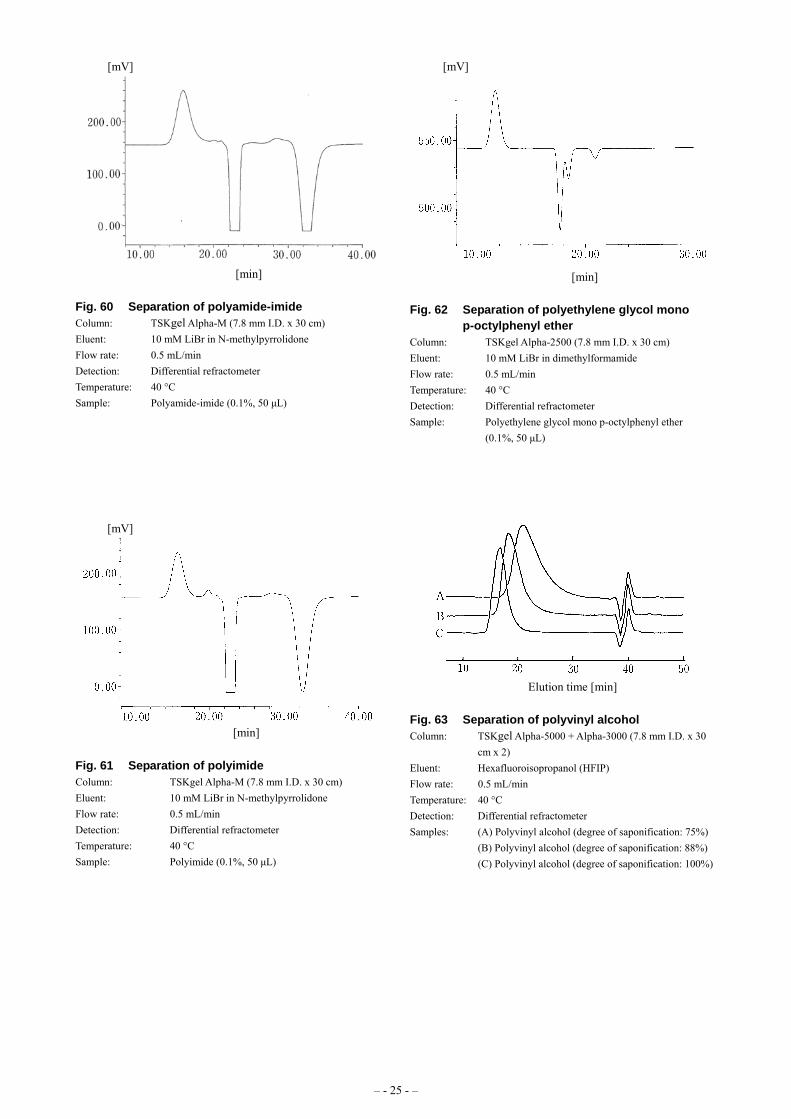
Fig. 60 Separation of polyamide-imide Column: TSKgel Alpha-M (7.8 mm I.D. x 30 cm) Eluent: 10 mM LiBr in N-methylpyrrolidone Flow rate: 0.5 mL/min Detection: Differential refractometer Temperature: 40 °C Sample: Polyamide-imide (0.1%, 50 μL)
[mV]
[min]
Fig. 61 Separation of polyimide Column: TSKgel Alpha-M (7.8 mm I.D. x 30 cm) Eluent: 10 mM LiBr in N-methylpyrrolidone Flow rate: 0.5 mL/min Detection: Differential refractometer Temperature: 40 °C Sample: Polyimide (0.1%, 50 μL)
[mV]
[min]
Fig. 62 Separation of polyethylene glycol mono p-octylphenyl ether
Column: TSKgel Alpha-2500 (7.8 mm I.D. x 30 cm) Eluent: 10 mM LiBr in dimethylformamide Flow rate: 0.5 mL/min Temperature: 40 °C Detection: Differential refractometer Sample: Polyethylene glycol mono p-octylphenyl ether
(0.1%, 50 μL)
Elution time [min]
Fig. 63 Separation of polyvinyl alcohol Column: TSKgel Alpha-5000 + Alpha-3000 (7.8 mm I.D. x 30
cm x 2) Eluent: Hexafluoroisopropanol (HFIP) Flow rate: 0.5 mL/min Temperature: 40 °C Detection: Differential refractometer Samples: (A) Polyvinyl alcohol (degree of saponification: 75%) (B) Polyvinyl alcohol (degree of saponification: 88%) (C) Polyvinyl alcohol (degree of saponification: 100%)
– - 25 - –
Elution time [min]
Fig. 64 Separation of polyvinyl alcohol Column: TSKgel Alpha-5000 (7.8 mm I.D. x 30 cm x 2) Eluent: 0.1 M NaCl/methanol = 1/1 Flow rate: 0.5 mL/min Temperature: 40 °C Detection: (A) Differential refractometer (B) UV (210 nm) Sample: (B) Polyvinyl alcohol (degree of saponification: 88%)
[mV]
[min]
Fig. 65 Separation of polyvinylpyrrolidone (PVP79) Column: TSKgel Alpha-M (7.8 mm I.D. x 30 cm) Eluent: 0.1 M NaCl aq/methanol = 1/1 Flow rate: 0.5 mL/min Temperature: 40 °C Detection: Differential refractometer Sample: Polyvinylpyrrolidone Injection volume: 50 μL
[mV]
[min]
Fig. 66 Separation of polyvinylbutyral Column: TSKgel Alpha-M (7.8 mm I.D. x 30 cm) Eluent: 10 mM LiBr in dimethylformamide Flow rate: 0.5 mL/min Temperature: 40 °C Detection: Differential refractometer Sample: Polyvinylbutyral (0.1%, 50 μL)
[mV]
[min]
Fig. 67 Separation of polyvinylmethylether Column: TSKgel Alpha-M (7.8 mm I.D. x 30 cm) Eluent: 10 mM LiBr in methanol Flow rate: 0.5 mL/min Temperature: 40 °C Detection: Differential refractometer Samples: Polyvinylmethyl ether (0.1%, 50 μL)
– - 26 - –
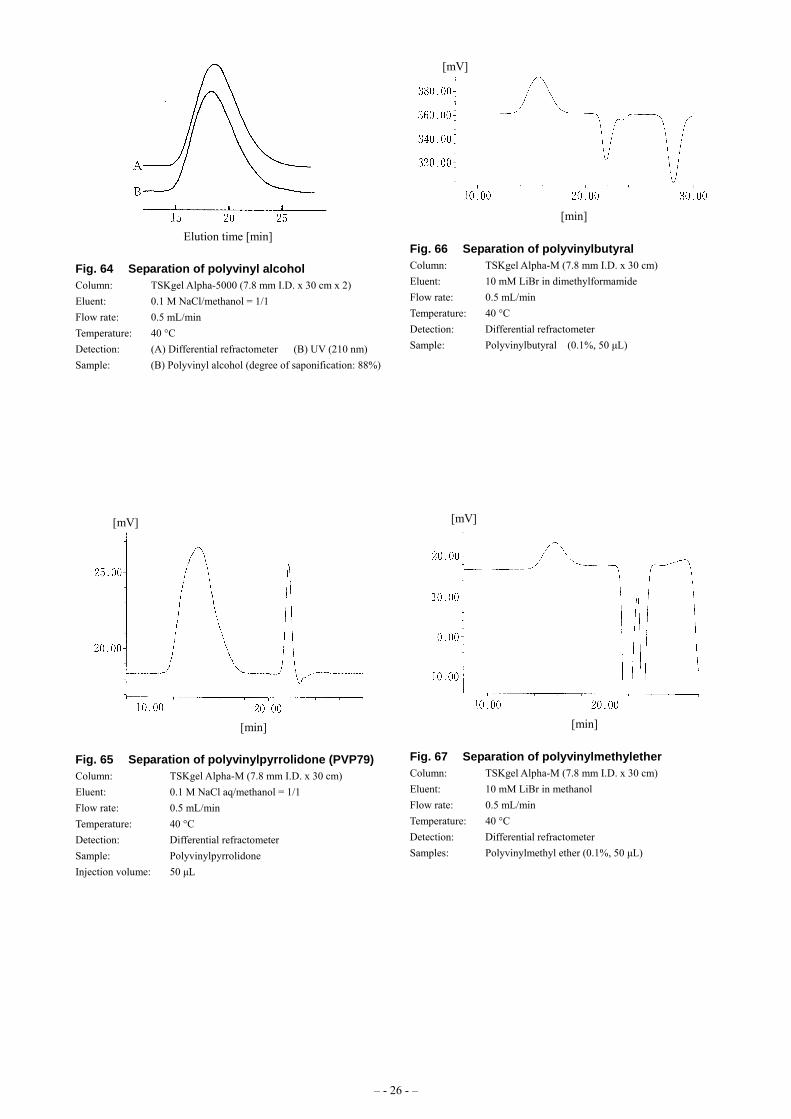
[mV]
[min]
Fig. 68 Separation of polyvinylmethylether Column: TSKgel Alpha-M (7.8 mm I.D. x 30 cm) Eluent: 10 mM LiBr in dimethylformamide Flow rate: 0.5 mL/min Temperature: 40 °C Detection: Differential refractometer Sample: Polyvinylmethylether (0.1%, 50 μL)
[mV]
[min]
Fig. 69 Separation of poly(p-phenylene ether sulfone)
Column: TSKgel Alpha-M (7.8 mm I.D. x 30 cm) Eluent: 10 mM LiBr in dimethylformamide Flow rate: 0.5 mL/min Temperature: 40 °C Detection: Differential refractometer Sample: Poly (p-phenylene ether sulfone) (0.1%, 50 μL)
[mV]
[min]
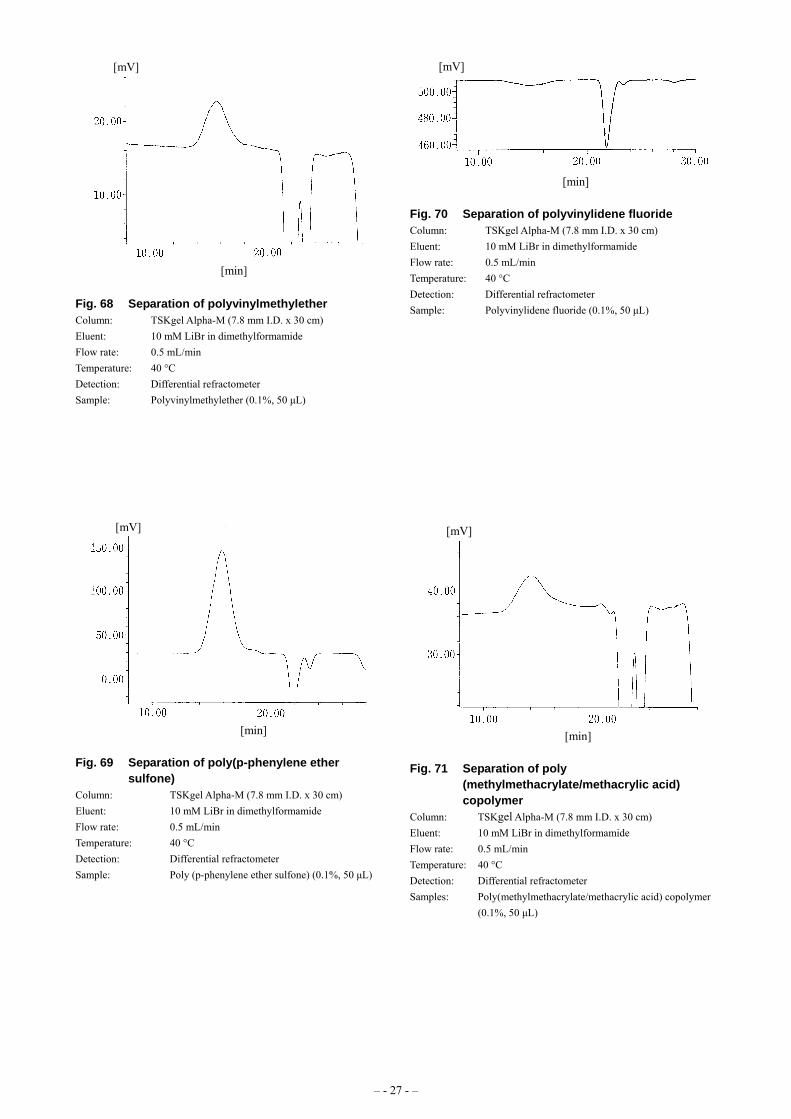
Fig. 70 Separation of polyvinylidene fluoride Column: TSKgel Alpha-M (7.8 mm I.D. x 30 cm) Eluent: 10 mM LiBr in dimethylformamide Flow rate: 0.5 mL/min Temperature: 40 °C Detection: Differential refractometer Sample: Polyvinylidene fluoride (0.1%, 50 μL)
[min]
[mV]
Fig. 71 Separation of poly (methylmethacrylate/methacrylic acid) copolymer
Column: TSKgel Alpha-M (7.8 mm I.D. x 30 cm) Eluent: 10 mM LiBr in dimethylformamide Flow rate: 0.5 mL/min Temperature: 40 °C Detection: Differential refractometer Samples: Poly(methylmethacrylate/methacrylic acid) copolymer
(0.1%, 50 μL)
– - 27 - –
[mV]
[min]
Fig. 72 Separation of methylvinylether/maleic acid copolymer
Column: TSKgel Alpha-M (7.8 mm I.D. x 30 cm x 2) Eluent: 30 mM LiBr + 60 mM phosphoric acid in
dimethylformamide Flow rate: 0.5 mL/min Temperature: 40 °C Detection: Differential refractometer Sample: Methylvinylether/maleic acid copolymer (0.1%, 50
μL)
[mV]
[min]
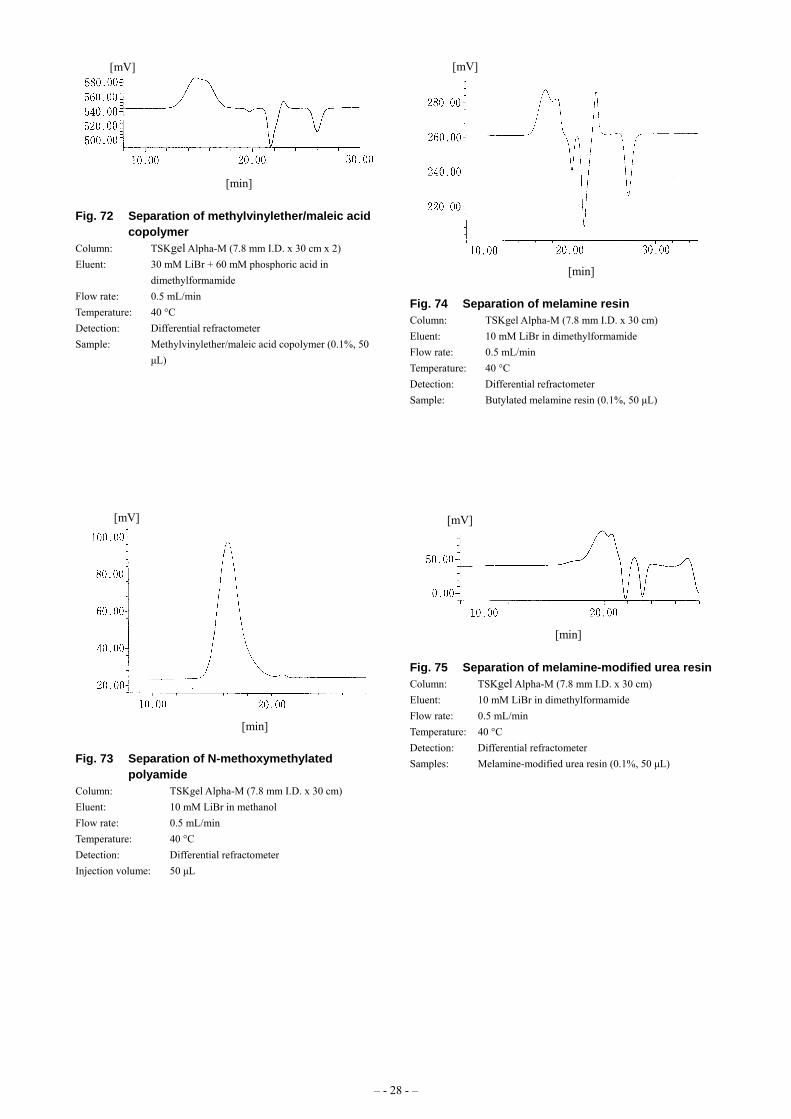
Fig. 73 Separation of N-methoxymethylated polyamide
Column: TSKgel Alpha-M (7.8 mm I.D. x 30 cm) Eluent: 10 mM LiBr in methanol Flow rate: 0.5 mL/min Temperature: 40 °C Detection: Differential refractometer Injection volume: 50 μL
[mV]
[min]
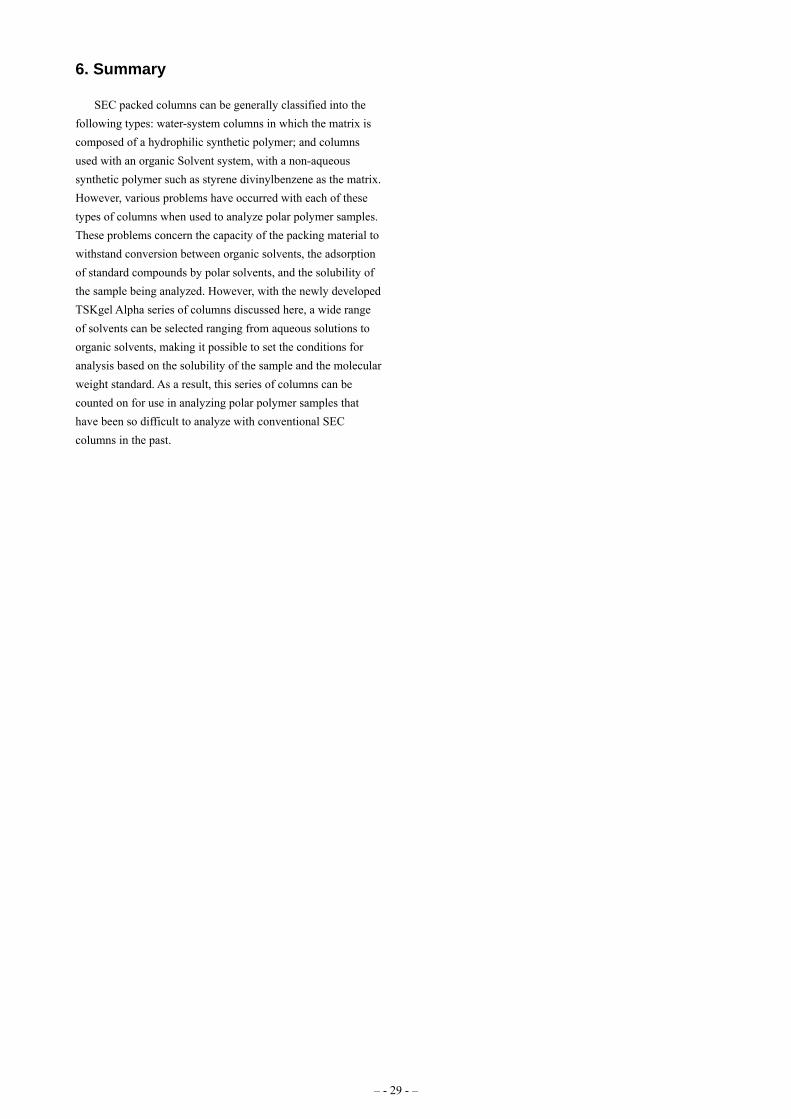
Fig. 74 Separation of melamine resin Column: TSKgel Alpha-M (7.8 mm I.D. x 30 cm) Eluent: 10 mM LiBr in dimethylformamide Flow rate: 0.5 mL/min Temperature: 40 °C Detection: Differential refractometer Sample: Butylated melamine resin (0.1%, 50 μL)
[min]
[mV]
Fig. 75 Separation of melamine-modified urea resin Column: TSKgel Alpha-M (7.8 mm I.D. x 30 cm) Eluent: 10 mM LiBr in dimethylformamide Flow rate: 0.5 mL/min Temperature: 40 °C Detection: Differential refractometer Samples: Melamine-modified urea resin (0.1%, 50 μL)
– - 28 - –
– - 29 - –
6. Summary
SEC packed columns can be generally classified into the following types: water-system columns in which the matrix is composed of a hydrophilic synthetic polymer; and columns used with an organic Solvent system, with a non-aqueous synthetic polymer such as styrene divinylbenzene as the matrix. However, various problems have occurred with each of these types of columns when used to analyze polar polymer samples. These problems concern the capacity of the packing material to withstand conversion between organic solvents, the adsorption of standard compounds by polar solvents, and the solubility of the sample being analyzed. However, with the newly developed TSKgel Alpha series of columns discussed here, a wide range of solvents can be selected ranging from aqueous solutions to organic solvents, making it possible to set the conditions for analysis based on the solubility of the sample and the molecular weight standard. As a result, this series of columns can be counted on for use in analyzing polar polymer samples that have been so difficult to analyze with conventional SEC columns in the past.