Polyester μ-assay chip for stem cell studies · A polystyrene-based microfluidic device with...
15
Polyester μ-assay chip for stem cell studies Francesco Piraino, Šeila Selimović, Marco Adamo, Alessandro Pero, Sam Manoucheri, Sang Bok Kim, Danilo Demarchi, and Ali Khademhosseini Citation: Biomicrofluidics 6, 044109 (2012); doi: 10.1063/1.4766300 View online: http://dx.doi.org/10.1063/1.4766300 View Table of Contents: http://scitation.aip.org/content/aip/journal/bmf/6/4?ver=pdfcov Published by the AIP Publishing Articles you may be interested in Interaction between drug delivery vehicles and cells under the effect of shear stress Biomicrofluidics 9, 052605 (2015); 10.1063/1.4923324 Experimental demonstration of bindingless signal delivery in human cells via microfluidics J. Appl. Phys. 116, 044702 (2014); 10.1063/1.4891017 A polystyrene-based microfluidic device with three-dimensional interconnected microporous walls for perfusion cell culture Biomicrofluidics 8, 046505 (2014); 10.1063/1.4894409 An integrated microfluidic cell array for apoptosis and proliferation analysis induction of breast cancer cells Biomicrofluidics 4, 044104 (2010); 10.1063/1.3497376 Herceptin functionalized microfluidic polydimethylsiloxane devices for the capture of human epidermal growth factor receptor 2 positive circulating breast cancer cells Biomicrofluidics 4, 032205 (2010); 10.1063/1.3480573 This article is copyrighted as indicated in the article. Reuse of AIP content is subject to the terms at: http://scitation.aip.org/termsconditions. Downloaded to IP: 18.7.29.240 On: Wed, 19 Aug 2015 20:51:52
Transcript of Polyester μ-assay chip for stem cell studies · A polystyrene-based microfluidic device with...

Polyester μ-assay chip for stem cell studiesFrancesco Piraino, Šeila Selimović, Marco Adamo, Alessandro Pero, Sam Manoucheri, Sang Bok Kim, DaniloDemarchi, and Ali Khademhosseini Citation: Biomicrofluidics 6, 044109 (2012); doi: 10.1063/1.4766300 View online: http://dx.doi.org/10.1063/1.4766300 View Table of Contents: http://scitation.aip.org/content/aip/journal/bmf/6/4?ver=pdfcov Published by the AIP Publishing Articles you may be interested in Interaction between drug delivery vehicles and cells under the effect of shear stress Biomicrofluidics 9, 052605 (2015); 10.1063/1.4923324 Experimental demonstration of bindingless signal delivery in human cells via microfluidics J. Appl. Phys. 116, 044702 (2014); 10.1063/1.4891017 A polystyrene-based microfluidic device with three-dimensional interconnected microporous walls for perfusioncell culture Biomicrofluidics 8, 046505 (2014); 10.1063/1.4894409 An integrated microfluidic cell array for apoptosis and proliferation analysis induction of breast cancer cells Biomicrofluidics 4, 044104 (2010); 10.1063/1.3497376 Herceptin functionalized microfluidic polydimethylsiloxane devices for the capture of human epidermal growthfactor receptor 2 positive circulating breast cancer cells Biomicrofluidics 4, 032205 (2010); 10.1063/1.3480573
This article is copyrighted as indicated in the article. Reuse of AIP content is subject to the terms at: http://scitation.aip.org/termsconditions. Downloaded to IP: 18.7.29.240
On: Wed, 19 Aug 2015 20:51:52
Polyester l-assay chip for stem cell studies
Francesco Piraino,1,2,3,a) �Seila Selimovic,2,3,a) Marco Adamo,2,3,4
Alessandro Pero,2,3,4 Sam Manoucheri,2,3 Sang Bok Kim,2,3
Danilo Demarchi,4 and Ali Khademhosseini2,3,5,b)
1Bioengineering Department, Politecnico di Milano, Piazza Leonardo da Vinci 32,20133 Milano, Italy2Center for Biomedical Engineering, Department of Medicine, Brigham andWomen’s Hospital, Harvard Medical School, Cambridge, Massachusetts 02139, USA3Harvard-MIT Division of Health Sciences and Technology,Massachusetts Institute of Technology, Cambridge, Massachusetts 02139, USA4Politecnico di Torino, Department of Electronics and Communications, 10129 Torino, Italy5Wyss Institute for Biologically Inspired Engineering, Harvard University, Boston,Massachusetts 02115, USA
(Received 20 August 2012; accepted 23 October 2012; published online 26 November 2012)
The application of microfluidic technologies to stem cell research is of great
interest to biologists and bioengineers. This is chiefly due to the intricate ability to
control the cellular environment, the reduction of reagent volume, experimentation
time and cost, and the high-throughput screening capabilities of microscale devices.
Despite this importance, a simple-to-use microfluidic platform for studying the
effects of growth factors on stem cell differentiation has not yet emerged. With this
consideration, we have designed and characterized a microfluidic device that is easy
to fabricate and operate, yet contains several functional elements. Our device is a
simple polyester-based microfluidic chip capable of simultaneously screening
multiple independent stem cell culture conditions. Generated by laser ablation and
stacking of multiple layers of polyester film, this device integrates a 10� 10
microwell array for cell culture with a continuous perfusion system and a non-linear
concentration gradient generator. We performed numerical calculations to predict
the gradient formation and calculate the shear stress acting on the cells inside the
device. The device operation was validated by culturing murine embryonic stem
cells inside the microwells for 5 days. Furthermore, we showed the ability to
maintain the pluripotency of stem cell aggregates in response to concentrations of
leukemia inhibitory factor ranging from 0 to �1000 U/ml. Given its simplicity, fast
manufacturing method, scalability, and the cell-compatible nature of the device, it
may be a useful platform for long-term stem cell culture and studies. VC 2012American Institute of Physics. [http://dx.doi.org/10.1063/1.4766300]
INTRODUCTION
An important challenge in the field of bioengineering is to engineer tissues for transplantation
or drug discovery applications. Here, the research efforts often utilize stem cells for differentiation
into various other cell types, such as endothelial cells,1,2 cardiomyocytes,3–6 or hepatocytes.7–9 To
better understand the differentiation process, many stimuli present in the native cellular microen-
vironment are explored in the laboratory, in particular, chemical cues. Among the well-known
growth and differentiation factors affecting stem cell behavior are vascular endothelial growth fac-
tor (VEGF),10 retinoic acid,11 fibroblast growth factor (FGF-2),12 and bone morphogenetic protein
(BMP-2).13
a)F. Piraino and �S. Selimovic contributed equally to this work.b)Author to whom correspondence should be addressed. Email: [email protected]. Fax: þ 1 617 768 8477.
1932-1058/2012/6(4)/044109/14/$30.00 VC 2012 American Institute of Physics6, 044109-1
BIOMICROFLUIDICS 6, 044109 (2012)
This article is copyrighted as indicated in the article. Reuse of AIP content is subject to the terms at: http://scitation.aip.org/termsconditions. Downloaded to IP: 18.7.29.240
On: Wed, 19 Aug 2015 20:51:52
Simultaneous testing of a large number of chemical cues in stem cell applications may be
possible using microscale platforms, which operate on microfluidic principles.14–17 Aside from
cost- and time-efficiency of microfluidic experiments, the appeal of this microscale technology
comes from the ability to quickly generate precisely controlled, stable, and spatially varying
mixtures of chemical reagents and biological samples.18–20 Thus, microfluidic devices like the
platform we present in this paper can offer precise control over the type and concentration of
chemical cues in the cellular microenvironment. Such microfluidics-based concentration gradient
devices can generally be separated into passive (diffusive) and active (convection based) gradient
generators (GG).21 Among the diffusion-based GGs are the so-called tree-like GG22 and the Uni-
versal GG,23 both of which are capable of generating a variety of concentration profiles from
only two aqueous input solutions. Other structures that utilize passive mixing via diffusion can
give rise to logarithmic,24 sigmoidal,25 and exponential26 gradients, as is the case here, as well as
combinatorial solution mixtures.27 A special type of a diffusion-based mixing unit is the rotary
mixer. It consists of a toroidal channel, into which several liquids are introduced one after
another, and pumped using microvalves.28 Here, each solution has a parabolic Poiseuille flow pro-
file, and a mixing interface is generated orthogonally to the flow direction. Convective mixing29
is another mechanism that can be utilized in microfluidic devices for generation of concentration
gradients. For example, solutions flowing through curved channels30 experience eddies at points
with the largest radii of curvature and are mixed chaotically. Ratchet structures, investigated by
Stroock and McGraw, Whitesides31 and Yager32 groups, function in a similar manner. When a
sheet of liquid passes over angled ratchets on the bottom of a microfluidic channel,33 it experien-
ces a pressure gradient that drives it back across the channel ceiling. The liquid effectively folds
upon itself, and particles present in different parts of the flow mix with each other. Both GG
types have impacted a wide range of biological studies, including cancer metastasis, immune
response, angiogenesis, and others.34–36 In addition, microfluidic GGs have been used to investi-
gate stem cell behavior,24 e.g., the influence of a mixture of growth factors on human neural stem
cell proliferation and differentiation12 and the effect of a bovine serum albumin concentration gra-
dient on human embryonic stem cell viability and morphology.37
Despite the variety of microfluidic devices for stem cell applications,17 there is a dearth of
simple-to-use, yet potentially powerful experimental platforms with the capability to test cellu-
lar response to a chemical concentration gradient. This is due to the breadth of engineering
approaches, most of which utilize one of two opposing strategies. Either the experimental plat-
forms are designed to carry out several functions simultaneously, which makes them cumber-
some to fabricate and difficult to operate, or the devices are architecturally simple and easy to
use, but lack complex functionalities.15,38 In the first case, the goal is to create a highly con-
trolled stem cell microenvironment and conduct high-throughput screening of differentiation
cues. Thus, microfluidic valves and multiplexers are often incorporated into the devices for gra-
dient and flow control, as shown by Mosadegh et al.39 and Gomez-Sjoberg et al.,40 which
requires a high level of technical skill and potentially a programmable interface for automated
operation. Similarly, Kim et al.41 enabled controlled on-chip cell loading, delivery of a range of
chemical growth factors and immunostaining at the expense of a complicated 3-layer master
mold fabrication, and the inclusion of externally driven microvalves. In the second case, micro-
fluidic devices for stem cell studies tend to be confined to either single-cell trapping, culture
and analysis42 or to growth of embryonic bodies in individual microwells.43–45 These platforms
have no more than one or two fluidic layers and contain a perfusion channel superposed onto a
microwell array. They are also low-throughput, as they generally supply few different, manually
prepared chemical solutions to the captured cells.46 For example, Liu et al.47 developed a sim-
ple microscale platform combining channels and wells with different substrates for stem cell
culture and differentiation, but did not incorporate further functionalities such as screening
against different growth factors. Toh et al.48 initially also chose a simple microfluidic structure
consisting of three culture and perfusion channels for 3D stem cell culture that could be used to
observe the cell proliferation and differentiation behavior in response to a single chemical fac-
tor. Later, they extended the platform to include a linear concentration gradient generator, but
the testing was confined to a liver cancer cell line.49
044109-2 Piraino et al. Biomicrofluidics 6, 044109 (2012)
This article is copyrighted as indicated in the article. Reuse of AIP content is subject to the terms at: http://scitation.aip.org/termsconditions. Downloaded to IP: 18.7.29.240
On: Wed, 19 Aug 2015 20:51:52
To introduce a user-friendly, yet potentially powerful microfluidic stem cell culture and dif-
ferentiation device, we have extended our polyester-based cell culture platform to include a
microfluidic continuous perfusion system and a concentration gradient generator, without having
to sacrifice the simplicity of the fabrication technique. We have previously shown that micro-
well platforms could be easily and quickly manufactured using laser ablation of sticky polyester
films.50 Furthermore, we demonstrated that this material could be used in cell experiments with-
out deleterious effects on the cell viability. The polyester l-assay chip presented here combines
microwells for cell storage and 3D culture with a network of microfluidic channels. This net-
work serves as a delivery path for cells, functions as a continuous cell perfusion system, and is
used to form and transport to the stored cells several on-chip prepared concentrations of chemi-
cal factors. This is accomplished in the form of nonlinear concentration gradients. In this paper,
we demonstrate the utility of the polyester l-assay chip for stem cell culture. As a validation
test, we study the effect of an imposed exponential gradient of leukemia inhibitory factor (LIF)
on the expression of a fluorescent indicator of Oct4, a transcription factor regulated in pluripo-
tent stem cells.
MATERIALS AND METHODS
Device fabrication
The polyester film used to fabricate the microfluidic device was provided by adhesive
applications (NT 8512-2DL; Easthampton, MA). It consisted of a central 50.8 lm thick polyes-
ter layer and 38.1 lm thick layers of silicone glue on both sides. Each glue layer was protected
with a 50.8 lm thick polyester liner (Figure 1(a)). The well layer of the device was patterned
by laser ablation of the polyester film, as described elsewhere,50 in order to yield a 10� 10
array of 150 lm large circular microwells with a conical cross-section. The laser power chosen
was 3.6 W and the printing speed was 22.9 cm/s. The height of the microwells was 178 lm,
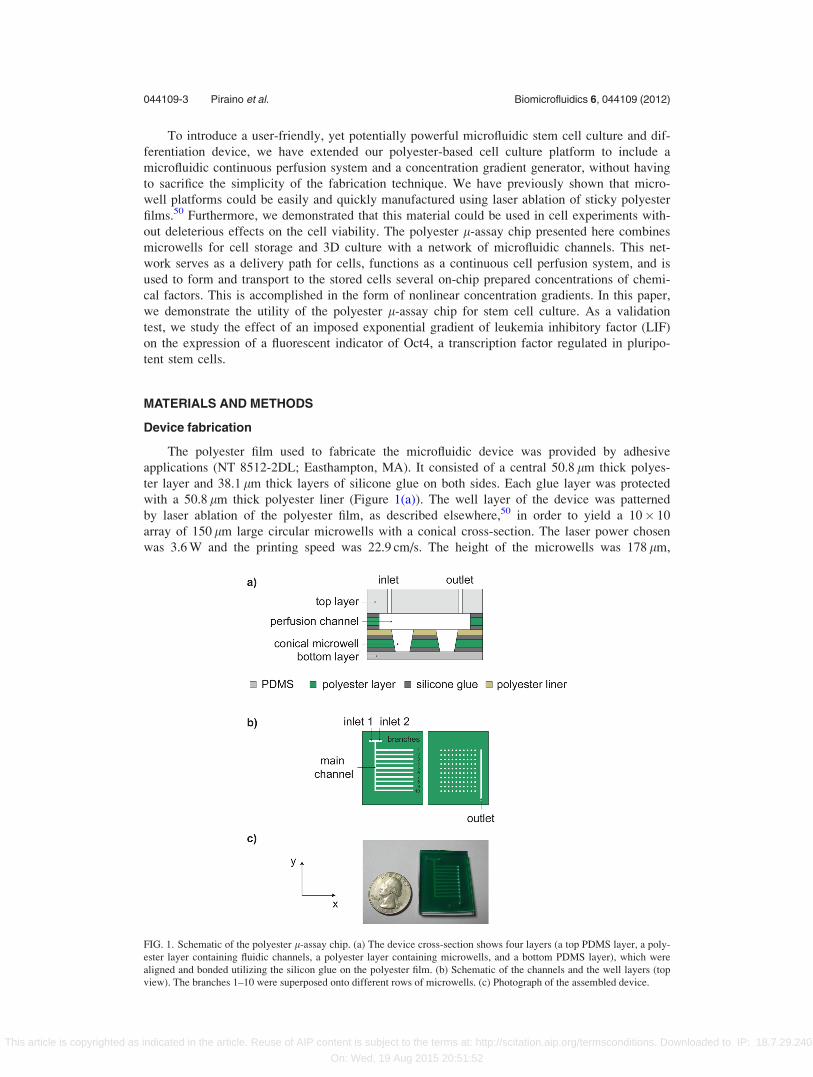
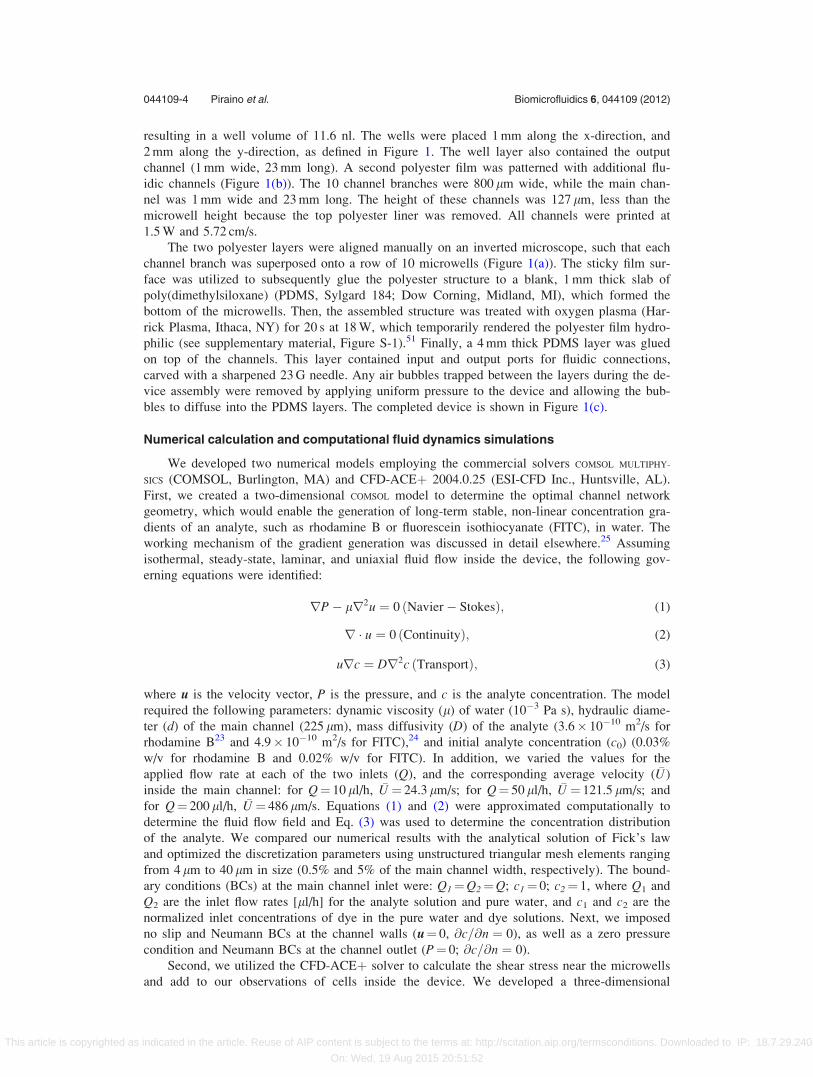
FIG. 1. Schematic of the polyester l-assay chip. (a) The device cross-section shows four layers (a top PDMS layer, a poly-
ester layer containing fluidic channels, a polyester layer containing microwells, and a bottom PDMS layer), which were
aligned and bonded utilizing the silicon glue on the polyester film. (b) Schematic of the channels and the well layers (top
view). The branches 1–10 were superposed onto different rows of microwells. (c) Photograph of the assembled device.
044109-3 Piraino et al. Biomicrofluidics 6, 044109 (2012)
This article is copyrighted as indicated in the article. Reuse of AIP content is subject to the terms at: http://scitation.aip.org/termsconditions. Downloaded to IP: 18.7.29.240
On: Wed, 19 Aug 2015 20:51:52
resulting in a well volume of 11.6 nl. The wells were placed 1 mm along the x-direction, and
2 mm along the y-direction, as defined in Figure 1. The well layer also contained the output
channel (1 mm wide, 23 mm long). A second polyester film was patterned with additional flu-
idic channels (Figure 1(b)). The 10 channel branches were 800 lm wide, while the main chan-
nel was 1 mm wide and 23 mm long. The height of these channels was 127 lm, less than the
microwell height because the top polyester liner was removed. All channels were printed at
1.5 W and 5.72 cm/s.
The two polyester layers were aligned manually on an inverted microscope, such that each
channel branch was superposed onto a row of 10 microwells (Figure 1(a)). The sticky film sur-
face was utilized to subsequently glue the polyester structure to a blank, 1 mm thick slab of
poly(dimethylsiloxane) (PDMS, Sylgard 184; Dow Corning, Midland, MI), which formed the
bottom of the microwells. Then, the assembled structure was treated with oxygen plasma (Har-
rick Plasma, Ithaca, NY) for 20 s at 18 W, which temporarily rendered the polyester film hydro-
philic (see supplementary material, Figure S-1).51 Finally, a 4 mm thick PDMS layer was glued
on top of the channels. This layer contained input and output ports for fluidic connections,
carved with a sharpened 23 G needle. Any air bubbles trapped between the layers during the de-
vice assembly were removed by applying uniform pressure to the device and allowing the bub-
bles to diffuse into the PDMS layers. The completed device is shown in Figure 1(c).
Numerical calculation and computational fluid dynamics simulations
We developed two numerical models employing the commercial solvers COMSOL MULTIPHY-
SICS (COMSOL, Burlington, MA) and CFD-ACEþ 2004.0.25 (ESI-CFD Inc., Huntsville, AL).
First, we created a two-dimensional COMSOL model to determine the optimal channel network
geometry, which would enable the generation of long-term stable, non-linear concentration gra-
dients of an analyte, such as rhodamine B or fluorescein isothiocyanate (FITC), in water. The
working mechanism of the gradient generation was discussed in detail elsewhere.25 Assuming
isothermal, steady-state, laminar, and uniaxial fluid flow inside the device, the following gov-
erning equations were identified:
rP� lr2u ¼ 0 ðNavier� StokesÞ; (1)
r � u ¼ 0 ðContinuityÞ; (2)
urc ¼ Dr2c ðTransportÞ; (3)
where u is the velocity vector, P is the pressure, and c is the analyte concentration. The model
required the following parameters: dynamic viscosity (l) of water (10�3 Pa s), hydraulic diame-
ter (d) of the main channel (225 lm), mass diffusivity (D) of the analyte (3.6� 10�10 m2/s for
rhodamine B23 and 4.9� 10�10 m2/s for FITC),24 and initial analyte concentration (c0) (0.03%
w/v for rhodamine B and 0.02% w/v for FITC). In addition, we varied the values for the
applied flow rate at each of the two inlets (Q), and the corresponding average velocity ( �U)
inside the main channel: for Q¼ 10 ll/h, �U ¼ 24.3 lm/s; for Q¼ 50 ll/h, �U ¼ 121.5 lm/s; and
for Q¼ 200 ll/h, �U ¼ 486 lm/s. Equations (1) and (2) were approximated computationally to
determine the fluid flow field and Eq. (3) was used to determine the concentration distribution
of the analyte. We compared our numerical results with the analytical solution of Fick’s law
and optimized the discretization parameters using unstructured triangular mesh elements ranging
from 4 lm to 40 lm in size (0.5% and 5% of the main channel width, respectively). The bound-
ary conditions (BCs) at the main channel inlet were: Q1¼Q2¼Q; c1¼ 0; c2¼ 1, where Q1 and
Q2 are the inlet flow rates [ll/h] for the analyte solution and pure water, and c1 and c2 are the
normalized inlet concentrations of dye in the pure water and dye solutions. Next, we imposed
no slip and Neumann BCs at the channel walls (u¼ 0, @c=@n ¼ 0), as well as a zero pressure
condition and Neumann BCs at the channel outlet (P¼ 0; @c=@n ¼ 0).
Second, we utilized the CFD-ACEþ solver to calculate the shear stress near the microwells
and add to our observations of cells inside the device. We developed a three-dimensional
044109-4 Piraino et al. Biomicrofluidics 6, 044109 (2012)
This article is copyrighted as indicated in the article. Reuse of AIP content is subject to the terms at: http://scitation.aip.org/termsconditions. Downloaded to IP: 18.7.29.240
On: Wed, 19 Aug 2015 20:51:52
transient-state model of the volume surrounding a single microwell, discretized with tetragonal
elements in an unstructured mesh. Because of the symmetry of the problem, we only had to
model one half of a microwell. The governing equations under the same hypothesis discussed
above were Eq. (2) and the following:
s ¼ �lc ðShear stressÞ (4)
where g is the gravitational acceleration, s is the shear stress, and c is the shear rate. The values for
the dynamic viscosity (l) and density (q) of the cell culture medium were 0.78� 10�3 Pa s and
990 kg/m3, respectively.25 We calculated the shear stress acting on the cells inside the device for dif-
ferent experimental conditions. For example, cells would be introduced into the device through the
output channel at a concentration of 106 cells/ml and a flow rate of Qcell¼ 7200 ll/h, but the highest
flow rate used for the gradient generation would be Q¼ 200 ll/h per input stream. We modeled the
cells as elastic spherical particles with Young’s modulus of 1 kPa, a density of 1100 kg/m3,26 and
diameters ranging from 5 lm to 25 lm. The applied BC at the top of the microwell was �Uin ¼ �U0.
Because the microwells were located inside one of the 10 channel branches, the average flow rates
and velocity were Qcell¼ 7200 ll/s ( �U0¼ 1.749 mm/s) and Q¼ 200 ll/h ( �U0¼ 486 lm/s). We also
applied no slip BCs at all microwell walls (u¼ 0), a Neumann BC along the conduit center line
(@u=@n ¼ 0), and a zero pressure BC at the channel outlet (P¼ 0).
Concentration gradient
We validated experimentally the numerical prognosis of dye concentration gradients by
forming different non-linear gradients of fluorescent dye in water. We injected pure water into
the device through inlet 1 and a fluorescent dye solution through inlet 2 using gas-tight glass
syringes (008425; SGE, Austin, TX) at equal flow rates. We used a programmable syringe
pump (Harvard PhD 2000; Harvard Apparatus, Holliston, MA) to control the individual flow
rates of the two solutions (10 ll/h, 50 ll/h, and 200 ll/h) and generate different concentration
gradients. At each flow rate, we waited until the device was completely filled and all air bub-
bles were removed. Then, we waited for 20 min before observing the dye distribution in the de-
vice, in order to ensure that the concentration gradient had reached steady state. We recorded
fluorescence images of all wells using a Nikon Eclipse TE2000 microscope with a 2� objec-
tive. In our experiments on rhodamine B (0.03% w/v in water) and FITC (0.02% w/v in water),
we measured the mean intensity of the dye over the area of each well, using IMAGEJ software
(http://rsbweb.nih.gov/ij/). We hypothesized, in accordance with published literature,52,53 that
for low dye concentrations the dye intensity was proportional to the dye concentration.
Murine embryonic stem cell (mESC) culture
We obtained all tissue culture components from the Gibco-Invitrogen Corporation (Grand
Island, NY), unless specified otherwise. Genetically engineered mESCs expressing green fluo-
rescent protein (GFP) upon expression of Oct4 promoter were first cultured in ESC medium
containing high glucose-Dulbecco’s modified eagles medium (DMEM), enriched with 10% v/v
ES qualified FBS, 100 mg/ml streptomycin, 100 U/ml penicillin, 1% v/v nonessential amino
acid solution, 0.1 mM b-mercaptoethanol, 1 mM L-glutamine, and 0.1% of 106 U/ml leukemia
inhibitory factor (ESG1107; Millipore, Billerica, MA). For the on-chip culture experiments, we
used minimal essential medium (a-MEM) to promote cell aggregation, enriched with 15% (v/v)
heat inactivated-fetal bovine serum (HI-FBS), 100 mg/ml streptomycin, and 100 U/ml
penicillin.
Cell loading, aggregate formation, and viability
The device was sterilized under UV light for 5 min and was filled from the outlet with sterile
PBS immediately after fabrication. At this time, the polyester film was still hydrophilic, allowing
us to remove air trapped inside the microwells. We waited for 45 min until the polyester had
044109-5 Piraino et al. Biomicrofluidics 6, 044109 (2012)
This article is copyrighted as indicated in the article. Reuse of AIP content is subject to the terms at: http://scitation.aip.org/termsconditions. Downloaded to IP: 18.7.29.240
On: Wed, 19 Aug 2015 20:51:52
relaxed back to its hydrophobic state54 and introduced cell culture medium into the device. Then,
the cells were suspended in 20 ll of medium at a concentration of 106 cells/ml and introduced into
the device through the outlet channel, using a 3 ml plastic syringe (Becton-Dickinson, NJ, USA),
similar to the method of Liu et al.47 The device was visually inspected under the microscope to
ensure uniform cell distribution. Then, the flow was stopped for 5 min, allowing the cells to sink to
the bottom of the channels and wells, as shown previously.55,56 Last, we washed away the cells
that had settled on the bottom of the channels by infusing culture medium from the outlet. At this
step, the flow was controlled using a programmable syringe pump (Harvard PhD 2000; Harvard
Apparatus, Holliston, MA), at a rate of 300 ll/h.
Once loaded with cells, the devices were kept inside a cell culture incubator, with culture
medium flowing continuously for 5 days at a total flow rate of 400 ll/h. The mESCs started
aggregating inside the polyester microwells within one day of culture. We recorded daily phase
contrast images of all microwells. We used the IMAGEJ Area function to measure the area of
each cell aggregate large enough to be observed. The minimum resolution was 20 lm. The av-
erage was calculated across a total of 300 wells on 3 separate devices. A viability test was con-
ducted on day 5 by a calcein-AM/ethidium homodimer live/dead assay (Invitrogen). Cells were
washed with Dulbecco’s phosphate-buffered saline (DPBS), followed by 50 ll of 2 mM calcein-
AM and 4 mM ethidium homodimer in DPBS. Samples were incubated for 20 min, then washed
once with DPBS and finally imaged at 2� and 4�.
Stem cell pluripotency
LIF was added to the culture medium to prevent loss of mESC pluripotency inside the
microwells. This relationship between LIF and the expression of the pluripotency marker Oct4
was previously suggested by Faherty et al.11 To quantify this effect in our device, we recorded
daily fluorescence images of all microwells and evaluated the green fluorescent signal of GFP due
to the expression of the Oct4 cell marker. We used the IMAGEJ software to measure the fluorescence
intensity in each well, averaged it across all wells and normalized that data by the maximum signal
intensity obtained on-chip. In the gradient experiment, we supplied different concentrations of LIF
to the captured cells. We introduced pure culture medium (without LIF) and LIF-containing me-
dium through inlets 1 and 2, with both solutions flowing at 200 ll/h. We again imaged the cells
daily in phase contrast and fluorescence and measured the fluorescence signal as detailed above.
The control experiments—with varying static concentrations of LIF—were conducted on
microwell platforms designed for static culture. The individual platforms consisted of a micro-
well array laser ablated onto a polyester layer, as described elsewhere,50 and glued onto a blank
PDMS slab. Each microwell platform was kept inside a separate well on a 6-well plate and
stored in a cell culture incubator. The culture medium was replenished daily. The imaging and
data analysis were conducted in the same way as for the continuously perfused chips, with the
average GFP signal measured across 200 microwells. After the 5-day cell culture, the medium
was aspirated in the static devices, and the devices transferred to new polystyrene dishes and
washed with PBS. The viability assay was added to the microwell platforms via pipetting. Oth-
erwise, the same procedure was followed as in the continuous perfusion experiment.
Statistical analysis
Statistical significance was determined by one-way analysis of variance (ANOVA, Tukey’s
Range Test). For all statistical tests, the level of significance was set to p< 0.05.
RESULTS AND DISCUSSION
Device fabrication and operation
Initially, when filling the device with an aqueous solution, the air bubbles captured in the hydro-
phobic device were difficult to remove, as they were pinned to the microchannel walls. High flow
rates (above 400 ll/h) were required to compress the air into the PDMS layer, which in turn led to
device delamination. To remedy this problem, we temporarily rendered the polyester and PDMS
044109-6 Piraino et al. Biomicrofluidics 6, 044109 (2012)
This article is copyrighted as indicated in the article. Reuse of AIP content is subject to the terms at: http://scitation.aip.org/termsconditions. Downloaded to IP: 18.7.29.240
On: Wed, 19 Aug 2015 20:51:52
walls of the microchannels hydrophilic by treating them with oxygen plasma. This enabled wetting
of the channel walls with the aqueous solution and facilitated removal of the gas bubbles. (See sup-
plementary material Figure S-1 for contact angle measurements on polyester prior to and after
plasma treatment.)51,54 All laser ablated features had uniform dimensions and few defects, which
was important for the removal of air bubbles, subsequent seeding of cells and generation of stable
concentration gradients.
Numerical analysis
We used COMSOL to generate a plot of FITC concentration in water inside the main channel.
Specifically, the dye concentration was calculated in the direction transverse to the flow and at
different positions inside the main channel, downstream of the two inlets. Adding lateral chan-
nel branches (Figure 1) resulted in a redistribution of the fluids, which enabled full mixing of
the clear and dyed solutions inside a relatively short main channel (23 mm). This allowed us to
retain the small footprint of our microfluidic device. Furthermore, we generated non-linear con-
centration gradient profiles inside the channel branches for rhodamine B and FITC, for three
main channel widths (800, 1000, 1200 lm) and for three different channel branch widths (500,
800, 1000 lm). This information was used to determine the optimal channel widths for our
experiments, namely 800 lm for the channel branches and 1 mm for the main channel. These
dimensions were small enough to allow for wide concentration gradients, but large enough to
generate smooth features during laser printing of the polyester layer.
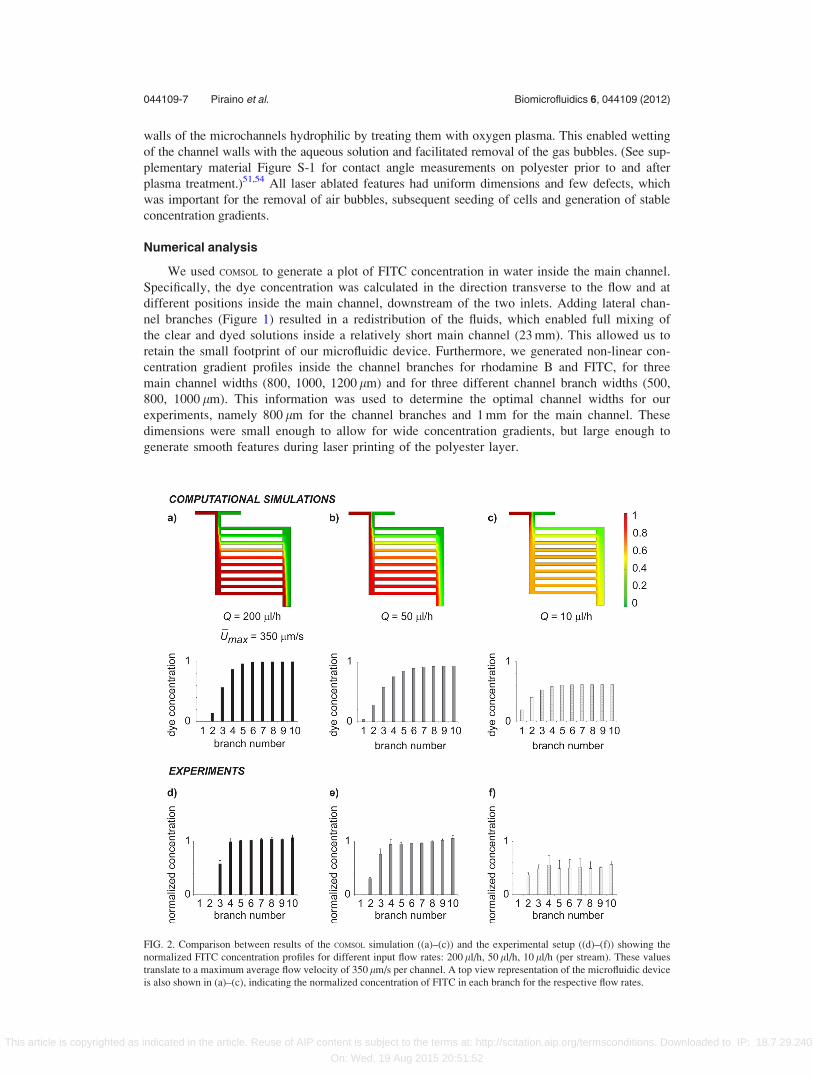
FIG. 2. Comparison between results of the COMSOL simulation ((a)–(c)) and the experimental setup ((d)–(f)) showing the
normalized FITC concentration profiles for different input flow rates: 200 ll/h, 50 ll/h, 10 ll/h (per stream). These values
translate to a maximum average flow velocity of 350 lm/s per channel. A top view representation of the microfluidic device
is also shown in (a)–(c), indicating the normalized concentration of FITC in each branch for the respective flow rates.
044109-7 Piraino et al. Biomicrofluidics 6, 044109 (2012)
This article is copyrighted as indicated in the article. Reuse of AIP content is subject to the terms at: http://scitation.aip.org/termsconditions. Downloaded to IP: 18.7.29.240
On: Wed, 19 Aug 2015 20:51:52
Our numerical results indicated that the concentration gradient profiles (Figures 2(a)–2(c))
could be fit with an exponential curve at low flow rates (e.g., 10 ll/h). At higher flow rates
(Q� 50 ll/h), however, the profiles had sigmoidal fits, similar to our previous results. The curve
fits were generated using Origin 8.0 (Origin Lab, Northampton, MA) and are included in the
supplementary material, Figure S-2 (for FITC).51
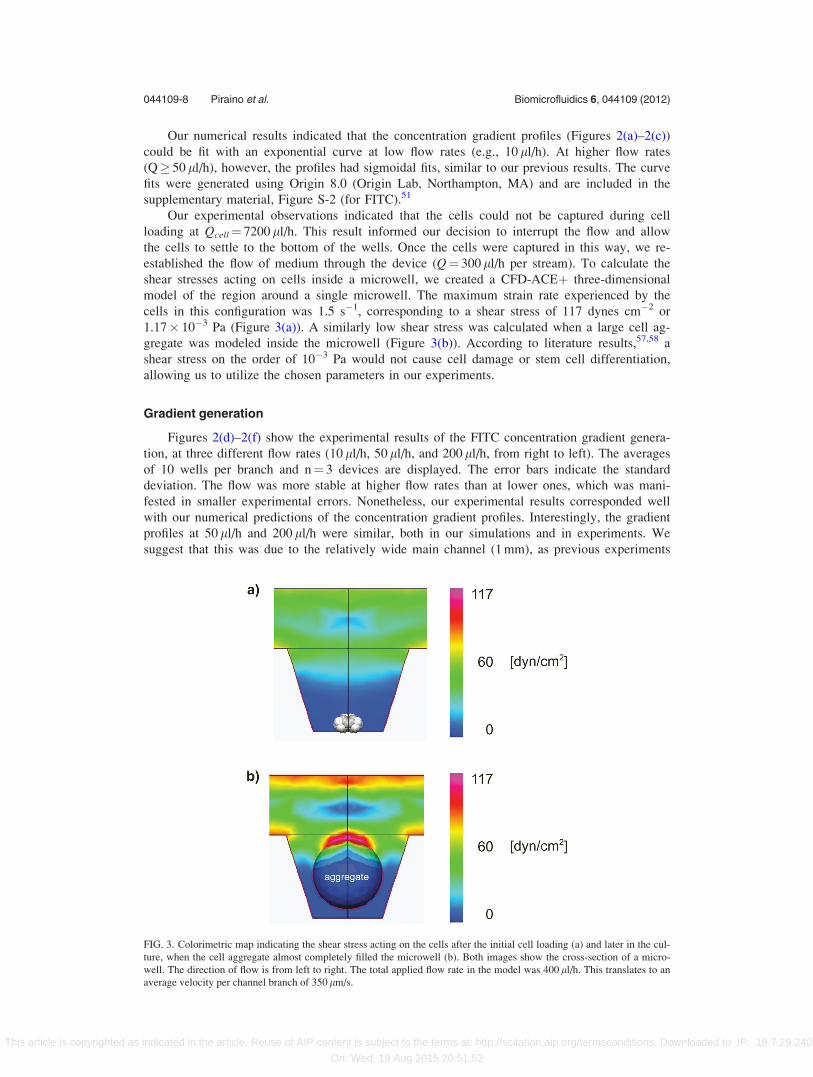
Our experimental observations indicated that the cells could not be captured during cell
loading at Qcell¼ 7200 ll/h. This result informed our decision to interrupt the flow and allow
the cells to settle to the bottom of the wells. Once the cells were captured in this way, we re-
established the flow of medium through the device (Q¼ 300 ll/h per stream). To calculate the
shear stresses acting on cells inside a microwell, we created a CFD-ACEþ three-dimensional
model of the region around a single microwell. The maximum strain rate experienced by the
cells in this configuration was 1.5 s�1, corresponding to a shear stress of 117 dynes cm�2 or
1.17� 10�3 Pa (Figure 3(a)). A similarly low shear stress was calculated when a large cell ag-
gregate was modeled inside the microwell (Figure 3(b)). According to literature results,57,58 a
shear stress on the order of 10�3 Pa would not cause cell damage or stem cell differentiation,
allowing us to utilize the chosen parameters in our experiments.
Gradient generation
Figures 2(d)–2(f) show the experimental results of the FITC concentration gradient genera-
tion, at three different flow rates (10 ll/h, 50 ll/h, and 200 ll/h, from right to left). The averages
of 10 wells per branch and n¼ 3 devices are displayed. The error bars indicate the standard
deviation. The flow was more stable at higher flow rates than at lower ones, which was mani-
fested in smaller experimental errors. Nonetheless, our experimental results corresponded well
with our numerical predictions of the concentration gradient profiles. Interestingly, the gradient
profiles at 50 ll/h and 200 ll/h were similar, both in our simulations and in experiments. We
suggest that this was due to the relatively wide main channel (1 mm), as previous experiments
FIG. 3. Colorimetric map indicating the shear stress acting on the cells after the initial cell loading (a) and later in the cul-
ture, when the cell aggregate almost completely filled the microwell (b). Both images show the cross-section of a micro-
well. The direction of flow is from left to right. The total applied flow rate in the model was 400 ll/h. This translates to an
average velocity per channel branch of 350 lm/s.
044109-8 Piraino et al. Biomicrofluidics 6, 044109 (2012)
This article is copyrighted as indicated in the article. Reuse of AIP content is subject to the terms at: http://scitation.aip.org/termsconditions. Downloaded to IP: 18.7.29.240
On: Wed, 19 Aug 2015 20:51:52
utilizing a narrower channel (200 lm) allowed for a faster diffusion-based mixing of the small
FITC molecules and so a more pronounced difference between gradient profiles.26 Thus, we
decided to adopt the higher flow rate of 200 ll/h for our subsequent experiments, because this
rate allowed for any flow instabilities to pass through the device faster than at lower flow rates.
Such instabilities could potentially occur as a result of errors in pump operation or motion of
the thin-walled polytetrafluoroethylene (PTFE) tubing, especially when the device was moved
for daily imaging. Furthermore, we expected that the gradients would also be more stable for
larger molecules, which diffuse more slowly, such as LIF (22 kDa). A comparison between
concentration gradients of rhodamine B and LIF is shown in the supplementary material,
Figure S-3.51 Here, we estimated the diffusion constant of LIF to be 1� 10�10 m2/s, similar to
other molecules of the same size.59
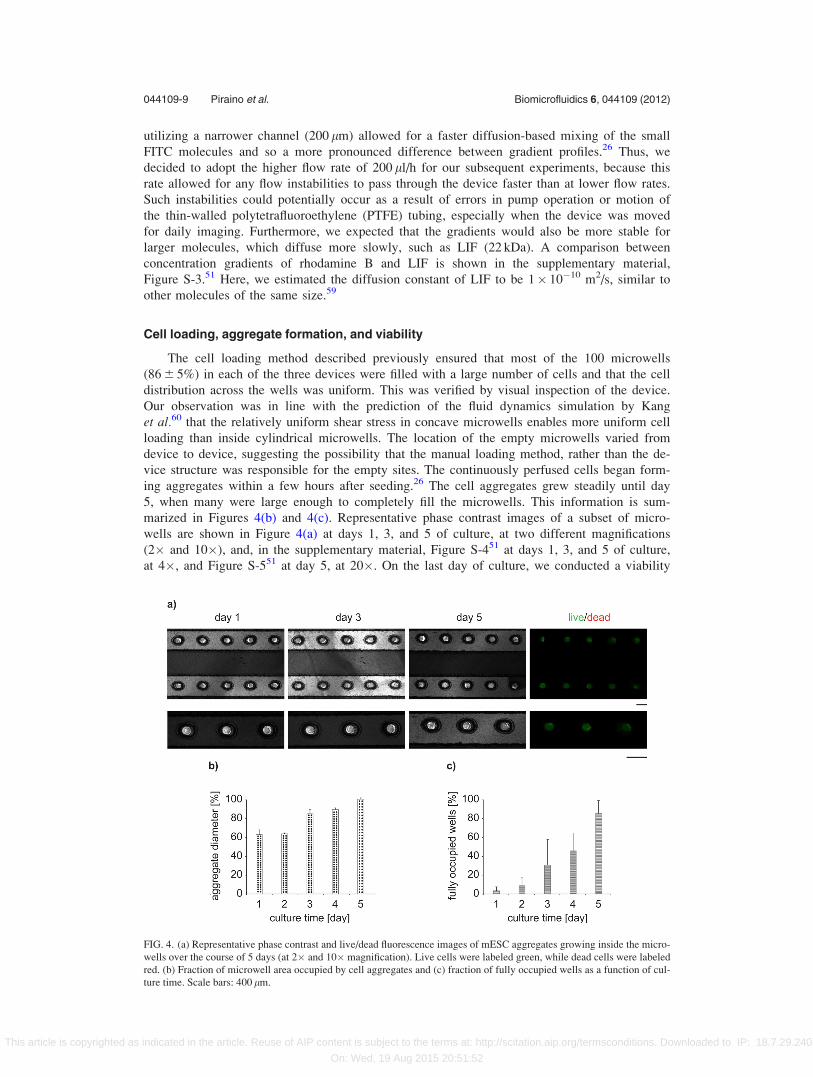
Cell loading, aggregate formation, and viability
The cell loading method described previously ensured that most of the 100 microwells
(86 6 5%) in each of the three devices were filled with a large number of cells and that the cell
distribution across the wells was uniform. This was verified by visual inspection of the device.
Our observation was in line with the prediction of the fluid dynamics simulation by Kang
et al.60 that the relatively uniform shear stress in concave microwells enables more uniform cell
loading than inside cylindrical microwells. The location of the empty microwells varied from
device to device, suggesting the possibility that the manual loading method, rather than the de-
vice structure was responsible for the empty sites. The continuously perfused cells began form-
ing aggregates within a few hours after seeding.26 The cell aggregates grew steadily until day
5, when many were large enough to completely fill the microwells. This information is sum-
marized in Figures 4(b) and 4(c). Representative phase contrast images of a subset of micro-
wells are shown in Figure 4(a) at days 1, 3, and 5 of culture, at two different magnifications
(2� and 10�), and, in the supplementary material, Figure S-451 at days 1, 3, and 5 of culture,
at 4�, and Figure S-551 at day 5, at 20�. On the last day of culture, we conducted a viability
FIG. 4. (a) Representative phase contrast and live/dead fluorescence images of mESC aggregates growing inside the micro-
wells over the course of 5 days (at 2� and 10� magnification). Live cells were labeled green, while dead cells were labeled
red. (b) Fraction of microwell area occupied by cell aggregates and (c) fraction of fully occupied wells as a function of cul-
ture time. Scale bars: 400 lm.
044109-9 Piraino et al. Biomicrofluidics 6, 044109 (2012)
This article is copyrighted as indicated in the article. Reuse of AIP content is subject to the terms at: http://scitation.aip.org/termsconditions. Downloaded to IP: 18.7.29.240
On: Wed, 19 Aug 2015 20:51:52
test. Live cells stained green due to the continued expression of GFP, when LIF stimulated
Oct4 expression. Dead cells stained red after binding of ethidium homodimer to the DNA of
membrane-compromised cells. The scarcity of red fluorescent signal indicated that few cells
had died (Figure 4(a), right most panel). A mechanism for extraction of the cell aggregates
from the individual microwells was not in place at this point, limiting our cell analysis in visual
observation.
These results match qualitatively the findings from previous research,50 where mESCs were
cultured under static conditions. However, in perfusion culture, the formed cell aggregates filled
the microwells almost completely by day 5, which was 4 days earlier than in static culture.
While we did not explore the cause of this result experimentally, we suggest the following pos-
sible factors. Due to the advanced and well-controlled cell loading method the number of cells
per microwell was on average higher on the polyester l-well chip than on the static culture
platform, resulting in earlier formation (culture day 1 vs. day 3) of cell aggregates. Further-
more, the continuous provision of fresh culture medium and removal of metabolic waste inside
the microfluidic device could potentially act to increase the cell activity and, ultimately, the ini-
tial rate of cell proliferation. Last, in the static culture case the daily exchange of medium via
aspiration and pipetting could have resulted in removal of unbound cells from the microwells,
thereby reducing the number of cells available for inclusion into a larger unit.
Stem cell pluripotency
We evaluated the loss of mESC pluripotency by quantifying the expression of GFP, caused
by the continued production of Oct4 marker. Here we only considered microwells that con-
tained a single cell aggregate. We quantified the GFP signal for the case of a LIF concentration
gradient (0–1000 U/ml) and a constant LIF concentration (1000 U/ml) across all channel
branches. In both cases, the medium was perfused continuously to achieve dynamic culture con-
ditions. When the same concentration of LIF was delivered to all channel branches, then all
formed cell aggregates expressed the same amount of GFP, as expected. Therefore, we con-
cluded that the expression of Oct4 was also equal across all microwells. An applied LIF gradi-
ent, however, affected the GFP expression (and presumably Oct4) across the different channel
branches. In our previous work,25 we could generate up to ten different conditions using the
same gradient generator structure, however, the precise gradient shape and number of condi-
tions depends on the diffusion constant of the solute as well as the channel dimensions. In the
present study, we chose to generate four distinct LIF concentrations using the gradient genera-
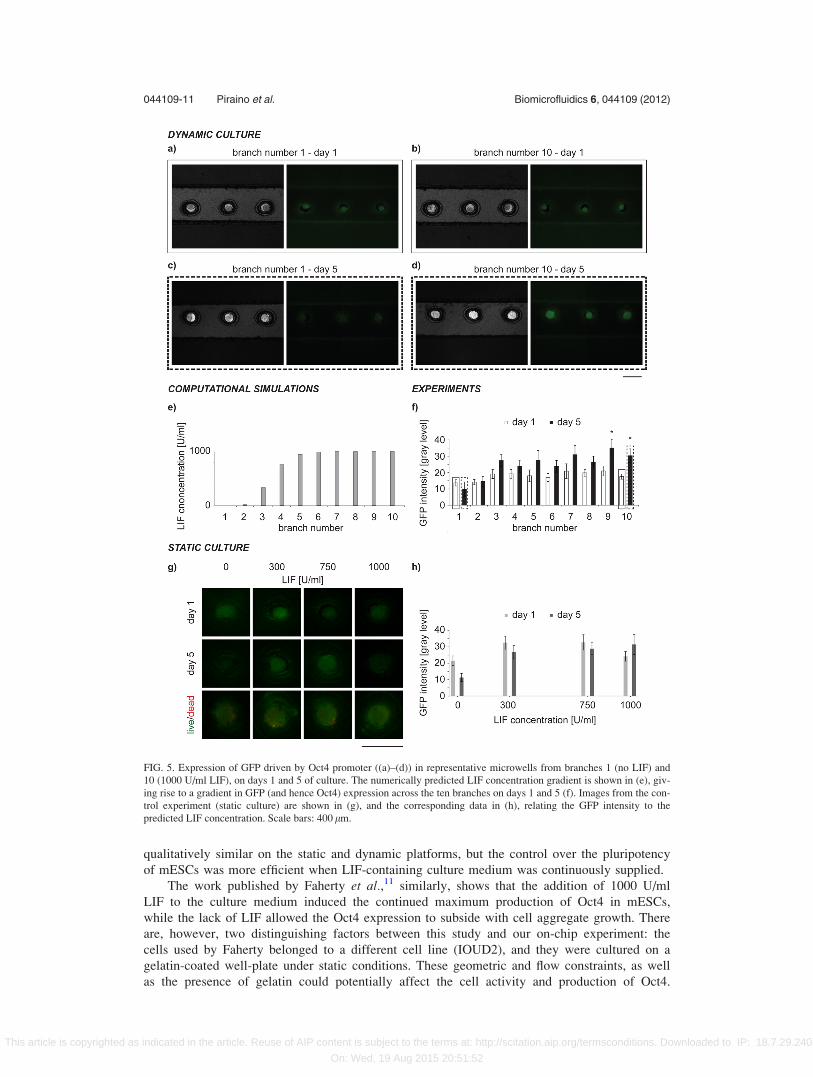
tor. Figure 5 shows the results of this experiment. Phase contrast and fluorescence images of
microwells in branches 1 (no presence of LIF) and 10 (maximum concentration of LIF) were
compared on days 1 and 5 of culture (Figures 5(a)–5(d)). The LIF concentration gradient across
the 10 channel branches was predicted numerically (Figure 5(e)). It resulted in GFP (and thus
Oct4) expression gradients as shown in Figures 5(f) and 5(g), on cell culture days 1 and 5. By
day 5, a significant difference in GFP expression across the different channels was observed.
As a control, we measured the Oct4 expression in mESCs in static culture experiments.
Again, we only considered microwells containing single cell aggregates. In these experiments
different LIF concentrations were manually prepared and their effect on the mESCs tested. To
streamline this experiment and reduce the consumption of LIF, we tested the effects of only
four LIF concentrations: 0, 300, 750, and 1000 U/ml. The number of analyzed wells was 200.
Our choice of these values was based on the results from the continuous perfusion experiments.
Namely, we hypothesized that a similar relationship between those LIF concentrations and fluo-
rescence intensity would be observed in the static culture. Figure 5(g) shows the fluorescence
images of statically cultured mESC aggregates, as well as live/dead images recorded on the last
day of culture. The corresponding values of the fluorescence intensity on culture days 1 and 5
are shown in Figure 5(h). The gradual reduction in fluorescence in absence of LIF was compa-
rable to branches 1 and 2 in the dynamic culture. However, there was no evidence of a signifi-
cant variation in fluorescence at all other LIF concentrations in the control experiment. This
comparison of dynamic and static cultures suggest that the expression of Oct4 and GFP was
044109-10 Piraino et al. Biomicrofluidics 6, 044109 (2012)
This article is copyrighted as indicated in the article. Reuse of AIP content is subject to the terms at: http://scitation.aip.org/termsconditions. Downloaded to IP: 18.7.29.240
On: Wed, 19 Aug 2015 20:51:52
qualitatively similar on the static and dynamic platforms, but the control over the pluripotency
of mESCs was more efficient when LIF-containing culture medium was continuously supplied.
The work published by Faherty et al.,11 similarly, shows that the addition of 1000 U/ml
LIF to the culture medium induced the continued maximum production of Oct4 in mESCs,
while the lack of LIF allowed the Oct4 expression to subside with cell aggregate growth. There
are, however, two distinguishing factors between this study and our on-chip experiment: the
cells used by Faherty belonged to a different cell line (IOUD2), and they were cultured on a
gelatin-coated well-plate under static conditions. These geometric and flow constraints, as well
as the presence of gelatin could potentially affect the cell activity and production of Oct4.
FIG. 5. Expression of GFP driven by Oct4 promoter ((a)–(d)) in representative microwells from branches 1 (no LIF) and
10 (1000 U/ml LIF), on days 1 and 5 of culture. The numerically predicted LIF concentration gradient is shown in (e), giv-
ing rise to a gradient in GFP (and hence Oct4) expression across the ten branches on days 1 and 5 (f). Images from the con-
trol experiment (static culture) are shown in (g), and the corresponding data in (h), relating the GFP intensity to the
predicted LIF concentration. Scale bars: 400 lm.
044109-11 Piraino et al. Biomicrofluidics 6, 044109 (2012)
This article is copyrighted as indicated in the article. Reuse of AIP content is subject to the terms at: http://scitation.aip.org/termsconditions. Downloaded to IP: 18.7.29.240
On: Wed, 19 Aug 2015 20:51:52
Namely, when cultured for 6 days without LIF, the cells in Faherty’s work were still expressing
very high Oct4 amounts. For comparison, we measured already after 5 days a 50% reduction in
maximum GFP expression (hence, in Oct4) on our static microwell platform. On our polyester
l-assay chip that percentage was reduced to below 30%. These data suggest that the GFP/Oct4
expression and the conditions of culture, e.g., flow, might be correlated. However, further stud-
ies could provide more insight into this issue.
At this point, we note that the weak fluorescence signal in cells starved of LIF could
include an autofluorescence component. To determine the amount of autofluorescence, we could
in the future culture the cells for an extended amount of time, namely until the signal intensity
of cells starved of LIF becomes independent of culture time.
CONCLUSION
An experiment focusing on stem cell pluripotency supported by a numerical study demon-
strated that the polyester l-assay chip offered control over the generation and distribution of a
chemical concentration gradient. Our device was shown to carry several key advantages. It was
fabricated by laser-ablation of a polyester film, which is a simple, bench-top, and low-cost fab-
rication method and suitable for development of microscale devices. Since this is a direct-write
method, it is also amenable to fast design changes. Next, the use of the non-linear gradient gen-
erator as shown here allowed us to dispense with complex microscale elements for mixing and
distribution of liquids, thereby reducing the size of the chip. At the same time, however, the
chip offered a concentration gradient generator coupled with a continuous perfusion system and
a microwell array for cell storage and culture. The only piece of external equipment needed
was a single syringe pump for continuous culture perfusion, such that the device could be oper-
ated by personnel with little technical skill. In addition, the use of a dynamic perfusion system
meant that human work was only required for the experimental set-up. Although the microwells
were monitored daily, the imaging could be automated by adding a mini-microscope or a lens-
less CMOS imaging platform in the incubator.61 Most importantly, however, the device material
did not require any additional surface treatment and did not show any deleterious effects on
stem cell proliferation and viability, enabling further, more advanced differentiation studies.
The cells were contained inside a closed, sterilized device, reducing the likelihood of
contamination.
With respect to its precursor, the open static culture microwell platform, the polyester
l-assay chip was more efficient. Namely, the cell seeding was denser and more uniform than
on the open platform, resulting in a large proportion of aggregate-containing wells early in the
culture period. Finally, our data suggest that the dynamic flow conditions inside the microfluidic
device potentially increased the mESC sensitivity to chemicals such as LIF. Additional studies
are required to confirm this hypothesis, however, a high sensitivity to chemicals would decrease
the experimental time, reduce the amount of reagents used for cell screening and ultimately
increase the value of our device even further.
In the future, we envision that the Polyester l-well chip may be modified with a high-
precision laser engraver to enable patterning on a 10 lm scale and, in consequence, investiga-
tions of single cell, cell-cell and cell-substrate interactions, while taking advantage of dynamic
analysis and full automation. The PDMS bottom could also be selectively functionalized with
fibronectin or other proteins to control cell adhesion. In addition, a second gradient structure
could be placed perpendicularly to the current network, similar to our previous work,56 giving
rise to a 2D, combinatorial mixture of chemicals and the simultaneous testing of many more
conditions. Here, any of the structures supporting passive or active concentration gradients, like
discussed in the introduction, could be included. The stacking of microwells and fluidic chan-
nels on three or more layers in the z-direction27 could then lead to the inclusion of additional
microwells and so increase the throughput capabilities of the device. Alternatively, to further
simplify the device, the syringe pump could be replaced by a gravity-driven micro-pump.62 We
also plan to include a mechanism for extraction of the cell aggregates in order to extend the
currently enabled screening studies on the Polyester l-well chip to experiments focused on
044109-12 Piraino et al. Biomicrofluidics 6, 044109 (2012)
This article is copyrighted as indicated in the article. Reuse of AIP content is subject to the terms at: http://scitation.aip.org/termsconditions. Downloaded to IP: 18.7.29.240
On: Wed, 19 Aug 2015 20:51:52
stem cell biology. Such a mechanism could be based on peeling off the PDMS layer and loop-
ing the cell aggregates out with a metal wire, as is commonly done with protein crystals,63,64 or
applying negative pressure to one particular channel to suck out all aggregates cultured at the
same experimental condition. Either approach would enable subsequent cell studies including
fluorescence activated cell sorting and polymerase chain reaction (PCR).
ACKNOWLEDGMENTS
We gratefully acknowledge the following funding support: Fondazione Fratelli Agostino and
Enrico Rocca through the Progetto Rocca (F.P.); Politecnico di Torino Scholarship (M.A. and
A.P.); NIH Grant Nos. HL092836, EB012597, and HL099073, and the Office of Naval Research
(A.K.). F.P., A.K., �S.S., and D.D. conceived of the study; F.P. and �S.S. developed the microfluidic
device and designed the experiments; F.P., �S.S., M.A., and S.M. conducted experiments; A.P. and
S.B.K. conducted numerical and analytical calculations; F.P., �S.S., M.A., A.P., and S.M. analyzed
the data.
1S. Levenberg, J. S. Golub, M. Amit, J. Itskovitz-Eldor, and R. Langer, Proc. Natl. Acad. Sci. U.S.A. 99, 4391 (2002).2J. Oswald, S. Boxberger, B. Jorgensen, S. Feldmann, G. Ehninger, M. Bornhauser, and C. Werner, Stem Cells 22, 377(2004).
3T. Kawai, T. Takahashi, M. Esaki, H. Ushikoshi, S. Nagano, H. Fujiwara, and K. Kosai, Circ. J. 68, 691 (2004).4I. Kehat, D. Kenyagin-Karsenti, M. Snir, H. Segev, M. Amit, A. Gepstein, E. Livne, O. Binah, J. Itskovitz-Eldor, and L.Gepstein, J. Clin. Invest. 108, 407 (2001).
5C. Mummery, D. Ward, C. E. van den Brink, S. D. Bird, P. A. Doevendans, T. Opthof, A. Brutel de la Riviere, L. Tertoolen,M. van der Heyden, and M. Pera, J. Anat. 200, 233 (2002).
6T. Takahashi, B. Lord, P. C. Schulze, R. M. Fryer, S. S. Sarang, S. R. Gullans, and R. T. Lee, Circulation 107, 1912(2003).
7H. Baharvand, S. M. Hashemi, S. Kazemi Ashtiani, and A. Farrokhi, Int. J. Dev. Biol. 50, 645 (2006).8T. Hamazaki, Y. Iiboshi, M. Oka, P. J. Papst, A. M. Meacham, L. I. Zon, and N. Terada, FEBS Lett. 497, 15 (2001).9T. Ishii, K. Yasuchika, H. Fujii, T. Hoppo, S. Baba, M. Naito, T. Machimoto, N. Kamo, H. Suemori, N. Nakatsuji,and I. Ikai, Exp. Cell Res. 309, 68 (2005).
10I. Barkefors, S. Le Jan, L. Jakobsson, E. Hejll, G. Carlson, H. Johansson, J. Jarvius, J. W. Park, N. Li Jeon,and J. Kreuger, J. Biol. Chem. 283, 13905 (2008).
11S. Faherty, M. T. Kane, and L. R. Quinlan, In Vitro Cell. Dev. Biol.: Anim. 41, 356 (2005).12B. G. Chung, L. A. Flanagan, S. W. Rhee, P. H. Schwartz, A. P. Lee, E. S. Monuki, and N. L. Jeon, Lab Chip 5, 401
(2005).13L. M. Przybyla and J. Voldman, Proc. Natl. Acad. Sci. U.S.A. 109, 835 (2012).14A. Khademhosseini, R. Langer, J. Borenstein, and J. P. Vacanti, Proc. Natl. Acad. Sci. U.S.A. 103, 2480 (2006).15K. Gupta, D. H. Kim, D. Ellison, C. Smith, A. Kundu, J. Tuan, K. Y. Suh, and A. Levchenko, Lab Chip 10, 2019 (2010).16H. W. Wu, C. C. Lin, S. M. Hwang, and G. B. Lee, presented at the 14th International Conference on Miniaturized Sys-
tems for Chemistry and Life Sciences, Groningen, The Netherlands, Proceedings of MicroTAS 2010 (MicroTAS, 2010),p. 13.
17D. van Noort, S. M. Ong, C. Zhang, S. Zhang, T. Arooz, and H. Yu, Biotechnol. Prog. 25, 52 (2009).18C. Yi, C. W. Li, S. Ji, and M. Yang, Anal. Chim. Acta 560, 1 (2006).19E. W. Young and D. J. Beebe, Chem. Soc. Rev. 39, 1036 (2010).20A. Webster, J. Greenman, and S. J. Haswella, J. Chem. Technol. Biotechnol. 86, 10 (2011).21M. S. Munson and P. Yager, presented at the 7th International Conference on Miniaturized Chemical and Biochemical
Analysis Systems, Squaw Valley, CA, USA, Proceedings of MicroTAS 2003 (MicroTAS, 2003), p. 495.22N. L. Jeon, S. K. Dertinger, D. T. Chiu, I. S. Choi, A. D. Stroock, and G. M. Whitesides, Langmuir 16, 8311 (2000).23D. Irimia, D. A. Geba, and M. Toner, Anal. Chem. 78, 3472 (2006).24L. Kim, M. D. Vahey, H. Y. Lee, and J. Voldman, Lab Chip 6, 394 (2006).25�S. Selimovic, W. Y. Sim, S. B. Kim, Y.-H. Jang, W. G. Lee, M. Khabiry, H. Bae, S. Jambovane, J. W. Hong, and
A. Khademhosseini, Anal. Chem. 83, 2020 (2011).26L. F. Barros, T. Kanaseki, R. Sabirov, S. Morishima, J. Castro, C. X. Bittner, E. Maeno, Y. Ando-Akatsuka, and
Y. Okada, Cell Death Differ. 10, 687 (2003).27C. Neils, Z. Tyree, B. Finlayson, and A. Folch, Lab Chip 4, 342 (2004).28H. P. Chou, M. A. Unger, and S. R. Quake, Biomed. Microdevices 3, 323 (2001).29H. Suzuki, C. M. Ho, and N. Kasagi, J. Microelectromech. Syst. 13, 779 (2004).30R. H. Liu, M. A. Stremler, K. V. Sharp, M. G. Olsen, J. G. Santiago, R. J. Adrian, H. Aref, and D. J. Beebe, J. Microelec-
tromech. Syst. 9, 190 (2000).31X. Jiang, Q. Xu, S. K. Dertinger, A. D. Stroock, T. M. Fu, and G. M. Whitesides, Anal. Chem. 77, 2338 (2005).32M. S. Williams, K. J. Longmuir, and P. Yager, Lab Chip 8, 1121 (2008).33A. D. Stroock, S. K. W. Dertinger, A. Ajdari, I. Mezic, H. A. Stone, and G. M. Whitesides, Science 25, 647 (2002).34S. Kim, H. J. Kim, and N. L. Jeon, Integr. Biol. 2, 584 (2010).35K. Norrby and L. Franzen, In Vitro Cell. Dev. Biol.: Plant 16, 31 (1980).36D. B. Mountcastle, E. Freire, and R. L. Biltonen, Biopolymers 15, 355 (1976).37J. Y. Park, C. M. Hwang, S. H. Lee, and S. H. Lee, Lab Chip 7, 1673 (2007).38J. El-Ali, P. K. Sorger, and K. F. Jensen, Nature 442, 403 (2006).
044109-13 Piraino et al. Biomicrofluidics 6, 044109 (2012)
This article is copyrighted as indicated in the article. Reuse of AIP content is subject to the terms at: http://scitation.aip.org/termsconditions. Downloaded to IP: 18.7.29.240
On: Wed, 19 Aug 2015 20:51:52
39B. Mosadegh, M. Agarwal, H. Tavana, T. Bersano-Begey, Y. Torisawa, M. Morell, M. J. Wyatt, K. S. O’Shea, K. F.Barald, and S. Takayama, Lab Chip 10, 2959 (2010).
40R. Gomez-Sjoberg, A. A. Leyrat, D. M. Pirone, C. S. Chen, and S. R. Quake, Anal. Chem. 79, 8557 (2007).41C. Kim, K. S. Lee, J. H. Bang, Y. E. Kim, M. C. Kim, K. W. Oh, S. H. Lee, and J. Y. Kang, Lab Chip 11, 874 (2011).42S. Lindstrom, K. Mori, T. Ohashi, and H. Andersson-Svahn, Electrophoresis 30, 4166 (2009).43M. Khoury, A. Bransky, N. Korin, L. C. Konak, G. Enikolopov, I. Tzchori, and S. Levenberg, Biomed. Microdevices 12,
1001 (2010).44Y. Y. Choi, B. G. Chung, D. H. Lee, A. Khademhosseini, J. H. Kim, and S. H. Lee, Biomaterials 31, 4296 (2010).45Y. Sakai, Y. Yoshiura, and K. Nakazawa, J. Biosci. Bioeng. 111, 85 (2011).46Y. Xu, F. Xie, T. Qiu, L. Xie, W. Xing, and J. Cheng, Biomicrofluidics 6, 16504 (2012).47L. Liu, C. Luo, X. Ni, L. Wang, K. Yamauchi, S. M. Nomura, N. Nakatsuji, and Y. Chen, Biomed. Microdevices 12, 505
(2010).48Y. C. Toh, C. Zhang, J. Zhang, Y. M. Khong, S. Chang, V. D. Samper, D. van Noort, D. W. Hutmacher, and H. Yu, Lab
Chip 7, 302 (2007).49Y. C. Toh, T. C. Lim, D. Tai, G. Xiao, D. van Noort, and H. Yu, Lab Chip 9, 2026 (2009).50�S. Selimovic, F. Piraino, H. Bae, M. Rasponi, A. Redaelli, and A. Khademhosseini, Lab Chip 11, 2325 (2011).51See figures in the supplementary material at http://dx.doi.org/10.1063/1.4766300 for details.52G. C. Randall and P. S. Doyle, Proc. Natl. Acad. Sci. U.S.A. 102, 10813 (2005).53S. C. Finkner and J. E. Gilley, Appl. Eng. Agric. 2, 104 (1986). Available at http://naldc.nal.usda.gov/download/17376/
PDF.54K. Ziolkowska, A. Stelmachowska, R. Kwapiszewski, M. Chudy, A. Dybko, and Z. Brzozka, “Long-term three-
dimensional cell culture and anticancer drug activity evaluation in a microfluidic chip,” Biosens. Bioelectron. (in press).55A. Khademhosseini, J. Yeh, G. Eng, J. Karp, H. Kaji, J. Borenstein, O. C. Farokhzad, and R. Langer, Lab Chip 5, 1380
(2005).56Y. H. Jang, C. H. Kwon, S. B. Kim, S. Selimovic, W. Y. Sim, H. Bae, and A. Khademhosseini, Biotechnol. J. 6, 156
(2011).57H. Wang, G. M. Riha, S. Yan, M. Li, H. Chan, H. Yang, Q. Yao, and C. Chen, Arterioscler., Thromb., Vasc. Biol. 25,
1817 (2005).58Y. C. Toh and J. Voldman, FASEB J. 25, 1208 (2011).59F. Ferrage, M. Zoonens, D. E. Warschawski, J. L. Popot, and G. Bodenhausen, J. Am. Chem. Soc. 125, 2541 (2003).60E. Kang, Y. Y. Choi, Y. Jun, B. G. Chung, and S.-H. Lee, Lab Chip 10, 2651 (2010).61S. B. Kim, H. Bae, J. M. Cha, S. J. Moon, M. R. Dokmeci, D. M. Cropek, and A. Khademhosseini, Lab Chip 11, 1801
(2011).62Z. R. Xu, C. G. Yang, C. H. Liu, Z. Zhou, J. Fang, and J. H. Wang, Talanta 80, 1088 (2010).63T.-Y. Teng, J. Appl. Cryst. 23, 387 (1990).64D. W. Rodgers, Methods Enzymol. 276, 183 (1997).
044109-14 Piraino et al. Biomicrofluidics 6, 044109 (2012)
This article is copyrighted as indicated in the article. Reuse of AIP content is subject to the terms at: http://scitation.aip.org/termsconditions. Downloaded to IP: 18.7.29.240
On: Wed, 19 Aug 2015 20:51:52


![Research Paper SETDB2 promoted breast cancer stem cell ... · In cancer research, SETDB2 has been found to be involved in cell cycle dysregulation in acute leukemia [20], associated](https://static.fdocument.org/doc/165x107/601f7898306ba373cd479a52/research-paper-setdb2-promoted-breast-cancer-stem-cell-in-cancer-research-setdb2.jpg)