NISTmAb RM 8671 Humanized Monoclonal IgG1κ · 5 NISTmAb Attributes by CE Methods ... AHT-UV_NR PDA...
23
NISTmAb RM 8671 Humanized Monoclonal IgG1κ Now Available! http://www.nist.gov/mml/bmd/nist-mab.cfm The First Publicly Available, Well-Characterized Reference Material for: System Suitability Technology Development Method Control Open Innovation
Transcript of NISTmAb RM 8671 Humanized Monoclonal IgG1κ · 5 NISTmAb Attributes by CE Methods ... AHT-UV_NR PDA...
1
NISTmAb RM 8671 Humanized Monoclonal IgG1κ
Now Available! http://www.nist.gov/mml/bmd/nist-mab.cfm
The First Publicly Available, Well-Characterized Reference Material for:
System Suitability
Technology Development
Method Control
Open Innovation
2
The NISTmAb: A Comprehensively Characterized Reference Material to
Support Biopharmaceutical Analytical Technology Development
Abigail Turner, John Schiel
CE Pharm 2016
September 28, 2016
San Diego, CA
3
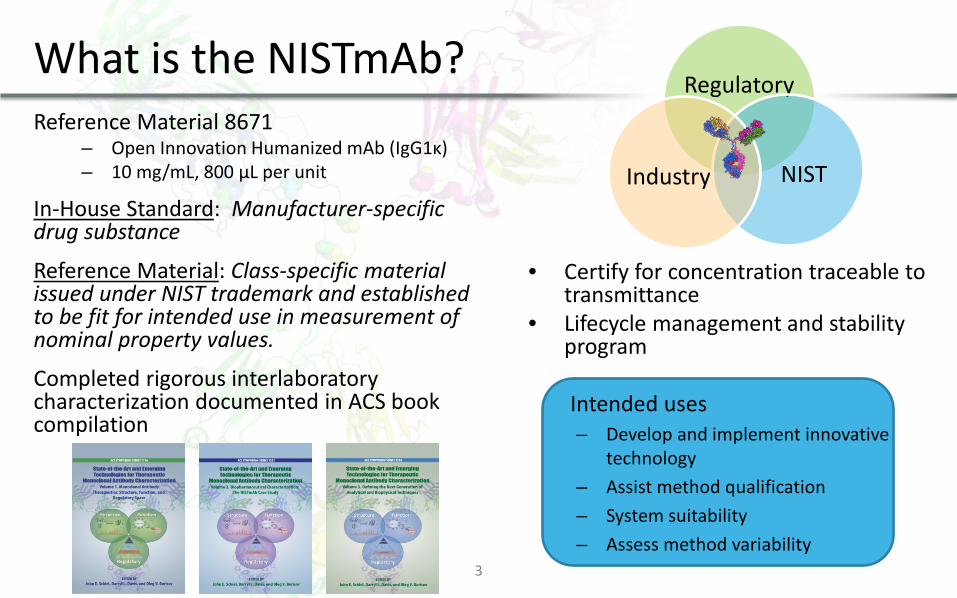
• Certify for concentration traceable to transmittance
• Lifecycle management and stability program Intended uses – Develop and implement innovative
technology – Assist method qualification – System suitability – Assess method variability
What is the NISTmAb? Reference Material 8671
– Open Innovation Humanized mAb (IgG1κ) – 10 mg/mL, 800 µL per unit
In-House Standard: Manufacturer-specific drug substance
Reference Material: Class-specific material issued under NIST trademark and established to be fit for intended use in measurement of nominal property values.
Completed rigorous interlaboratory characterization documented in ACS book compilation
Regulatory
NIST Industry
4
Comprehensive RM Characterization
• Peptide mapping by LC-MS/MS and CE-MS/MS – Primary Sequence
– S-S Bridge & PTM analysis
• Intact, middle down MS
• MS/MS library compilation • Glycosylation Analysis
• LC: SEC, RP, IEX, HIC
• CE: CIEF, CE-SDS, CZE
• SDS-PAGE
• HOS: NMR, HDX, XRD • Neutron scattering • Biophysical: CD, FTIR, DSC,
DLS, AUC, SLS, DSF
• Protein particulates • Many emerging technologies! On-going characterization and quality monitoring program
5
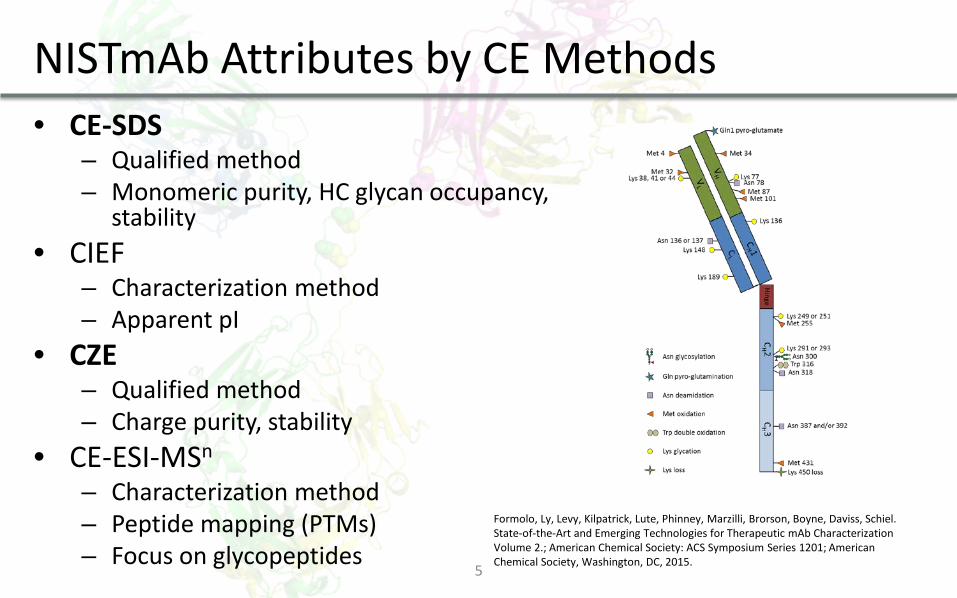
NISTmAb Attributes by CE Methods • CE-SDS
– Qualified method – Monomeric purity, HC glycan occupancy,
stability • CIEF
– Characterization method – Apparent pI
• CZE – Qualified method – Charge purity, stability
• CE-ESI-MSn
– Characterization method – Peptide mapping (PTMs) – Focus on glycopeptides
Formolo, Ly, Levy, Kilpatrick, Lute, Phinney, Marzilli, Brorson, Boyne, Daviss, Schiel. State-of-the-Art and Emerging Technologies for Therapeutic mAb Characterization Volume 2.; American Chemical Society: ACS Symposium Series 1201; American Chemical Society, Washington, DC, 2015.
6
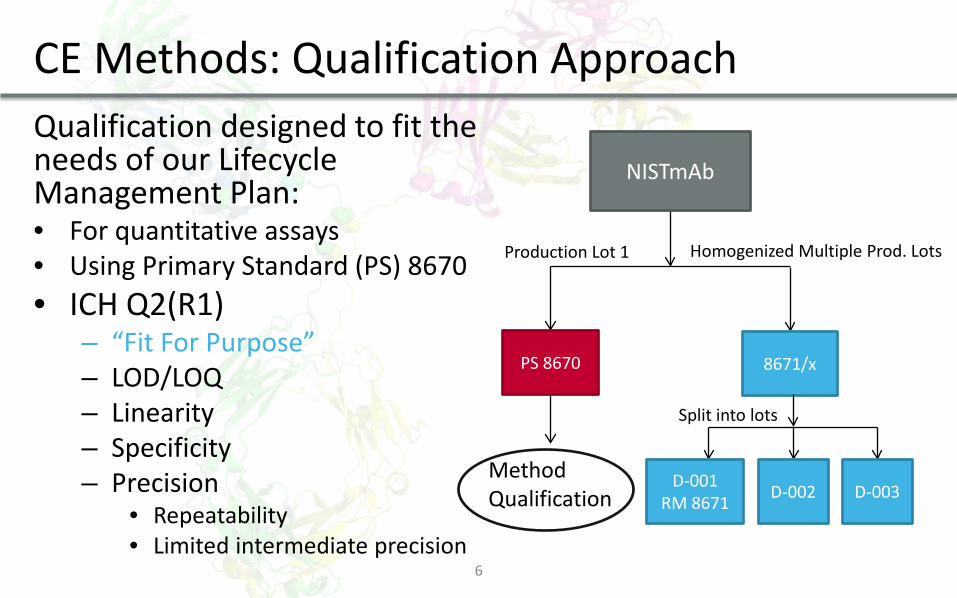
CE Methods: Qualification Approach Qualification designed to fit the needs of our Lifecycle Management Plan: • For quantitative assays • Using Primary Standard (PS) 8670 • ICH Q2(R1)
– “Fit For Purpose” – LOD/LOQ – Linearity – Specificity – Precision
• Repeatability • Limited intermediate precision
Production Lot 1
PS 8670
Homogenized Multiple Prod. Lots
8671/x
D-001 RM 8671 D-002 D-003
Split into lots
NISTmAb
Method Qualification
7
CE-SDS for Size Variants
8
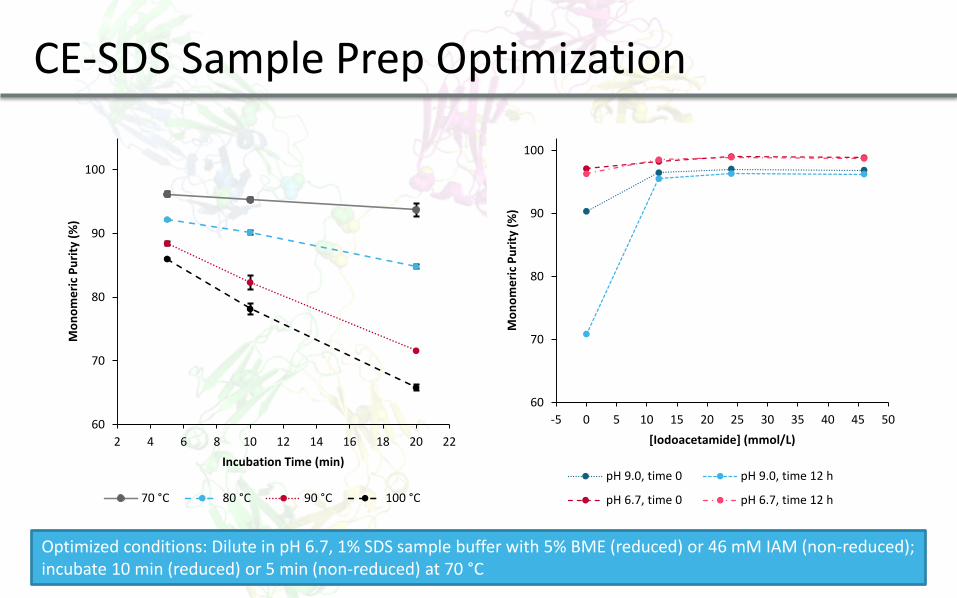
CE-SDS Sample Prep Optimization
60
70
80
90
100
2 4 6 8 10 12 14 16 18 20 22
Mon
omer
ic P
urity
(%)
Incubation Time (min)
70 °C 80 °C 90 °C 100 °C
60
70
80
90
100
-5 0 5 10 15 20 25 30 35 40 45 50
Mon
omer
ic P
urity
(%)
[Iodoacetamide] (mmol/L)
pH 9.0, time 0 pH 9.0, time 12 h
pH 6.7, time 0 pH 6.7, time 12 h
Optimized conditions: Dilute in pH 6.7, 1% SDS sample buffer with 5% BME (reduced) or 46 mM IAM (non-reduced); incubate 10 min (reduced) or 5 min (non-reduced) at 70 °C
9
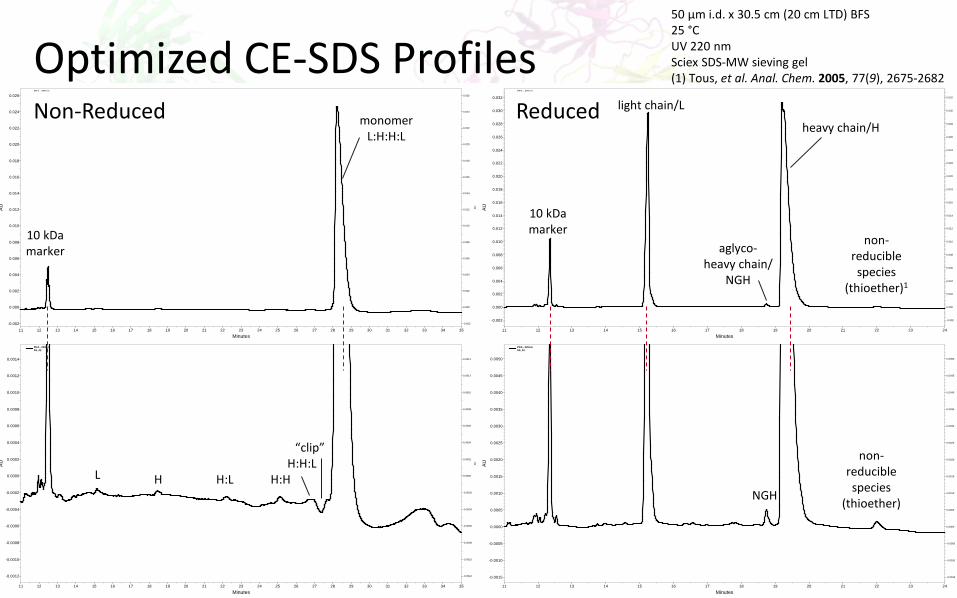
Optimized CE-SDS Profiles
Minutes11 12 13 14 15 16 17 18 19 20 21 22 23 24 25 26 27 28 29 30 31 32 33 34 35
AU
-0.002
0.000
0.002
0.004
0.006
0.008
0.010
0.012
0.014
0.016
0.018
0.020
0.022
0.024
0.026
AU
-0.002
0.000
0.002
0.004
0.006
0.008
0.010
0.012
0.014
0.016
0.018
0.020
0.022
0.024
0.026
PDA - 220nmSS_02
Minutes11 12 13 14 15 16 17 18 19 20 21 22 23 24 25 26 27 28 29 30 31 32 33 34 35
AU
-0.0012
-0.0010
-0.0008
-0.0006
-0.0004
-0.0002
0.0000
0.0002
0.0004
0.0006
0.0008
0.0010
0.0012
0.0014
AU
-0.0012
-0.0010
-0.0008
-0.0006
-0.0004
-0.0002
0.0000
0.0002
0.0004
0.0006
0.0008
0.0010
0.0012
0.0014
PDA - 220nmSS_02
Minutes11 12 13 14 15 16 17 18 19 20 21 22 23 24
AU
-0.002
0.000
0.002
0.004
0.006
0.008
0.010
0.012
0.014
0.016
0.018
0.020
0.022
0.024
0.026
0.028
0.030
0.032
AU
-0.002
0.000
0.002
0.004
0.006
0.008
0.010
0.012
0.014
0.016
0.018
0.020
0.022
0.024
0.026
0.028
0.030
0.032
PDA - 220nmSS_04
Minutes11 12 13 14 15 16 17 18 19 20 21 22 23 24
AU
-0.0015
-0.0010
-0.0005
0.0000
0.0005
0.0010
0.0015
0.0020
0.0025
0.0030
0.0035
0.0040
0.0045
0.0050
AU
-0.0015
-0.0010
-0.0005
0.0000
0.0005
0.0010
0.0015
0.0020
0.0025
0.0030
0.0035
0.0040
0.0045
0.0050
PDA - 220nmSS_04
Non-Reduced Reduced
10 kDa marker
monomer L:H:H:L
10 kDa marker
light chain/L
heavy chain/H
aglyco- heavy chain/
NGH
non-reducible species
(thioether)1
non-reducible species
(thioether)
L NGH
H H:L H:H H:H:L
“clip”
50 µm i.d. x 30.5 cm (20 cm LTD) BFS 25 °C UV 220 nm Sciex SDS-MW sieving gel (1) Tous, et al. Anal. Chem. 2005, 77(9), 2675-2682
12 Minutes
12 14 16 18 20 22 24 26 28 30 32 34A
U
-0.0005
0.0000
0.0005
0.0010
0.0015
0.0020
0.0025
0.0030
0.0035
0.0040
AU
-0.0005
0.0000
0.0005
0.0010
0.0015
0.0020
0.0025
0.0030
0.0035
0.0040
PDA - 220nmAHT-UV_NR
PDA - 220nmAHT+UV_NR
10 kDa
L H H:L H:H
H:H:L clip
monomer
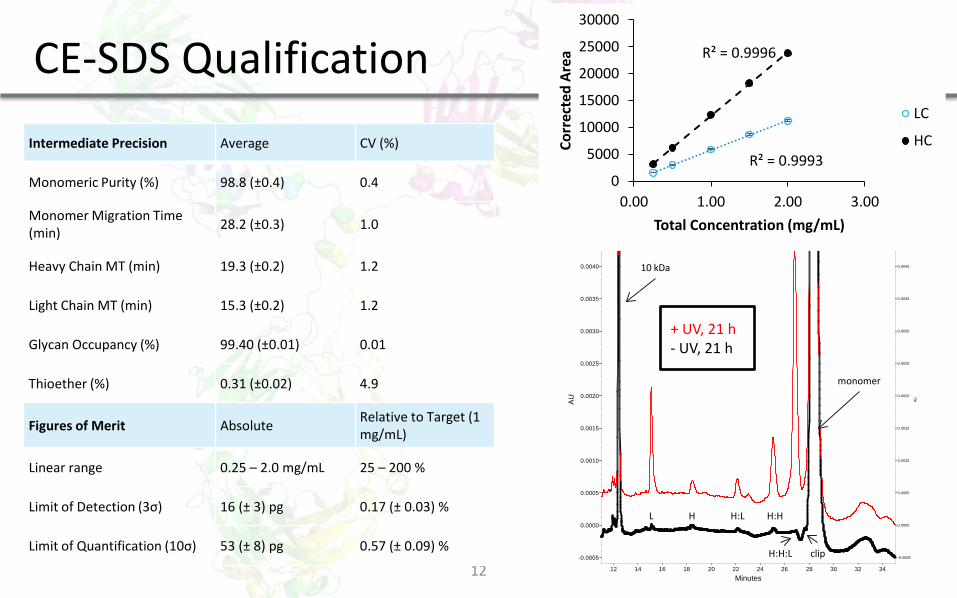
CE-SDS Qualification Intermediate Precision Average CV (%)
Monomeric Purity (%) 98.8 (±0.4) 0.4
Monomer Migration Time (min) 28.2 (±0.3) 1.0
Heavy Chain MT (min) 19.3 (±0.2) 1.2
Light Chain MT (min) 15.3 (±0.2) 1.2
Glycan Occupancy (%) 99.40 (±0.01) 0.01
Thioether (%) 0.31 (±0.02) 4.9
Figures of Merit Absolute Relative to Target (1 mg/mL)
Linear range 0.25 – 2.0 mg/mL 25 – 200 %
Limit of Detection (3σ) 16 (± 3) pg 0.17 (± 0.03) %
Limit of Quantification (10σ) 53 (± 8) pg 0.57 (± 0.09) %
R² = 0.9993
R² = 0.9996
0
5000
10000
15000
20000
25000
30000
0.00 1.00 2.00 3.00
Corr
ecte
d Ar
ea
Total Concentration (mg/mL)
LC
HC
+ UV, 21 h - UV, 21 h
15
Charge Sensitive Methods
16
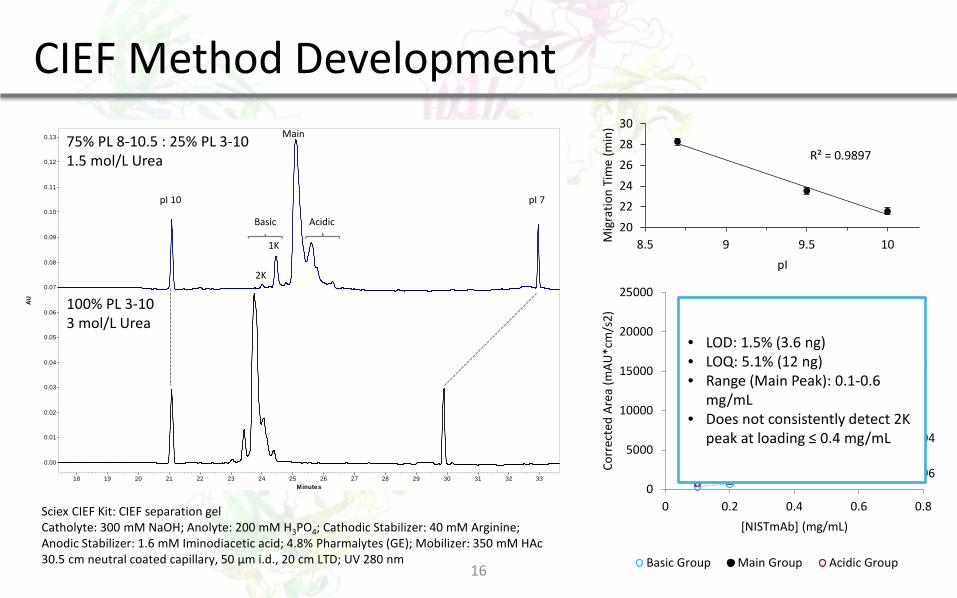
CIEF Method Development
R² = 0.9996
R² = 0.9997
R² = 0.9994
0
5000
10000
15000
20000
25000
0 0.2 0.4 0.6 0.8
Corr
ecte
d Ar
ea (m
AU*c
m/s
2)
[NISTmAb] (mg/mL)
Basic Group Main Group Acidic Group
Minutes18 19 20 21 22 23 24 25 26 27 28 29 30 31 32 33
AU
0.00
0.01
0.02
0.03
0.04
0.05
0.06
0.07
0.08
0.09
0.10
0.11
0.12
0.13
pI 10 pI 7
75% PL 8-10.5 : 25% PL 3-10 1.5 mol/L Urea
100% PL 3-10 3 mol/L Urea
2K
1K
Main
Acidic Basic
R² = 0.9897
202224262830
8.5 9 9.5 10Mig
ratio
n Ti
me
(min
)
pI
Sciex CIEF Kit: CIEF separation gel Catholyte: 300 mM NaOH; Anolyte: 200 mM H3PO4; Cathodic Stabilizer: 40 mM Arginine; Anodic Stabilizer: 1.6 mM Iminodiacetic acid; 4.8% Pharmalytes (GE); Mobilizer: 350 mM HAc 30.5 cm neutral coated capillary, 50 µm i.d., 20 cm LTD; UV 280 nm
• LOD: 1.5% (3.6 ng) • LOQ: 5.1% (12 ng) • Range (Main Peak): 0.1-0.6
mg/mL • Does not consistently detect 2K
peak at loading ≤ 0.4 mg/mL
17
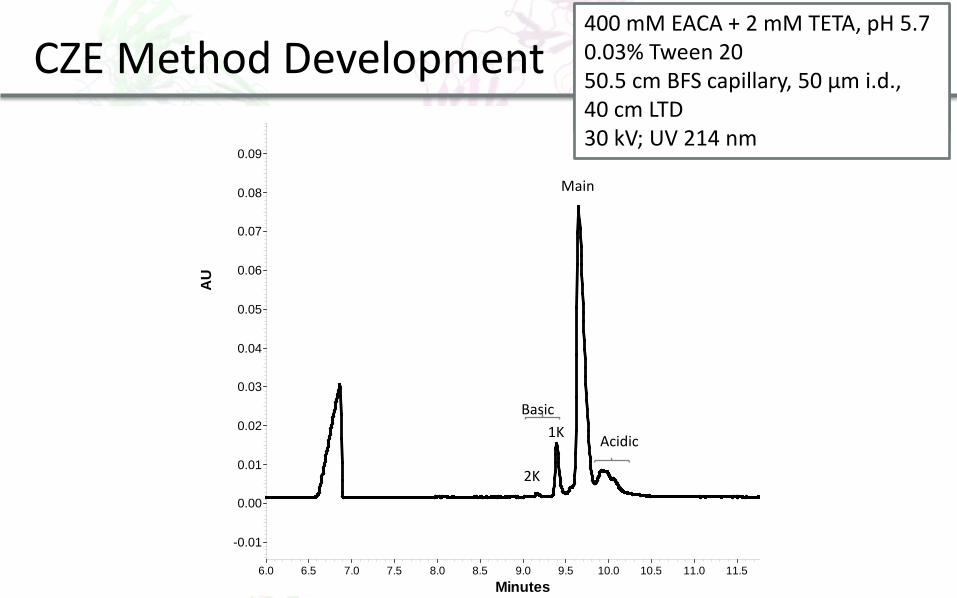
CZE Method Development
Minutes7 8 9 10 11 12 13 14
Minutes6 7 8 9 10 11 12 13
Repl
icat
e in
ject
ions
Tween 20 (0.03%) HPMC (0.05%)
He, et al. J. Sep. Sci. 2011
EACA
TETA
HPMC
Tween 20
Minutes6.0 6.5 7.0 7.5 8.0 8.5 9.0 9.5 10.0 10.5 11.0 11.5
AU
-0.01
0.00
0.01
0.02
0.03
0.04
0.05
0.06
0.07
0.08
0.09
2K
1K
Main
Acidic
Basic
400 mM EACA + 2 mM TETA, pH 5.7 50.5 cm BFS capillary, 50 µm i.d., 40 cm LTD 30 kV; UV 214 nm
400 mM EACA + 2 mM TETA, pH 5.7 0.03% Tween 20 50.5 cm BFS capillary, 50 µm i.d., 40 cm LTD 30 kV; UV 214 nm
20
CIEF CZE Intra-Day Precision (1 day, 1 column)
Average (± SD) CV Intermediate Precision (6 days, 3 columns)
Average (± u) u = total uncertainty from ANOVA*
CV
Main Peak Migration Time (min) 25.54 (± 0.20) 0.78 % Main Peak Migration Time (min) 9.67 (± 0.17) 1.8%
Main Peak Apparent pI 9.2 (± 0.01) 0.11 % IQ Standard Migration Time (min) 5.79 (± 0.06) 1.0%
pH Gradient Linearity (RSQ) 0.990 (± 0.001) 0.07 %
Main Group RA (%) 72.5 (± 0.4) 0.6 % Main Group RA (%) 74.7 (± 0.3) 0.5 %
Acidic Group RA (%) 19.9 (± 0.5) 2.5 % Acidic Group RA (%) 16.8 (± 0.4) 2.4 %
Basic Group RA (%) 7.6 (± 0.2) 2.6 % Basic Group RA (%) 8.5 (± 0.3) 3.3 %
Figures of Merit
Limit of Detection (3σ) 3.6 (± 0.2) ng 1.5 (±0.1) % at Target Limit of Detection (3σ) 0.044 (± 0.012) ng 0.2 (± 0.1) % at Target
Limit of Quantification (10σ) 11.9 (± 0.7) ng 5.1 (± 0.3) % at Target Limit of Quantification (10σ) 0.150 (± 0.039) ng 0.7 (± 0.2) % at Target
Linear Range (Main Peak) 0.1─0.6 mg/mL 25-150% of Target Linear Range (Main Peak) 0.25─2.5 mg/mL 17─170 % of Target
Resolution (1K:Main) 1.6 (± 0.1) Resolution (1K:Main) 0.9 (± 0.001)
Theoretical Plates (Main Peak) 8 x 10⁴ Theoretical Plates (Main Peak) 6 x 10⁴
Sample Consumption 240 ng Sample Consumption 20 ng
Run Time per Sample 55 min Run Time per Sample 25 min
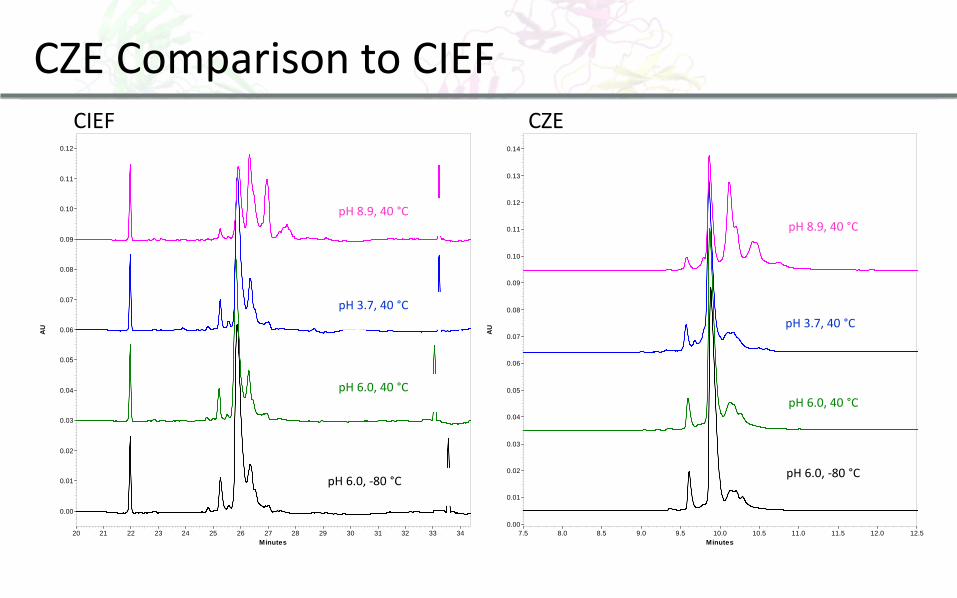
CZE Comparison to CIEF
*Total uncertainty u (for CZE only) was calculated using ANOVA to identify within-day and between-day variances in the intermediate precision dataset.
Minutes20 21 22 23 24 25 26 27 28 29 30 31 32 33 34
AU
0.00
0.01
0.02
0.03
0.04
0.05
0.06
0.07
0.08
0.09
0.10
0.11
0.12
pH 6.0, -80 °C
pH 6.0, 40 °C
pH 3.7, 40 °C
pH 8.9, 40 °C
Minutes7.5 8.0 8.5 9.0 9.5 10.0 10.5 11.0 11.5 12.0 12.5
AU
0.00
0.01
0.02
0.03
0.04
0.05
0.06
0.07
0.08
0.09
0.10
0.11
0.12
0.13
0.14
pH 6.0, -80 °C
pH 6.0, 40 °C
pH 3.7, 40 °C
pH 8.9, 40 °C
CIEF CZE
22
NISTmAb RM 8671 Attributes by Qualified CE Methods
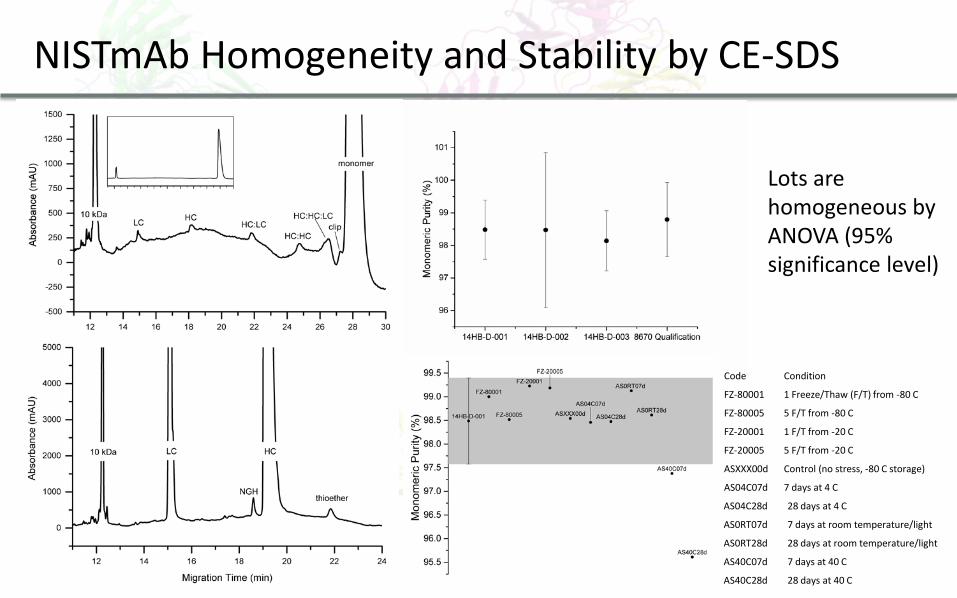
NISTmAb Homogeneity and Stability by CE-SDS
Code Condition
FZ-80001 1 Freeze/Thaw (F/T) from -80 C
FZ-80005 5 F/T from -80 C
FZ-20001 1 F/T from -20 C
FZ-20005 5 F/T from -20 C
ASXXX00d Control (no stress, -80 C storage)
AS04C07d 7 days at 4 C
AS04C28d 28 days at 4 C
AS0RT07d 7 days at room temperature/light
AS0RT28d 28 days at room temperature/light
AS40C07d 7 days at 40 C
AS40C28d 28 days at 40 C
Lots are homogeneous by ANOVA (95% significance level)
24
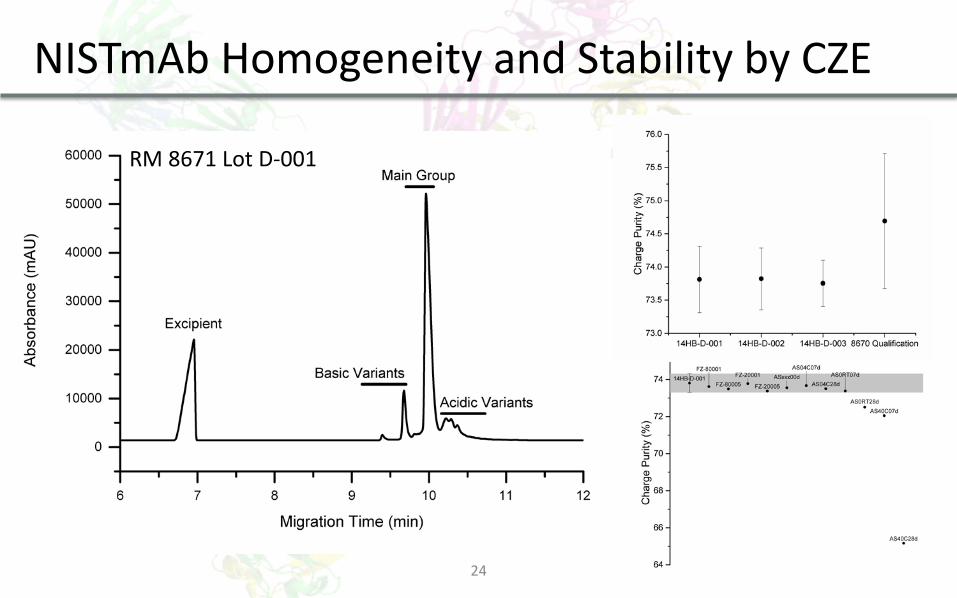
NISTmAb Homogeneity and Stability by CZE
RM 8671 Lot D-001
25
CE-MSn
26
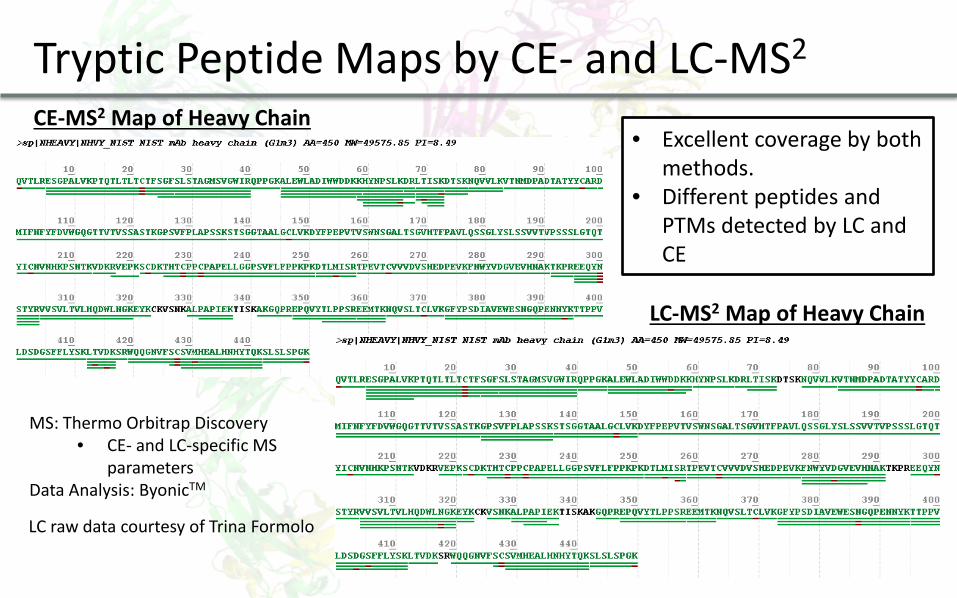
Tryptic Peptide Maps by CE- and LC-MS2
CE-MS2 Map of Heavy Chain
LC-MS2 Map of Heavy Chain
MS: Thermo Orbitrap Discovery • CE- and LC-specific MS
parameters Data Analysis: ByonicTM
LC raw data courtesy of Trina Formolo
• Excellent coverage by both methods.
• Different peptides and PTMs detected by LC and CE
28
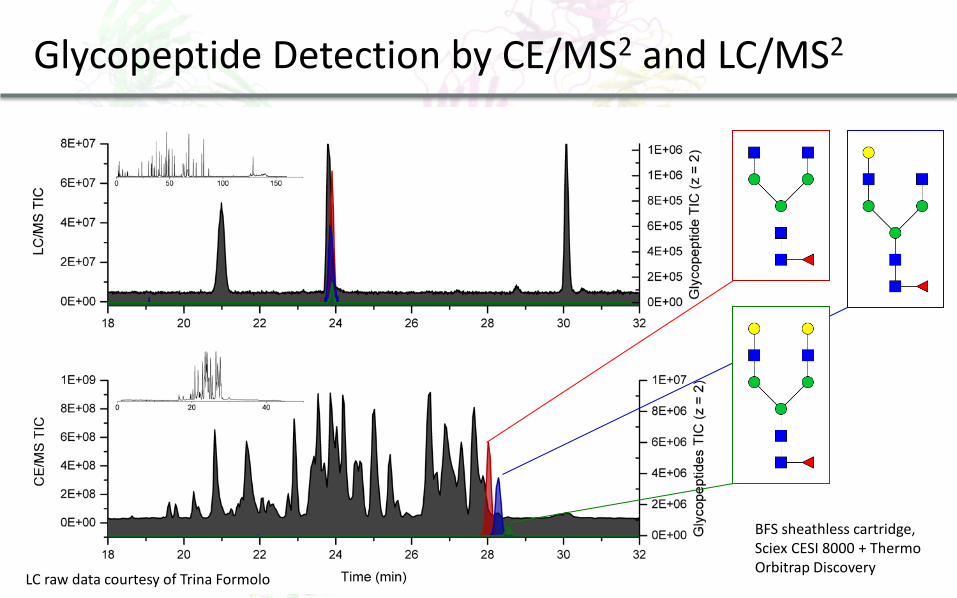
Glycopeptide Detection by CE/MS2 and LC/MS2
LC raw data courtesy of Trina Formolo
BFS sheathless cartridge, Sciex CESI 8000 + Thermo Orbitrap Discovery
29
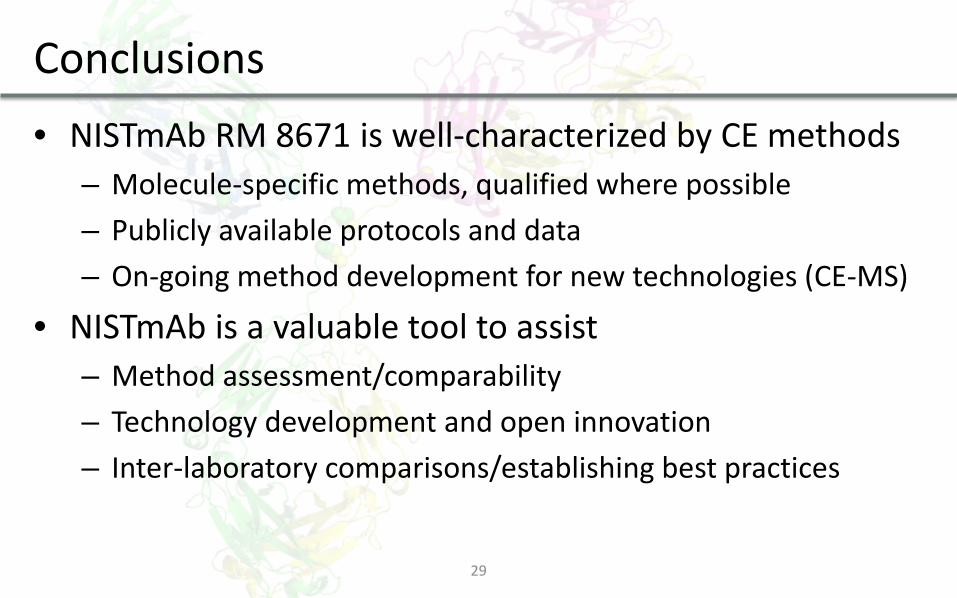
Conclusions • NISTmAb RM 8671 is well-characterized by CE methods
– Molecule-specific methods, qualified where possible – Publicly available protocols and data – On-going method development for new technologies (CE-MS)
• NISTmAb is a valuable tool to assist – Method assessment/comparability – Technology development and open innovation – Inter-laboratory comparisons/establishing best practices
30
Acknowledgments NISTmAb Certification Team John Schiel (CASSS MS Poster P-118-W ) Catherine Formolo (CASSS MS Poster P-142-W ) Katharina Yandrofski Srivalli Telikepalli Paul DeRose
31
Laurie Locascio (MML Lab Director) Michael Tarlov (Division Chief) Karen Phinney (Bionalytical Sciences Group Leader) John Marino (Biomolecular Structure GL) Dean Ripple (Process Meas. GL) Trina Formolo (Peptide Mapping) Abigail Turner (CE, CE-MS) Katharina Yandrofski (SEC, Glycoanalysis) Srivalli Telikepalli (Protein particles) Paul DeRose (UV) John Marino (NMR) Rob Brinson (NMR) Luke Arbogast (NMR) Frank Delaglio (NMR data processing & informatics) Marc Cicerone (Lyo Protein stability, optical methods) Miaochan Zhi (Lyo Protein stability, optical methods) Young Lee (Broadband Raman optical activity) Ian Ryu (Broadband Raman optical activity) Mark Lowenthal (Glycan Reference Materials) Joseph Curtis (SANS of IgGs) Monica Castellanos (SANS of IgGs)
Acknowledgements: NIST Biomanufacturing Team
Ronald Jones (nSoft) Steve Hudson (Protein rheology, viscometry) John Royer (Protein rheology, viscometry) Dick Cavicchi (Protein particle measurement technologies) Wyatt Vreeland (Particle and mAb AFFFF) Adrian Defante (Particle and mAb AFFFF) Travis Gallagher (NISTmAb x-ray crystallography) Alex Grishaev (Protein x-ray scattering) Jeff Hudgens (HDX-MS) Ioannis Karageorgos (HDX-MS) Steve Stein (MS Library) Lorna de Leoz (Glyco MS library) Kelly Telu (CHO & cell culture media MS library) Tytus Mak (Cell culture metabolite MS library) Vince Shen (Coarse-grain modeling of mAbs) Marco Blanco (Coarse-grain modeling of mAbs) Ken Cole (Cell-line ID) Sumona Sukar (Cell counting)