neutrons - cds.cern.ch · 14University of Santiago de Compostela, Spain 15Universitat Polit ecnica...
20
Cross section measurements of 155,157 Gd(n,γ ) induced by thermal and epithermal neutrons M. Mastromarco, 1 A. Manna, 2, 3 O. Aberle, 4 S. Amaducci, 2, 3 J. Andrzejewski, 5 L. Audouin, 6 M. Bacak, 7, 4, 8 J. Balibrea, 9 M. Barbagallo, 1 F. Beˇ cv´ aˇ r, 10 E. Berthoumieux, 8 J. Billowes, 11 D. Bosnar, 12 A. Brown, 13 M. Caama˜ no, 14 F. Calvi˜ no, 15 M. Calviani, 4 D. Cano-Ott, 9 R. Cardella, 4 A. Casanovas, 15 D. M. Castelluccio, 16, 2 F. Cerutti, 4 Y. H. Chen, 6 E. Chiaveri, 4, 11, 17 G. Clai, 16, 2 N. Colonna, 1 G. Cort´ es, 15 M. A. Cort´ es-Giraldo, 17 L. Cosentino, 18 L. A. Damone, 1, 19 M. Diakaki, 8 M. Dietz, 20 C. Domingo-Pardo, 21 R. Dressler, 22 E. Dupont, 8 I. Dur´ an, 14 B. Fern´ andez-Dom´ ınguez, 14 A. Ferrari, 4 P. Ferreira, 23 P. Finocchiaro, 18 V. Furman, 24 K. G¨ obel, 25 A. R. Garc´ ıa, 9 A. Gawlik, 5 S. Gilardoni, 4 T. Glodariu, 26 I. F. Gon¸calves, 23 E. Gonz´ alez-Romero, 9 E. Griesmayer, 7 C. Guerrero, 17 A. Guglielmelli, 16 F. Gunsing, 8, 4 H. Harada, 27 S. Heinitz, 22 J. Heyse, 28 D. G. Jenkins, 13 E. Jericha, 7 F. K¨ appeler, 29 Y. Kadi, 4 A. Kalamara, 30 P. Kavrigin, 7 A. Kimura, 27 N. Kivel, 22 M. Kokkoris, 30 M. Krtiˇ cka, 10 D. Kurtulgil, 25 E. Leal-Cidoncha, 14 C. Lederer-Woods, 20 H. Leeb, 7 J. Lerendegui-Marco, 17 S. J. Lonsdale, 20 D. Macina, 4 J. Marganiec, 5, 31 T. Mart´ ınez, 9 A. Masi, 4 C. Massimi, 2, 3, * P. Mastinu, 32 E. A. Maugeri, 22 A. Mazzone, 1, 33 E. Mendoza, 9 A. Mengoni, 16, 2 P. M. Milazzo, 34 F. Mingrone, 4 A. Musumarra, 18, 35 A. Negret, 26 R. Nolte, 31 A. Oprea, 26 N. Patronis, 36 A. Pavlik, 37 J. Perkowski, 5 I. Porras, 38 J. Praena, 38 J. M. Quesada, 17 D. Radeck, 31 T. Rauscher, 39, 40 R. Reifarth, 25 F. Rocchi, 16 C. Rubbia, 4 J. A. Ryan, 11 M. Sabat´ e-Gilarte, 4, 17 A. Saxena, 41 P. Schillebeeckx, 28 D. Schumann, 22 P. Sedyshev, 24 A. G. Smith, 11 N. V. Sosnin, 11 A. Stamatopoulos, 30 G. Tagliente, 1 J. L. Tain, 21 A. Tarife˜ no-Saldivia, 15 L. Tassan-Got, 6 S. Valenta, 10 G. Vannini, 2, 3 V. Variale, 1 P. Vaz, 23 A. Ventura, 2 V. Vlachoudis, 4 R. Vlastou, 30 A. Wallner, 42 S. Warren, 11 C. Weiss, 7 P. J. Woods, 20 T. Wright, 11 and P. ˇ Zugec 12, 4 (The n TOF Collaboration (www.cern.ch/ntof)) 1 Istituto Nazionale di Fisica Nucleare, Sezione di Bari, Italy 2 Istituto Nazionale di Fisica Nucleare, Sezione di Bologna, Italy 3 Dipartimento di Fisica e Astronomia, Universit` a di Bologna, Italy 4 European Organization for Nuclear Research (CERN), Switzerland 5 University of Lodz, Poland 6 Institut de Physique Nucl´ eaire, CNRS-IN2P3, Univ. Paris-Sud, Universit´ e Paris-Saclay, F-91406 Orsay Cedex, France 7 Technische Universit¨ at Wien, Austria 8 CEA Irfu, Universit´ e Paris-Saclay, F-91191 Gif-sur-Yvette, France 9 Centro de Investigaciones Energ´ eticas Medioambientales y Tecnol´ ogicas (CIEMAT), Spain 10 Charles University, Prague, Czech Republic 11 University of Manchester, United Kingdom 12 Department of Physics, Faculty of Science, University of Zagreb, Zagreb, Croatia 13 University of York, United Kingdom 14 University of Santiago de Compostela, Spain 15 Universitat Polit` ecnica de Catalunya, Spain 16 Agenzia nazionale per le nuove tecnologie (ENEA), Bologna, Italy 17 Universidad de Sevilla, Spain 18 INFN Laboratori Nazionali del Sud, Catania, Italy 19 Dipartimento di Fisica, Universit` a degli Studi di Bari, Italy 20 School of Physics and Astronomy, University of Edinburgh, United Kingdom 21 IFIC, CSIC - Universidad de Valencia, Spain 22 Paul Scherrer Institut (PSI), Villingen, Switzerland 23 Instituto Superior T´ ecnico, Lisbon, Portugal 24 Joint Institute for Nuclear Research (JINR), Dubna, Russia 25 Goethe University Frankfurt, Germany 26 Horia Hulubei National Institute of Physics and Nuclear Engineering, Romania 27 Japan Atomic Energy Agency (JAEA), Tokai-mura, Japan 28 European Commission, Joint Research Centre, Geel, Retieseweg 111, B-2440 Geel, Belgium 29 Karlsruhe Institute of Technology, Campus North, IKP, 76021 Karlsruhe, Germany 30 National Technical University of Athens, Greece 31 Physikalisch-Technische Bundesanstalt (PTB), Bundesallee 100, 38116 Braunschweig, Germany 32 Istituto Nazionale di Fisica Nucleare, Sezione di Legnaro, Italy 33 Consiglio Nazionale delle Ricerche, Bari, Italy 34 Istituto Nazionale di Fisica Nucleare, Sezione di Trieste, Italy 35 Dipartimento di Fisica e Astronomia, Universit` a di Catania, Italy 36 University of Ioannina, Greece arXiv:1805.04149v1 [nucl-ex] 10 May 2018
Transcript of neutrons - cds.cern.ch · 14University of Santiago de Compostela, Spain 15Universitat Polit ecnica...

Cross section measurements of 155,157Gd(n,γ) induced by thermal and epithermalneutrons
M. Mastromarco,1 A. Manna,2, 3 O. Aberle,4 S. Amaducci,2, 3 J. Andrzejewski,5 L. Audouin,6 M. Bacak,7, 4, 8
J. Balibrea,9 M. Barbagallo,1 F. Becvar,10 E. Berthoumieux,8 J. Billowes,11 D. Bosnar,12 A. Brown,13
M. Caamano,14 F. Calvino,15 M. Calviani,4 D. Cano-Ott,9 R. Cardella,4 A. Casanovas,15 D. M. Castelluccio,16, 2
F. Cerutti,4 Y. H. Chen,6 E. Chiaveri,4, 11, 17 G. Clai,16, 2 N. Colonna,1 G. Cortes,15 M. A. Cortes-Giraldo,17
L. Cosentino,18 L. A. Damone,1, 19 M. Diakaki,8 M. Dietz,20 C. Domingo-Pardo,21 R. Dressler,22 E. Dupont,8
I. Duran,14 B. Fernandez-Domınguez,14 A. Ferrari,4 P. Ferreira,23 P. Finocchiaro,18 V. Furman,24 K. Gobel,25
A. R. Garcıa,9 A. Gawlik,5 S. Gilardoni,4 T. Glodariu,26 I. F. Goncalves,23 E. Gonzalez-Romero,9
E. Griesmayer,7 C. Guerrero,17 A. Guglielmelli,16 F. Gunsing,8, 4 H. Harada,27 S. Heinitz,22 J. Heyse,28
D. G. Jenkins,13 E. Jericha,7 F. Kappeler,29 Y. Kadi,4 A. Kalamara,30 P. Kavrigin,7 A. Kimura,27
N. Kivel,22 M. Kokkoris,30 M. Krticka,10 D. Kurtulgil,25 E. Leal-Cidoncha,14 C. Lederer-Woods,20
H. Leeb,7 J. Lerendegui-Marco,17 S. J. Lonsdale,20 D. Macina,4 J. Marganiec,5, 31 T. Martınez,9 A. Masi,4
C. Massimi,2, 3, ∗ P. Mastinu,32 E. A. Maugeri,22 A. Mazzone,1, 33 E. Mendoza,9 A. Mengoni,16, 2 P. M. Milazzo,34
F. Mingrone,4 A. Musumarra,18, 35 A. Negret,26 R. Nolte,31 A. Oprea,26 N. Patronis,36 A. Pavlik,37
J. Perkowski,5 I. Porras,38 J. Praena,38 J. M. Quesada,17 D. Radeck,31 T. Rauscher,39, 40 R. Reifarth,25
F. Rocchi,16 C. Rubbia,4 J. A. Ryan,11 M. Sabate-Gilarte,4, 17 A. Saxena,41 P. Schillebeeckx,28 D. Schumann,22
P. Sedyshev,24 A. G. Smith,11 N. V. Sosnin,11 A. Stamatopoulos,30 G. Tagliente,1 J. L. Tain,21
A. Tarifeno-Saldivia,15 L. Tassan-Got,6 S. Valenta,10 G. Vannini,2, 3 V. Variale,1 P. Vaz,23 A. Ventura,2
V. Vlachoudis,4 R. Vlastou,30 A. Wallner,42 S. Warren,11 C. Weiss,7 P. J. Woods,20 T. Wright,11 and P. Zugec12, 4
(The n TOF Collaboration (www.cern.ch/ntof))1Istituto Nazionale di Fisica Nucleare, Sezione di Bari, Italy
2Istituto Nazionale di Fisica Nucleare, Sezione di Bologna, Italy3Dipartimento di Fisica e Astronomia, Universita di Bologna, Italy4European Organization for Nuclear Research (CERN), Switzerland
5University of Lodz, Poland6Institut de Physique Nucleaire, CNRS-IN2P3, Univ. Paris-Sud,
Universite Paris-Saclay, F-91406 Orsay Cedex, France7Technische Universitat Wien, Austria
8CEA Irfu, Universite Paris-Saclay, F-91191 Gif-sur-Yvette, France9Centro de Investigaciones Energeticas Medioambientales y Tecnologicas (CIEMAT), Spain
10Charles University, Prague, Czech Republic11University of Manchester, United Kingdom
12Department of Physics, Faculty of Science, University of Zagreb, Zagreb, Croatia13University of York, United Kingdom
14University of Santiago de Compostela, Spain15Universitat Politecnica de Catalunya, Spain
16Agenzia nazionale per le nuove tecnologie (ENEA), Bologna, Italy17Universidad de Sevilla, Spain
18INFN Laboratori Nazionali del Sud, Catania, Italy19Dipartimento di Fisica, Universita degli Studi di Bari, Italy
20School of Physics and Astronomy, University of Edinburgh, United Kingdom21IFIC, CSIC - Universidad de Valencia, Spain
22Paul Scherrer Institut (PSI), Villingen, Switzerland23Instituto Superior Tecnico, Lisbon, Portugal
24Joint Institute for Nuclear Research (JINR), Dubna, Russia25Goethe University Frankfurt, Germany
26Horia Hulubei National Institute of Physics and Nuclear Engineering, Romania27Japan Atomic Energy Agency (JAEA), Tokai-mura, Japan
28European Commission, Joint Research Centre, Geel, Retieseweg 111, B-2440 Geel, Belgium29Karlsruhe Institute of Technology, Campus North, IKP, 76021 Karlsruhe, Germany
30National Technical University of Athens, Greece31Physikalisch-Technische Bundesanstalt (PTB), Bundesallee 100, 38116 Braunschweig, Germany
32Istituto Nazionale di Fisica Nucleare, Sezione di Legnaro, Italy33Consiglio Nazionale delle Ricerche, Bari, Italy
34Istituto Nazionale di Fisica Nucleare, Sezione di Trieste, Italy35Dipartimento di Fisica e Astronomia, Universita di Catania, Italy
36University of Ioannina, Greece
arX
iv:1
805.
0414
9v1
[nu
cl-e
x] 1
0 M
ay 2
018

2
37University of Vienna, Faculty of Physics, Vienna, Austria38University of Granada, Spain
39Department of Physics, University of Basel, Switzerland40Centre for Astrophysics Research, University of Hertfordshire, United Kingdom
41Bhabha Atomic Research Centre (BARC), India42Australian National University, Canberra, Australia
(Dated: May 14, 2018)
Neutron capture measurements on 155Gd and 157Gd were performed using the time-of-flight tech-nique at the n TOF facility at CERN. Four samples in form of self-sustaining metallic discs isotopi-cally enriched in 155Gd and 157Gd were used. The measurements were carried out at the experi-mental area (EAR1) at 185 m from the neutron source, with an array of 4 C6D6 liquid scintillationdetectors.
The capture cross sections of 155Gd and 157Gd at neutron kinetic energy of 0.0253 eV have beenestimated to be 62.2(2.2) kb and 239.8(9.3) kb, respectively, thus up to 6% different relative to theones reported in the nuclear data libraries. A resonance shape analysis has been performed in theresolved resonance region up to 180 eV and 300 eV, respectively, in average resonance parametershave been found in good agreement with evaluations. Above these energies the observed resonance-like structures in the cross section have been tentatively characterised in terms of resonance energyand area up to 1 keV.
I. INTRODUCTION
The natural element with the highest cross section forthermal neutrons is Gadolinium. Among its 7 stable iso-topes, 157Gd and, to a smaller extent, 155Gd are respon-sible for this feature, mainly attributable to the existenceof a neutron resonance near thermal energy (i. e. neu-tron kinetic energy En = 0.0253 eV, corresponding toa speed of 2200 m/s). Accurate values of the neutroncapture cross section of gadolinium isotopes are requiredin many fields of science: for the understanding of thenucleosynthesis of elements beyond iron in stars (via thes and r processes) [1]; for the neutron capture therapy ofcancer [2]; for the development of neutrino detectors [3]and for nuclear technologies. In the last case, it has a rel-evant role in the neutron balance and the safety featuresof Light Water Reactors and Canada deuterium uranium(CANDU) reactor types, since gadolinium is used as theburnable poison in the fuel pin or moderator in the reac-tor core [4].
The 155Gd(n,γ) and 157Gd(n,γ) cross sections areavailable in nuclear data libraries such as ENDF/B-VIII.0 [5], JEFF-3.3 [6], and JENDL-4.0 [7]. In par-ticular, ENDF/B-VIII.0 is taken over from the previousENDF/B evaluation, which is based on the resonanceparameters compiled by Ref. [8]. The resonance param-eters for 157Gd are consistent with those from the ex-periment by Møller and collaborators [9] and not withthose from Leinweber and collaborators [10]. JEFF-3.3 istaken from JEFF-2, which adopts: JENDL-2 for 155Gd;and JENDL-1 for 157Gd. The latter is based on the res-onance parameters from the BNL-325 report (the pre-vious edition of Ref. [8]). In JENDL-4.0, the 155,157Gdevaluations were revised by considering resonance param-eter from Ref. [10]. In the case of 157Gd, a background
∗ Corresponding author; [email protected]
capture cross section was added below 0.1 eV in orderto reproduce the thermal cross section of the previousevaluation and a number of benchmarks reported in theInternational Criticality Safety Benchmark EvaluationProject [11] (more details in [7]). In summary, evalua-tions agree on the adoption of the 157Gd(n,γ) thermalcross section consistent with the experiment by Ref. [9],although that value is about 12% higher than what wasmeasured by Leinweber and collaborators [10] in a cap-ture and transmission experiment. A summary of thevalues of the thermal cross sections retrieved from the ex-perimental nuclear reaction database EXFOR is reportedin historical progression in Tab. I. The measurements ofPattenden [12], Tattersall [14] and Choi [13] are not listedbecause they are not direct measurements and dependson model calculations.
TABLE I. 155Gd and 157Gd thermal cross sections (in kb) asreported in literature, compilation [8] and evaluations.
Reference Year Thermal cross sectionn +155Gd n +157Gd
Møller [9] 1960 58.9(5)a 254(2)a
Ohno [16] 1968 61.9(6)a 248(4)a
Leinweber [10] 2006 60.2b 226b
Mughabghab [8] 2009 60.9(0.5) 254.0(0.8)JENDL-4.0 2016 60.735 253.25JEFF-3.3 2017 60.89 254.5ENDF/B-VIII.0 2018 60.89 253.32
a Total cross section.b The uncertainty is not explicitly quoted in Ref. [10].
At higher energies, up to about 300 eV and especiallybeyond 180 eV (where the evaluations of 155Gd termi-nate) isotopic resonance assignement in the literature arenot consistent and thus evaluations reflect these doubt-ful assignments. Moreover, the resonance parameters de-duced from the measurement of Leinweber and collabo-rators [10] are significantly different from the ENDF/B-
3
VIII.0 and JEFF-3.3 evaluations. However, this largedeviation is not completely confirmed by a capture mea-surement on 155Gd [17]. In summary, a substantialimprovement of the parametrization of 155Gd(n,γ) and157Gd(n,γ) cross sections seems necessary.
All these inconsistencies prompted an initiative to per-form a new measurement of the capture cross section forthe odd gadolinium isotopes in the resolved resonance re-gion at the CERN neutron time-of-flight facility, n TOF.In this work, we report the results of these measure-ments on 155Gd and 157Gd. In Sec. II the experimen-tal conditions are discussed, while Sec. III describes thedata reduction procedure together with the estimationof uncertainties. Section IV summarizes the neutron res-onance analysis: results and discussions for 155Gd(n,γ)and 157Gd(n,γ) are reported in Sec. IV A and IV B, re-spectively. A resonance analysis above the resolved res-onance region is reported in Appendix A.
II. CAPTURE EXPERIMENT
The 155Gd(n,γ) and 157Gd(n,γ) capture measurementswere performed in 2016 at the 185-m measurement sta-tion of the neutron time-of-flight facility n TOF [18] atCERN, using an array of 4 C6D6 detectors. The enrichedgadolinium samples were in the form of self-supportingmetal discs. Since the capture cross section for both iso-topes drops by several orders of magnitude for neutronenergies higher than 1 eV, two samples (thin and thick)for each isotope were used to properly perform the mea-surement in the whole energy range of interest, i. e. upto 1 keV.
A. The n TOF spectrometer
The n TOF facility features two beam lines with awhite neutron spectrum produced by spallation inducedby 20 GeV/c protons impinging on a massive lead target,40 cm in length and 60 cm in diameter. This experimentwas performed at the experimental area EAR1, at thenominal distance of 185 m from the neutron-producingtarget, because of the better resolving power of the spec-trometer. Pulses of 7×10¹² protons impinge on the spal-lation target, producing some 2 × 10¹⁵ neutrons. Thoseare collimated towards EAR1 to a 0.9-cm-radius beamat 178 m from the neutron source. Consequently the re-duction of the neutron intensity attributable to the solidangle subtended by the collimator is of the order of 10−9.The initially fast neutron spectrum is moderated by afirst layer of 1 cm of demineralized water plus a secondlayer of 4 cm of borated water (H2O + 1.28%H3BO3,fraction in mass). With this setup the energy spectrumranges from thermal energies up to the GeV region, amore detailed description of the neutron flux is reportedin Sec. II C. Neutron pulses are produced with a slightlyvarying frequency of about 1 Hz, thus preventing the
overlap of slow neutrons of a bunch with the next bunch.The relative energy resolution ∆En/En, with ∆E be-ing the full width at half maximum, is of the order of3.2× 10−4 at 1 eV and 5.4× 10⁻⁴ at 1 keV (more detailsin Ref. [18] and [19]). Therefore the resolution of then TOF spectrometer results to be smaller than the totalwidth of neutron resonances in Gd up to about En = 250eV. On the other hand, for the Doppler broadening (re-lated to the thermal motion of the atoms in the sample)FWHM ≈ 6, 150, 300 and 600 meV at En = 0.02, 12.5, 50and 200 eV, respectively, and thus starts to dominate thewidth of the observed resonance profile above 200 eV.
B. Capture detectors and instrumentation
The measurements were performed using an array offour deuterated benzene (C6D6) liquid scintillation detec-tors (volume of about 1 liter). These detectors, widelyrecognized [21] to be particularly suited for (n,γ) mea-surements, were further optimized [20]. so as to havea very low sensitivity to background signals induced bysample-scattered neutrons (i. e. the amount of materialconstituting the detectors was minimized, and the mate-rials used have a very low neutron capture cross-section).They were placed face to face at 90o with respect to thebeam and about 10 cm away from the sample.
The total energy detection principle was used by com-bining the detection system described above with the socalled Pulse Height Weighting Technique (PHWT). Moredetails are presented in Sec. III B.
The data acquisition system consisted of 14 bit flash-ADC channels of TELEDYNE SP-Devices. These de-vices are equipped with an on-board memory of 512 MBper channel and can record digitized signals for 100 mscorresponding to all neutron energies down to 18 meV forEAR1. For the Gd measurement campaign, 4 channelsfor the C6D6 signals at a sampling rate of 1 GSample/sand 4 channels for the flux detectors with a sampling rateof 62.5 MSample/s were used.
C. Neutron flux
The procedure for the characterization and the defini-tion of the so-called evaluated neutron flux is describedin detail in Ref. [23]. It results from a combination ofdedicated measurements performed with different detec-tors, based on neutron cross-section standards [24]. Oneof these detectors, the silicon monitor (SiMON) [25] wasused during the measurement campaign to keep the neu-tron flux under systematic control. SiMON is based onthe 6Li(n, t)α standard and consists of a 600 µg/cm2
LiF foil in the beam, viewed by 4 silicon detectors (5cm×5 cm×300 µm) out of the beam. Such a configura-tion makes the SiMON apparatus almost transparent toneutrons. For instance the correction for the presence theLiF foil absorbs less than 1.4% of thermal neutrons pass-

4
FIG. 1. (Color online) Neutron flux measured during thegadolinium campaign in the range 10 meV - 3 keV, comparedto the 2014 evaluated flux.
ing through it, moreover the reduction of the incomingneutron beam decreases with increasing neutron energyand becomes negligible (neutron transmission > 99.5%)for neutron energies higher than 0.2 eV. Nevertheless thecorrection was applied in the whole energy region of in-terest.
Fig. 1 shows the energy distribution of the neutron fluxat the sample position, for the nominal proton bunch of7×1012 protons, from the 2014 flux evaluation campaignand from the gadolinium campaign. The latter flux wasextracted using SiMON and is shown up to En = 3 keV, aregion where no sizable correction for non-isotropic emis-sion of the reaction products is required. Above 1 eV thetwo curves agree within uncertainties, since the shape ofthe neutron flux is determined by the collimation system(which was not changed). However, in the energy regionbelow 1 eV, a systematic effect as a function of the en-ergy is clearly visible with the deviation reaching 9% nearthermal. This behavior is consistent with a 7% increaseof the concentration of boric acid in the moderator circuitwith respect to 2014.
The 2016 neutron flux, with 100 bins per decade, hasbeen determined within 1% uncertainty between thermaland 200 eV. The uncorrelated uncertainties, attributableto counting statistics, start to play a major role at higherenergies. Therefore, in order to avoid statistical fluctu-ations due to reduced statistics, the evaluated flux wasused above 200 eV.
As a final remark, the pick-up detection system basedon the wall current monitor of the CERN Proton Syn-chrotron was used for monitoring the proton current,which is proportional to the proton pulse intensity, andthus, to the neutron beam intensity.
D. Samples
The gadolinium samples were acquired from theNational Isotope Development Center (NIDC) of theOak Ridge National Laboratory (USA). Since the
155,157Gd(n,γ) cross section changes by several orders ofmagnitude depending on the neutron energy, the mea-surement in the whole energy range cannot be performedwith a single sample. In particular, to avoid saturationof the capture yield attributable to self-shielding, verythin samples (3.2 and 1.6 mg/cm2) were used to mea-sure the cross sections near thermal-neutron energy. Forthe characterization of resonant structures above 1 eV,10- and 40-time thicker samples, for 155Gd and 157Gd,respectively, were used in order to obtain a good signal-to-background ratio in the resonance region. Hereafter,we will refer to them as to thin and thick gadoliniumsamples. Moreover, the samples were highly isotopicallyenriched with a cross contamination of the two isotopesof less than 1.14%. In this way, possible background ef-fects introduced by capture events in the contaminantswere minimized. Table II summarizes the characteris-tics of the samples provided by NIDC, together with thedeclared uncertainties estimated from an isotopic analy-sis performed by the provider. The uncertainty on theareal density accounts for both uncertainties related tothe weight and the area.
In addition to the 4 gadolinium samples, a 197Au(6.28× 10⁻⁴ at/b) and a lead sample (6.71× 10⁻³ at/b)were used for normalization purposes and for the studyof the background. All the samples were circular in shapewith a radius of 1 cm, in the form of self-sustaining metal-lic discs, thus avoiding background introduced by a sam-ple container.
To prevent oxidation of Gd samples, they were shippedin an airtight under-pressurized container. At the begin-ning of the experimental campaign they were extracted,weighted and sandwiched between two Mylar foils (thick-ness ≈ 6µm) with a small amount of glue. The empty-sample was prepared as a replica of the Gd samples ex-cluding the Gd metal disc. Particular care was given toits production, similar to the gadolinium sample holder (i. e. an Al ring with 2 foils of mylar and a layer of glue).
III. DATA ANALYSIS
The fraction of the neutron beam producing a neutron-capture reaction in the sample, namely the captureyield [21] Y (En), was obtained from the weighted C6D6
counting rate Cw measured with a Gd sample in thebeam:
Y (En) =N
Sn + EnAA+1
Cw(En)−Bw(En)
ϕn(En)fBIF (En), (1)
where N is a normalization factor independent of neu-tron energy, Sn is the neutron separation energy of thecompound nucleus, A is the mass number of the targetnucleus, Bw is the weighted background, ϕn is the neu-tron fluence and fBIF is a correction factor taking intoaccount the variation of the neutron-beam interception asa function of the neutron energy. In the following sectionsa detailed explanation of the data reduction procedure is

5
TABLE II. Features of the Gd samples with uncertainties declared by the provider.
Isotope abundance % contamination % main Weight Areal Density% of 155 or 157Gd contaminant mg atoms/barn ×10−8
155Gd 91.74 ± 0.18 1.14 ± 0.01 5.12 ± 0.18 156Gd 100.6 ± 0.1 12438 ± 15155Gd 91.74 ± 0.18 1.14 ± 0.01 5.12 ± 0.18 156Gd 10.0 ± 0.1 1236 ± 12157Gd 88.32 ± 0.01 0.29 ± 0.01 9.10 ± 0.01 158Gd 191.6 ± 0.1 23390 ± 20157Gd 88.32 ± 0.01 0.29 ± 0.01 9.10 ± 0.01 158Gd 4.7 ± 0.1 574 ± 12
FIG. 2. Calibrated amplitude spectra for 137Cs, 88Y, Am-Beand Cm-C standard γ-ray sources. The black lines correspondto the simulated spectra convoluted with the energy resolu-tion, the red dots are the experimental data. The inset showsthe 88Y spectra measured during the gadolinium experimentalcampaign.
addressed, with particular care to the correction factors(Secs. III B, III C and III E) which determine the finaluncertainty. The study of the stability of the detectors,their calibration and the time-of-flight to neutron energyconversion are also discussed in sections III A and III D.
A. Detector resolution and calibration
With the aim of obtaining high accuracy cross sectiondata, the experimental setup has been carefully charac-terized, with particular care over the stability and theperformance of the detectors. The stability of the detec-tor response, mostly related to the gain of the photomul-tipliers, has been regularly verified by measurements withstandard γ-ray sources, namely the 137Cs (Eγ = 0.662MeV), 88Y (Eγ = 0.898 MeV and Eγ = 1.836 MeV),and the composite Am-Be (Eγ = 4.44 MeV) and Cm-C(Eγ = 6.13 MeV) sources (see 2). The energy spectraof γ-ray sources were recorded more than once per weekand did not reveal a gain shift higher than 0.7%, see theinset of Fig. 2 obtained with the Yttrium source.
A reliable calibration of the detectors is an importanttask in the data analysis, because of the modificationof the detector response by means of the PHWT. The
calculation of the weighting factors, indeed, depends onthe discrimination level applied to the deposited energyspectra. For this reason, particular care was taken todetermine the experimental resolution as a function of γ-ray energy and energy calibration of the detectors. Theiterative procedure followed to achieve this objective con-sisted of (i) extraction of energy resolution from experi-mental spectra acquired with the standard γ-ray sourcesdescribed above; (ii) broadening of the simulated spectrawith the energy resolution so as to reproduce the mea-surements, as shown in Figure 2; (iii) fine calibration ofthe detectors determined by the best matching betweensimulated and measured spectra.
B. Determination of Weighting functions
The total-energy detection principle was applied forthe evaluation of the neutron capture cross-section inthe resonance region. The use of low efficiency detec-tion system, such as the present setup based on C6D6
detectors, is at the heart of this approach, along withthe adoption of the pulse height weighting technique (seeRef. [21] and [22] and references therein). The latter en-sures proportionality of the γ-ray detection efficiency tothe corresponding γ-ray energy. The proportionality isachieved by introducing a mathematical procedure basedon a weighting function WF (Ed), Ed being the energydeposited by a γ ray. WF (Ed) is defined so that thedetection efficiency for the weighted response function isproportional to the energy of the detected γ ray. Thedescription of the detection system response was deter-mined using a Monte Carlo simulation of the apparatus,by geant4 simulation [26] of the complete experimen-tal assembly. The response of the detection system hasbeen studied as a function of the γ-ray energy. In theMC simulation, the γ rays were emitted from the sampleaccording to the Gaussian xy distribution of the neutronbeam profile, uniformly in z direction with z axis beingthe direction of the neutron beam. Then the final detec-tor response was obtained by convoluting the simulatedresponse with a Gaussian function that represents the de-tector resolution. Since the γ-ray transport in the samplecan play a relevant role for the thick samples and, gener-ally, for high values of the product nσtot, where n is theareal density in atoms/barn and σtot is the total crosssection. The case of a spatial distribution with exponen-tial shape along z for the emitted γ ray in the sample
6
was evaluated and is discussed in Sec.III F.The weighting function WF (Ed) was parameterized
with a polynomial function by minimizing the differencebetween the weighted response and the corresponding γ-ray energy for a number of energies in the range of inter-est. The discrimination level was fixed to 150 keV andthe upper threshold to 10.0 MeV, corresponding to theCompton edge of γ-ray energies of 285 keV and 10.3 MeV,respectively. The upper threshold exceeds the neutronseparation energies of 156Gd (Sn = 8.54 MeV), 158Gd(Sn = 7.94 MeV) and 198Au (Sn = 6.51 MeV) to takeinto account the resolution broadening of the scintilla-tion detectors. The impact of these analysis conditionson the uncertainty related to the PHWT is discussed inSec.III F.
The loss of cascade γ-rays attributable to the electronconversion process should be considered for a careful es-timation of the uncertainty related to the PHWT. TheMonte-Carlo dicebox algorithm [28] was used to pro-duce artificial capture cascades and estimate this effect.In dicebox, the complete decay scheme is taken fromexisting experimental data below certain critical energy,Ecrit. The data from Refs. [29], [30] and [31] for 156,158Gdand 198Au, respectively, were used and the Ecrit was ad-justed for each isotope to ensure the completeness of thedecay scheme. Above Ecrit the statistical model, in termsof level density (LD) and a set of photon strength func-tions (PSFs) for different transition types, was adopted togenerate individual levels and their decay properties. TheLD and PSFs models and their parameters were takenfrom Refs. [32], [33] and [34] for 156,158Gd and 198Au, re-spectively. dicebox computes the contribution of inter-nal electron conversion using parameters from the BrIccdatabase [35] for all transitions above Ecrit and for thosetransitions below Ecrit where the experimental informa-tion about internal electron conversion is lacking.
The generated cascades were used as input to thegeant4 simulation described above. The comparisonbetween experimental and simulated response of the de-tector is shown in Fig. 3 for the case of 155Gd(n,γ) mea-surement near neutron-thermal energy. The red curves(central value and standard deviation) represents the un-certainty in the calculation, which related to the fluctua-tions in the modeling of the cascades. The results of thiscomparison is descibed in Sec.III F.
C. Background subtraction
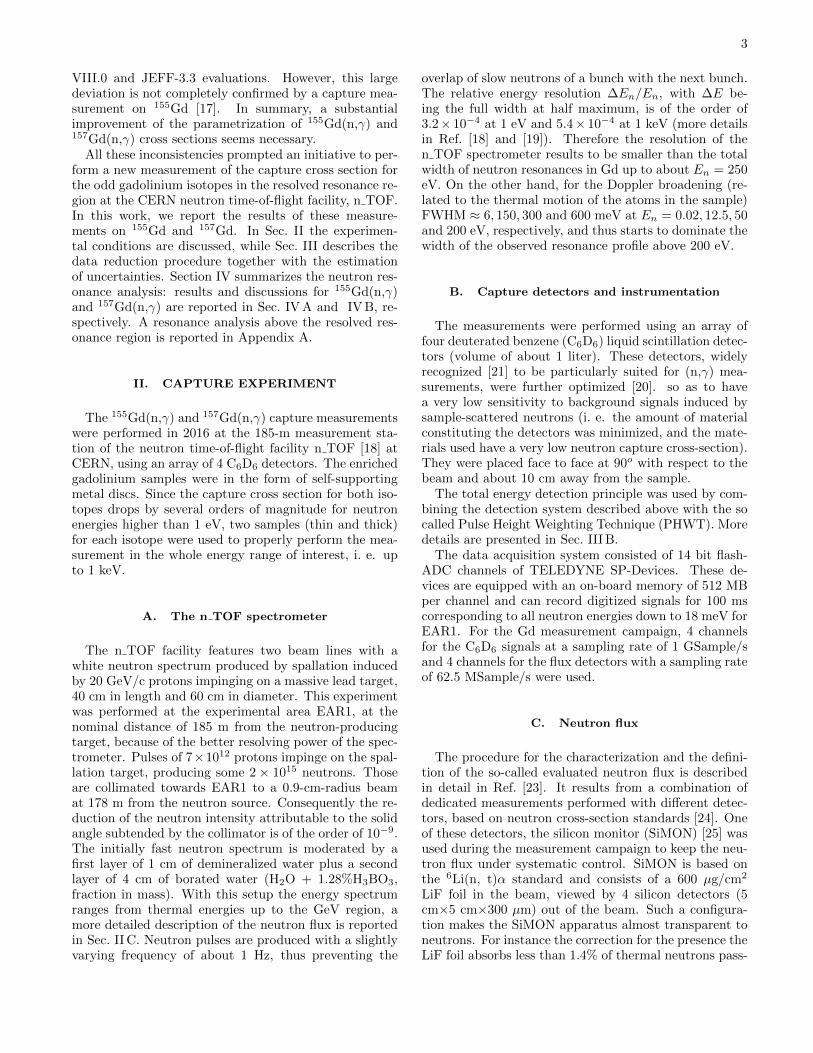
The study of the background in the capture data (Bwin Eq. 1) is based on dedicated measurements aimed atevaluating the various components attributable to: (i)neutron beam interactions with anything but the sam-ple, (ii) sample-scattered neutrons, (iii) γ rays travelingin the beam and (iv) time-independent background. InFig. 4 the measured time-of-flight (TOFm) spectra, usedto estimate these background components, are showed to-gether with the TOFm spectrum for the thick 155Gd sam-
FIG. 3. (Color online) C6D6 energy spectrum for 155Gd(n,γ)at neutron energy near thermal compared to the simulatedresponse.
FIG. 4. (Color online) Weighted C6D6 time-of-flight spec-trum of the thick 155Gd sample, together with backgroundmeasurements.
ple for comparison. The first background component hasbeen evaluated with the empty-sample holder (Sec. II D)in the beam, thus accounting for any beam-related effectnot linked to the presence of a sample. The second sourceof background is attributable to γ rays originating fromsample-scattered neutrons thermalized and captured inthe surrounding materials. It was evaluated with a mea-surement of the lead sample placed in the beam. Toestimate this component the counts of the empty-samplemeasurement, normalized to the same neutron intensity,were subtracted to the Pb measurement and a correctionfactor Rn was applied to the resulting quantity. Rn is theratio of the neutron scattering yield of Gd and Pb sam-ple. The third background component, mainly 2.2 MeVand 0.48 MeV in-beam γ rays from neutron capture inthe Hydrogen and Boron of the moderator, respectively,was estimated by a measurement with the natural leadsample. This kind of background starts to contributein the energy region above 300 eV (TOFm
<∼ 7.7 × 10⁵
ns). Its time distribution results from the combination

7
FIG. 5. (Color online) Weighted C6D6 time-of-flight spec-trum of the thin 155Gd sample, together with backgroundmeasurements.
of the neutron slowing-down process in the moderatorand the flight path length. The fourth background com-ponent, related to ambient radioactivity and activationof the materials inside the experimental area was esti-mated with a beam-off measurement. Since the productsof 155Gd(n,γ) and 157Gd(n,γ) are the stable 156Gd and158Gd isotopes, the background attributable to the acti-vation of the sample is negligible.
Fig. 5 shows the C6D6 background measurements com-pared with the signals resulting from the measurementwith the thin 155Gd sample. In this case the neutronbackground is not shown to highlight the comparison be-tween the Gd and the empty measurement. As expected,the signal-to-background ratio is much less favourable,for instance at 2 eV it is about 200 and 30 for thickand thin samples, respectively. The figure also showsthe expected matching between resonance valleys and theempty-sample measurement.
In summary, the empty sample-measurement satisfac-torily represents the background level in the energy rangeof interest. A similar evaluation was repeated for thethin and thick 157Gd(n,γ) measurement and resulted inthe same conclusion. It is worth mentioning that atthermal-neutron energy (TOFm ≈ 85×106ns) the signal-to-background ratio for the thin gadolinium samples was10 and 7.6 for 155Gd and 157Gd, respectively.
D. Time-of-flight to energy calibration
The kinetic neutron energy was calculated from thevelocity of the neutrons. The latter quantity cannot bedirectly calculated from the ratio of the measured TOFm
and the geometrical flight-path length L0, because TOFm
also depends on the moderation time (i. e. the time spentby the neutron inside the spallation target assembly).This case was discussed in more details in Refs. [18] and[19], here we only remind the reader that it is custom-ary to express the distribution of the moderation timein terms of an equivalent distance λ(En), which depends
FIG. 6. (Color online) Distribution of λ(En) as a function ofneutron energy.
on the neutron energy. Consequently, the effective flightpath L(En) is the sum of a time independent term L0 anda time dependent term, which is given by the mean ofλ(En) distribution: L(En) = L0 + 〈λ(En)〉. Fig. 6 showsthe λ(En) distribution obtained by Monte Carlo simula-tion [38, 39], it is worth noticing that the mean of the dis-tribution varies only slightly with neutron energy aroundthe value of 19 cm. Therefore the kinetic energy was ex-tracted with a recursive procedure which converged afterfew iterations. The value of L0 = 183.92(8) m resultedfrom a minimization procedure adopting the well-knownlow-energy resonances of 197Au retrieved from JEFF-3.3evaluation [36]. This geometrical (i. e. energy indepen-dent) value, obtained with the least square adjustment isconsistent with the nominal value of 183.94 m.
E. Normalization and Beam Interception Factor
The normalization factor (N in Eq. 1) groups togetherthe correction factors independent of neutron energy: ef-ficiency related to the solid angle of the detectors, frac-tion of the neutron beam intercepting the gadoliniumsample (0.68 being the nominal value [18]) and abso-lute value of the neutron flux. This normalization co-efficient was obtained by the saturated resonance tech-nique [21], applied to the 4.9 eV resonance in n+ 197Au.The Au capture yield was analyzed with the R-Matrixcode SAMMY [40] and the value of the normalizationwas extracted with an uncertainty attributable to count-ing statistic of less than 0.1%. The impact of the system-atic effects related to the difference of the electromagneticcascade for 197Au(n,γ) and 155,157Gd(n,γ) is discussed inSec.III F.
The beam interception factor (i. e. the fraction of theneutron beam intercepting the sample) can be consideredconstant within less than 1.5% variation in the energyregion between En = 1 eV and 100 keV [18]. As thor-oughly discussed in Refs. [18, 19], the beam profile has a
8
Gaussian distribution with standard deviation of about 6mm, determined mainly by the collimation system. Be-low 1 eV, Monte Carlo simulations and experiments havedemonstrated that a correction factor, fBIF in Eq. 1, isrequired for taking into account the modification of thespatial distribution of the beam profile. Unfortunately,the correction is extremely sensitive to small changes inthe collimation system, which cannot be fully controlledand therefore implemented in MC simulations. In addi-tion also gravitational force plays a sizable role for verylow-energy neutrons, because the vertical displacement is3.5 cm for neutrons of 25 meV, after traveling for 185 m.Therefore from the Monte Carlo simulation only qual-itative information could be drawn: the beam profilebecomes larger and asymmetric as the neutron energydecreases and the correction can be as high as 20%.
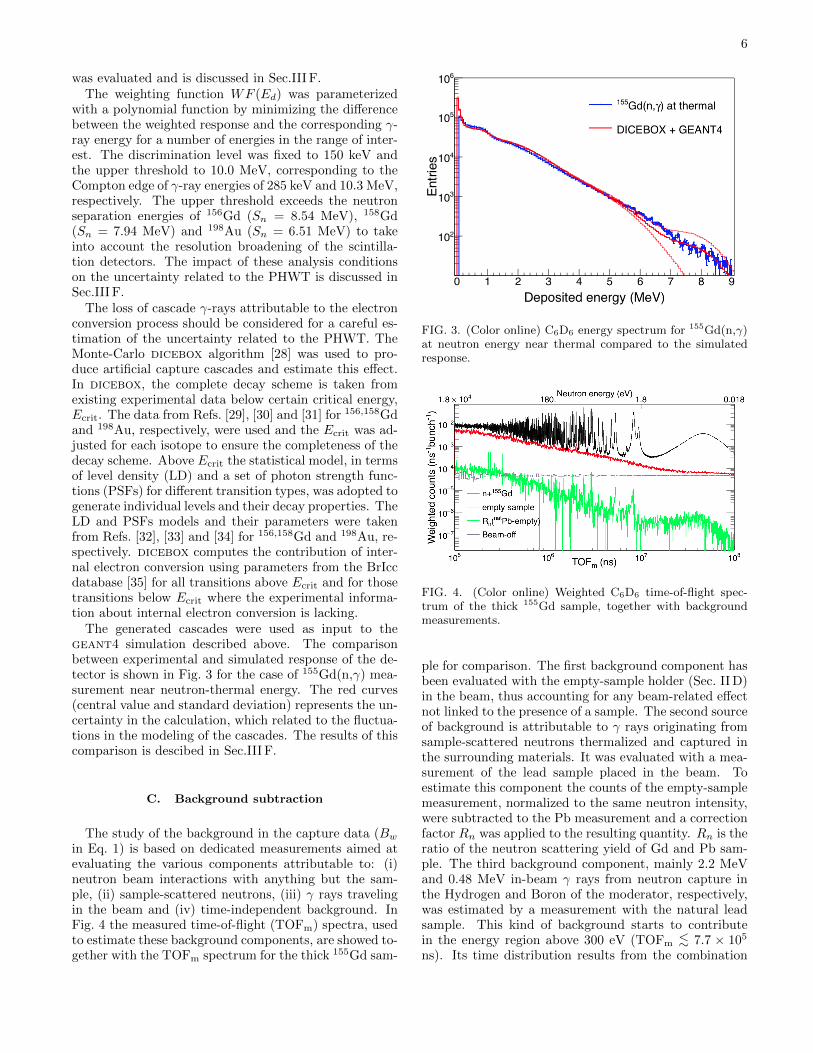
In the present analysis, an empirical method was usedfor the correction of the beam interception factor. It issimilar to the saturated resonance technique (i. e. theproduct of the areal density and cross section is highenough for all incident neutrons to interact with the sam-ple), the expected capture yield can be expressed as:
Y (En) = (1− e−nσtot(En))σγ(En)
σtot(En)+ Ym, (2)
where n is the areal density of the sample (reported inTable II), σtot is the total cross section, σγ is the cap-ture cross section and Ym accounts for the contributionof capture events following at least one neutron scatter-ing in the sample. In the case of the thick 155Gd and157Gd samples, nσtot(En) is so high that the calculatedtransmission of neutrons through the samples is less than10−3, for neutron energies below 0.07 and 0.1 eV, respec-tively. Considering also that the ratio of elastic to cap-ture cross section is less than 10−2 in this energy region,the capture yield for thick gadolinium samples is conse-quently expected to be Y = 1. Any departure of the mea-sured capture yield from unity was ascribed to a variationof the beam interception factor, as illustrated in Fig. 7,where the experimental 155Gd(n,γ) and 157Gd(n,γ) cap-ture yields are compared to their expected values basedon the resonance parameters in the ENDF/B-VIII.0 eval-uation. In the inset of the figure, the energy region wherethe empirical fBIF was extracted is highlighted. The twosets of data are very similar, confirming the presence ofa common effect.
The empirical correction factor was used to correct thecapture yields of the thin gadolinium samples and thegold one, as discussed in the next section.
F. Quality assessment and discussion onuncertainties
As mentioned above, one of the aims of this measure-ment was to estimate the cross section at thermal energyfor 155Gd and 155Gd. In this region the uncorrelated un-certainties have a minor role, since the involved cross sec-
FIG. 7. (Color online) Capture yield of the thick gadolin-ium samples measured in this work and comparison withthe expected capture yield calculated on the basis of thecross sections in ENDF/B-VIII.0 library. The region betweenEn = 0.02 and 0.05 eV, linked to the correction for the vari-ation of the beam interception factor, is shown in the inset.
tions are very high and consequently the counting statis-tics is not the issue. On the contrary, the correlateduncertainties dominate the total uncertainty. They comefrom the normalization, PHWT, background determina-tion and subtraction, sample characterization and neu-tron flux shape. In addition, in the energy region below1 eV the uncertainty due to correction for the beam inter-ception factor should also be considered. In Table III thedifferent contributions are listed together with the totaluncertainty for both gadolinium isotopes in the thermalregion and in the resonance region. Hereafter each com-ponent is discussed separately.
The uncertainty related to the normalization dependson the differences between the electromagnetic cascadesin 197Au(n,γ) and in 155,157Gd(n,γ). One effect is at-tributable to the electron conversion and the other to themissing γ rays because of the discrimination level in thedetectors. To quantify such a bias the same method as inRef. [37] was applied. The count losses attributable to thedetector threshold were estimated by means of simulatedcascades (as described above, in Sec. III B). The weightedcontribution of γ rays with an energy below the thresh-old and of electrons is 1.0% and 0.8%, respectively, for198Au. Whereas for both 156Gd and 158Gd the weightedcontributions are similar and their value is 0.4% for miss-ing γ rays and 0.2% for conversion electrons. Thereforethe bias in the normalization due to the detector thresh-old is 0.6% for missing γ rays and 0.6% for conversionelectrons. Since these are model-dependent corrections,which depends also in the detector performances, theywere used only to study the uncertainty on the normal-ization which was estimated to be less than 1.5%.
The uncertainty related to the weighting function wasinvestigated by repeating the data analysis by using: i)linear and quadratic amplitude to deposited energy cal-ibration; ii) detector threshold of 150, 175 and 200 keVand corresponding weighting functions; (iii) 7 different
9
weighting functions calculated with an exponential atten-uation in the direction of the neutron beam according todifferent values of nσtot. In any case the ratio between theexperimental yields never changed by more than 1.5%.Moreover, systematic effects due to the positioning of thesample with respect to the detection system and the neu-tron beam were minimized. In particular samples werecentered using a micrometric positioning system basedon a jig and a hollow metallic cylinder aligned with theAl annular frame.
The component related to the background subtrac-tion propagates to the total uncertainty according tothe signal-to-background ratio. From measurements us-ing different empty samples, and from the comparisonof the TOF spectra measured with the empty sampleand the thin gadolinium samples (between resonances),we deduced an uncertainty of 10%. Therefore, at ther-mal neutron energy the uncertainty attributable to thebackground subtraction is 1.4% for 155Gd and 1.0% for157Gd (the signal-to-background ratio is 7.6 and 10, re-spectively), whereas in the resonance region it dependson the resonance strength.
For the estimation of the uncertainty of the shape ofthe neutron flux, we adopted an uncertainty of 1% asdiscussed in [18, 23]. This value corresponds to the un-certainty in the region around 4.9 eV, where the normal-ization was extracted.
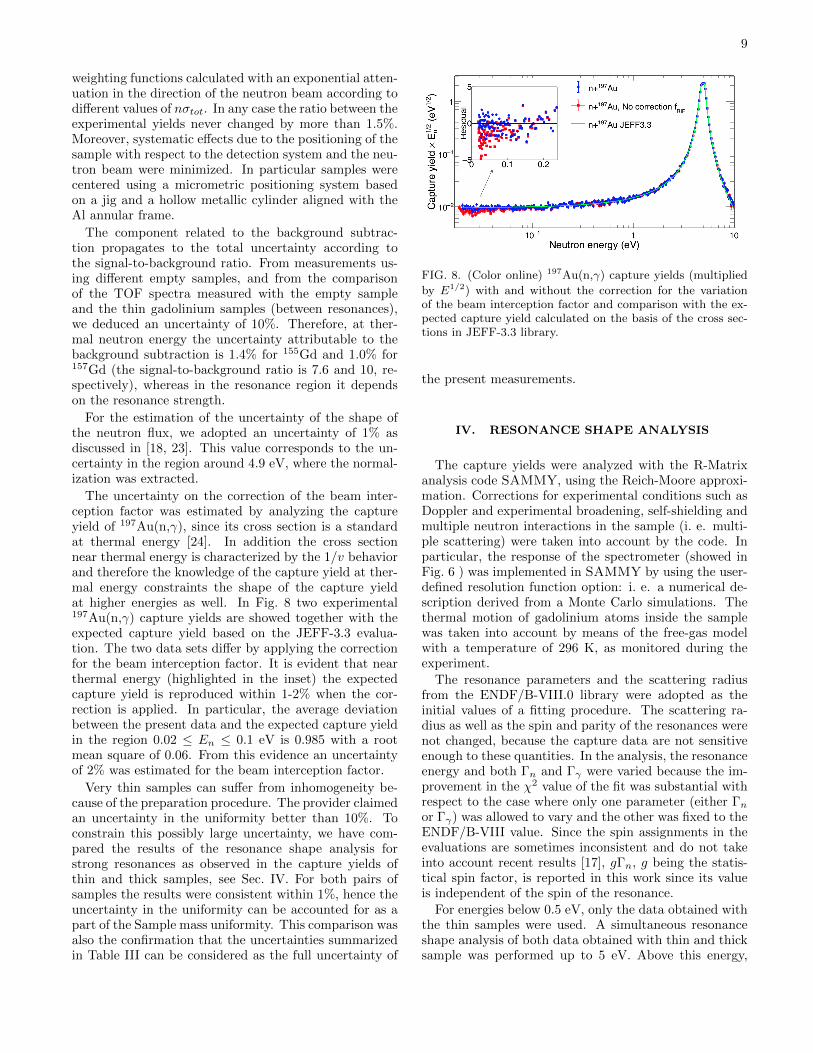
The uncertainty on the correction of the beam inter-ception factor was estimated by analyzing the captureyield of 197Au(n,γ), since its cross section is a standardat thermal energy [24]. In addition the cross sectionnear thermal energy is characterized by the 1/v behaviorand therefore the knowledge of the capture yield at ther-mal energy constraints the shape of the capture yieldat higher energies as well. In Fig. 8 two experimental197Au(n,γ) capture yields are showed together with theexpected capture yield based on the JEFF-3.3 evalua-tion. The two data sets differ by applying the correctionfor the beam interception factor. It is evident that nearthermal energy (highlighted in the inset) the expectedcapture yield is reproduced within 1-2% when the cor-rection is applied. In particular, the average deviationbetween the present data and the expected capture yieldin the region 0.02 ≤ En ≤ 0.1 eV is 0.985 with a rootmean square of 0.06. From this evidence an uncertaintyof 2% was estimated for the beam interception factor.
Very thin samples can suffer from inhomogeneity be-cause of the preparation procedure. The provider claimedan uncertainty in the uniformity better than 10%. Toconstrain this possibly large uncertainty, we have com-pared the results of the resonance shape analysis forstrong resonances as observed in the capture yields ofthin and thick samples, see Sec. IV. For both pairs ofsamples the results were consistent within 1%, hence theuncertainty in the uniformity can be accounted for as apart of the Sample mass uniformity. This comparison wasalso the confirmation that the uncertainties summarizedin Table III can be considered as the full uncertainty of
FIG. 8. (Color online) 197Au(n,γ) capture yields (multiplied
by E1/2) with and without the correction for the variationof the beam interception factor and comparison with the ex-pected capture yield calculated on the basis of the cross sec-tions in JEFF-3.3 library.
the present measurements.
IV. RESONANCE SHAPE ANALYSIS
The capture yields were analyzed with the R-Matrixanalysis code SAMMY, using the Reich-Moore approxi-mation. Corrections for experimental conditions such asDoppler and experimental broadening, self-shielding andmultiple neutron interactions in the sample (i. e. multi-ple scattering) were taken into account by the code. Inparticular, the response of the spectrometer (showed inFig. 6 ) was implemented in SAMMY by using the user-defined resolution function option: i. e. a numerical de-scription derived from a Monte Carlo simulations. Thethermal motion of gadolinium atoms inside the samplewas taken into account by means of the free-gas modelwith a temperature of 296 K, as monitored during theexperiment.
The resonance parameters and the scattering radiusfrom the ENDF/B-VIII.0 library were adopted as theinitial values of a fitting procedure. The scattering ra-dius as well as the spin and parity of the resonances werenot changed, because the capture data are not sensitiveenough to these quantities. In the analysis, the resonanceenergy and both Γn and Γγ were varied because the im-provement in the χ2 value of the fit was substantial withrespect to the case where only one parameter (either Γnor Γγ) was allowed to vary and the other was fixed to theENDF/B-VIII value. Since the spin assignments in theevaluations are sometimes inconsistent and do not takeinto account recent results [17], gΓn, g being the statis-tical spin factor, is reported in this work since its valueis independent of the spin of the resonance.
For energies below 0.5 eV, only the data obtained withthe thin samples were used. A simultaneous resonanceshape analysis of both data obtained with thin and thicksample was performed up to 5 eV. Above this energy,

10
TABLE III. Summary of the correlated uncertainties in the 155Gd(n,γ) and 157Gd(n,γ) cross section measurements.
Source of 155Gd(n,γ) 157Gd(n,γ)uncertainty near thermal resonance region near thermal resonance regionPHWT 1.5% 1.5% 1.5% 1.5%Normalization 1.5% 1.5% 1.5% 1.5%Background 1.4% ≈ 1% 1.0% ≈ 1%Sample mass 1.0% < 0.1% 2.1% < 0.1%BIF 2.0% 2.0%Flux 1.0% 1.0% 1.0% 1.0%Total 3.5% 2.5% 3.9% 2.5%
only the data obtained with the thick samples were used.Nevertheless, as already mentioned above, few strong res-onances in the energy region up to 60 eV were used tocross-check the capture data obtained with the thin sam-ples.
The results of the resonance shape analysis were usedto reconstruct the cross section and in particular to eval-uate the thermal cross section σ0 = σγ(E0) for E0 =0.0253 eV. In addition, the cross section reconstructedusing the resonance parameters from this work has beenconvoluted with a Maxwellian neutron energy distribu-tion to obtain the so called Maxwellian averaged crosssection: ∫
σγ(En)En
E0e−En/E0dEn∫
En
E0e−En/E0dEn
. (3)
The ratio of the latter quantity for thermal energy E0 =0.0253 eV to the thermal cross section, also referred toas the Westcott factor [8], was also calculated. It allowedus to evaluate the non-1/v behaviour of the capture crosssection (i. e. the Westcott factor significantly differentfrom unity).
The resolved resonance regions (RRR) in nuclear datalibraries such as ENDF/B-VIII.0, JEFF-3.3 and JENDL-4.0 are limited to the energy region below 300 eV forn+157Gd and below 180 eV for n+155Gd. The presentdata clearly show structures well above these energies(see Fig.16 in Appendix A). These structures have beenanalyzed assuming they are s-wave resonances with anaverage Γγ deduced from the resonances in the RRR.Their energy and capture kernel, defined as gΓγΓn/(Γγ+Γn) are reported in Appendix A. In order to extend theresolved resonance region to higher energies, it would benecessary to perform a transmission experiment on thesame thick samples.
A. n+155Gd
The capture cross section of 155Gd at thermal energydoes not vary significantly among libraries. It rangesfrom 60.735 to 60.890 kb. From the present data aslightly higher but consistent thermal cross section wasdeduced, σ0 = 62.2(2.2) kb. The resulting Westcott fac-tor is 0.86(4). The weighted mean of the present result
combined with the cross section values by Møller [9] andOhno [16] provides σ0 = 60.2(4) kb, which is consistentwith the value reported by Leinweber [10].
In the resolved resonance region, differences are presentin evaluated nuclear data files. Moreover, two time-of-flight measurements present inconsistencies. In partic-ular, for a number of resonances, the measurement ofLeinweber and collaborators [10] sizably disagrees withthe ENDF/B-VIII.0, while the measurement by Baram-sai and collaborators [17] tends to confirm the resonanceparameters in ENDF/B-VIII.0.
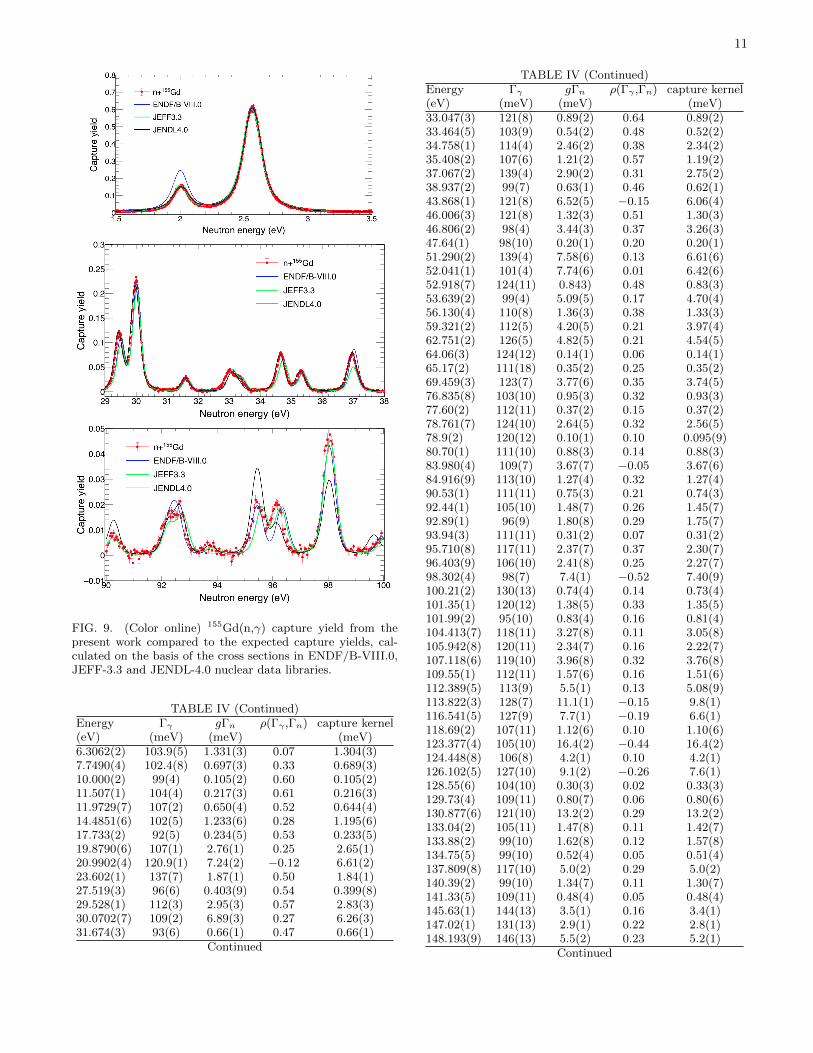
Examples of some of the largest differences between thepresent data and the evaluations are shown in Fig. 9. Forinstance the kernel of the resonance at 2.0 eV is about50% lower than the value calculated from ENDF/B-VIII.0. Large deviations with respect to JENDL-4.0 arepresent as well, as for example in the case of the res-onances at 95.7 eV and 98.3 eV. The bottom panel inFig. 9 confirms the good energy resolution of the presentdata, able to resolve some doublets, such as the struc-tures at En = 33, 93 or 96 eV. It is worth noticing thatthe resonances at 22.45, 116.9 and 138.0 eV in Ref. [17]could be attributable to multiple scattering in the nearbyresonances rather than genuine resonance as quoted inENDF/B-VIII (see for instance Fig. 21 in Ref. [41] aboutthis possible effect). The presence of small structuresat 43.43, 54.81, 62.12, 68.98 and 76.19 eV reported inJEFF-3.3 and 17.81 and 68.81 eV reported by Baramsaiand collaborators [17], cannot be excluded on the basisof present data since they are overwhelmed by the back-ground. Finally, the resonance reported by Leinweberand collaborators at En = 131.7 eV is also observed inthe present measurement.
The results of the resonance shape analysis are sum-marized in Table IV. The correlation coefficient betweenpartial widths ρ(Γγ ,Γn) resulting from the SAMMY fitis also reported.
TABLE IV: Resonances in 155Gd(n,γ). Uncertainties are from the fit.
Energy Γγ gΓn ρ(Γγ ,Γn) capure kernel(eV) (meV) (meV) (meV)0.0268(0) 104.57(8) 0.0644(5) 0.48 0.0643(5)2.0128(2) 111.5(6) 0.1350(4) 0.46 0.1348(4)2.5730(1) 103.1(2) 1.037(1) −0.17 1.021(1)3.618(2) 123(6) 0.0141(4) 0.64 0.0141(4)
Continued
11
FIG. 9. (Color online) 155Gd(n,γ) capture yield from thepresent work compared to the expected capture yields, cal-culated on the basis of the cross sections in ENDF/B-VIII.0,JEFF-3.3 and JENDL-4.0 nuclear data libraries.
TABLE IV (Continued)Energy Γγ gΓn ρ(Γγ ,Γn) capture kernel(eV) (meV) (meV) (meV)6.3062(2) 103.9(5) 1.331(3) 0.07 1.304(3)7.7490(4) 102.4(8) 0.697(3) 0.33 0.689(3)10.000(2) 99(4) 0.105(2) 0.60 0.105(2)11.507(1) 104(4) 0.217(3) 0.61 0.216(3)11.9729(7) 107(2) 0.650(4) 0.52 0.644(4)14.4851(6) 102(5) 1.233(6) 0.28 1.195(6)17.733(2) 92(5) 0.234(5) 0.53 0.233(5)19.8790(6) 107(1) 2.76(1) 0.25 2.65(1)20.9902(4) 120.9(1) 7.24(2) −0.12 6.61(2)23.602(1) 137(7) 1.87(1) 0.50 1.84(1)27.519(3) 96(6) 0.403(9) 0.54 0.399(8)29.528(1) 112(3) 2.95(3) 0.57 2.83(3)30.0702(7) 109(2) 6.89(3) 0.27 6.26(3)31.674(3) 93(6) 0.66(1) 0.47 0.66(1)
Continued
TABLE IV (Continued)Energy Γγ gΓn ρ(Γγ ,Γn) capture kernel(eV) (meV) (meV) (meV)33.047(3) 121(8) 0.89(2) 0.64 0.89(2)33.464(5) 103(9) 0.54(2) 0.48 0.52(2)34.758(1) 114(4) 2.46(2) 0.38 2.34(2)35.408(2) 107(6) 1.21(2) 0.57 1.19(2)37.067(2) 139(4) 2.90(2) 0.31 2.75(2)38.937(2) 99(7) 0.63(1) 0.46 0.62(1)43.868(1) 121(8) 6.52(5) −0.15 6.06(4)46.006(3) 121(8) 1.32(3) 0.51 1.30(3)46.806(2) 98(4) 3.44(3) 0.37 3.26(3)47.64(1) 98(10) 0.20(1) 0.20 0.20(1)51.290(2) 139(4) 7.58(6) 0.13 6.61(6)52.041(1) 101(4) 7.74(6) 0.01 6.42(6)52.918(7) 124(11) 0.843) 0.48 0.83(3)53.639(2) 99(4) 5.09(5) 0.17 4.70(4)56.130(4) 110(8) 1.36(3) 0.38 1.33(3)59.321(2) 112(5) 4.20(5) 0.21 3.97(4)62.751(2) 126(5) 4.82(5) 0.21 4.54(5)64.06(3) 124(12) 0.14(1) 0.06 0.14(1)65.17(2) 111(18) 0.35(2) 0.25 0.35(2)69.459(3) 123(7) 3.77(6) 0.35 3.74(5)76.835(8) 103(10) 0.95(3) 0.32 0.93(3)77.60(2) 112(11) 0.37(2) 0.15 0.37(2)78.761(7) 124(10) 2.64(5) 0.32 2.56(5)78.9(2) 120(12) 0.10(1) 0.10 0.095(9)80.70(1) 111(10) 0.88(3) 0.14 0.88(3)83.980(4) 109(7) 3.67(7) −0.05 3.67(6)84.916(9) 113(10) 1.27(4) 0.32 1.27(4)90.53(1) 111(11) 0.75(3) 0.21 0.74(3)92.44(1) 105(10) 1.48(7) 0.26 1.45(7)92.89(1) 96(9) 1.80(8) 0.29 1.75(7)93.94(3) 111(11) 0.31(2) 0.07 0.31(2)95.710(8) 117(11) 2.37(7) 0.37 2.30(7)96.403(9) 106(10) 2.41(8) 0.25 2.27(7)98.302(4) 98(7) 7.4(1) −0.52 7.40(9)100.21(2) 130(13) 0.74(4) 0.14 0.73(4)101.35(1) 120(12) 1.38(5) 0.33 1.35(5)101.99(2) 95(10) 0.83(4) 0.16 0.81(4)104.413(7) 118(11) 3.27(8) 0.11 3.05(8)105.942(8) 120(11) 2.34(7) 0.16 2.22(7)107.118(6) 119(10) 3.96(8) 0.32 3.76(8)109.55(1) 112(11) 1.57(6) 0.16 1.51(6)112.389(5) 113(9) 5.5(1) 0.13 5.08(9)113.822(3) 128(7) 11.1(1) −0.15 9.8(1)116.541(5) 127(9) 7.7(1) −0.19 6.6(1)118.69(2) 107(11) 1.12(6) 0.10 1.10(6)123.377(4) 105(10) 16.4(2) −0.44 16.4(2)124.448(8) 106(8) 4.2(1) 0.10 4.2(1)126.102(5) 127(10) 9.1(2) −0.26 7.6(1)128.55(6) 104(10) 0.30(3) 0.02 0.33(3)129.73(4) 109(11) 0.80(7) 0.06 0.80(6)130.877(6) 121(10) 13.2(2) 0.29 13.2(2)133.04(2) 105(11) 1.47(8) 0.11 1.42(7)133.88(2) 99(10) 1.62(8) 0.12 1.57(8)134.75(5) 99(10) 0.52(4) 0.05 0.51(4)137.809(8) 117(10) 5.0(2) 0.29 5.0(2)140.39(2) 99(10) 1.34(7) 0.11 1.30(7)141.33(5) 109(11) 0.48(4) 0.05 0.48(4)145.63(1) 144(13) 3.5(1) 0.16 3.4(1)147.02(1) 131(13) 2.9(1) 0.22 2.8(1)148.193(9) 146(13) 5.5(2) 0.23 5.2(1)
Continued
12
FIG. 10. (Color online) 155Gd(n,γ) residuals between thepresent resonance kernels and values in literature: ENDF/B-VIII.0, JEFF-3.3 and JENDL-4.0 evaluations and TOF exper-iment reported in Ref. [10] and [17], as a function of neutronresonance energy.
TABLE IV (Continued)Energy Γγ gΓn ρ(Γγ ,Γn) capture kernel(eV) (meV) (meV) (meV)149.484(8) 111(10) 12.5(4) −0.28 9.6(3)150.176(7) 124(10) 14.8(3) 0.03 12.4(3)152.24(1) 106(10) 3.2(1) 0.05 3.0(1)153.71(6) 126(13) 0.46(4) 0.10 0.46(4)156.291(9) 114(11) 4.7(1) 0.10 4.4(1)160.063(9) 112(10) 5.5(1) 0.06 5.1(1)161.616(5) 108(9) 12.1(2) −0.37 10.3(2)168.311(7) 98(9) 11.9(4) −0.64 9.0(2)170.34(1) 115(11) 5.4(2) 0.13 5.1(1)171.30(1) 126(12) 5.6(2) 0.10 5.3(2)173.566(5) 122(9) 20.7(4) −0.59 16.3(2)175.44(4) 116(11) 1.07(8) 0.04 1.05(8)178.01(1) 111(11) 4.0(2) 0.01 3.7(1)180.32(1) 112(11) 6.0(2) −0.16 5.2(1)
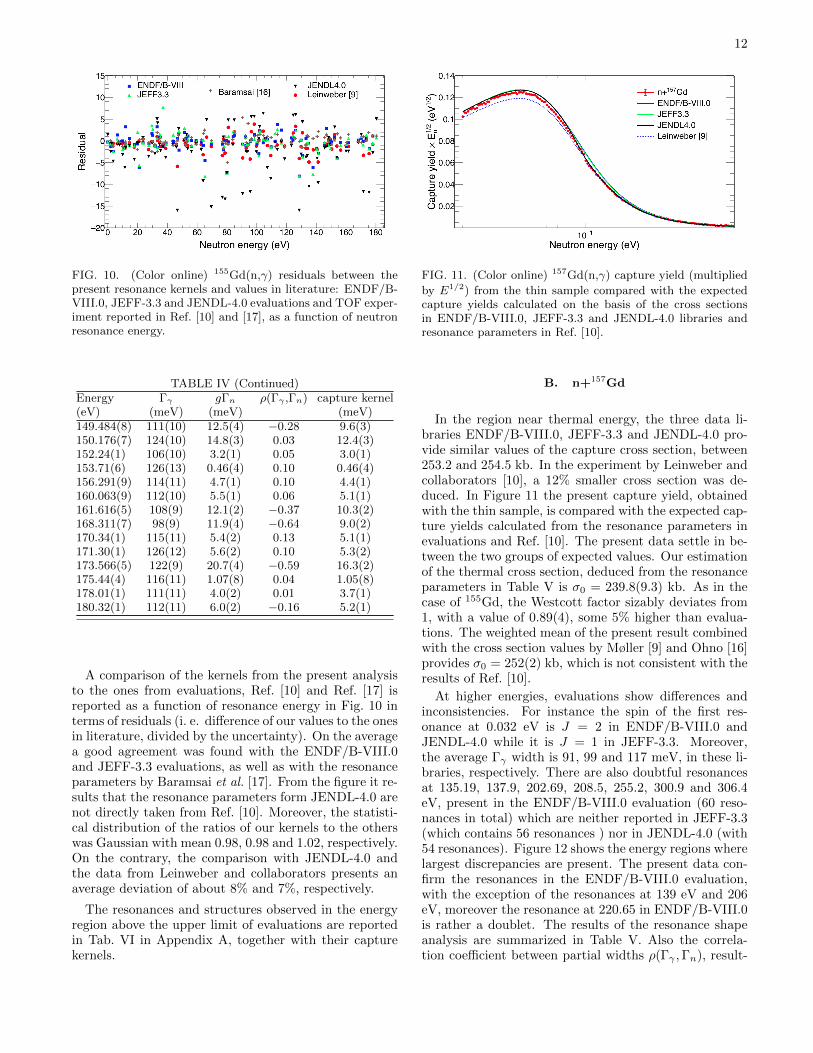
A comparison of the kernels from the present analysisto the ones from evaluations, Ref. [10] and Ref. [17] isreported as a function of resonance energy in Fig. 10 interms of residuals (i. e. difference of our values to the onesin literature, divided by the uncertainty). On the averagea good agreement was found with the ENDF/B-VIII.0and JEFF-3.3 evaluations, as well as with the resonanceparameters by Baramsai et al. [17]. From the figure it re-sults that the resonance parameters form JENDL-4.0 arenot directly taken from Ref. [10]. Moreover, the statisti-cal distribution of the ratios of our kernels to the otherswas Gaussian with mean 0.98, 0.98 and 1.02, respectively.On the contrary, the comparison with JENDL-4.0 andthe data from Leinweber and collaborators presents anaverage deviation of about 8% and 7%, respectively.
The resonances and structures observed in the energyregion above the upper limit of evaluations are reportedin Tab. VI in Appendix A, together with their capturekernels.
FIG. 11. (Color online) 157Gd(n,γ) capture yield (multiplied
by E1/2) from the thin sample compared with the expectedcapture yields calculated on the basis of the cross sectionsin ENDF/B-VIII.0, JEFF-3.3 and JENDL-4.0 libraries andresonance parameters in Ref. [10].
B. n+157Gd
In the region near thermal energy, the three data li-braries ENDF/B-VIII.0, JEFF-3.3 and JENDL-4.0 pro-vide similar values of the capture cross section, between253.2 and 254.5 kb. In the experiment by Leinweber andcollaborators [10], a 12% smaller cross section was de-duced. In Figure 11 the present capture yield, obtainedwith the thin sample, is compared with the expected cap-ture yields calculated from the resonance parameters inevaluations and Ref. [10]. The present data settle in be-tween the two groups of expected values. Our estimationof the thermal cross section, deduced from the resonanceparameters in Table V is σ0 = 239.8(9.3) kb. As in thecase of 155Gd, the Westcott factor sizably deviates from1, with a value of 0.89(4), some 5% higher than evalua-tions. The weighted mean of the present result combinedwith the cross section values by Møller [9] and Ohno [16]provides σ0 = 252(2) kb, which is not consistent with theresults of Ref. [10].
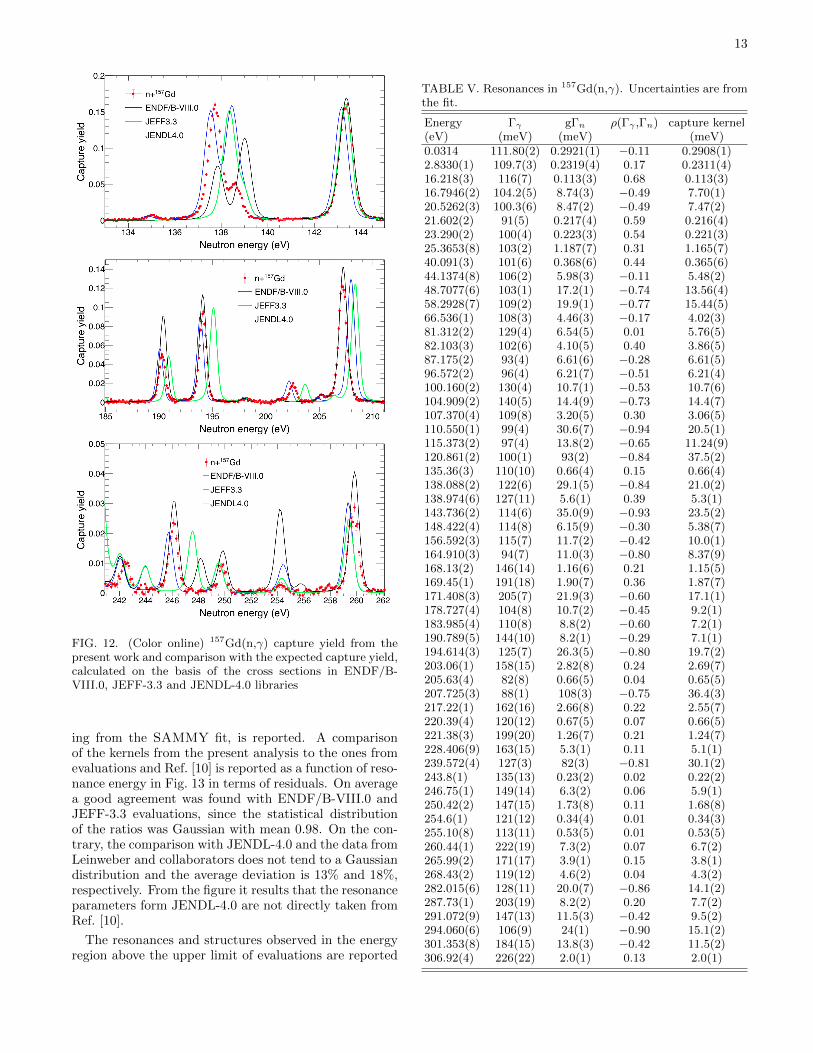
At higher energies, evaluations show differences andinconsistencies. For instance the spin of the first res-onance at 0.032 eV is J = 2 in ENDF/B-VIII.0 andJENDL-4.0 while it is J = 1 in JEFF-3.3. Moreover,the average Γγ width is 91, 99 and 117 meV, in these li-braries, respectively. There are also doubtful resonancesat 135.19, 137.9, 202.69, 208.5, 255.2, 300.9 and 306.4eV, present in the ENDF/B-VIII.0 evaluation (60 reso-nances in total) which are neither reported in JEFF-3.3(which contains 56 resonances ) nor in JENDL-4.0 (with54 resonances). Figure 12 shows the energy regions wherelargest discrepancies are present. The present data con-firm the resonances in the ENDF/B-VIII.0 evaluation,with the exception of the resonances at 139 eV and 206eV, moreover the resonance at 220.65 in ENDF/B-VIII.0is rather a doublet. The results of the resonance shapeanalysis are summarized in Table V. Also the correla-tion coefficient between partial widths ρ(Γγ ,Γn), result-
13
FIG. 12. (Color online) 157Gd(n,γ) capture yield from thepresent work and comparison with the expected capture yield,calculated on the basis of the cross sections in ENDF/B-VIII.0, JEFF-3.3 and JENDL-4.0 libraries
ing from the SAMMY fit, is reported. A comparisonof the kernels from the present analysis to the ones fromevaluations and Ref. [10] is reported as a function of reso-nance energy in Fig. 13 in terms of residuals. On averagea good agreement was found with ENDF/B-VIII.0 andJEFF-3.3 evaluations, since the statistical distributionof the ratios was Gaussian with mean 0.98. On the con-trary, the comparison with JENDL-4.0 and the data fromLeinweber and collaborators does not tend to a Gaussiandistribution and the average deviation is 13% and 18%,respectively. From the figure it results that the resonanceparameters form JENDL-4.0 are not directly taken fromRef. [10].
The resonances and structures observed in the energyregion above the upper limit of evaluations are reported
TABLE V. Resonances in 157Gd(n,γ). Uncertainties are fromthe fit.
Energy Γγ gΓn ρ(Γγ ,Γn) capture kernel(eV) (meV) (meV) (meV)0.0314 111.80(2) 0.2921(1) −0.11 0.2908(1)2.8330(1) 109.7(3) 0.2319(4) 0.17 0.2311(4)16.218(3) 116(7) 0.113(3) 0.68 0.113(3)16.7946(2) 104.2(5) 8.74(3) −0.49 7.70(1)20.5262(3) 100.3(6) 8.47(2) −0.49 7.47(2)21.602(2) 91(5) 0.217(4) 0.59 0.216(4)23.290(2) 100(4) 0.223(3) 0.54 0.221(3)25.3653(8) 103(2) 1.187(7) 0.31 1.165(7)40.091(3) 101(6) 0.368(6) 0.44 0.365(6)44.1374(8) 106(2) 5.98(3) −0.11 5.48(2)48.7077(6) 103(1) 17.2(1) −0.74 13.56(4)58.2928(7) 109(2) 19.9(1) −0.77 15.44(5)66.536(1) 108(3) 4.46(3) −0.17 4.02(3)81.312(2) 129(4) 6.54(5) 0.01 5.76(5)82.103(3) 102(6) 4.10(5) 0.40 3.86(5)87.175(2) 93(4) 6.61(6) −0.28 6.61(5)96.572(2) 96(4) 6.21(7) −0.51 6.21(4)100.160(2) 130(4) 10.7(1) −0.53 10.7(6)104.909(2) 140(5) 14.4(9) −0.73 14.4(7)107.370(4) 109(8) 3.20(5) 0.30 3.06(5)110.550(1) 99(4) 30.6(7) −0.94 20.5(1)115.373(2) 97(4) 13.8(2) −0.65 11.24(9)120.861(2) 100(1) 93(2) −0.84 37.5(2)135.36(3) 110(10) 0.66(4) 0.15 0.66(4)138.088(2) 122(6) 29.1(5) −0.84 21.0(2)138.974(6) 127(11) 5.6(1) 0.39 5.3(1)143.736(2) 114(6) 35.0(9) −0.93 23.5(2)148.422(4) 114(8) 6.15(9) −0.30 5.38(7)156.592(3) 115(7) 11.7(2) −0.42 10.0(1)164.910(3) 94(7) 11.0(3) −0.80 8.37(9)168.13(2) 146(14) 1.16(6) 0.21 1.15(5)169.45(1) 191(18) 1.90(7) 0.36 1.87(7)171.408(3) 205(7) 21.9(3) −0.60 17.1(1)178.727(4) 104(8) 10.7(2) −0.45 9.2(1)183.985(4) 110(8) 8.8(2) −0.60 7.2(1)190.789(5) 144(10) 8.2(1) −0.29 7.1(1)194.614(3) 125(7) 26.3(5) −0.80 19.7(2)203.06(1) 158(15) 2.82(8) 0.24 2.69(7)205.63(4) 82(8) 0.66(5) 0.04 0.65(5)207.725(3) 88(1) 108(3) −0.75 36.4(3)217.22(1) 162(16) 2.66(8) 0.22 2.55(7)220.39(4) 120(12) 0.67(5) 0.07 0.66(5)221.38(3) 199(20) 1.26(7) 0.21 1.24(7)228.406(9) 163(15) 5.3(1) 0.11 5.1(1)239.572(4) 127(3) 82(3) −0.81 30.1(2)243.8(1) 135(13) 0.23(2) 0.02 0.22(2)246.75(1) 149(14) 6.3(2) 0.06 5.9(1)250.42(2) 147(15) 1.73(8) 0.11 1.68(8)254.6(1) 121(12) 0.34(4) 0.01 0.34(3)255.10(8) 113(11) 0.53(5) 0.01 0.53(5)260.44(1) 222(19) 7.3(2) 0.07 6.7(2)265.99(2) 171(17) 3.9(1) 0.15 3.8(1)268.43(2) 119(12) 4.6(2) 0.04 4.3(2)282.015(6) 128(11) 20.0(7) −0.86 14.1(2)287.73(1) 203(19) 8.2(2) 0.20 7.7(2)291.072(9) 147(13) 11.5(3) −0.42 9.5(2)294.060(6) 106(9) 24(1) −0.90 15.1(2)301.353(8) 184(15) 13.8(3) −0.42 11.5(2)306.92(4) 226(22) 2.0(1) 0.13 2.0(1)

14
FIG. 13. (Color online) 157Gd(n,γ) residuals between reso-nance kernel of this work and ENDF/B-VIII.0, JEFF-3.3 andJENDL-4.0 evaluations and Ref. [10], as a function of neutronresonance energy.
in Tab. VII in Appendix A together with their capturekernel.
C. Statistical properties of neutron resonances
Resolved resonance parameters from this analysis, seeTabs. IV and V can be used to determine basic statisticalproperties of resonances. Since we do not see any signifi-cant difference in the number of observed resonances withrespect to other experiments reported in literature, theestimation of quantities describing the statistical prop-erties of neutron resonances – s-wave neutron strengthfunction, S0, resonance radiative width, Γγ , and s-waveaverage resonance spacing, D0 – should not differ signif-icantly from nuclear data libraries.
1. Neutron strength function
An estimate of the s-wave neutron strength functionS0 can be made from the reduced neutron widths as
S0 =1
∆E
∑∆E
gJΓ0n (4)
where ∆E is the interval of neutron energies which thereduced neutron widths Γ0
n are summed over. The sumgoes over resonances of both spins.
Assuming the neutron strength function for p-wave res-onances is close to the literature values S1 = 3.7(1.1) ×10−4 for 155Gd and S1 = 2.2(7)×10−4 for 157Gd [8], no p-wave resonance should be observable in our data as theseresonances are too weak. On the other hand, as alreadypointed out in Ref. [17] the Porter-Thomas (PT) fluctua-tions of individual neutron widths almost surely preventobservation of some s-wave resonances in Gd isotopes.Nevertheless, the contribution of these unobservable res-onances to the sum is very small, about 1% in RRR forboth nuclei.
0
50
100
150
200
SgG
n(0
) (m
eV
)
(a)
S0 = 2.01(28) x 10-4
n+ 155Gd
0
50
100
150
200
0 100 200 300 400 500 600 700 800 900Neutron energy (eV)
(b)
S0 = 2.17(41) x 10-4
n+ 157Gd
FIG. 14. Cumulative distribution of reduced neutron widthsfor both Gd nuclei. Solid lines correspond to S0 = 2.01 ×10⁻⁴ for 155Gd and S0 = 2.17 × 10⁻⁴ for 155Gd, respectively.Coloured regions indicate expected corridor for both isotopesdue to Porter-Thomas fluctuations.
The uncertainty in S0 is given by the uncertainty inindividual Γ0
n values from SAMMY fitting and by theexpected PT fluctuations which the Γ0
n values are ex-pected to follow. The PT fluctuation adds an uncertainty√
2/NRS0, where NR is the number of resonances. Ourdata yield S0 = 2.01(28)× 10−4 and 2.17(40)× 10−4 for155Gd and 157Gd determined from energy regions below180 and 300 eV, respectively. These values agree withvalues available in literature: 1.99(28) × 10−4 [17] and2.20(14)× 10−4 [8] for 155Gd and 2.20(40)× 10−4 [8] for157Gd. The dominant contribution to listed uncertaintycomes from the Porter-Thomas fluctuations.
Figure 14 shows the dependence of∑gJΓ0
n on neu-tron energy. For resonances where only resonance ker-nel is given in Tabs. VI and VII, we assumed Γγ = 108and 105 meV for 155Gd and 157Gd, respectively, and spinwas assigned randomly assuming that the ratio of num-ber of J = 1 to 2 resonances is 3/5 as expected fromstandard spin dependence of the level density. Expecteduncertainties, corresponding to the average ± rms fromPorter-Thomas distribution are also indicated in the fig-ure; those for 157Gd are higher due to larger resonancespacing.
2. Total radiation width
The radiation widths from resonance shape analysisare very precisely determined at low En but their uncer-
15
tainty significantly increases with neutron energy. Thestatistical model predicts that due to the many possibledecay channels the Γγ should not vary much for reso-nances in a given isotope. This quantity is also expectedto depend only weakly on the resonance spin. Simula-tions of the γ decay of resonances using the DICEBOXcode indicated that the fluctuation of Γγ are expected tobe for resonances with the same spin about 1-2% witha realistic model of nuclear level density and of photonstrength functions [32, 33]. The simulations also pre-dicted similar difference, about 2%, between the Γγ ex-pectation values between J = 1 and 2 resonances.
Assuming Normal distribution of actual Γγ values wetried to estimate the mean value and the width of the dis-tribution of this quantity using the maximum-likelihood(ML) method. Uncertainties of individual values fromSAMMY fit were taken into account in determining theparameters of this distribution. Using resonances forEn < 50 eV (i. e. the region where the Doppler broad-ening does not dominate the observed widths of the res-onances), the ML method yielded the expectation valueΓγ = 109(2) and 105(2) meV.
3. Resonance spacing
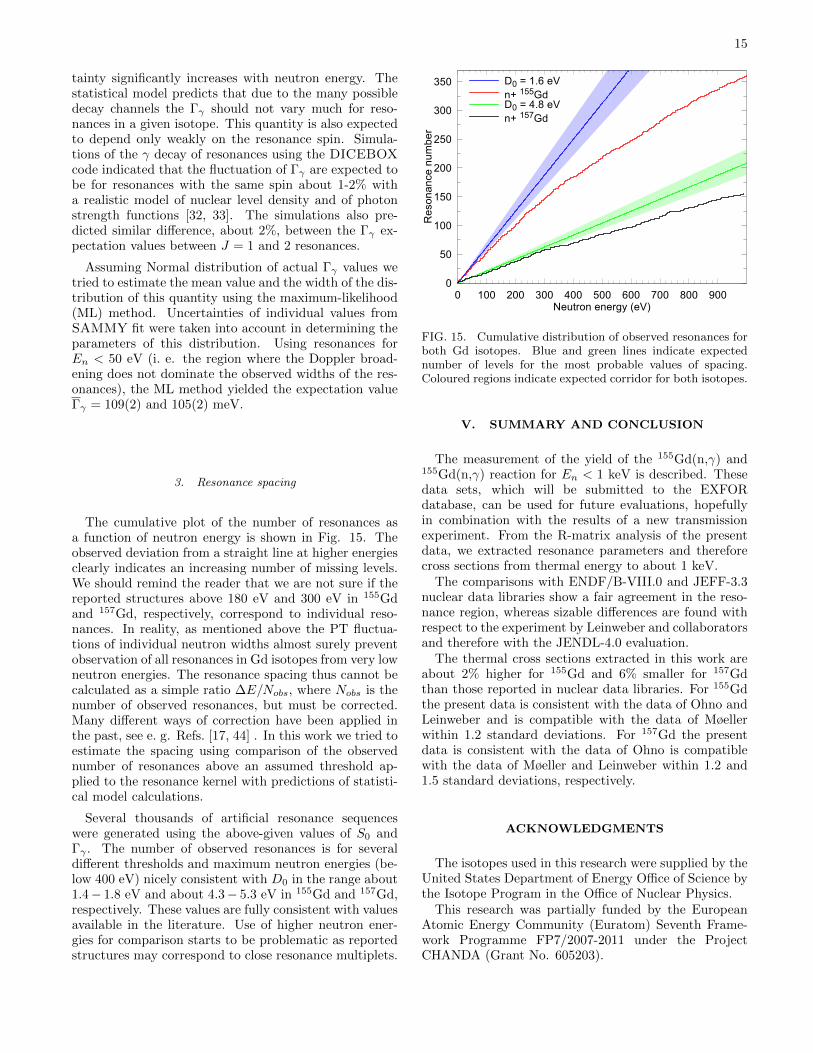
The cumulative plot of the number of resonances asa function of neutron energy is shown in Fig. 15. Theobserved deviation from a straight line at higher energiesclearly indicates an increasing number of missing levels.We should remind the reader that we are not sure if thereported structures above 180 eV and 300 eV in 155Gdand 157Gd, respectively, correspond to individual reso-nances. In reality, as mentioned above the PT fluctua-tions of individual neutron widths almost surely preventobservation of all resonances in Gd isotopes from very lowneutron energies. The resonance spacing thus cannot becalculated as a simple ratio ∆E/Nobs, where Nobs is thenumber of observed resonances, but must be corrected.Many different ways of correction have been applied inthe past, see e. g. Refs. [17, 44] . In this work we tried toestimate the spacing using comparison of the observednumber of resonances above an assumed threshold ap-plied to the resonance kernel with predictions of statisti-cal model calculations.
Several thousands of artificial resonance sequenceswere generated using the above-given values of S0 andΓγ . The number of observed resonances is for severaldifferent thresholds and maximum neutron energies (be-low 400 eV) nicely consistent with D0 in the range about1.4− 1.8 eV and about 4.3− 5.3 eV in 155Gd and 157Gd,respectively. These values are fully consistent with valuesavailable in the literature. Use of higher neutron ener-gies for comparison starts to be problematic as reportedstructures may correspond to close resonance multiplets.
0
50
100
150
200
250
300
350
0 100 200 300 400 500 600 700 800 900
Re
son
an
ce n
um
be
r
Neutron energy (eV)
D0 = 1.6 eVn+ 155GdD0 = 4.8 eVn+ 157Gd
FIG. 15. Cumulative distribution of observed resonances forboth Gd isotopes. Blue and green lines indicate expectednumber of levels for the most probable values of spacing.Coloured regions indicate expected corridor for both isotopes.
V. SUMMARY AND CONCLUSION
The measurement of the yield of the 155Gd(n,γ) and155Gd(n,γ) reaction for En < 1 keV is described. Thesedata sets, which will be submitted to the EXFORdatabase, can be used for future evaluations, hopefullyin combination with the results of a new transmissionexperiment. From the R-matrix analysis of the presentdata, we extracted resonance parameters and thereforecross sections from thermal energy to about 1 keV.
The comparisons with ENDF/B-VIII.0 and JEFF-3.3nuclear data libraries show a fair agreement in the reso-nance region, whereas sizable differences are found withrespect to the experiment by Leinweber and collaboratorsand therefore with the JENDL-4.0 evaluation.
The thermal cross sections extracted in this work areabout 2% higher for 155Gd and 6% smaller for 157Gdthan those reported in nuclear data libraries. For 155Gdthe present data is consistent with the data of Ohno andLeinweber and is compatible with the data of Møellerwithin 1.2 standard deviations. For 157Gd the presentdata is consistent with the data of Ohno is compatiblewith the data of Møeller and Leinweber within 1.2 and1.5 standard deviations, respectively.
ACKNOWLEDGMENTS
The isotopes used in this research were supplied by theUnited States Department of Energy Office of Science bythe Isotope Program in the Office of Nuclear Physics.
This research was partially funded by the EuropeanAtomic Energy Community (Euratom) Seventh Frame-work Programme FP7/2007-2011 under the ProjectCHANDA (Grant No. 605203).

16
We acknowledge support from FPA2014-52823-C2-1-P(MINECO)
17
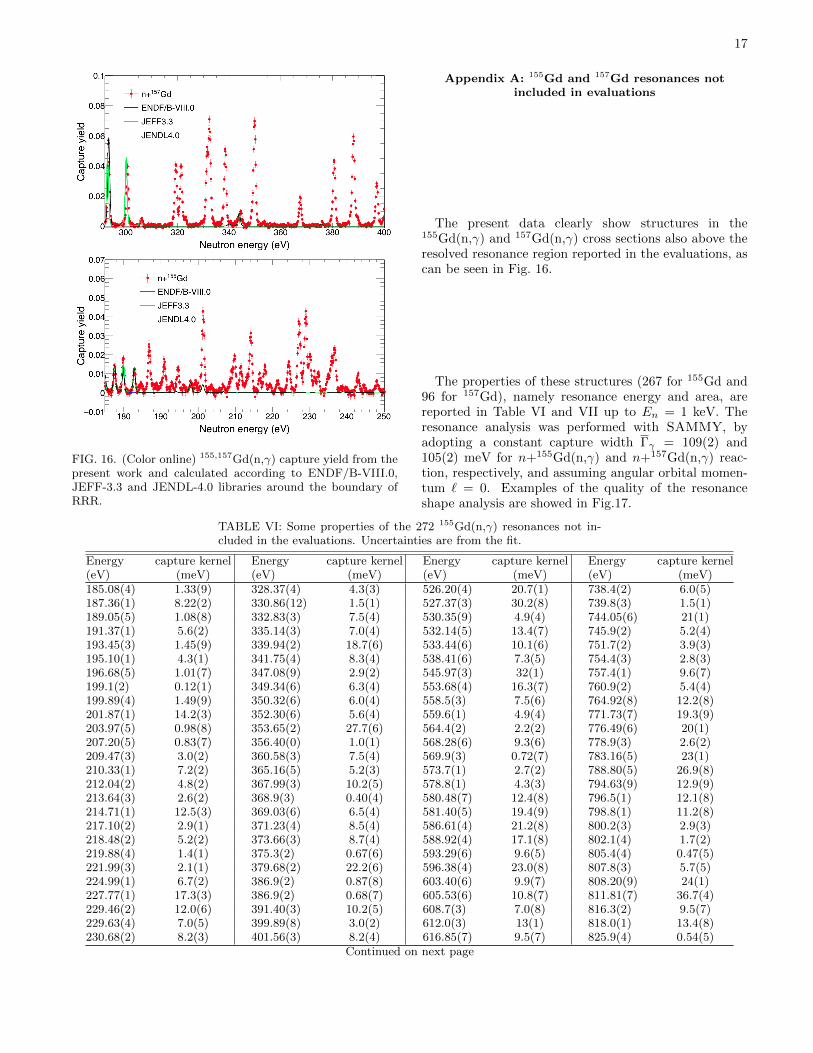
FIG. 16. (Color online) 155,157Gd(n,γ) capture yield from thepresent work and calculated according to ENDF/B-VIII.0,JEFF-3.3 and JENDL-4.0 libraries around the boundary ofRRR.
Appendix A: 155Gd and 157Gd resonances notincluded in evaluations
The present data clearly show structures in the155Gd(n,γ) and 157Gd(n,γ) cross sections also above theresolved resonance region reported in the evaluations, ascan be seen in Fig. 16.
The properties of these structures (267 for 155Gd and96 for 157Gd), namely resonance energy and area, arereported in Table VI and VII up to En = 1 keV. Theresonance analysis was performed with SAMMY, byadopting a constant capture width Γγ = 109(2) and105(2) meV for n+155Gd(n,γ) and n+157Gd(n,γ) reac-tion, respectively, and assuming angular orbital momen-tum ` = 0. Examples of the quality of the resonanceshape analysis are showed in Fig.17.
TABLE VI: Some properties of the 272 155Gd(n,γ) resonances not in-cluded in the evaluations. Uncertainties are from the fit.
Energy capture kernel Energy capture kernel Energy capture kernel Energy capture kernel(eV) (meV) (eV) (meV) (eV) (meV) (eV) (meV)185.08(4) 1.33(9) 328.37(4) 4.3(3) 526.20(4) 20.7(1) 738.4(2) 6.0(5)187.36(1) 8.22(2) 330.86(12) 1.5(1) 527.37(3) 30.2(8) 739.8(3) 1.5(1)189.05(5) 1.08(8) 332.83(3) 7.5(4) 530.35(9) 4.9(4) 744.05(6) 21(1)191.37(1) 5.6(2) 335.14(3) 7.0(4) 532.14(5) 13.4(7) 745.9(2) 5.2(4)193.45(3) 1.45(9) 339.94(2) 18.7(6) 533.44(6) 10.1(6) 751.7(2) 3.9(3)195.10(1) 4.3(1) 341.75(4) 8.3(4) 538.41(6) 7.3(5) 754.4(3) 2.8(3)196.68(5) 1.01(7) 347.08(9) 2.9(2) 545.97(3) 32(1) 757.4(1) 9.6(7)199.1(2) 0.12(1) 349.34(6) 6.3(4) 553.68(4) 16.3(7) 760.9(2) 5.4(4)199.89(4) 1.49(9) 350.32(6) 6.0(4) 558.5(3) 7.5(6) 764.92(8) 12.2(8)201.87(1) 14.2(3) 352.30(6) 5.6(4) 559.6(1) 4.9(4) 771.73(7) 19.3(9)203.97(5) 0.98(8) 353.65(2) 27.7(6) 564.4(2) 2.2(2) 776.49(6) 20(1)207.20(5) 0.83(7) 356.40(0) 1.0(1) 568.28(6) 9.3(6) 778.9(3) 2.6(2)209.47(3) 3.0(2) 360.58(3) 7.5(4) 569.9(3) 0.72(7) 783.16(5) 23(1)210.33(1) 7.2(2) 365.16(5) 5.2(3) 573.7(1) 2.7(2) 788.80(5) 26.9(8)212.04(2) 4.8(2) 367.99(3) 10.2(5) 578.8(1) 4.3(3) 794.63(9) 12.9(9)213.64(3) 2.6(2) 368.9(3) 0.40(4) 580.48(7) 12.4(8) 796.5(1) 12.1(8)214.71(1) 12.5(3) 369.03(6) 6.5(4) 581.40(5) 19.4(9) 798.8(1) 11.2(8)217.10(2) 2.9(1) 371.23(4) 8.5(4) 586.61(4) 21.2(8) 800.2(3) 2.9(3)218.48(2) 5.2(2) 373.66(3) 8.7(4) 588.92(4) 17.1(8) 802.1(4) 1.7(2)219.88(4) 1.4(1) 375.3(2) 0.67(6) 593.29(6) 9.6(5) 805.4(4) 0.47(5)221.99(3) 2.1(1) 379.68(2) 22.2(6) 596.38(4) 23.0(8) 807.8(3) 5.7(5)224.99(1) 6.7(2) 386.9(2) 0.87(8) 603.40(6) 9.9(7) 808.20(9) 24(1)227.77(1) 17.3(3) 386.9(2) 0.68(7) 605.53(6) 10.8(7) 811.81(7) 36.7(4)229.46(2) 12.0(6) 391.40(3) 10.2(5) 608.7(3) 7.0(8) 816.3(2) 9.5(7)229.63(4) 7.0(5) 399.89(8) 3.0(2) 612.0(3) 13(1) 818.0(1) 13.4(8)230.68(2) 8.2(3) 401.56(3) 8.2(4) 616.85(7) 9.5(7) 825.9(4) 0.54(5)
Continued on next page

18
FIG. 17. (Color online) 155,157Gd(n,γ) capture yield fromthe present experiment and the results of a resonance shapeanalysis.
TABLE VI (Continued)Energy capture kernel Energy capture kernel Energy capture kernel Energy capture kernel(eV) (meV) (eV) (meV) (eV) (meV) (eV) (meV)231.90(3) 2.9(2) 405.97(5) 5.0(3) 618.8(2) 1.5(1) 828.28(6) 29.5(8)232.91(2) 4.2(2) 410.67(6) 5.2(3) 622.1(3) 1.1(1) 831.4(4) 1.2(1)235.52(3) 3.1(2) 412.96(7) 3.4(3) 624.50(4) 20.5(8) 834.44(9) 14.2(8)236.48(2) 6.9(3) 414.22(4) 8.4(5) 627.22(6) 12.8(7) 837.3(2) 8.4(7)237.35(1) 10.4(3) 418.50(9) 2.7(2) 630.55(4) 16.5(6) 841.01(7) 25.6(9)243.63(2) 3.9(2) 420.53(8) 4.7(3) 634.2(1) 4.8(4) 851.7(2) 7.3(6)245.35(7) 0.98(8) 425.1(1) 4.4(3) 635.6(4) 0.92(9) 853.07(9) 16.3(9)248.74(3) 2.5(1) 425.2(3) 1.7(2) 638.10(6) 14.0(8) 860.60(3) 4.3(4)252.8(1) 0.77(7) 430.07(2) 19.1(7) 640.69(9) 8.0(5) 862.3(2) 7.7(6)254.79(2) 5.9(2) 430.8(1) 3.0(3) 643.3(1) 8.1(6) 865.92(8) 16.8(9)259.15(3) 2.4(2) 434.4(2) 1.2(1) 644.13(8) 9.6(6) 869.3(1) 15.3(9)262.51(3) 2.9(2) 437.61(7) 4.4(3) 652.36(4) 21.9(9) 870.8(2) 9.3(7)264.84(3) 3.5(2) 440.98(7) 3.8(3) 656.26(6) 14.8(7) 875.96(8) 25(1)268.4(2) 1.0(1) 443.4(1) 2.4(2) 659.17(7) 17(1) 876.97(9) 21(1)268.38(9) 2.9(2) 449.21(2) 21.4(7) 659.6(2) 7.1(6) 890.1(1) 23(1)269.37(4) 2.6(2) 452.03(8) 4.8(3) 664.19(4) 23.7(9) 891.45(6) 48(1)272.34(4) 2.7(2) 452.1(4) 4.8(4) 669.76(5) 25.9(8) 898.44(7) 31.5(7)276.96(1) 17.4(4) 453.5(5) 29.1(9) 671.66(6) 17(1) 901.2(1) 1.9(2)279.27(6) 1.8(1) 454.7(3) 6.4(5) 674.0(1) 8.1(6) 904.29(6) 29.8(8)282.52(1) 13.5(3) 459.75(3) 19.2(7) 677.2(4) 0.86(8) 906.5(4) 15(1)285.17(3) 6.0(3) 463.8(2) 1.8(2) 679.86(5) 19.6(8) 913.91(9) 22(1)284.34(3) 6.5(3) 467.19(4) 12.5(6) 682.45(4) 24(1) 915.43(4) 8.6(7)288.09(2) 7.3(3) 468.62(3) 24.2(8) 684.84(5) 17.0(7) 919.4(1) 23(1)288.99(4) 4.8(3) 475.70(8) 5.2(4) 686.8(3) 1.4(1) 923.0(2) 11.6(8)290.85(7) 1.2(1) 477.97(6) 6.5(5) 688.4(4) 0.94(9) 924.7(5) 0.60(6)292.36(2) 5.9(3) 480.58(9) 3.8(3) 693.22(4) 29(1) 930.4(5) 0.46(5)295.71(8) 1.3(1) 482.26(2) 22.6(8) 696.36(6) 36.7(4) 932.9(1) 12.6(8)
Continued on next page

19
TABLE VI (Continued)Energy capture kernel Energy capture kernel Energy capture kernel Energy capture kernel(eV) (meV) (eV) (meV) (eV) (meV) (eV) (meV)297.7(1) 0.99(9) 485.6(2) 1.7(2) 699.74(5) 8.3(7) 935.9(1) 13.3(9)301.25(5) 3.0(2) 487.97(3) 30.1(6) 700.7(3) 4.9(4) 942.8(4) 2.5(2)301.93(8) 1.8(2) 485.9(3) 1.3(1) 701.0(2) 8.9(7) 945.3(1) 20(1)303.57(7) 1.5(2) 494.8(1) 2.9(2) 701.4(4) 2.4(2) 956.5(2) 7.2(6)307.60(4) 4.5(3) 497.77(5) 10.0(5) 708.28(5) 21(1) 958.0(2) 16(1)310.20(1) 16.0(4) 499.99(9) 6.9(6) 711.3(4) 1.3(1) 963.2(1) 13.4(8)311.98(8) 2.2(2) 500.17(8) 7.7(7) 713.4(4) 0.56(6) 968.1(5) 0.22(2)312.3(3) 0.36(4) 502.18(7) 6.0(4) 716.6(2) 3.7(3) 971.5(4) 1.3(1)316.88(1) 15.0(4) 503.77(6) 6.6(4) 717.5(2) 4.6(4) 974.6(1) 15(1)319.5(2) 0.72(7) 505.86(3) 17.5(6) 723.5(1) 9.0(6) 979.6(2) 5.6(5)321.50(3) 5.9(3) 509.43(4) 16.0(9) 724.1(2) 7.1(6) 986.7(5) 0.10(1)323.27(2) 7.4(3) 510.02(6) 11.3(7) 726.6(4) 0.90(9) 989.4(2) 6.0(5)326.4(2) 1.4(1) 515.3(1) 4.1(3) 730.15(4) 30(1) 992.6(2) 8.0(7)326.6(2) 1.2(1) 518.82(7) 5.5(4) 736.6(1) 8.4(6) 997.58(7) 2.4(2)
hline
[1] F. Kappeler, R. Gallino, S. Bisterzo, Wako Aoki, Rev.Mod. Phys. 83 (2011) 157
[2] [2] A. Deagostino, et al., Future Med Chem. 8 (2016) 899[3] J. F. Beacom and M. R. Vagins, Phys. Rev. Lett. 93
(2004) 171101[4] F. Rocchi, A. Guglielmelli, D. M. Castelluccio and
C. Massimi, Eur. Phys. J. Nuclear Sci. Technol. 3 (2017)21
[5] D. A. Brown, et. al., Nucl. Data Sheets 148 (2018) 1[6] OECD/NEA Data Bank, ”The JEF-3.3 Nuclear
Data Library” available online at http://www.oecd-nea.org/dbdata/JEFF33/
[7] K. Shibata, et. al., J. Nucl. Sci. Technol. 48 (2011) 1[8] S. F. Mughabghab, Atlas of Neutron Resonances (Else-
vier, Amsterdam, 2006)[9] H. Bjerrum Møller, F. J. Shore, and V. L. Sailor, Nucl.
Sci. Eng. 8 (1960) 183[10] G. Leinweber, et. al., Nucl. Sci. Eng. 154 (2006) 261[11] http://icsbep.inel.gov[12] N. J. Pattenden, Second Internat. At. En. Conf., Geneva
1958, Vol.16, p.44[13] H.D.Choi, et. al., Nucl. Science & Eng. 177 (2014) 219[14] R. B. Tattersall, et. al., Journal of Nuclear Energy A 12
(1960) 32[15] L. V. Groshev, et. al., Bull. Russian Academy of Sciences
- Physics, 26 (1963) 1127[16] Y. Ohno, et. al., Japanese report to EANDC, Number
10, p. 1 (1968)[17] B. Baramsai, et. al., Phys. Rev. C 85 (2012) 024622[18] C. Guerrero, et al., Eur. Phys. J. A 49 (2013) 27[19] S. Lo Meo, et al., Eur. Phys. J. A 51 (2015) 160[20] P. F. Mastinu, et al., New C6D6 detectors: reduced neu-
tron sensitivity and improved safety n TOF-PUB-2013-002; CERN-n TOF-PUB-2013-002 (2013)
[21] P. Schillebeeckx, et al., Nucl. Data Sheets 113 (2012)3054
[22] A. Borella, G. Aerts, F. Gunsing, M. Moxon, P. Schille-beeckx, and R. Wynants, Nucl. Instrum. & Methods A577 (2007) 626
[23] M. Barbagallo, et al., Eur. Phys. J. A 49, 156 (2013)[24] A. D. Carlson, et al., Nucl. Data Sheets 110 (2009) 3215[25] S. Marrone, et al., Nucl. Instrum. & Methods A 517, 389
(2004)[26] J. Allison, et al., Nucl. Instrum. & Methods A 835 (2016)
186[27] R. L. Macklin, J. Halperin, and R. R. Winters, Nucl.
Instrum. & Methods 164 (1979) 213[28] F. Becvar, Nucl. Instrum. Methods A 417 (1998) 434[29] C. W. Reich, Nucl. Data Sheets 99 (2003) 753[30] R. G. Helmer, Nucl. Data Sheets 101 (2004) 325[31] H. Xiaolong and K. Mengxiao, Nucl. Data Sheets 133
(2016) 221[32] A. Chyzh et al., Phys. Rev. C 84 (2011) 014306[33] B. Baramsai et al., Phys. Rev. C 87 (2013) 044609[34] M. Krticka et al., AIP Conference Proceedings 831
(2006) 481[35] T. Kibedi et al., Nucl. Instrum. Methods A 589 (2013)
202[36] I. Sirakov, et al., ”Evaluation of neutron induced reaction
cross sections on gold”, JRC report 78690 EUR 25803[37] C. Massimi, et al., Eur. Phys. J. A (2014) 50: 124[38] T. T. Bohlen, et al., Nuclear Data Sheets 120 (2014) 211[39] A. Ferrari, et al., ”FLUKA: a multi-particle transport
code” CERN-2005-10 (2005), INFN/TC 05/11, SLAC-R-773
[40] N. M. Larson, ”Updated Users Guide for SAMMY:Multilevel Rmatrix Fits to Neutron Data Using BayesEquations, SAMMY” Computer Code, Report No.ORNL/TM-9179/R7, Oak Ridge National Laboratory,2008
[41] C. Massimi, et al., Phys. Rev. C 81 (2010) 044616[42] H. A. Weidenmuller and G. E. Mitchell, Rev. Mod. Phys.
81 (2009) 539[43] Y. Nakajima, Annals of Nuclear Energy 16 (1989) 589[44] G. E. Mitchell, J. F. Shriner, ”Missing Level Correc-
tions using Neutron Spacings”, IAEA Technical ReportINDC(NDS)-0561 (2009)

20
TABLE VII. Some properties of the 96 157Gd(n,γ) resonances not included in the evaluations. Uncertainties are from the fit.
Energy capture kernel Energy capture kernel Energy capture kernel Energy capture kernel(eV) (meV) (eV) (meV) (eV) (meV) (eV) (meV)320.19(1) 17.6(3) 487.28(3) 6.6(3) 658.71(4) 11.5(5) 814.73(4) 17.6(8)322.23(1) 14.034(2) 493.59(3) 0.87(08) 661.62(4) 14.9(6) 819.84(5) 14.4(7)332.30(2) 17.55(6) 505.67(1) 17.9(4) 667.67(6) 5.6(4) 828.1(2) 3.8(3)333.29(1) 25.2(5) 511.02(4) 6.7(3) 679.42(5) 11.4(6) 829.62(4) 27.9(9)339.37(1) 23.9(4) 529.90(3) 6.4(3) 681.69(6) 8.8(5) 831.84(5) 19.0(8)350.74(1) 27.0(4) 531.87(2) 26.8(5) 688.84(2) 42.8(9) 842.40(3) 37.0(9)368.48(2) 9.3(3) 538.99(2) 24.6(5) 697.15(4) 14.1(5) 849.02(4) 31(1)381.67(1) 18.7(3) 541.33(2) 25.1(6) 698.73(6) 12.3(6) 855.72(3) 30.8(9)389.16(1) 39.5(5) 551.33(3) 8.6(3) 700.64(4) 17.8(7) 861.1(1) 8.2(5)398.24(1) 12.1(3) 556.16(4) 7.8(3) 708.24(7) 5.5(3) 866.7(1) 5.1(4)401.78(1) 24.1(4) 568.49(8) 3.0(2) 710.64(2) 19.5(6) 875.46(8) 12.8(7)410.67(1) 22.2(4) 572.13(5) 5.1(3) 718.04(5) 11.8(6) 879.67(3) 24.7(8)416.97(2) 12.2(4) 584.93(4) 8.7(4) 720.49(5) 21.5(9) 885.6(1) 6.3(5)420.57(1) 14.1(3) 593.79(2) 21.3(5) 721.59(4) 20.8(9) 894.79(4) 30(1)422.78(2) 11.4(3) 603.41(3) 12.1(5) 726.31(3) 23.9(7) 897.79(7) 11.0(6)430.07(3) 5.0(2) 610.44(9) 2.4(2) 730.52(8) 5.2(4) 907.48(4) 5.5(5)446.05(1) 13.7(3) 613.54(3) 12.4(4) 733.88(3) 29.0(8) 914.08(9) 7.6(4)451.64(2) 11.8(4) 619.32(5) 6.5(4) 757.80(2) 31.0(8) 926.70(7) 14.2(7)456.75(4) 4.4(2) 626.50(3) 14.9(5) 769.81(3) 23.5(7) 936.46(1) 7.5(5)458.72(1) 16.0(3) 632.22(2) 21.8(5) 771.0(2) 3.2(3) 941.99(5) 12.9(6)460.78(1) 2.6(3) 635.00(8) 3.8(3) 779.48(3) 56.2(5) 955.65(3) 55.2(7)472.70(2) 11.6(4) 637.29(1) 2.6(2) 784.34(3) 22.6(8) 965.91(1) 6.9(5)476.40(1) 14.5(3) 639.72(3) 11.5(4) 792.90(3) 25.8(8) 977.24(8) 13.9(8)485.29(2) 15.8(4) 644.47(4) 8.8(4) 797.78(3) 37.9(9) 989.79(4) 35(1)