ANALYSIS OF S&R PHENOMENA THROUGH SIMULATION IN ABAQUS · · 2016-11-08ABAQUS Inés Lama, Jordi...
13
3 rd ANSA & μETA International Conference September 9-11, 2009 Olympic Convention Centre, Porto Carras Grand Resort Hotel, Halkidiki Greece ANALYSIS OF S&R PHENOMENA THROUGH SIMULATION IN ABAQUS Inés Lama, Jordi Viñas * , Yannick Blecon, Xavier Montané IDIADA Automotive Technology, Spain KEYWORDS – NVH, Squeak, Rattle, Postprocessing, Automotive Structures ABSTRACT – In recent years car manufacturers have been working intensively on new ways to improve the quality of the interior trimmings because they are extremely important to the perception of quality by customers and can be a source of after-sale complaints. Consequently, the study of squeak and rattle has become one of the main concerns for car manufacturers. Generally, S&R problems (mainly produced by interior trimmings) are solved in the final development phases when the trimming geometry has already been frozen and so any modification means extra cost. Furthermore, countermeasures at this stage of the development are normally proposed after intensive testing work. Simulation of S&R phenomena is one of the most complicated issues to reproduce virtually, because it is difficult to study using methods based on eigen-modes due to the impossibility of using contacts in this type of FE model, since modal theory is based on the hypothesis of linearity. In this frame, IDIADA has developed a simulation protocol that can help in the detection of potential S&R problems during the development phase. The main objectives of this protocol are the following: use of common software packages used in normal NVH analysis in the company, minimum modification of NVH models and simplicity of pre/post-processing. This paper describes the main points of such a methodology. The core of the protocol has been implemented in ABAQUS by using a specific element of this solver as virtual contact sensor in the frequency domain simulation. TECHNICAL PAPER - 1. INTRODUCTION In recent years, with the improvement of the acoustic quality of vehicles and engines, other types of noises that normally were hidden by the usual noise of the engine and the rolling noise are now perceived by the occupants. Some of the most annoying ones are the small noises coming from the squeak and rattle of the interior trimmings, which in general have become an indicator of the quality and durability of the product. Squeak phenomenon is caused by the relative movement between two components that slip and stick alternatively. The elastic deformation of the surfaces in contact accumulates energy and this is released when the static friction overcomes the kinetic friction producing then an audible noise. The generation of this type of noise occurs at low frequencies (under 200 Hz) they are normally induced by energy inputs coming from the suspension system; however the release of the elastic energy produces the vibration of the adjacent surfaces causing contact audible noises in the range of 200 t Hz to 10000 Hz (Kavarana, 1999). Rattle noise is induced by impacts between parts; it is generated by the perpendicular relative movement between two parts, and is usually due to erroneous assembly tolerances or to lack of stiffness. The impacts will only generate noise if the adjacent surfaces to the impact point are capable of radiating audible sound-power levels (Kavarana, 1999). Traditionally, automotive industry has been using physical testing to detect this kind of defects. Although this testing methodology is broadly accepted by industry standards, it has some issues that cause this to be not efficient enough: • Tests are completely hardware dependent. A physical prototype is necessary for each kind of test. • The detection and evaluation of these noises is done by testing engineers and normally they only point out if a rattle appears or not just by listening, as a consequence, these results have some degree of subjectivity
Transcript of ANALYSIS OF S&R PHENOMENA THROUGH SIMULATION IN ABAQUS · · 2016-11-08ABAQUS Inés Lama, Jordi...
3rd ANSA & μETA International Conference September 9-11, 2009 Olympic Convention Centre, Porto Carras Grand Resort Hotel, Halkidiki Greece
ANALYSIS OF S&R PHENOMENA THROUGH SIMULATION IN ABAQUS Inés Lama, Jordi Viñas*, Yannick Blecon, Xavier Montané IDIADA Automotive Technology, Spain KEYWORDS – NVH, Squeak, Rattle, Postprocessing, Automotive Structures ABSTRACT – In recent years car manufacturers have been working intensively on new ways to improve the quality of the interior trimmings because they are extremely important to the perception of quality by customers and can be a source of after-sale complaints. Consequently, the study of squeak and rattle has become one of the main concerns for car manufacturers. Generally, S&R problems (mainly produced by interior trimmings) are solved in the final development phases when the trimming geometry has already been frozen and so any modification means extra cost. Furthermore, countermeasures at this stage of the development are normally proposed after intensive testing work. Simulation of S&R phenomena is one of the most complicated issues to reproduce virtually, because it is difficult to study using methods based on eigen-modes due to the impossibility of using contacts in this type of FE model, since modal theory is based on the hypothesis of linearity. In this frame, IDIADA has developed a simulation protocol that can help in the detection of potential S&R problems during the development phase. The main objectives of this protocol are the following: use of common software packages used in normal NVH analysis in the company, minimum modification of NVH models and simplicity of pre/post-processing. This paper describes the main points of such a methodology. The core of the protocol has been implemented in ABAQUS by using a specific element of this solver as virtual contact sensor in the frequency domain simulation. TECHNICAL PAPER - 1. INTRODUCTION In recent years, with the improvement of the acoustic quality of vehicles and engines, other types of noises that normally were hidden by the usual noise of the engine and the rolling noise are now perceived by the occupants. Some of the most annoying ones are the small noises coming from the squeak and rattle of the interior trimmings, which in general have become an indicator of the quality and durability of the product. Squeak phenomenon is caused by the relative movement between two components that slip and stick alternatively. The elastic deformation of the surfaces in contact accumulates energy and this is released when the static friction overcomes the kinetic friction producing then an audible noise. The generation of this type of noise occurs at low frequencies (under 200 Hz) they are normally induced by energy inputs coming from the suspension system; however the release of the elastic energy produces the vibration of the adjacent surfaces causing contact audible noises in the range of 200 t Hz to 10000 Hz (Kavarana, 1999). Rattle noise is induced by impacts between parts; it is generated by the perpendicular relative movement between two parts, and is usually due to erroneous assembly tolerances or to lack of stiffness. The impacts will only generate noise if the adjacent surfaces to the impact point are capable of radiating audible sound-power levels (Kavarana, 1999). Traditionally, automotive industry has been using physical testing to detect this kind of defects. Although this testing methodology is broadly accepted by industry standards, it has some issues that cause this to be not efficient enough:
• Tests are completely hardware dependent. A physical prototype is necessary for each kind of test.
• The detection and evaluation of these noises is done by testing engineers and normally they only point out if a rattle appears or not just by listening, as a consequence, these results have some degree of subjectivity
3rd ANSA & μETA International Conference September 9-11, 2009 Olympic Convention Centre, Porto Carras Grand Resort Hotel, Halkidiki Greece
• During the early design phase there are no prototypes, so it is not possible to objectively evaluate future issues of squeak and rattle. The modifications that can be made are limited, since the vehicle is almost finished and the modifications always consist of additions, with the corresponding price increase of the product.
• During the first test phase these squeak and rattle tests could have a low confidence ratio. The reason for this is basically due to the prototype itself. Some parts in these prototypes do not have the same fabrication process as the final part. For example, a plastic part could be made using rapid prototyping instead of a traditional injection mould, this means that this part may not have exactly the same behavior as the final one.
Taking all this into account, it was considered that a simple methodology based on the Finite Element Method to assess the S&R behavior during the development process of the vehicle (before prototyping) could be very helpful in the avoidance of S&R problems during the validation phases. However, squeak and rattle phenomena can be a big challenge for simulation. It is a vibratory phenomenon and therefore dynamics simulation in the time or frequency domain is needed. Besides it is a contact phenomenon and for this reason non-linear simulations are also needed. Detection of S&R means then, that contact detection and tangential sliding must be simulated in a wide frequency range, and in consequence, a huge volume of data for the postprocess can be generated. Methods based on the frequency domain don’t allow the use of contacts and therefore alternative ways of simulation must be considered. To achieve this goal a first methodology based on a frequency domain analysis is proposed. This methodology allows the analyst to detect the most probable areas of generating squeak or rattle and study possible countermeasures in the design in order to avoid this problem from the beginning.
3rd ANSA & μETA International Conference September 9-11, 2009 Olympic Convention Centre, Porto Carras Grand Resort Hotel, Halkidiki Greece
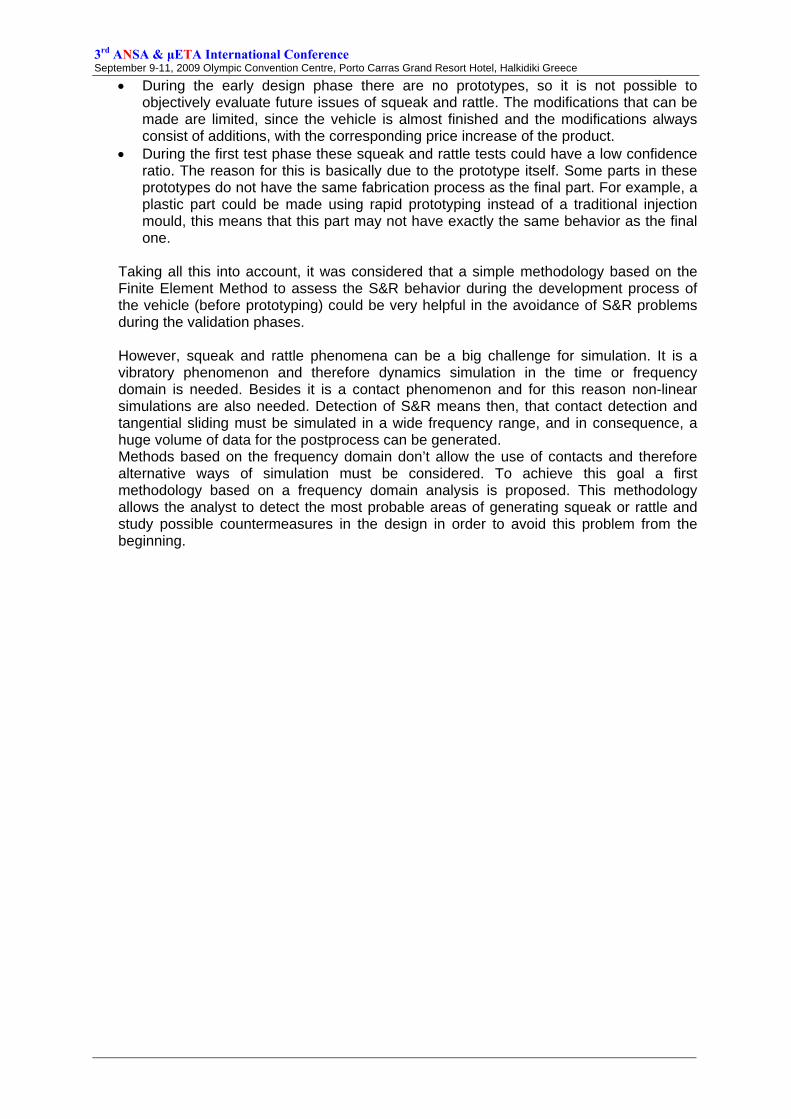
1. FEM METHODOLOGY The philosophy of the developed methodology is shown in the following workflow:
Results analysis
FE Model
FE Model
Virtual sensor automatic generationConnector local directions
Gap between parts
Analysis
Modal analysis
Modal superpositionRelative amplitude displacement
Results generation
Analysis of problematic frequencies Analysis of problematic areas
Squeak and rattle detection
2D Plot: maximum interference (f) 3D Plot: vectorial visualization of the interference
20 40 60 80 100
Frequency (Hz)
Max
imum
pen
etra
tion
(mm
)
Figure 1 – FEM Methodology
3rd ANSA & μETA International Conference September 9-11, 2009 Olympic Convention Centre, Porto Carras Grand Resort Hotel, Halkidiki Greece
2. FE MODEL As a first step a traditional NVH FE Model is created. This kind of model is normally used during the development process of the component. The unique peculiarity of this model is the addition of ‘virtual sensors’. These sensors will be responsible for measuring the relative displacement between two parts. The whole contact detection process is carried out by the virtual sensors, as a consequence, their location in the FE model must be done carefully in order to include all the areas that could produce squeak or rattle. The areas of interest can be selected by a sphere of influence, whose radius is determined from the clearances of the structure and allowable maximum displacements. The contact detection is done through the element connector of ABAQUS. This element is able to measure the relative displacement between its two defining nodes. NVH simulation is normally done in the frequency domain analysis and therefore the result produced by the connector is a frequency function representing the relative displacement between the contacting parts. These results are stored by ABAQUS in its complex form, so the results can be outputted in real and imaginary parts or in magnitude and phase complex forms. The definition of a sample connector used as a sensor is as follows:
*ELEMENT, TYPE=CONN3D2, ELSET=elset name Element number, node a, node b
…
*CONNECTOR SECTION, ELSET=elset name BUSHING,
orientation 1, orientation 2
…
*ORIENTATION, NAME=Orientation 1, DEFINITION=COORDINATES, SYSTEM=RECTANGULAR
X-coordinate of point a, …
As can be seen above, the connector is a two node element, where each node is connected to one part of the model. The connector section is defined as BUSHING. This type of connector provides a connection between two nodes that allows independent behavior in three local Cartesian directions that follow the system at both nodes a and b. This means that in the example connector it is possible to compute three amplitudes expressed in three local Cartesian directions:
• Displacement amplitudes expressed in local directions 1 and 2, which are tangential to the connector.
• Displacement amplitude expressed in local direction 3, which is coincident with the axis of the connector itself.
3rd ANSA & μETA International Conference September 9-11, 2009 Olympic Convention Centre, Porto Carras Grand Resort Hotel, Halkidiki Greece
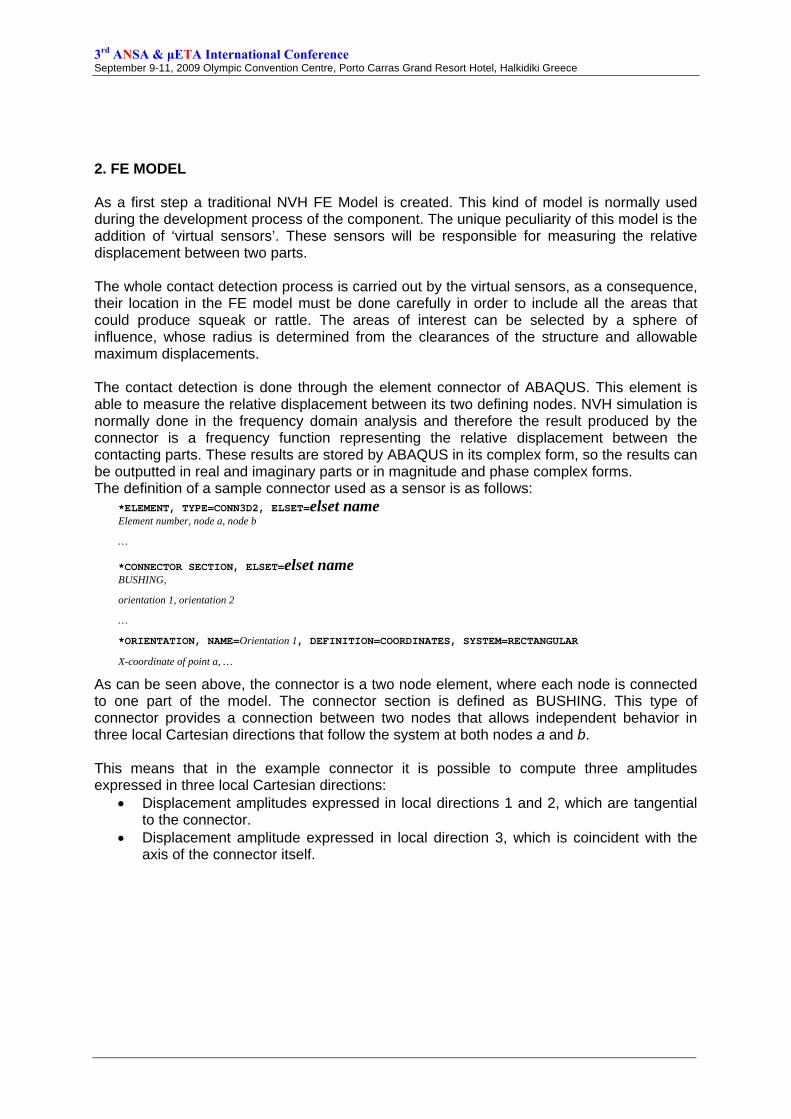
Figure 2 –Virtual sensors connecting two parts. As can be seen in Figure 2 –Virtual sensors connecting two parts., the virtual sensors connect two parts using a connector element. These elements must be located at every area where a squeak or rattle can be generated. This process can be done manually (as far as only connector elements should be added to the FE model) or automatically. In the present case a script has been developed which is able to automatically locate the areas where sensors could be needed on the model, making the pre process much faster and easier. 2. VIRTUAL SENSOR AUTOMATIC GENERATION As can be seen above the key of this methodology is the connector element. Such elements must be placed accordingly to the detection strategy in the FEM model, in order to allow a reliable detection of the Squeak & Rattle phenomena. A great quantity of virtual sensors could be needed depending on the part to be analysed; for example, in a typical instrument panel more than 20.000 connectors have to been placed. Such a large quantity of elements can not be created and placed manually, so an automated process has been developed. The virtual sensor automatic generation is done by a script done in ANSA.
3rd ANSA & μETA International Conference September 9-11, 2009 Olympic Convention Centre, Porto Carras Grand Resort Hotel, Halkidiki Greece
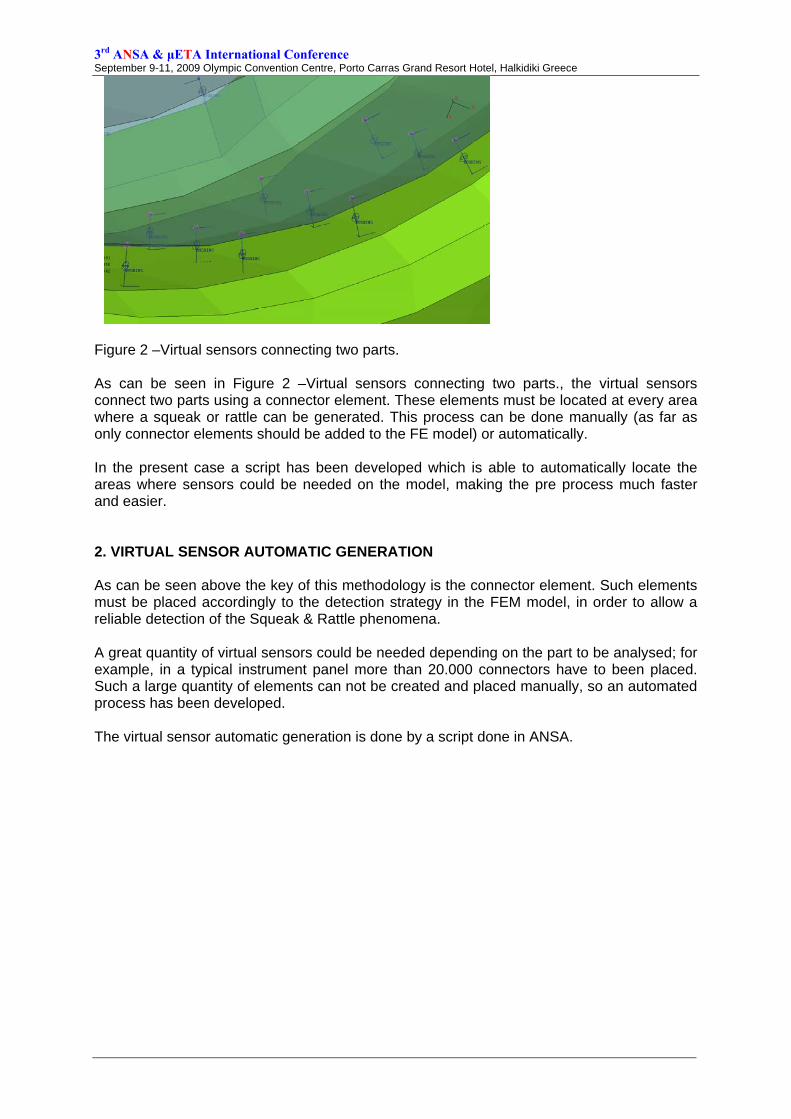
Figure 3 –Interface of the script. The main functions performed by this script are:
- Detect those areas susceptible to S&R - Create the connectors. Two types of connectors could be created, depending on the
type of area where the connectors have to be placed: o Face To Face connectors: such connectors are placed when two elements
(faces) are normal one to each other or the angle formed by its normal is below a specified value.
o Free Edge connectors: these connectors are used for detecting contact between an edge and another part in the FEM model.
- Attach the element connectors to the FEM model using TIE contacts. - Assign a local coordinate system to each connector in a way that the Z axis is parallel
to the axial direction of the Connector. - Export all the relevant data of the newly created connectors for its use during the
postprocessing. In the near future, the creation of the connectors would be done using a built-in function inside ANSA, so there will be no need to use this script and the virtual sensor could be created directly in ANSA using its own integrated functionalities.
3rd ANSA & μETA International Conference September 9-11, 2009 Olympic Convention Centre, Porto Carras Grand Resort Hotel, Halkidiki Greece
3. FREQUENCY-DOMAIN ANALYSIS As a second step a natural frequency extraction is performed. In this analysis all the natural frequencies and its mode shapes are extracted in a frequency range of interest. The frequency range of interest used in the modal analysis must be larger than the frequency range object of the study itself to avoid modal truncation. The modal superposition is used to calculate the steady-state dynamic linearized response of the model to harmonic excitation. This kind of calculation can not use contacts. Therefore, using the virtual sensor it is possible to track the steady-state amplitude of the movement relative to the two parts which the sensor is connected for each value of frequency in the range of study. In other words, it will be possible to study the resulting penetration between parts for each frequency. This value of penetration is the key to evaluating the chance of squeak or rattle. 4. RESULTS ANALYSIS The last step is the post processing. As mentioned before, the virtual sensors provide the amplitude of movement between two parts. Nevertheless, this value by itself alone has no valuable information for the final objective. The chance of squeak or rattle is not determined by the value of amplitude alone. The value of penetration must be calculated to do so. As mentioned above, each connector has three local directions. In this particular case, direction 3 is defined coincident with the connector’s axis. The value of penetration is given by: Value of penetration= Amplitude in direction 3 – Real gap between parts
Where: Amplitude direction 3: is the displacement amplitude outputted by ABAQUS for this connector in particular. Real gap between parts: is the gap between both parts, calculated as the difference of the length of the connector minus the sum of both half-thicknesses
The value of penetration gives an idea of the chance of rattle, at higher values of penetration higher chance of rattle. On the other hand, the chance of squeak depends on the amplitude in directions 1 and 2, and on the chance of rattle as well. Squeak is generated sliding two surfaces, so some pressure between them is necessary. This value of pressure is related with the possibility of rattle, in other words, in order to compute a value of squeak it is a requisite to have a positive value of penetration and a certain tangential movement. In the case of the squeak phenomenon there are other factors that determine this noise, for example the type of materials, the value of friction or surface finish. At this point, it must be noticed that the magnitude or the noise by itself is not being evaluated, only a chance of producing this kind of issue is being detected (qualitative result). Both results, chance of squeak and rattle, are automatically calculated using scripting and stored in a results file for graphical post processing.
3rd ANSA & μETA International Conference September 9-11, 2009 Olympic Convention Centre, Porto Carras Grand Resort Hotel, Halkidiki Greece
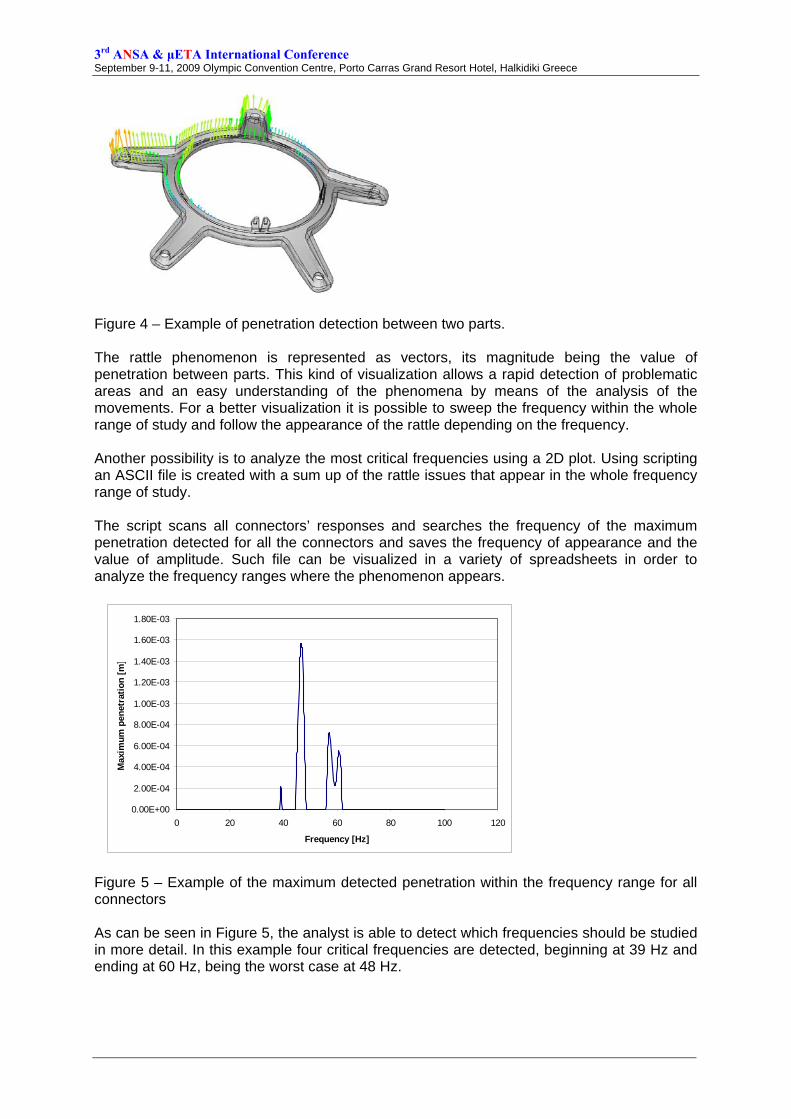
Figure 4 – Example of penetration detection between two parts. The rattle phenomenon is represented as vectors, its magnitude being the value of penetration between parts. This kind of visualization allows a rapid detection of problematic areas and an easy understanding of the phenomena by means of the analysis of the movements. For a better visualization it is possible to sweep the frequency within the whole range of study and follow the appearance of the rattle depending on the frequency. Another possibility is to analyze the most critical frequencies using a 2D plot. Using scripting an ASCII file is created with a sum up of the rattle issues that appear in the whole frequency range of study. The script scans all connectors’ responses and searches the frequency of the maximum penetration detected for all the connectors and saves the frequency of appearance and the value of amplitude. Such file can be visualized in a variety of spreadsheets in order to analyze the frequency ranges where the phenomenon appears.
0.00E+00
2.00E-04
4.00E-04
6.00E-04
8.00E-04
1.00E-03
1.20E-03
1.40E-03
1.60E-03
1.80E-03
0 20 40 60 80 100 120
Frequency [Hz]
Max
imum
pen
etra
tion
[m]
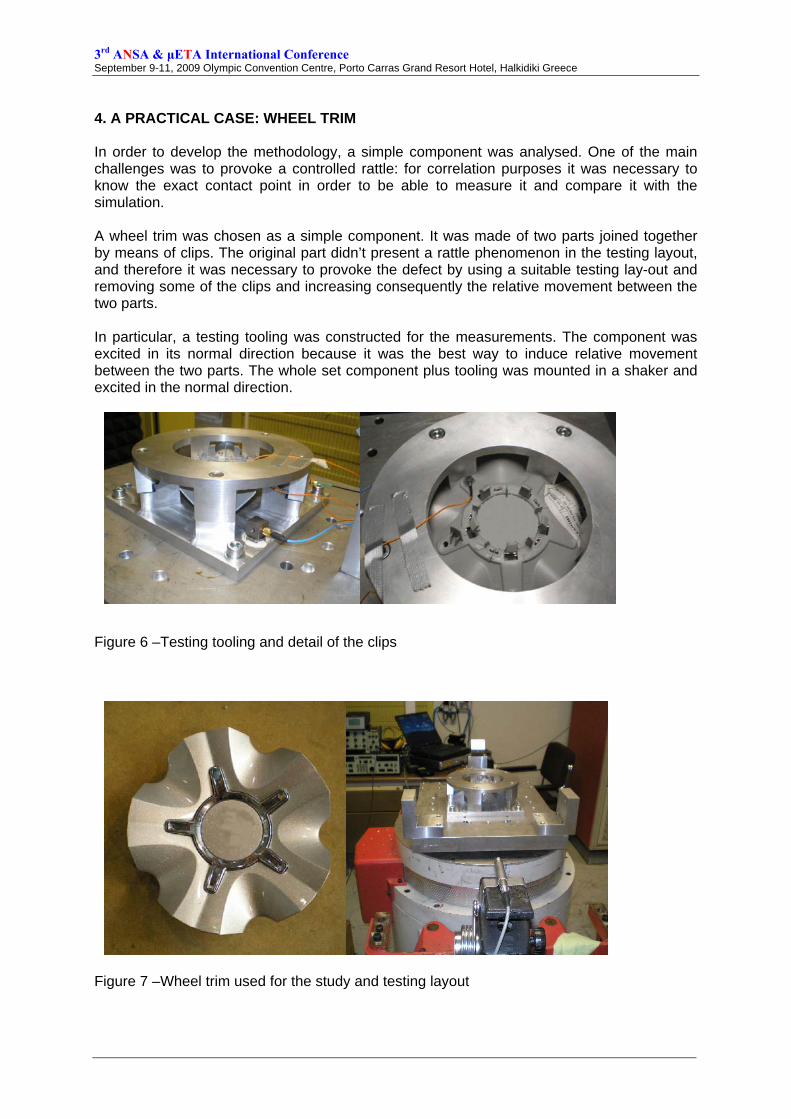
Figure 5 – Example of the maximum detected penetration within the frequency range for all connectors As can be seen in Figure 5, the analyst is able to detect which frequencies should be studied in more detail. In this example four critical frequencies are detected, beginning at 39 Hz and ending at 60 Hz, being the worst case at 48 Hz.
3rd ANSA & μETA International Conference September 9-11, 2009 Olympic Convention Centre, Porto Carras Grand Resort Hotel, Halkidiki Greece
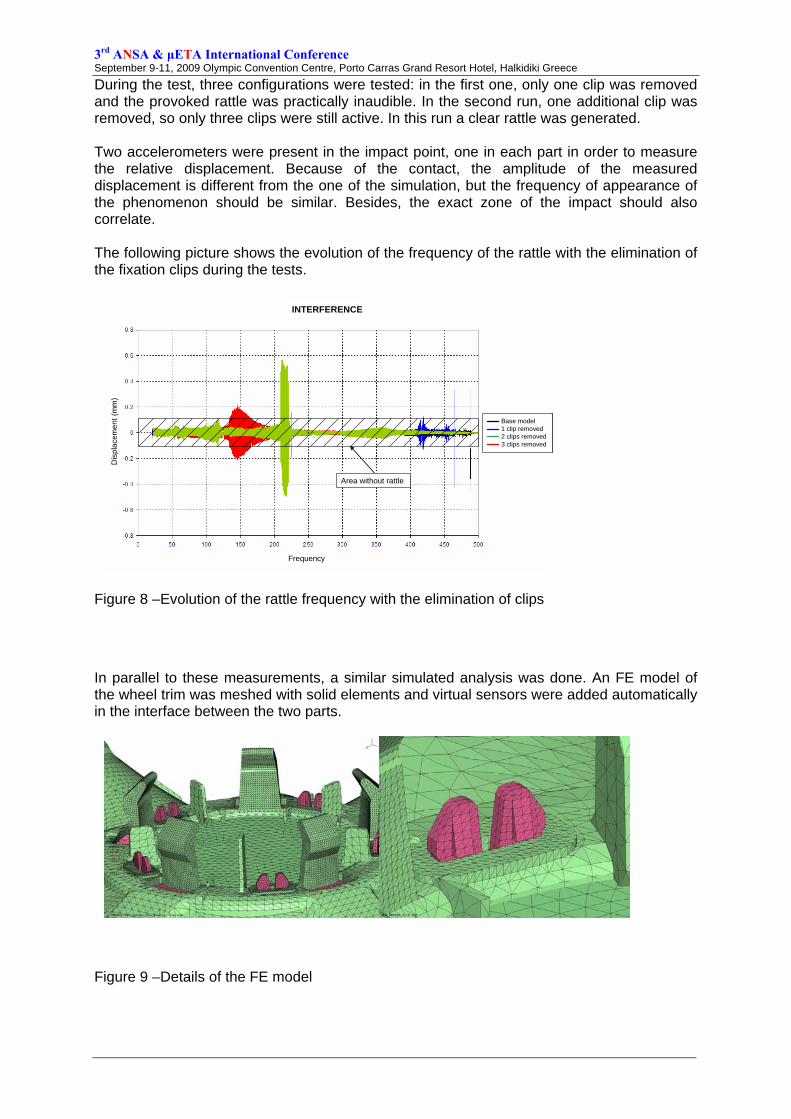
4. A PRACTICAL CASE: WHEEL TRIM In order to develop the methodology, a simple component was analysed. One of the main challenges was to provoke a controlled rattle: for correlation purposes it was necessary to know the exact contact point in order to be able to measure it and compare it with the simulation. A wheel trim was chosen as a simple component. It was made of two parts joined together by means of clips. The original part didn’t present a rattle phenomenon in the testing layout, and therefore it was necessary to provoke the defect by using a suitable testing lay-out and removing some of the clips and increasing consequently the relative movement between the two parts. In particular, a testing tooling was constructed for the measurements. The component was excited in its normal direction because it was the best way to induce relative movement between the two parts. The whole set component plus tooling was mounted in a shaker and excited in the normal direction.
Figure 6 –Testing tooling and detail of the clips
Figure 7 –Wheel trim used for the study and testing layout
3rd ANSA & μETA International Conference September 9-11, 2009 Olympic Convention Centre, Porto Carras Grand Resort Hotel, Halkidiki Greece
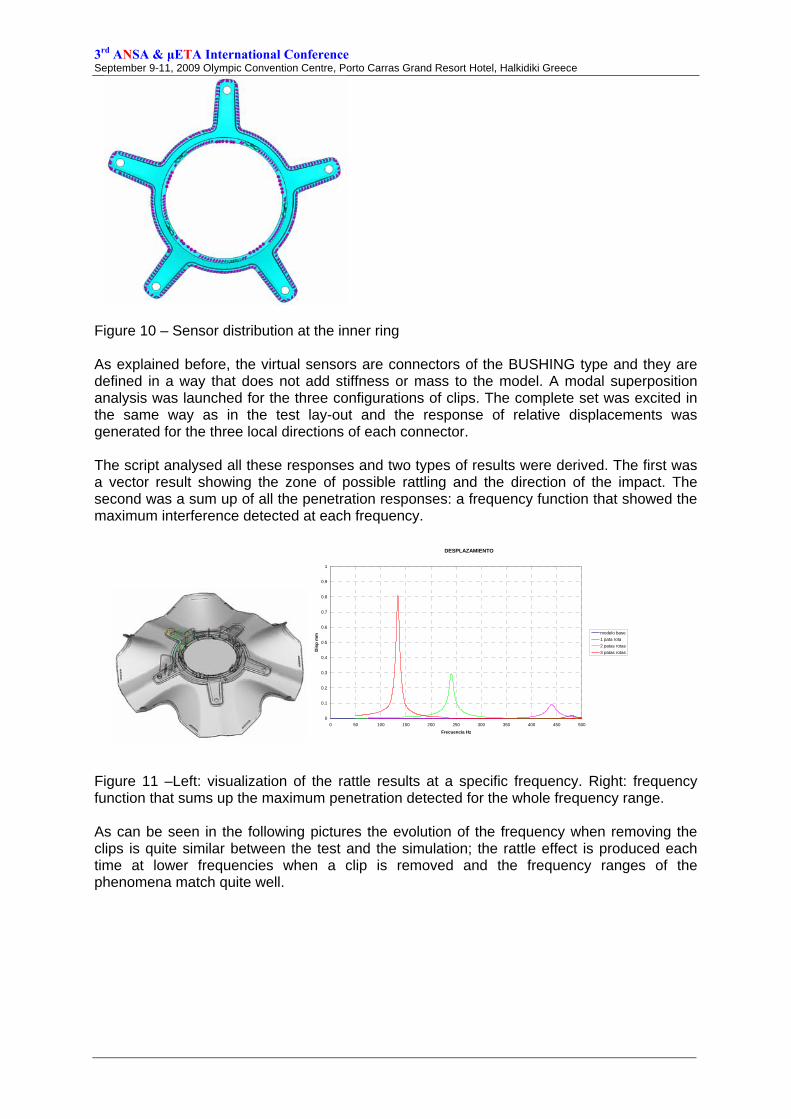
During the test, three configurations were tested: in the first one, only one clip was removed and the provoked rattle was practically inaudible. In the second run, one additional clip was removed, so only three clips were still active. In this run a clear rattle was generated. Two accelerometers were present in the impact point, one in each part in order to measure the relative displacement. Because of the contact, the amplitude of the measured displacement is different from the one of the simulation, but the frequency of appearance of the phenomenon should be similar. Besides, the exact zone of the impact should also correlate. The following picture shows the evolution of the frequency of the rattle with the elimination of the fixation clips during the tests.
Frequency
Dis
plac
emen
t(m
m)
INTERFERENCE
Base model1 clip removed2 clips removed3 clips removed
Area without rattle
Frequency
Dis
plac
emen
t(m
m)
INTERFERENCE
Base model1 clip removed2 clips removed3 clips removed
Area without rattle
Figure 8 –Evolution of the rattle frequency with the elimination of clips
In parallel to these measurements, a similar simulated analysis was done. An FE model of the wheel trim was meshed with solid elements and virtual sensors were added automatically in the interface between the two parts.
Figure 9 –Details of the FE model
3rd ANSA & μETA International Conference September 9-11, 2009 Olympic Convention Centre, Porto Carras Grand Resort Hotel, Halkidiki Greece
Figure 10 – Sensor distribution at the inner ring As explained before, the virtual sensors are connectors of the BUSHING type and they are defined in a way that does not add stiffness or mass to the model. A modal superposition analysis was launched for the three configurations of clips. The complete set was excited in the same way as in the test lay-out and the response of relative displacements was generated for the three local directions of each connector. The script analysed all these responses and two types of results were derived. The first was a vector result showing the zone of possible rattling and the direction of the impact. The second was a sum up of all the penetration responses: a frequency function that showed the maximum interference detected at each frequency.
DESPLAZAMIENTO
0
0.1
0.2
0.3
0.4
0.5
0.6
0.7
0.8
0.9
1
0 50 100 150 200 250 300 350 400 450 500
Frecuencia Hz
Dis
p m
m modelo base1 pata rota2 patas rotas3 patas rotas
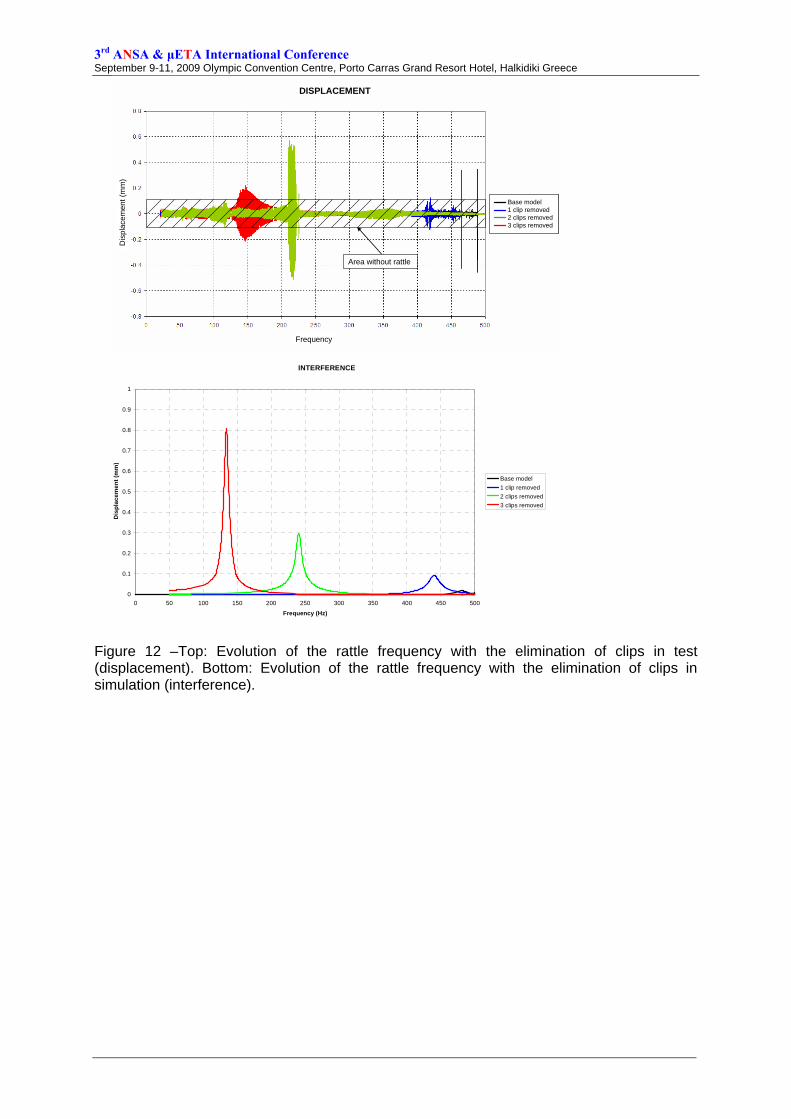
Figure 11 –Left: visualization of the rattle results at a specific frequency. Right: frequency function that sums up the maximum penetration detected for the whole frequency range. As can be seen in the following pictures the evolution of the frequency when removing the clips is quite similar between the test and the simulation; the rattle effect is produced each time at lower frequencies when a clip is removed and the frequency ranges of the phenomena match quite well.
3rd ANSA & μETA International Conference September 9-11, 2009 Olympic Convention Centre, Porto Carras Grand Resort Hotel, Halkidiki Greece
Frequency
Dis
plac
emen
t(m
m)
DISPLACEMENT
Base model1 clip removed2 clips removed3 clips removed
Area without rattle
Frequency
Dis
plac
emen
t(m
m)
DISPLACEMENT
Base model1 clip removed2 clips removed3 clips removed
Area without rattle
INTERFERENCE
0
0.1
0.2
0.3
0.4
0.5
0.6
0.7
0.8
0.9
1
0 50 100 150 200 250 300 350 400 450 500
Frequency (Hz)
Dis
plac
emen
t (m
m)
Base model1 clip removed2 clips removed3 clips removed
Figure 12 –Top: Evolution of the rattle frequency with the elimination of clips in test (displacement). Bottom: Evolution of the rattle frequency with the elimination of clips in simulation (interference).
3rd ANSA & μETA International Conference September 9-11, 2009 Olympic Convention Centre, Porto Carras Grand Resort Hotel, Halkidiki Greece
4. CONCLUSIONS AND FUTURE WORK The methodology presented has demonstrated that it can be used for S&R detection with relative confidence. The addition of the virtual sensors is fairly simple and this makes us think that this methodology can be included in the normal simulation protocols of the automotive world. The main assumption of the method is that the NVH model is correlated enough with the reality. At present, the methodology is being tested in more complicated components, as for example a complete cockpit. The future lines to develop are:
• Implementation of an S&R index that gives a general measure of how problematic the component is.
• Refine the methodology for squeak in order to take into account material compatibility.
4. REFERENCES (1) El-Essawi, M.., Lin, J. Z, Sobek, G., Naganarayana, B.P. and Shankar, S., “Analytical
Predictions and Correlation With Physical Tests for Potential Buzz, Squeak, and Rattle Regions in a Cockpit Assembly”, Society of American Engineers International, Detroit, Michigan, March 8-11,2004
(2) Naganarayana, B.P. and Shankar, S., Battachar, V. S., Brines, R.S. and Rao, s. , “N-
hance: Software for identification of critical BSR locations in automotive assemblies using finite element models”, SAE paper 03NVC-283, Noise & Vibration Conference, Traverse City, Michigan, May 5-8, 2003.
4. ACKNOWLEDGEMENTS The authors gratefully acknowledge Zanini for giving all the necessary information for the present work. They also acknowledge Pau Cruz for his brilliant idea regarding the use of connectors as a contact detector.


![arXiv:1504.04338v1 [math.CV] 16 Apr 2015 · arXiv:1504.04338v1 [math.CV] 16 Apr 2015 BOUNDARY MULTIPLIERS OF A FAMILY OF MOBIUS INVARIANT FUNCTION¨ SPACES GUANLONG BAO AND JORDI](https://static.fdocument.org/doc/165x107/5f7b4fff8c891c00121fec72/arxiv150404338v1-mathcv-16-apr-2015-arxiv150404338v1-mathcv-16-apr-2015.jpg)