Molecular Genetic study of β–thalassemia minor syndrome
116
Ministry of Higher Education and Scientific Research AL – Nahrain University College of Science Molecular Genetic study of β–thalassemia minor syndrome A thesis Submitted to the College of Science, Al –Nahrain University in Partial Fulfillment of Requirements for the Degree of Master of Science in Biotechnology By Ruqaya Hazim Abdulateef Al –Izzi B.Sc. Biotechnology, College of Science, 2004 Al – Nahrain University Supervision by Prof. Dr. Mohammed A. Ibrahim Dr. Abdul Basit N. Jassim October 2007 Shawal 1428
Transcript of Molecular Genetic study of β–thalassemia minor syndrome
Ministry of Higher Education and Scientific Research AL – Nahrain University College of Science
Molecular Genetic study of β–thalassemia minor
syndrome
A thesis
Submitted to the College of Science, Al –Nahrain University
in Partial Fulfillment of Requirements for the Degree of
Master of Science in Biotechnology
By
Ruqaya Hazim Abdulateef Al –Izzi
B.Sc. Biotechnology, College of Science, 2004
Al – Nahrain University Supervision by
Prof. Dr. Mohammed A. Ibrahim
Dr. Abdul Basit N. Jassim
October 2007
Shawal 1428
الاھداء ...لانھا الاوفى والاعز.....تاج الشرق ومملكة العصور....الى ارض عظیمة انجبتني
....ومرافئ الشمس......ارتقیا مراتب الذرىالى من
...أبي و أمي.....مناران اضاءا في لیل طویل
اجلالا واكراما
فیھ تصبمن قلبي ل تنبع انھارالى
حبا و عذوبة تغرقنيف.....في كل الفصول تفیض اسراءاخواتي زینب و
وعمتي سمیرة واخي صفاء
جزء من معرفتھما ولایزالان یعطیاني اعطوني...كبار....الى معلمي الكبار
عبد الباسط نصیف. محمد عبد القادر و د. د.أ
حثبالى من كانو الالھام لاكمال ھذا ال
المرضى وعوائلھم
الى من كانو نبراسا یضئ طریقي
الیھم جمیعا
لعلھا یوما تصاغ قلائد وفاء .....انثر جھدي المتواضع ھذا حبات من الدر على طول شاطئ عمري لھم
رقية
Acknowledgment
Praise to God the glorious creator of the universe, and praise upon
Mohammad his Prophet and upon his Family.
I would like to express my faithful thanks to my supervisors, Prof. Dr.
Mohammad A –K Ibrahim and Dr. Abdul –Basit N. Jassim for their support,
encouragement, and useful advices that they provided during this research.
My gratitude and thanks to Dr. Fa'eza, Dr. Arkan, Dr. Maisa'a, Mr. Alaa,
Miss. Iklass, Miss.Amena, Mrs. Nahla, Mrs. Entisar, Central Public Health
Laboratory for their great help and cooperation.
Thanks to Mr.Mudafar, Dr.Abdul Hadi, Central Public Health Laboratory for
their great help and cooperation.
Faithful thanks to Mrs. Rawa'a and all staff of Molecular Biology
Department, Al –Nahrain Center of Biotechnology Research for their help
that they provided during the work.
List of contents
No.
Subject
Page no.
Chapter one Introduction and Literature review 1. 1.1 Introduction 1
2. 1.2 Literature review 4
3. 1.2.1 Thalassemia 4
4. 1.2.1.1 Definition and History 4
5. 1.2.2 Structure of hemoglobin 6
6. 1.2.3Hemoglobin types 6
7. 1.2.4 Globin operon 9
8. 1.2.4.1 Structure of β-globin gene cluster 9
9. 1.2.5 Clinical syndromes of thalassemia 12
10. 1.2.5.1 Different forms of thalassemia 13
11. 1.2.5.2 Alpha –thalassemia 14
12. 1.2.5.2.1 Distribution and classification 14
13. 1.2.5.3 δ – thalassemia 15
14. 1.2.5.4 δβ –thalassemia 16
15. 1.2.5.5 β –thalassemia 16 16. 1.2.5.5.1 Types of β –thalassemia 16 17. 1.2.5.5.2 β- thalassemia major 16
18. 1.2.5.5.3 β- thalassemia intermedia
17
19. 1.2.5.5.4 β- thalassemia minor 17
20. 1.2.5.6 Diagnosis of β –thalassemia trait 20
I
21. 1.2.5.7 Clinical features of β –thalassemia trait 21
22. 1.2.6 Molecular basis of thalassemia 22
23. 1.2.6.1 Gene deletion 24
24. 1.2.6.2 Mutations to termination codons 24
25. 1.2.6.3 RNA processing mutation 25
26. 1.2.6.4 Transcriptional mutations 25
27. 1.2.7 Prenatal diagnosis of β –thalassemia syndromes by
PCR
26
28. 1.2.8 Prevention
27
Chapter two materials and methods
29. 2.1 Materials 29
30. 2.1.1 Apparatus 29
31. 2.1.2 Chemicals 30 32. 2.1.3 Blood samples collection 30
33. 2.1.4 Buffers and solutions 30
34. 2.1.4.1 Estimation of HbA2 30
35. 2.1.4.1.1 Barbitone buffer (pH 8.9) 31
36. 2.1.4.1.2 Tris (pH 8.9) 31
37. 2.1.4.1.3 Lysate solution 31
38. 2.1.4.1.4 Normal saline 31
39. 2.1.4.2 Hb electrophoresis by cellulose acetate paper 32
40. 2.1.4.2.1 Barbitone buffer pH 8.6 32
41. 2.1.5 Hb electrophoresis by agarose gel ( HYDRAGEL HEMOGLOBIN (E) K20 KIT)
32
42. 2.1.5.1 Lysate solution
32
II
52. 2.1.7 Hb analysis by variant β- thalassemia short program
35
53.
2.1.8 Leishman stain
35
54. 2.1.9 Isolation of DNA from whole blood (AB ANALYTICA kit)
35
55. 2.1.10. PCR amplification 36
56. 2.1.10.1 Primers 36
57. 2.1.10.2 (10X) PCR buffer 36
58. 2.1.10.3 dNTPs mixture 36
59. 2.1.10.4 Taq polymerase 37
60. 2.1.10.5 Bsu 361 37
61. 2.2 Methods 37
62. 2.2.1 Sterilization methods 37
43. 2.1.5.2 Agarose gel 33
44. 2.1.5.3 Tris –barbital buffer 33
45. 2.1.5.4 Working solution for electrophoresis 33
46. 2.1.5.5 Amidoblack stain 33 47. 2.1.5.6 Staining solution diluent 33
48. 2.1.5.7 Destaining solution 33
49. 2.1.5.8 Hemolyzing solution 34
50. 2.1.5.9 Fixative solution 34
51. 2.1.6 MS9 devise (automatic full digital cell counter) (BIO – RAD)
35
III
63. 2.2.2 Preparation of Hb electrophoresis by cellulose acetate
paper 37
64. 2.2.3 Estimation of HbA2
38
65. 2.2.4 Preparation of blood film on slides 39
66. 2.2.5 Variant beta thalassemia short program 39
67. 2.2.5.1 Specimens collection 39
68.
2.2.5.2 Sample preparation and analysis 39
69.
2.2.6 Preparation of Hb electrophoresis by agarose gel 39
70.
2.2.6.1 Sample preparation 40
71. 2.2.6.2 Procedure 40
72. 2.2.7 MS9 (automatic full digital cell counter) 42
73. 2.2.7.1 Principle 42
74. 2.2.8 DNA isolation from whole blood (AB ANALYTICA company)
43
Chapter three results and discussion
77. 3.1 Pedigree analysis of families showing β –thalassemia
syndrome
46
78. 3.2 Hematological analysis of β -thalassemia 53
75. 2.2.9 PCR amplification 44
76. 2.2.10 Restriction analysis 45
IV
79. 3.2.1 Complete blood picture (blood count and film) 53
80. 3.2.2 Red blood cells indices in β –thalassemia 59
81. 3.2.3 Hemoglobin abnormality 62
82. 3.2.3.1 hemoglobin analysis by cellulose acetate
electrophoresis
64
83. 3.2.3.2 Hemoglobin analysis by agarose gel electrophoresis 69
84. 3.2.3.3 Hemoglobin analysis by High Performance Liquid Chromatography (HPLC)
71
85. 3.3 β –globin chain analysis using Polymerase Chain Reaction (PCR)
75
86. Conclusions 83
87. Recommendations 84
88. References 85
V
List of Figures
No. Figure Page
1. Structural organization of the globin gene cluster 11
2. PCR process in which target DNA is amplified 26
3. The MS9 principle 43
4. Pedigree analysis of the first case 47
5. Pedigree analysis of the second case 48
6. Pedigree analysis of the third case 49
7. Pedigree analysis of the fourth case 50
8. Pedigree analysis of the fifth case 51
9. Pedigree analysis of the sixth case 52
10. Microscopic photograph (x400) of blood film taken from the mother
who is β –thalassemia minor
54
11. microscopic photograph (x 400) of blood film taken from the father
who is β –thalassemia minor
55
12. Microscopic photograph (x1000) of blood film taken from the
mother who is β –thalassemia minor
56
13. Microscopic photograph (x400) of blood film taken from the patient
who is β –thalassemia major
57
14. Microscopic photograph (x1000) of blood film taken from the
patient who is β –thalassemia major
58
15. Hemoglobin electrophoresis by cellulose – acetate paper 66
16. Hemoglobin electrophoresis by cellulose –acetate paper 67
17. Hemoglobin electrophoresis by cellulose –acetate paper, shows the
HbA2 hemoglobin elution from HbA hemoglobin.
68
VII
18.
Hemoglobin electrophoresis using agarose gel
70
19. Hb separation by HPLC of β –thalassemia minor (father) 72
20. Hb separation by HPLC of β –thalassemia minor (mother) 73
21. Hb separation by HPLC of β –thalassemia major (child) 74
22. PCR amplification of beta-globin DNA of normal healthy
individual
77
23. PCR amplification of the first family showing β –thalassemia
syndrome.
78
24. PCR amplification of the second family showing β –thalassemia
syndrome
79
25. Restriction analysis of the first family 80
26. Restriction analysis of the second family 81
27. Restriction analysis of the third family 82
VIII
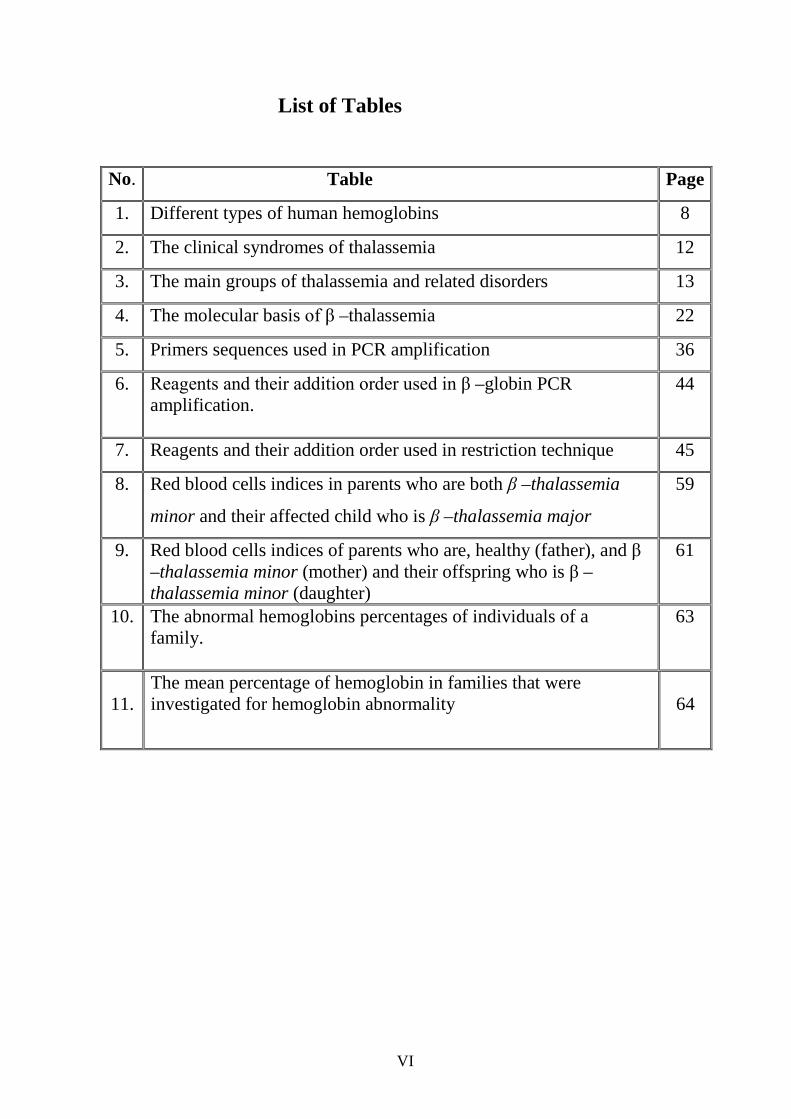
List of Tables
No. Table Page
1. Different types of human hemoglobins 8
2. The clinical syndromes of thalassemia 12
3. The main groups of thalassemia and related disorders 13
4. The molecular basis of β –thalassemia 22
5. Primers sequences used in PCR amplification 36
6. Reagents and their addition order used in β –globin PCR amplification.
44
7. Reagents and their addition order used in restriction technique 45
8. Red blood cells indices in parents who are both β –thalassemia
minor and their affected child who is β –thalassemia major
59
9. Red blood cells indices of parents who are, healthy (father), and β –thalassemia minor (mother) and their offspring who is β –thalassemia minor (daughter)
61
10. The abnormal hemoglobins percentages of individuals of a family.
63
11.
The mean percentage of hemoglobin in families that were investigated for hemoglobin abnormality
64
VI
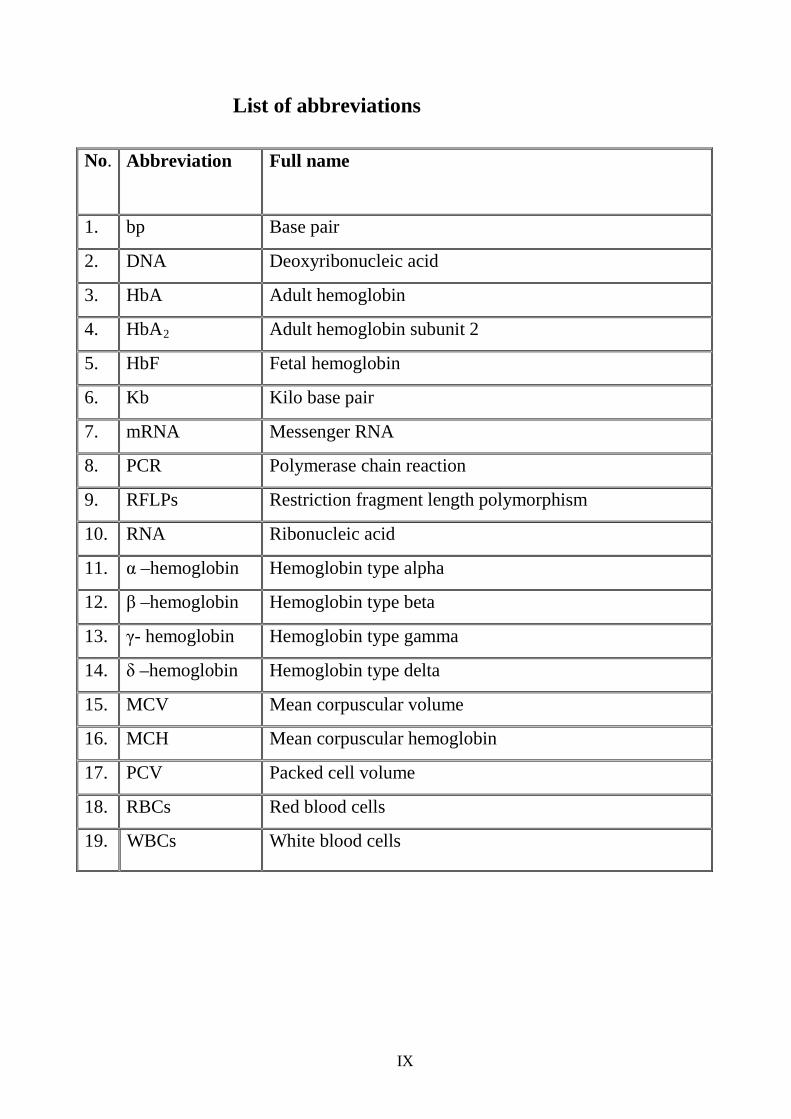
List of abbreviations
No. Abbreviation Full name
1. bp Base pair
2. DNA Deoxyribonucleic acid
3. HbA Adult hemoglobin
4. HbA2 Adult hemoglobin subunit 2
5. HbF Fetal hemoglobin
6. Kb Kilo base pair
7. mRNA Messenger RNA 8. PCR Polymerase chain reaction
9. RFLPs Restriction fragment length polymorphism
10. RNA Ribonucleic acid
11. α –hemoglobin Hemoglobin type alpha
12. β –hemoglobin Hemoglobin type beta
13. γ- hemoglobin Hemoglobin type gamma
14. δ –hemoglobin Hemoglobin type delta
15. MCV Mean corpuscular volume
16. MCH Mean corpuscular hemoglobin
17. PCV Packed cell volume
18. RBCs Red blood cells
19. WBCs White blood cells
IX
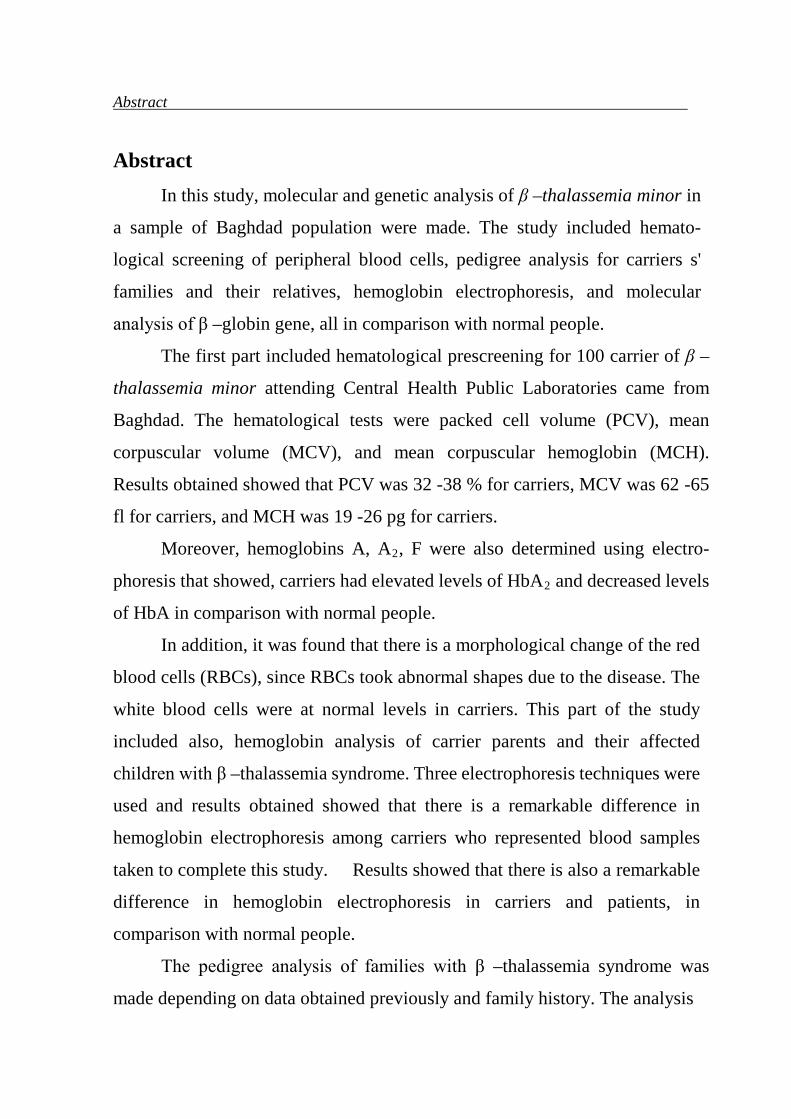
Abstract
Abstract In this study, molecular and genetic analysis of β –thalassemia minor in
a sample of Baghdad population were made. The study included hemato-
logical screening of peripheral blood cells, pedigree analysis for carriers s'
families and their relatives, hemoglobin electrophoresis, and molecular
analysis of β –globin gene, all in comparison with normal people.
The first part included hematological prescreening for 100 carrier of β –
thalassemia minor attending Central Health Public Laboratories came from
Baghdad. The hematological tests were packed cell volume (PCV), mean
corpuscular volume (MCV), and mean corpuscular hemoglobin (MCH).
Results obtained showed that PCV was 32 -38 % for carriers, MCV was 62 -65
fl for carriers, and MCH was 19 -26 pg for carriers.
Moreover, hemoglobins A, A2, F were also determined using electro-
phoresis that showed, carriers had elevated levels of HbA2 and decreased levels
of HbA in comparison with normal people.
In addition, it was found that there is a morphological change of the red
blood cells (RBCs), since RBCs took abnormal shapes due to the disease. The
white blood cells were at normal levels in carriers. This part of the study
included also, hemoglobin analysis of carrier parents and their affected
children with β –thalassemia syndrome. Three electrophoresis techniques were
used and results obtained showed that there is a remarkable difference in
hemoglobin electrophoresis among carriers who represented blood samples
taken to complete this study. Results showed that there is also a remarkable
difference in hemoglobin electrophoresis in carriers and patients, in
comparison with normal people.
The pedigree analysis of families with β –thalassemia syndrome was
made depending on data obtained previously and family history. The analysis
Abstract
showed the transfer of the trait among generations, especially in families
preferring marriage of relatives.
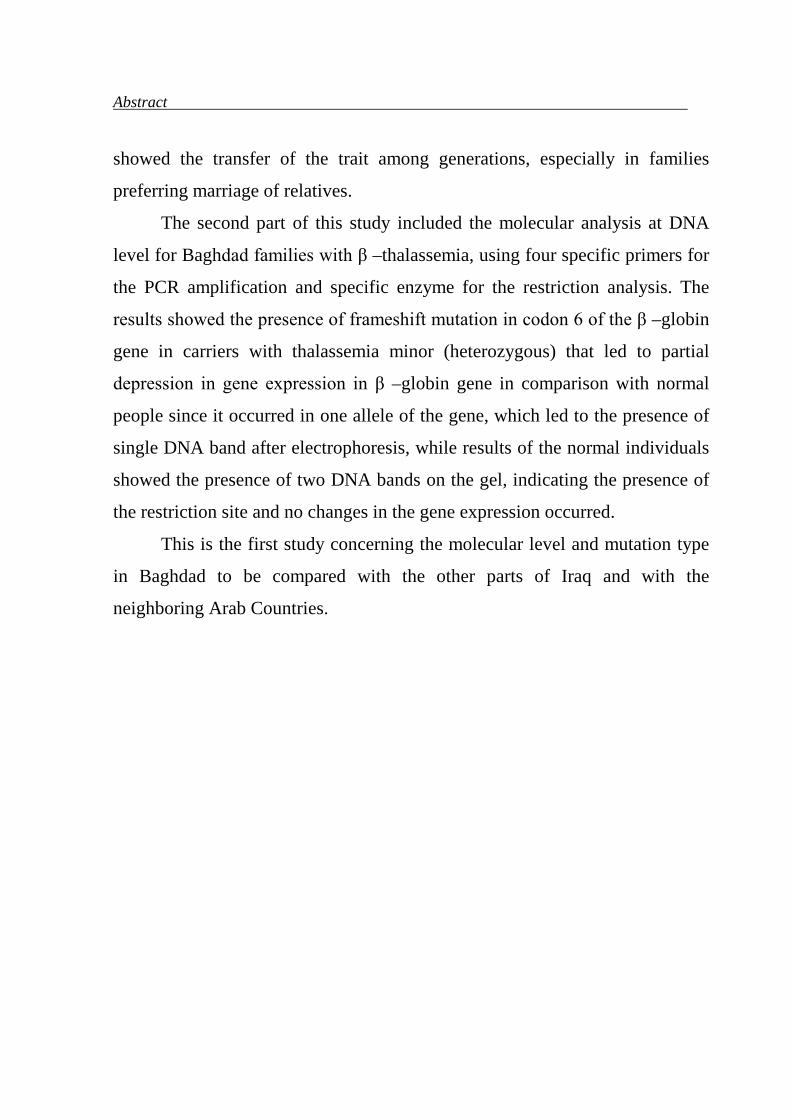
The second part of this study included the molecular analysis at DNA
level for Baghdad families with β –thalassemia, using four specific primers for
the PCR amplification and specific enzyme for the restriction analysis. The
results showed the presence of frameshift mutation in codon 6 of the β –globin
gene in carriers with thalassemia minor (heterozygous) that led to partial
depression in gene expression in β –globin gene in comparison with normal
people since it occurred in one allele of the gene, which led to the presence of
single DNA band after electrophoresis, while results of the normal individuals
showed the presence of two DNA bands on the gel, indicating the presence of
the restriction site and no changes in the gene expression occurred.
This is the first study concerning the molecular level and mutation type
in Baghdad to be compared with the other parts of Iraq and with the
neighboring Arab Countries.
Supervison Certificate
We certify that this thesis was prepared under our supervision, at the College
of Science, Al-Nahrain University in partial fulfillment of the requirement for
the Degree of Master of Science in Biotechnology.
In review of the available recommendation. I forward this for debate by the
examining committee.
Signature:
Name: Dr. Kadim M. Ibrahim.
Scientific Degree: Professor
Title: Head of the Biotechnology Department
Signature: Supevisor Dr. Abdul Basit N. Jassim Date:
Committee Certificate We, the examination committee, certify that we have read this thesis entitled"
Molecular Genetic study of β –thalassemia minor syndrome" and have
examined the student Ruqaya Hazim Abdulateef in its contents and what is
related to it, and in our opinion it meets the standard of the thesis for the
Degree of Master of Science in Biotechnology.
Signature: Signature:
Name: Prof.Dr.Waleed H.Yousif. Name:Dr.Salman A. Ahmed.
Title:Chairman Title: member
Date: Date:
Signature: Signature:
Name:Dr.Abdul Kareem Al-Kazaz. Name:Dr.Abdul Basit N. Jassim
Title: member Title: Supervisor
Date: Date:
Signature:
Name:Prof.Dr. Mohammed A. Ibrahim
Title: Supervisor
Approved by Dean of the College of Science, Al-Nahrain University.
Signature:
Name:Dr.Laith Abdul Al-Aziz Al-Ani
Scientific Degree: Assistant Professor
Title: Dean of College of Science.
Date:
Chapter one Introduction and literature review
1.1 Introduction Thalassemia is an inherited blood disorders combined with decrease in
the production of the protein (globin), and the globin protein itself is abnormal
(Losekoot et. al., 1991). The red cells morphology is abnormal, compromised
by smaller red cells "microcytic" and paler than normal "hypochromic". The protein part of the hemoglobin molecule is composed of two
different chains, alpha and beta, and either can be affected. There are over than
200 different mutations that can cause thalassemia (Kanavakis et. al., 1997).
However, they can be classified into two main groups: alpha and beta
thalassemia according to which of the two globin chains are affected
(Winichagoon et. al., 1993).
The most severe form is the alpha thalassemia, results in fetal or
newborn death, while β –thalassemia can be classified into three categories, the
very severe symptoms of anemia which is called β –thalassemia major, the
symptoms free and no effect on health which is called β –thalassemia minor,
and the β –thalassemia intermedia which is a case between the minor and
major types of this disease (Michiels and Giordano, 1996).Thalassemia minor
is defined as the most common form of thalassemia, and is also called
(thalassemia trait).
A person having thalassemia minor is defined as a carrier. Carriers may
cause no symptoms, but changes in blood do occur. Most carriers have
completely normal healthy lives (Antonio and Renzo, 2000), but children with
thalassemia major develop the disease symptoms within the first year of life,
and without treatment, health complications may lead to heart failure and
infection, in which both considered to be the major causes of death among
those untreated thalassemia major children (Yuregir et al., 1995).
1
Chapter one Introduction and literature review
Thalassemia intermedia is much severe than the thalassemia minor but
less severe than the thalassemia major, and children with thalassemia
intermedia may develop some of same complications conferred by thalassemia
major. All forms of thalassemia can not be caught from another individual who
has it, and transmitted only through heredity, so the disease is passed on
through parents who carry the globin gene disorder. A carrier has one normal
gene and one thalassemic gene in all body cells. When two carriers become
parents, there is a 25% chance of producing an affected child (thalassemia
major), 50% chance of producing a carrier child, and 25% chance of producing
a healthy child.
These ratios are the same for each pregnancy when both parents are
carriers (Wainscoat et al., 1983).
Measuring the red blood cell indices is important in the diagnosis of β –
thalassemia minor, which reveal microcytic hypochromic anemia.The
diagnosis also relies upon the hemoglobin analysis that reveals decreased
amounts of hemoglobin A (HbA) with increased HbA2 amounts of carriers in
comparison with normal values. Mutation analysis of β –globin gene is useful
in diagnosis of the most mutation types and also useful in testing all members
of a family, who are suspected to be thalassemic carriers, and in the prenatal
diagnosis (Olivieri and Nathan, 1994), on the other hand, mutations that alter
the β –globin gene are detected by several PCR –based procedures, but the
most commonly used methods are primer –specific amplification, with a set of
probes or primers complementary to the most mutations in the population from
which the individual originated. If the mutation escapes detection, a
denaturating gradient gel electrophoresis followed by DNA sequencing is
performed (Kanavakis et al., 1997). In addition, carriers rarely cause clinical
disease and they do not require any treatment unlike β –thalassemia intermedia
2
Chapter one Introduction and literature review
and β –thalassemia major patients in which they require blood transfusion.
Moreover, carriers recognition is important for purpose of genetic counseling
and in warning carriers about the potential risks of marriage to another carrier.
Aims of the study 1. The determination of suitable strategy for the rapid hemoglobin
abnormalities analysis that cause the β –thalassemia syndrome.
2. The implementation of a useful diagnostic procedure based on family,
partner analysis and carrier detection.
3. Defining the molecular and genetic basis of β –thalassemia minor, which
might be useful in the future to start gene bank for this syndrome.
3
Chapter one Introduction and literature review
1.2 Literature review
1.2.1 Thalassemia
1.2.1.1 Definition and History Thalassemia can be defined as group of inherited diseases of blood and
is considered as group of disorders each result from an inherited abnormality
of globin production (Giordano et al., 1999); these disorders can be defined
as hemoglobinopathies (Gulen et al., 1999). Hemoglobinopathies is the
description of syndromes caused due to hemoglobin synthesis disorders and
can be divided into three classes:-
a. Structural variants of hemoglobin as in sickle cell anemia (HbS).
b. HPFH, is a group of disorders signed as hereditary persistence of
fetal hemoglobin , which possessing the failure of normal switching
phase from the fetal hemoglobin (HbF) to adult hemoglobin.
c. Failure in the synthesis of one or more of the globin chains of
hemoglobin, as in thalassemias (Dacie and Lewis, 2001).
Thalassemia represents the major occurrence among the hemoglobin-
nopathies, which means exhibiting the defect in the amount produced of one
or both of globin chains resulting in erythropoiesis hemolysis with variable
degree of anemia (Gulen et al., 1999).
Others defined as a condition in which a reduction occur in the rate of
synthesis of one or more of the globin chains leading to imbalanced globin
chain synthesis, defective in the hemoglobin production, and damage to the
red cells or their precursors, so that, an increase in the globin subunits occur
(Bunn and Forget, 1986).
About one hundred thousand babies over the world are born with the
severe forms of thalassemia each year and will survive of severe anemia
4
Chapter one Introduction and literature review
during the first year of life associated with splenomegaly and bone changes
(Cooley and Lee, 1925).
Thalassemia occurs sporadically in every racial group and considered
as the most public health problems in many parts of the world, it is widely
distributed in the Mediterranean region, Middle East, South East Asia, China,
India and North Africa (Kazazin and Boehm, 1988).
The history of thalassemia started with the discovery of Cooley and
Lee, who first described the severe form of the disease combined with
splenomegaly and bone changes occurring in children, in 1925. Then the
disease later named thalassemia (thalassa, which is a Greek word means the
sea) because the first cases observed in individuals whose ancestors traced to
the lands bordering the Mediterranean. At the end of 1930s, the clinical
syndrome of thalassemia had been well described, but the description of the
heterozygous condition for thalassemia appeared in the Italian literature as
early as 1925. The genetic character of this disorder became well known
during the 1940s, the period following the late 1940s was one of rapid
progress in all aspect of human hemoglobin field. In 1960 -1970 a good
working model of genetics of the disorder was developed for the detection of
Hb Bart's and HbH and for determination of hemoglobin amounts produced
(Weatherall and Clegg, 1981; McGhee and Payne, 1995; Weatherall, 1999).
The progress in molecular techniques, using the recombinant DNA, aid
in localization of genes of the human hemoglobin polypeptide chains on the
related chromosomes, the γ, δ and β genes are located on chromosome 11; the
α –genes are located on chromosome 16 (Deisseroth et al., 1975). Neel and
Valentine named the mild form of Cooley's anemia "thalassemia minor",
which is the heterozygous condition and is characterized of being symptoms
free in most cases, while the more severe case than the thalassemia minor is
5
Chapter one Introduction and literature review
the thalassemia intermedia; which represents the conditions of low Hb and the
development of the disease symptoms do occur.
Patients with thalassemia minor are called carriers and are symptoms
free, while the homozygous condition called thalassemia major which
represents the severe form of thalassemia (Weatherall, 1986).
1.2.2 Hemoglobin structure Hemoglobin molecule has been found as an interesting subject to study,
by biochemists, physical chemists and chemists for along time (Al-Awamy et
al., 1986). This molecule is composed of two parts; the heme part and the
protein part which is called globin. Globin has four subunits; two alpha
polypeptide chains and two beta polypeptide chains, each arranged as more or
less spherical subunits (Giordano et al., 1998, Gulen et al., 1999).The
complete tetrameric hemoglobin molecule has a molecular weight of 64,000
dalton. Heme part is composed of four heme groups. These are molecules
composed of protoporphyrin rings, each containing an iron atom at the center
(Heisman, 1992). Each of the four globin subunits contains one peptide chain
together with its heme group. The most important part of the molecule is the
iron atom, because the oxygen molecules attach themselves reversibly during
the oxygenation and deoxygenation of hemoglobin in its normal physiological
role (Dammas et al., 1995).
1.2.3 Hemoglobin types Human hemoglobin considered to be heterogenous at all stages of
development, so that; different hemoglobins are synthesized in the embryo,
fetus, and adult, each adapted to a particular oxygen requirements of these
changing environments (Weatherall, 1996). Normal adult human hemoglobin
(HbA or hemoglobin A) is composed of two alpha peptide chains and two
beta peptide chains, it is written as α2β2. The human fetus has a different type
6
Chapter one Introduction and literature review
of hemoglobin (Weatheral and Weather, 1987), which has the same molecular
complexity but it is chemically distinguishable.
The human fetal hemoglobin is composed of four peptide chains: two
alpha peptide chains, they are the same as in adult type, and two gamma
peptide chains, it is written as α2γ2 (Pearson, 1996).
Normal human adult has a minor hemoglobin component produced at
35 weeks of gestation, called hemoglobin A2. It is composed of two alpha
chains and two delta chains (α2δ2), which is electrophoretically distingu-
ishable from others. The two alpha chains (HbA2) are identical with those in
the adult protein and also found in fetal hemoglobin (Gries et al., 1985).
The alpha (α) chain contains 141 amino acids; delta chain (δ) contains
146 amino acids (Telen and Kaufman, 1999).The δ chain (of HbA2) differs
from the β chain (of HbA) in only 10 residues. The first eight residues and the
C terminal residues (127 to 146) are the same in δ and β chains (Renney and
Sharma, 1995). The symbol δ is used to indicate that these peptide chains are
distinguishable in their primary structure from the beta (β) and gamma (γ)
peptide chains and they are also under separate genetic control.
The α, β, γ and δ peptide chains give good indication that the genetic
control is regulated by four types of structural genes (Telen and Kauman,
1999). Two abnormal hemoglobins can be identified in human; these are
hemoglobin H, and hemoglobin Barts. Hemoglobin H is composed of four
beta peptide chains (β4), while hemoglobin Barts is composed of four gamma
peptide chains (γ4). These two abnormal hemoglobins are produced in certain
conditions of inherited hemolytic anemia (Wickramasinnghe and Lee, 1998).
Both are caused due to a relative over production of β or γ peptide chains
within a cell leading to tetramer formation of the type. Table (1-1)
7
Chapter one Introduction and literature review
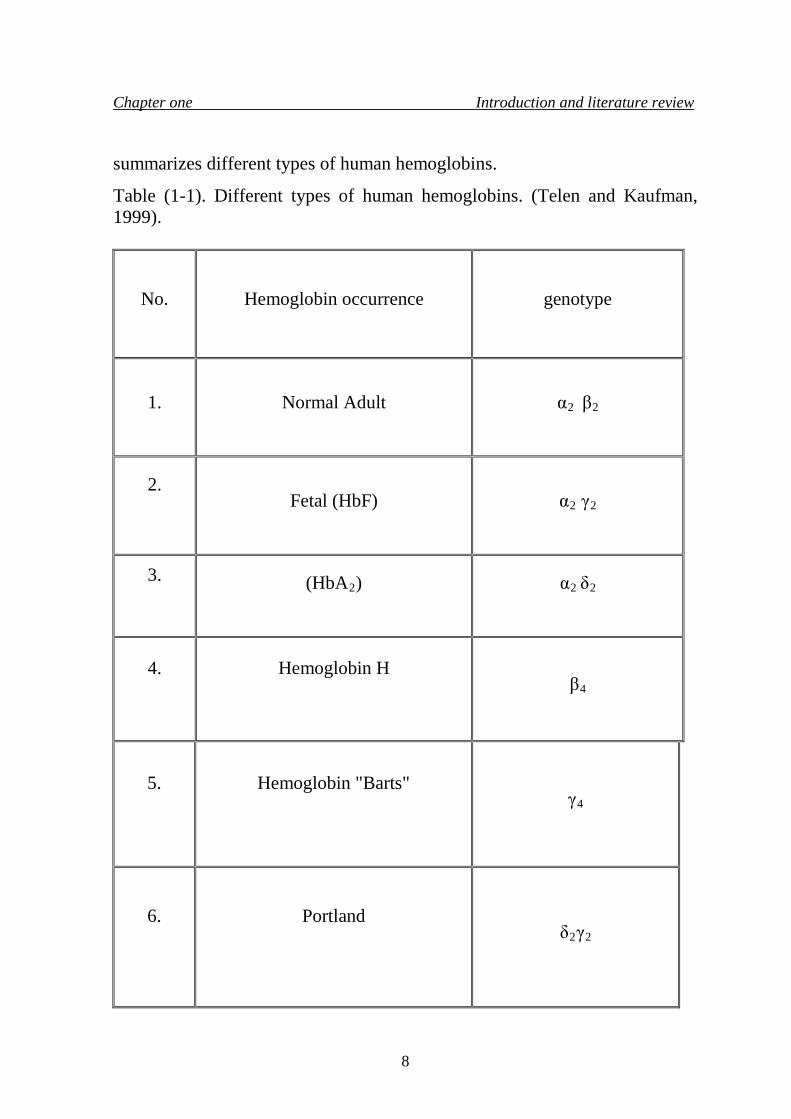
summarizes different types of human hemoglobins.
Table (1-1). Different types of human hemoglobins. (Telen and Kaufman, 1999).
No.
Hemoglobin occurrence
genotype
1.
Normal Adult
α2 β2
2.
Fetal (HbF)
α2 γ2
3.
(HbA2)
α2 δ2
4.
Hemoglobin H
β4
5.
Hemoglobin "Barts"
γ4
6.
Portland
δ2γ2
8
Chapter one Introduction and literature review
7.
Gower
ζ2 γ2
8.
Gower II
α2ε2
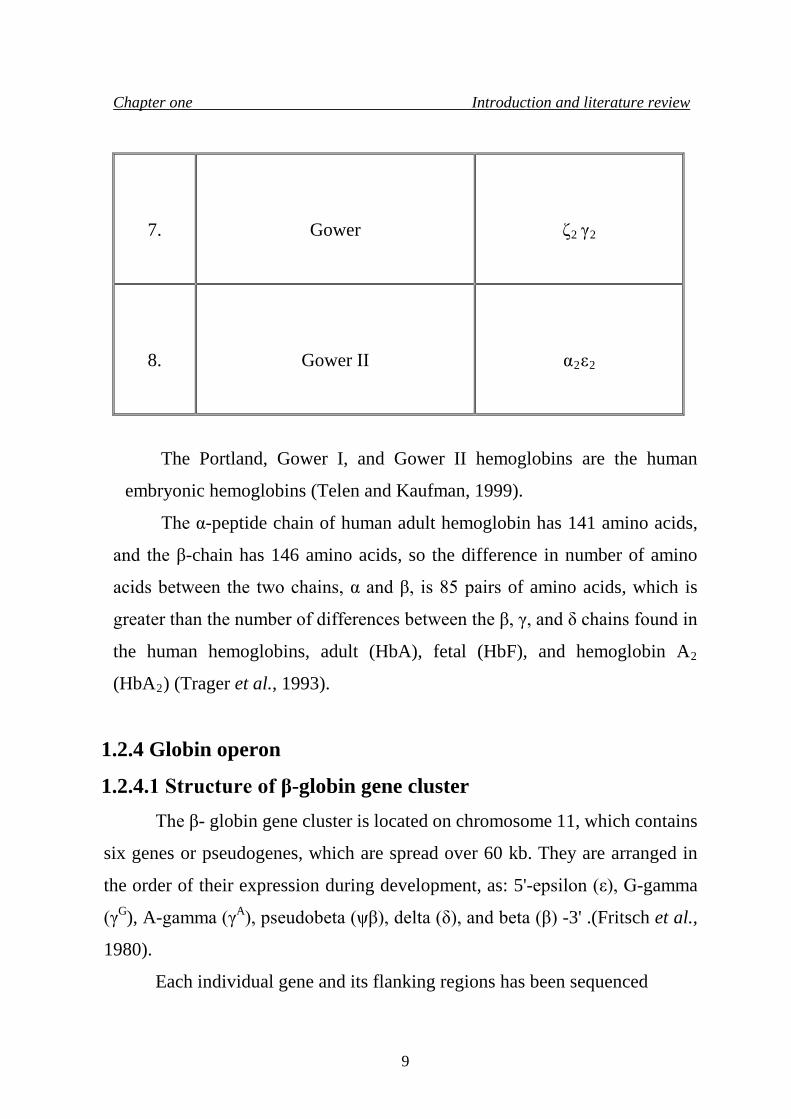
The Portland, Gower I, and Gower II hemoglobins are the human
embryonic hemoglobins (Telen and Kaufman, 1999).
The α-peptide chain of human adult hemoglobin has 141 amino acids,
and the β-chain has 146 amino acids, so the difference in number of amino
acids between the two chains, α and β, is 85 pairs of amino acids, which is
greater than the number of differences between the β, γ, and δ chains found in
the human hemoglobins, adult (HbA), fetal (HbF), and hemoglobin A2
(HbA2) (Trager et al., 1993).
1.2.4 Globin operon
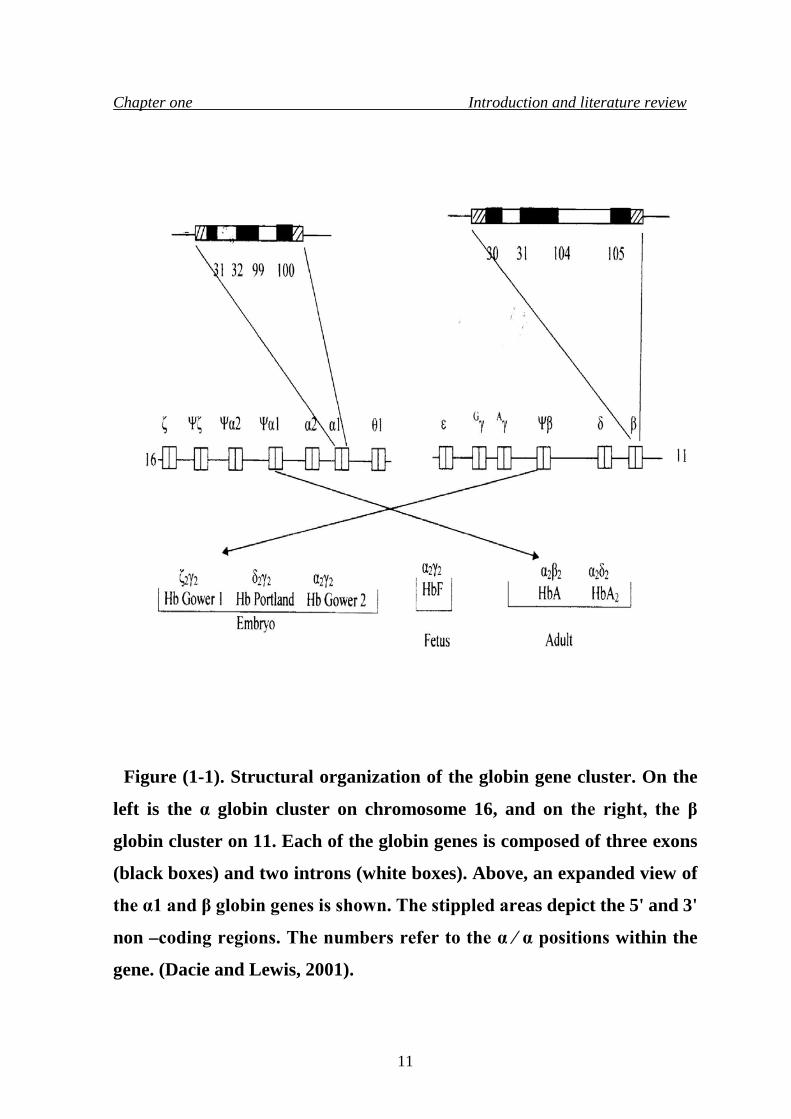
1.2.4.1 Structure of β-globin gene cluster The β- globin gene cluster is located on chromosome 11, which contains
six genes or pseudogenes, which are spread over 60 kb. They are arranged in
the order of their expression during development, as: 5'-epsilon (ε), G-gamma
(γG), A-gamma (γA), pseudobeta (ψβ), delta (δ), and beta (β) -3' .(Fritsch et al.,
1980).
Each individual gene and its flanking regions has been sequenced
9
Chapter one Introduction and literature review
(Fritsch et al., 1980).The γG and γA genes share a similar sequence and
located on one chromosome, and are identical in the 5' region to the center
of the large intron as shown in figure (1-1), but they show some divergence
at 3' position (Slighton et al., 1980).
Although there is an individual variability, the alpha genes cluster
usually contains one functional ζ gene and two alpha genes designated as α2
and α1; it also contains four pseudogenes, duplicated genes that have lost their
ability to function. These have been named ψζ, ψα1, ψα2, θ. Each α gene is
located in a homologous region, approximately four kb long, and is
interrupted by two small non –homologous regions. The β –globin gene
cluster resembles the α –globin genes, in which it contains a series of single
restriction fragment length polymorphisms (RFLPs). The arrangement of
RFLPs or haplotypes in the beta globin cluster falls into two domains, one on
the 5' side of the β –gene, occupying a region for about 32 kb from the ζ gene
to the 3' end of the ψβ gene, and three common patterns of RFLPs are found.
The haplotypes of the β –globin gene are similar in most populations, but they
differ markedly among individuals of African region (Watson and Kendro,
1961). Figure (1-1) shows the structural organization of the globin gene
cluster.
10
Chapter one Introduction and literature review
Figure (1-1). Structural organization of the globin gene cluster. On the
left is the α globin cluster on chromosome 16, and on the right, the β
globin cluster on 11. Each of the globin genes is composed of three exons
(black boxes) and two introns (white boxes). Above, an expanded view of
the α1 and β globin genes is shown. The stippled areas depict the 5' and 3'
non –coding regions. The numbers refer to the α ∕ α positions within the
gene. (Dacie and Lewis, 2001).
11
Chapter one Introduction and literature review
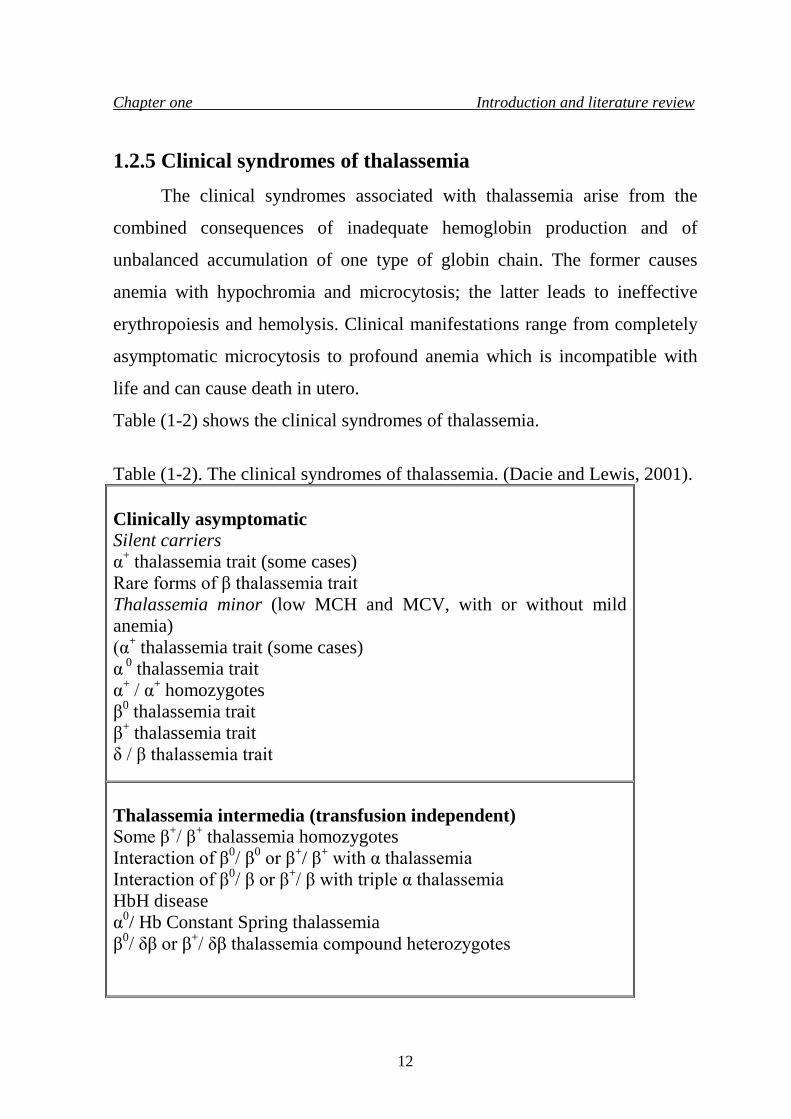
1.2.5 Clinical syndromes of thalassemia The clinical syndromes associated with thalassemia arise from the
combined consequences of inadequate hemoglobin production and of
unbalanced accumulation of one type of globin chain. The former causes
anemia with hypochromia and microcytosis; the latter leads to ineffective
erythropoiesis and hemolysis. Clinical manifestations range from completely
asymptomatic microcytosis to profound anemia which is incompatible with
life and can cause death in utero.
Table (1-2) shows the clinical syndromes of thalassemia.
Table (1-2). The clinical syndromes of thalassemia. (Dacie and Lewis, 2001). Clinically asymptomatic Silent carriers α+ thalassemia trait (some cases) Rare forms of β thalassemia trait Thalassemia minor (low MCH and MCV, with or without mild anemia) (α+ thalassemia trait (some cases) α 0 thalassemia trait α+ / α+ homozygotes β0 thalassemia trait β+ thalassemia trait δ / β thalassemia trait
Thalassemia intermedia (transfusion independent) Some β+/ β+ thalassemia homozygotes Interaction of β0/ β0 or β+/ β+ with α thalassemia Interaction of β0/ β or β+/ β with triple α thalassemia HbH disease α0/ Hb Constant Spring thalassemia β0/ δβ or β+/ δβ thalassemia compound heterozygotes
12
Chapter one Introduction and literature review
some cases of HbE/ β thalassemia and Hb Lepore / β thalassemia Rare cases of heterozygotes for β thalassemia mutation, particularly involving exon 3. Thalassemia major (transfusion dependent) β0/ β0 thalassemia β+/ β+ thalassemia β0/ β+ thalassemia β0/ Hb Lepore, β+/ Hb Lepore thalassemia β0/ HbE. β+/ HbE thalassemia
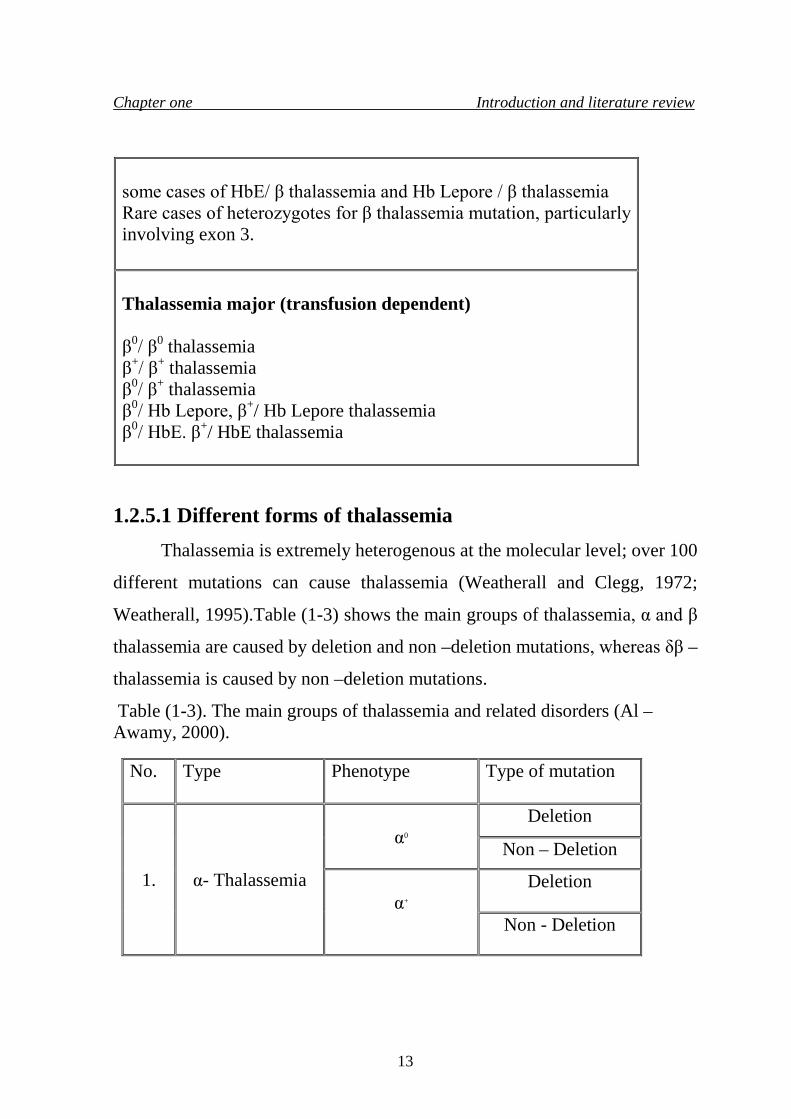
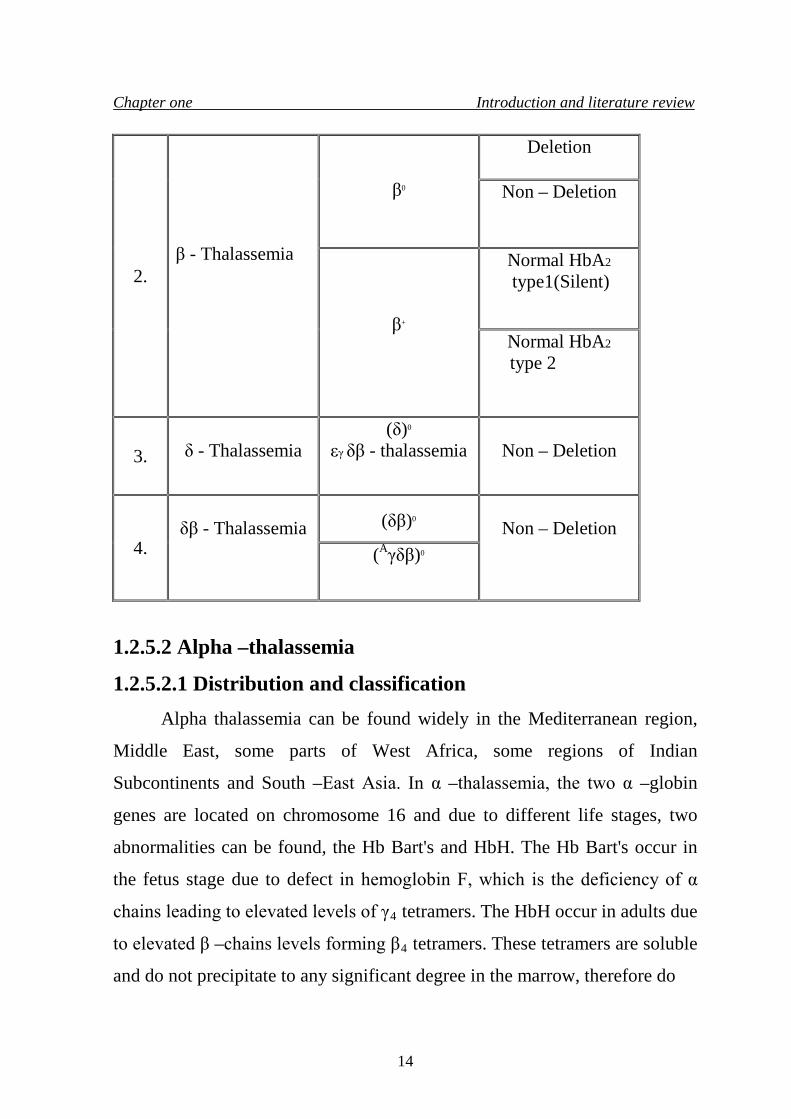
1.2.5.1 Different forms of thalassemia Thalassemia is extremely heterogenous at the molecular level; over 100
different mutations can cause thalassemia (Weatherall and Clegg, 1972;
Weatherall, 1995).Table (1-3) shows the main groups of thalassemia, α and β
thalassemia are caused by deletion and non –deletion mutations, whereas δβ –
thalassemia is caused by non –deletion mutations.
Table (1-3). The main groups of thalassemia and related disorders (Al – Awamy, 2000).
No. Type
Phenotype
Type of mutation
1.
α- Thalassemia
α0
Deletion
Non – Deletion
α+
Deletion
Non - Deletion
13
Chapter one Introduction and literature review
1.2.5.2 Alpha –thalassemia
1.2.5.2.1 Distribution and classification Alpha thalassemia can be found widely in the Mediterranean region,
Middle East, some parts of West Africa, some regions of Indian
Subcontinents and South –East Asia. In α –thalassemia, the two α –globin
genes are located on chromosome 16 and due to different life stages, two
abnormalities can be found, the Hb Bart's and HbH. The Hb Bart's occur in
the fetus stage due to defect in hemoglobin F, which is the deficiency of α
chains leading to elevated levels of γ4 tetramers. The HbH occur in adults due
to elevated β –chains levels forming β4 tetramers. These tetramers are soluble
and do not precipitate to any significant degree in the marrow, therefore do
2.
β - Thalassemia
β0
Deletion
Non – Deletion
β+
Normal HbA2
type1(Silent)
Normal HbA2 type 2
3. δ - Thalassemia
(δ)0 εγ δβ - thalassemia
Non – Deletion
4.
δβ - Thalassemia
(δβ)0
Non – Deletion (Aγδβ)0
14
Chapter one Introduction and literature review
not cause severe ineffective erythropoiesis (Schier et al., 1989).There are two
main groups of α –thalassemia determinants, first, there are the α0 –
thalassemia in which no α –chains are produced from either α –globin locus
on an affected chromosome. Second, there are the α+ –thalassemia, in which
the out put of one of the linked pair of α –globin gene is defective (Lacerra
et al., 1991, Kattamis et al., 1996). The α+ –thalassemias are subdivided to
deletion and non –deletion types. Both α0 –thalassemia, deletion, and non –
deletion forms of α+ –thalassemia are all heterozygous at the molecular level
(Harteveld et al., 2000).
1.2.5.3 δ – thalassemia The δ –thalassemia is characterized by a reduced output of δ chains, it
is characterized by reduced levels of HbA2 in heterozygotes and an absence
of HbA2 in homozygotes. A person with δ –thalassemia has no clinical
significance (Ryan et al., 2000).
1.2.5.4 δβ –thalassemia The δβ –thalassemia is heterozygous at the molecular level. In some
conditions, no β or δ chains are synthesized, so the classification of these
disorders is according to the structure of hemoglobin F which is produced,
that is, Gγ Aγ (δβ0) and Gγ (δβ) 0 thalassemia. This method of classification is
illogical and these conditions are best described by globin chains that are
defectively synthesized, this simply (δβ0) and (Aγδβ)0 thalassemias
(Weatherall et al., 1989).
1.2.5.5 β –thalassemia
15
Chapter one Introduction and literature review
1.2.5.5.1 Types of β –thalassemia
Beta thalassemia can be found either as heterozygous condition (beta
thalassemia minor) or as homozygous condition (beta thalassemia major)
which requires frequent blood transfusions. A person of beta thalassemia
minor described as a carrier of the beta thalassemia gene. Usually carriers are
symptomless, while patients of the homozygous state will survive severe
anemia and requires blood transfusion. The beta thalassemia intermedia is a
condition between the minor and major (Ryan et al., 2000).
The beta thalassemia is divided into two main varieties: in βº
thalassemia, there is a total absence of β –chain production, and in β+
thalassemia, there is a partial deficiency of β –chain production. For
descriptive aim, if the condition in which there is some β –chain production is
often referred to as β+ thalassemia, while when there is marked deficiency of
the β –chain, the condition is referred to as β++ thalassemia, in which the
deficiency is milder (Thein et al., 1990).
The elevated levels of HbA2 in heterozygotes, compromise the most
common form of β –thalassemia , but there is a less common class of β –
thalassemia when heterozygotes have normal levels of HbA2 (Funcharoen et
al., 1988).
1.2.5.5.2 Beta thalassemia major
The (homozygous) or (compound heterozygous state) for β –
thalassemia, thalassemia major, which produces a clinical picture described
by Thamass Cooley in 1925 (Cooley and Lee, 1925). Anemia appears
during the first few months of life and becomes progressively severe, so
that, infants with thalassemia major fail to thrive and may have health
16
Chapter one Introduction and literature review
problems, they are also considered to be a blood transfusion –dependent
(Loukopoulos et al., 1990).
1.2.5.5.3 Beta thalassemia intermedia Thalassemia intermedia is a medical term which describes those
patients having phenotypes that are more sever than the thalassemia minor,
but milder than the blood transfusion –dependent; the thalassemia major
(Camaschella and Capellini, 1995).
The beta thalassemia intermedia syndrome involves a wide spectrum of
disability and patients will survive the anemic condition later than in usual in
the transfusion –dependent forms of beta thalassemia major, and they will
maintain a hemoglobin level of about 6 g/dl without transfusion (Green and
King, 1990).
Their growth and development is related and they become disabled
with obvious skeletal abnormalities, arthritis, bone pain, and progressive
splenomegaly (Dimarzo et al., 1988).
At the other end of the spectrum, there are patients who remain
completely asymptomatic until adult life and are transfusion –independent,
with hemoglobin levels as high as 10-12 g/dl (Driscoll et al., 1995). Some
patients become little disabled because of the effects of hypersplenism
(Perniola et al., 1988).
1.2.5.5.4 Beta thalassemia minor The heterozygous condition for β –thalassemia, thalassemia minor (or
trait), represents the mild form of Cooley's anemia, named by Valentine and
Neel during the 1940s. It is not usually associated with any clinical disability
except in periods of stress, such as pregnancy or during severe infection when
17
Chapter one Introduction and literature review
a moderate degree of anemia may be found. The heterozygous condition
characterized by reduction in the synthesis of only one β –chain, elevated
levels of HbA2 and hypochromic microcytic anemia (Kattamis, 1981).
Hemoglobin values are usually in the 9-11 g/dl range, but the most consistent
finding is small, poorly hemoglobinized red cells (MCV values of 50-70 fl,
MCH values of 20 to 22 pg). The red cells indices are particularly useful in
screening for the heterozygous carriers of thalassemia in population survey
(Gurgey et al., 1991).
Beta thalassemia is heterozygous at the molecular levels and due to this
heterogeneity, variable hematological results of the carrier state can be
estimated (Weatherall, 1995).
The bone marrow in heterozygous β –thalassemia shows slight erythroid
hyperplasia with rare red cells inclusion, megaloblastic transformation due to
folic acid deficiency occurs occasionally, particularly during pregnancy.
Although there is a mild degree of ineffective erythropoiesis, but the red cells
survival is normal or nearly so (Altay and Gurgey, 1992).
An increase in the HbA2 level occur, reaches values of (3.5 – 7) % in
carriers of β –thalassemia, the level of fetal hemoglobin (HbF) is increased in
about half the patients, reaches values, usually (1 - 3) % and rarely to more
than 5 %. Some carriers have the coexistence of iron deficiency with the
presence of β –thalassemia minor, leading to depress the HbA2 levels (Zhang
et al., 1990).
Any offspring of two beta–thalassemia gene carriers will be at risk of being
homozygous for the beta –thalassemia gene (major), which is a lethal disease
and blood transfusion –dependent patients (Rowley, 1976).
There are six types of β –thalassemia trait:-
18
Chapter one Introduction and literature review
1. The most common two types are β0 and β+ thalassemia carriers, in which
both are usually symptom free with normal or slightly reduced HbA level
(normal or 1 – 3 g/dl below the normal range); mild hypochromic
microcytic blood picture, with low MCV and MCH values, a
characteristic feature is the increase in HbA2 level > 4 %, and in some
carriers it reaches above 7.5% was associated with partial or complete
deletion of β –globin gene. HbF level either normal or slightly increased
with heterogenous distribution among red cells, β / α ratio is decreased.
2. A third type, severe β –thalassemia trait, is quite rare with a clinical picture
similar to that of thalassemia intermedia, there is moderate anemia with
splenomegaly and bony changes. MCV decreased with moderately
abnormal red blood cell morphology, HbA2 increased, with normal or
slightly increased HbF level, decreased β / α ratio, and patients may need
splenoctomy to reduce the severity of anemia (Khider, 1986; Ko et al.,
1989).
3. In the fourth type "silent carrier", there is no anemia, MCH, MCV, red cell
morphology, HbF, and HbA2, all are normal, but β / α ratio is decreased
(Ingram and Stretton, 1959; Schwartz, 1969).
4. A fifth type is quite carrier which had no or mild hypochromic microcytic
anemia, with decreased MCV; HbF and HbA2 are normal with decreased
β / α ratio (WHO Working Group, 1982).
5. The sixth type is African, same as β+ and βº thalassemia carriers, but differ
in that β / α ratio may be decreased or normal, as it occurs in population in
which α –thalassemia is common, so α –chain may also decreased to the
same extent as β – chains and β / α ratio will be normal (Chene and
Schwartz, 1999).
19
Chapter one Introduction and literature review
1.2.5.6 Diagnosis of beta –thalassemia trait Heterozygous thalassemia rarely causes clinical disease and it does not
require any treatment, their recognition is important for purposes of genetic
counseling (Steinberg and Dreiling, 1983), and the lack of reliable and
inexpensive diagnostic technique for heterozygous β –thalassemia has been a
major reason that this condition is frequently unrecognized (Rucknagel et al.,
1974).
The distinction between α and β –thalassemia depends on the
measurement of the minor Hb (A2, F), if these are normal, the diagnosis of α
–thalassemia is most likely, although rare subjects with β –thalassemia trait
also have normal level of HbA2 and HbF (Weatherall and Clegg, 1981).
Blood count, including red cell count, hemoglobin (Hb), packed cell volume
(PCV) and red cell indices, considered to be valuable information and useful
in the diagnosis of both alpha (α) and beta (β) –thalassemia (Harrison,
1992).On the other hand Hemoglobin electrophoresis on cellulose acetate at
alkaline pH is important in the diagnosis of thalassemia to screen for HbH, Hb
Bart's and presence of abnormal Hb (Brown, 1993). Whereas HbA2
measurement could be carried out by cellulose acetate (Hamilton et al., 1979)
and high performance liquid chromatography (HPLC) (Wilson et al.,
1983).Estimation of HbF is carried out by alkaline denaturation test (Betke
et al., 1959), HPLC (Wilson et al., 1983), immunological methods by
immunodiffusion (Chudwin and Rucknagel, 1974) and ELISA (Makler and
Pesce, 1980). It is worth to mention that, coexistence of iron deficiency
makes the diagnosis of thalassemia trait more difficult as it makes the typical
blood picture and causes reduced HbAR2R synthesis (Wasi et al., 1969; Kattamis
et al., 1972; Alperin et al., 1977).
20
Chapter one Introduction and literature review
Recent investigations, indicated the importance of DNA analysis and
globin chain testing, to identify specific genotypes for research purposes, to
differentiate an α –thalassemia carrier from β –thalassemia carrier, to identify
a silent carrier gene, or to examine for family inheritance patterns with
multiple genes (Dacie and Lewis, 2001).
1.2.5.7 Clinical features of β –thalassemia trait The heterozygous state of beta thalassemia, β –thalassemia minor, has
a clinical feature by having imbalanced globin chain synthesis. The β –globin
synthesis will be slightly decreased, resulting in the production of an excess
of α –globin chains (Baysal et al., 1995). The excess of α –globin chains will precipitate in the red cells
precursors, this condition is much worse in the β –thalassemia major and
causes many health problems, while in β –thalassemia minor; the magnitude
of the excess of α –chains is much less and can be dealt with successfully by
the proteolytic enzymes of the red cells precursors, in spite of that, there is a
mild degree of effective erythropoiesis (Lucarelli and Galimberi, 1990).
The anemia of beta thalassemia has three major components:-
a. Hemolysis of circulating mature red cells containing α –chains
inclusions.
b. Reduction in the rate of hemoglobin synthesis, resulting in hypochromic
and microcytic red cells.
c. The most important component is the ineffective erythropoiesis.
The elevated levels of HbA2, is a characteristic mark to heterozygous
β –thalassemia, this elevation is caused by:-
a. A defect in β –chain synthesis leading to a relative decrease in HbA
level.
21
Chapter one Introduction and literature review
b. An absolute increase in the output of δ chain both cis and trans to
mutant β –globin gene (Weatherall and Clegg, 1981).
1.2.6 Molecular basis of thalassemia The application of recombinant DNA technology to study the globin
producing genes, including the study of thalassemia has revealed a great deal
of different types of defects at the molecular level (Wong et al., 1987).
Β–thalassemia is extremely heterogenous at the molecular level and for
about 100 different mutations has been found in association with this
phenotype, table (1 – 4). These include deletion of the β –globin gene and non
–deletion mutations that may affect the transcription, processing, or
translation of β –globin messenger RNA (Diaz –Chico et al., 1987).
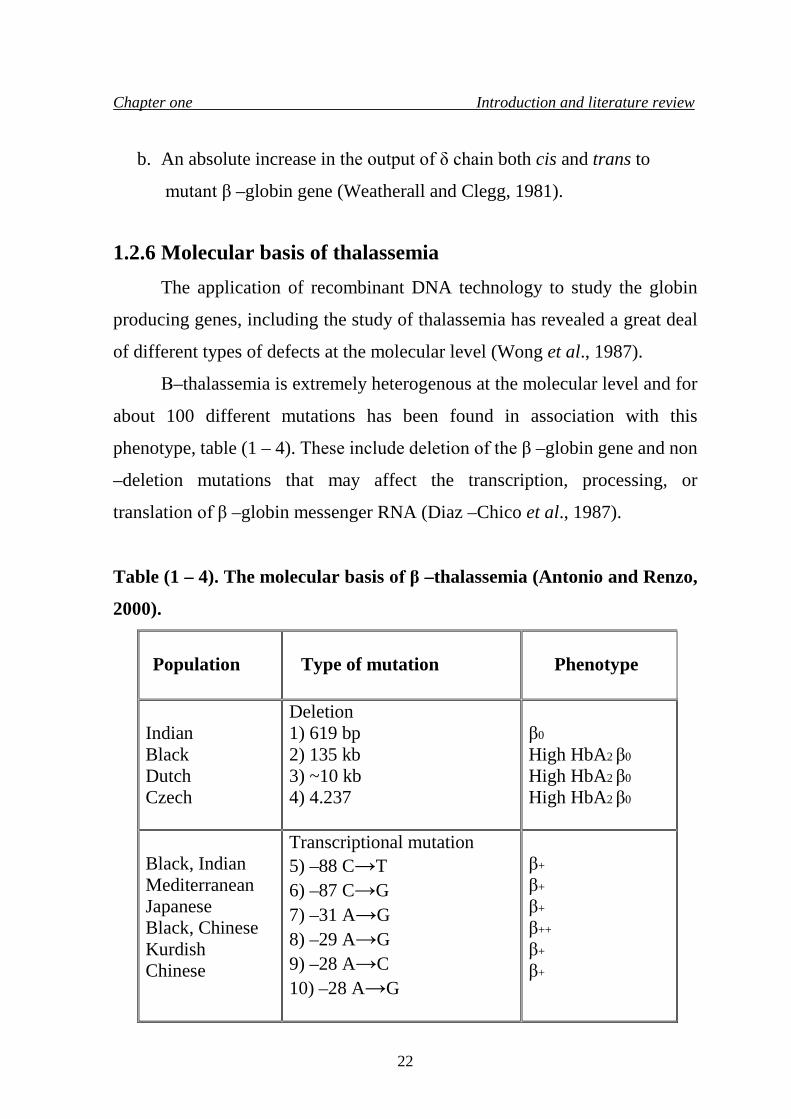
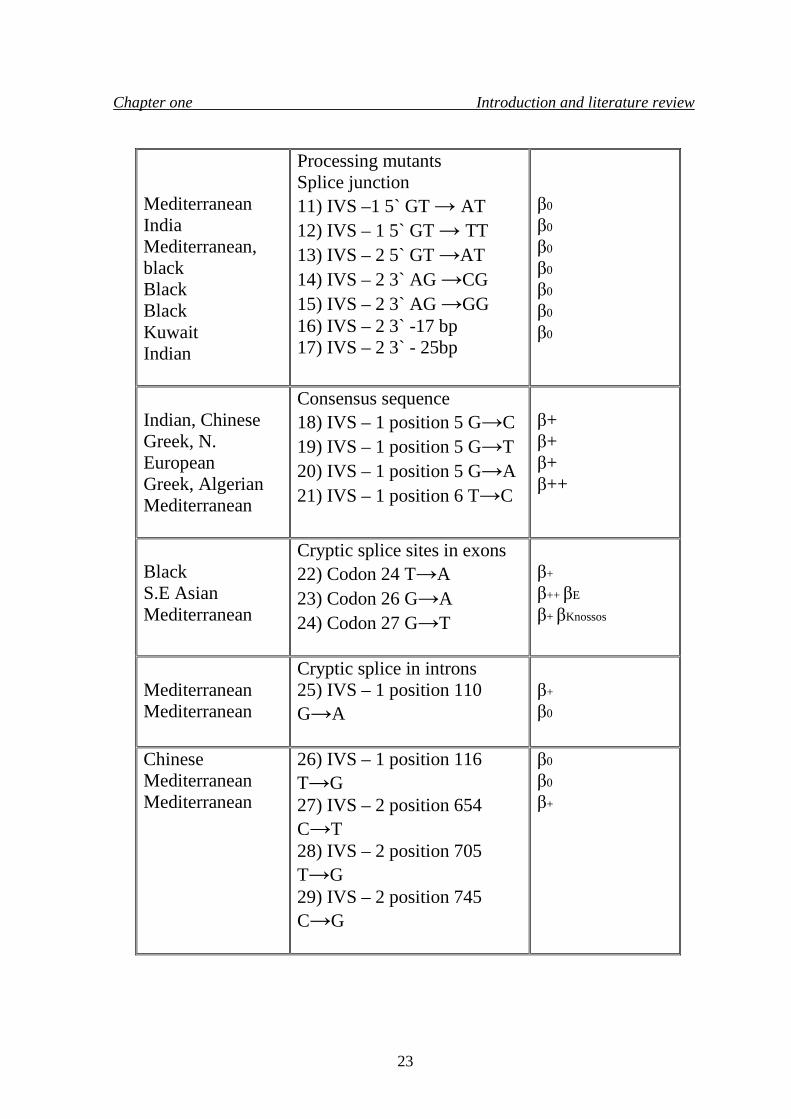
Table (1 – 4). The molecular basis of β –thalassemia (Antonio and Renzo,
2000).
Population
Type of mutation
Phenotype
Indian Black Dutch Czech
Deletion 1) 619 bp 2) 135 kb 3) ~10 kb 4) 4.237
β0
High HbA2 β0
High HbA2 β0
High HbA2 β0
Black, Indian Mediterranean Japanese Black, Chinese Kurdish Chinese
Transcriptional mutation 5) –88 C→T 6) –87 C→G 7) –31 A→G 8) –29 A→G 9) –28 A→C 10) –28 A→G
β+
β+
β+
β++
β+
β+
22
Chapter one Introduction and literature review
Mediterranean India Mediterranean, black Black Black Kuwait Indian
Processing mutants Splice junction 11) IVS –1 5` GT → AT 12) IVS – 1 5` GT → TT 13) IVS – 2 5` GT →AT 14) IVS – 2 3` AG →CG 15) IVS – 2 3` AG →GG 16) IVS – 2 3` -17 bp 17) IVS – 2 3` - 25bp
β0
β0
β0
β0
β0
β0
β0
Indian, Chinese Greek, N. European Greek, Algerian Mediterranean
Consensus sequence 18) IVS – 1 position 5 G→C 19) IVS – 1 position 5 G→T 20) IVS – 1 position 5 G→A 21) IVS – 1 position 6 T→C
β+ β+ β+ β++
Black S.E Asian Mediterranean
Cryptic splice sites in exons 22) Codon 24 T→A 23) Codon 26 G→A 24) Codon 27 G→T
β+
β++ βE
β+ βKnossos
Mediterranean Mediterranean
Cryptic splice in introns 25) IVS – 1 position 110 G→A
β+
β0
Chinese Mediterranean Mediterranean
26) IVS – 1 position 116 T→G 27) IVS – 2 position 654 C→T 28) IVS – 2 position 705 T→G 29) IVS – 2 position 745 C→G
β0
β0
β+
23
Chapter one Introduction and literature review
β0= Absence of β - globin gene product.
β+= Some residual production of β - globin gene.
β++= Reduction of β - globin gene product is very mild.
IVS = Intervening sequence
1.2.6.1 Gene deletion Four different types of deletions affecting only the β –genes, with one
exception these are rare and appear to be isolated single events; the most
common type of this kind of mutation, is the 619 bp deletion at the 3' end of
the β gene, but even that is restricted to the Sind and Gujarati populations of
Pakistan and India, where it accounts for approximately 50% of the β –
thalassemia alleles (Thein et al., 1994). The Indian 619 bp deletion removes the 3' end of the β gene but leaves
the 5' end intact, while the other four deletions remove the 5' end of the β gene
and leave δ –gene intact (Basak et al., 1992).
Heterozygotes for the other four deletions all have usually high HbA2
levels. It is not clear that the increased δ –gene transcription and, if so, that is
only the gene in cis that is usually active, possibly as a result of reduced
competition from the deleted 5' β gene for transcriptional factors (Cao et al.,
1990).
1.2.6.2 Mutations to termination codons Base substitutions that leads to a change of an amino acid codon into a
chain termination codon (non –sense mutations) prevent translation of the
messenger RNA and result in β0 –thalassemia (Giordano et al., 1998). Several
substitutions of this type have been described, a codon 39 mutation occurring
with great frequency in the Mediterranean, and a codon17 mutation is
common in Southeast Asia (Varawalla et al., 1992).
24
Chapter one Introduction and literature review
1.2.6.3 RNA processing mutation RNA processing can also be affected by different types of mutations
that create new splice sites, within either the introns or exons, resulting in
variable phenotypic affects, depending on the degree of which the new site is
utilized in comparison with the normal splice site (Kerkhoffs et al., 2000), for
example the G→A substitution at position 110 of IVS -1, which is one of the
commonest forms of β –thalassemia in the Mediterranean, leads to about 10%
splicing at the normal site and results in a phenotype of severe β+ -thalassemia
(Varawalla et al., 1992).
A mutation that produces a new acceptor site at position 116 in IVS -1
results in little or no β –globin mRNA production and the phenotype of β0 –
thalassemia (Hall et al., 1991).
1.2.6.4 Transcriptional mutations Some types of mutations which are basically, base substitutions, occur
in the conserved sequences, that are located upstream from the β –globin
gene, leading to the β+ -thalassemia phenotype of each mutation, but there is a
considerable variability in the clinical severity, according to the type of these
different mutations which affect the transcriptional stage (Mokrydimas et al.,
1997).
Two mutations are in the mRNA CAP site; they are at position -88 and
-87, these two mutations are close to the CCAAT box. Four mutations lie
within the ATA box homology (Takihara et al., 1986).
Studies showed that, a base substitution from A to C at CAP site (+1)
was identified in an Indian of ancestors came from Asia, this Indian carrier
have the phenotype of β –thalassemia minor but in fact he is homozygous for
the mutation (Azer and Chingiz, 1995).
25
Chapter one Introduction and literature review
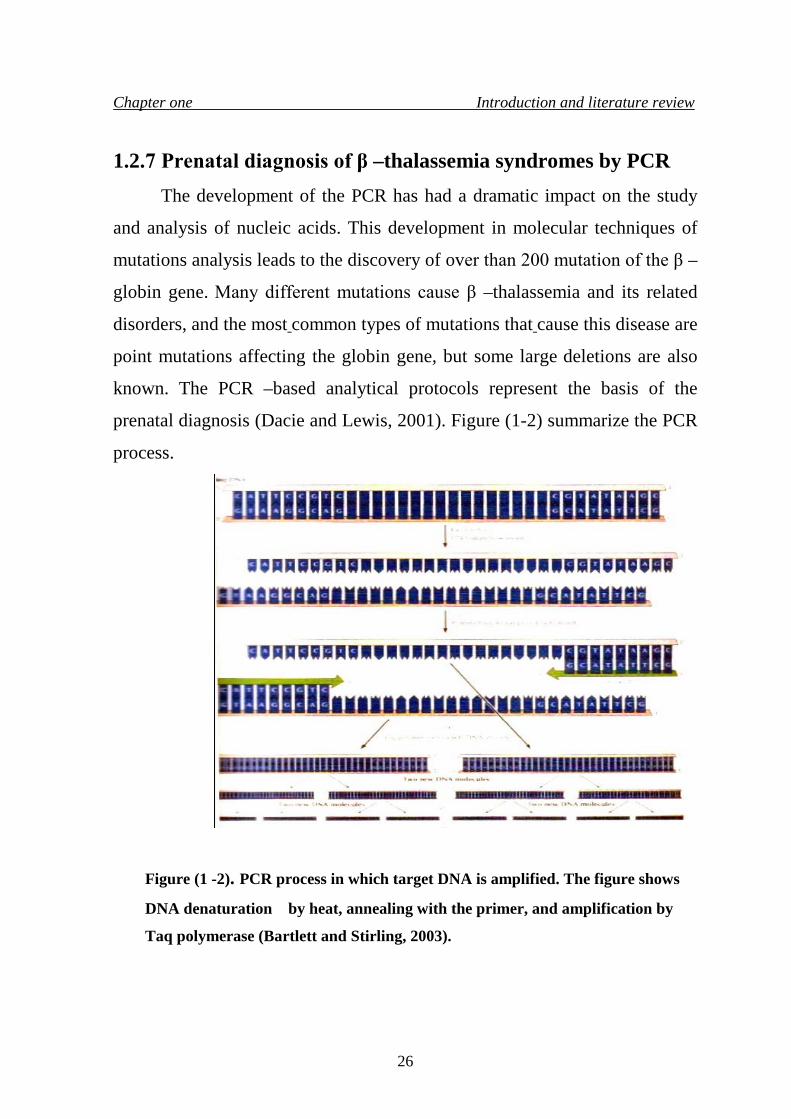
1.2.7 Prenatal diagnosis of β –thalassemia syndromes by PCR The development of the PCR has had a dramatic impact on the study
and analysis of nucleic acids. This development in molecular techniques of
mutations analysis leads to the discovery of over than 200 mutation of the β –
globin gene. Many different mutations cause β –thalassemia and its related
disorders, and the most common types of mutations that cause this disease are
point mutations affecting the globin gene, but some large deletions are also
known. The PCR –based analytical protocols represent the basis of the
prenatal diagnosis (Dacie and Lewis, 2001). Figure (1-2) summarize the PCR
process.
Figure (1 -2). PCR process in which target DNA is amplified. The figure shows
DNA denaturation by heat, annealing with the primer, and amplification by
Taq polymerase (Bartlett and Stirling, 2003).
26
Chapter one Introduction and literature review
1.2.8 Prevention The different forms of thalassemia can be prevented by two ways; the
first way is the genetic counseling, which is screening the whole population
when they are still in school and warning carriers about the risk of marriage to
another carrier (Basorga and Benz, 1988). Many efforts, around the word in
which thalassemia occurs widely, are directed toward developing prenatal
diagnosis programs (Chui and Waye, 1998), this involving screening of
mothers at their first prenatal visit, screening the fathers in cases in which the
mother is a thalassemia carrier, and offering the couple possibility of prenatal
diagnosis and therapeutic abortion if they are both carriers of a gene for
severe form of thalassemia (Lam et al., 1997).
A prenatal diagnosis can be carried out at the 18th week of pregnancy
(Brambati et al., 1991) by utilizing fetal blood sampling and globin chain
synthesis analysis. These methods have been applied successfully in many
countries resulting in a reduction in the birth rate of homozygous β –
thalassemic in many parts of the Mediterranean (Alter, 1985).
Fetal DNA analysis is helpful to determine the hemoglobin disorder in
utero, this can be done by using DNA derived from amniotic fluid, but this
analysis can be done relatively late in pregnancy and the amniotic fluid cells
have to grown in culture to obtain enough DNA (Wichramasinghe and Lee,
1998).
Chorionic villus sampling is another way utilizing the use of DNA and
can be done in the ninth week of pregnancy. It can be considered to be the
major method for the prenatal diagnosis of thalassemia (Rodeck, 1993).
The progress in DNA technology, give a great deal to facilitate the
development of prenatal diagnosis programs (Chehab et al., 1987), this
27
Chapter one Introduction and literature review
includes the polymerase chain reaction (PCR), which allows small amounts of
DNA to be rapidly amplified.
The PCR technique together with oligonucleotide probes and non –
radioactive labeling techniques, help in reducing the technology required for
prenatal diagnosis and otherwise it develop the "dot plot" analysis to
determine whether a fetus has inherited a severe form of thalassemia (Nico
et al., 1999).
28
Chapter two Materials and Methods
2.1 Materials
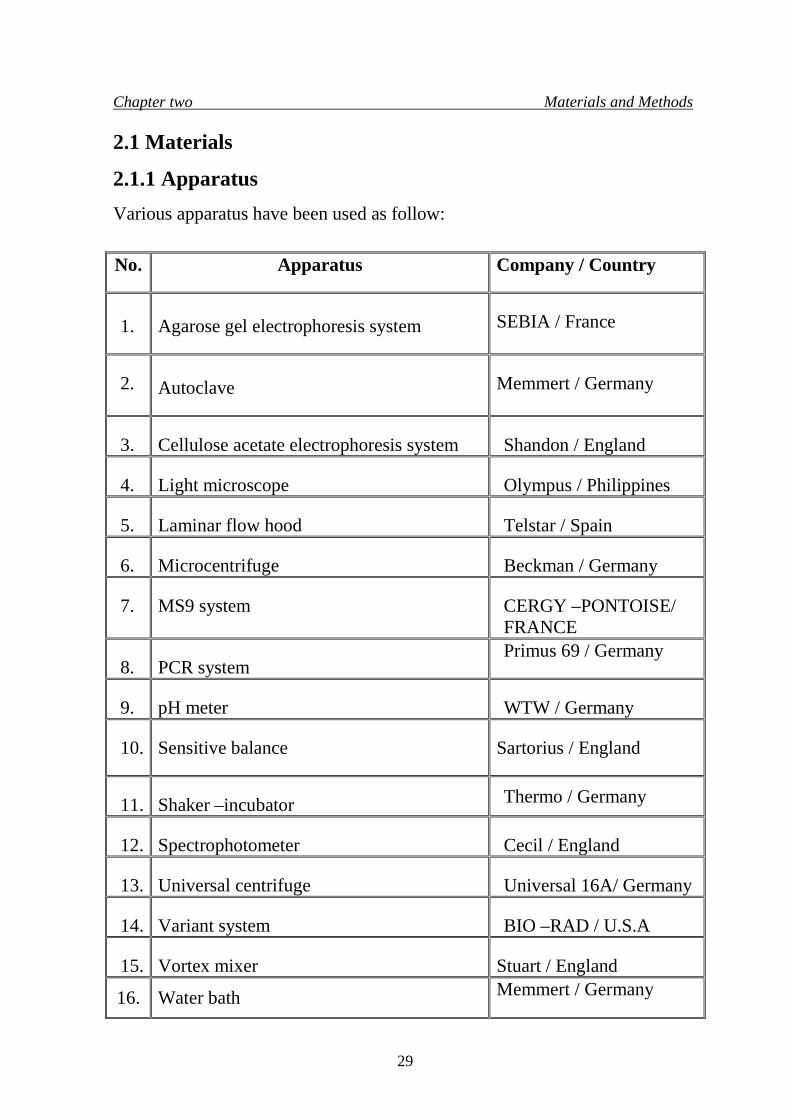
2.1.1 Apparatus Various apparatus have been used as follow: No.
Apparatus
Company / Country
1.
Agarose gel electrophoresis system
SEBIA / France
2.
Autoclave
Memmert / Germany
3.
Cellulose acetate electrophoresis system
Shandon / England
4.
Light microscope
Olympus / Philippines
5.
Laminar flow hood
Telstar / Spain
6.
Microcentrifuge
Beckman / Germany
7.
MS9 system
CERGY –PONTOISE/ FRANCE
8.
PCR system
Primus 69 / Germany
9.
pH meter
WTW / Germany
10.
Sensitive balance
Sartorius / England
11.
Shaker –incubator Thermo / Germany
12.
Spectrophotometer
Cecil / England
13.
Universal centrifuge
Universal 16A/ Germany
14.
Variant system
BIO –RAD / U.S.A
15.
Vortex mixer
Stuart / England
16. Water bath Memmert / Germany
29
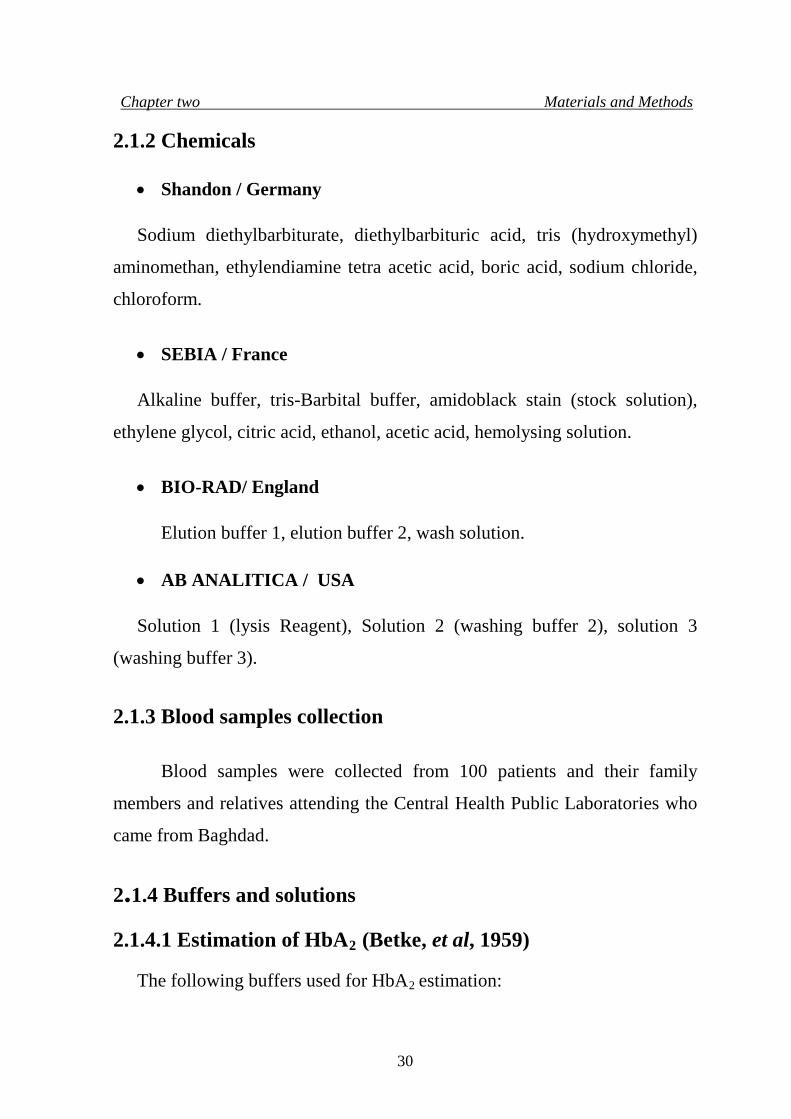
Chapter two Materials and Methods 2.1.2 Chemicals
• Shandon / Germany Sodium diethylbarbiturate, diethylbarbituric acid, tris (hydroxymethyl)
aminomethan, ethylendiamine tetra acetic acid, boric acid, sodium chloride,
chloroform.
• SEBIA / France Alkaline buffer, tris-Barbital buffer, amidoblack stain (stock solution),
ethylene glycol, citric acid, ethanol, acetic acid, hemolysing solution.
• BIO-RAD/ England
Elution buffer 1, elution buffer 2, wash solution. • AB ANALITICA / USA Solution 1 (lysis Reagent), Solution 2 (washing buffer 2), solution 3
(washing buffer 3).
2.1.3 Blood samples collection
Blood samples were collected from 100 patients and their family
members and relatives attending the Central Health Public Laboratories who
came from Baghdad.
2.1.4 Buffers and solutions 2.1.4.1 Estimation of HbA2 (Betke, et al, 1959)
The following buffers used for HbA2 estimation:
30
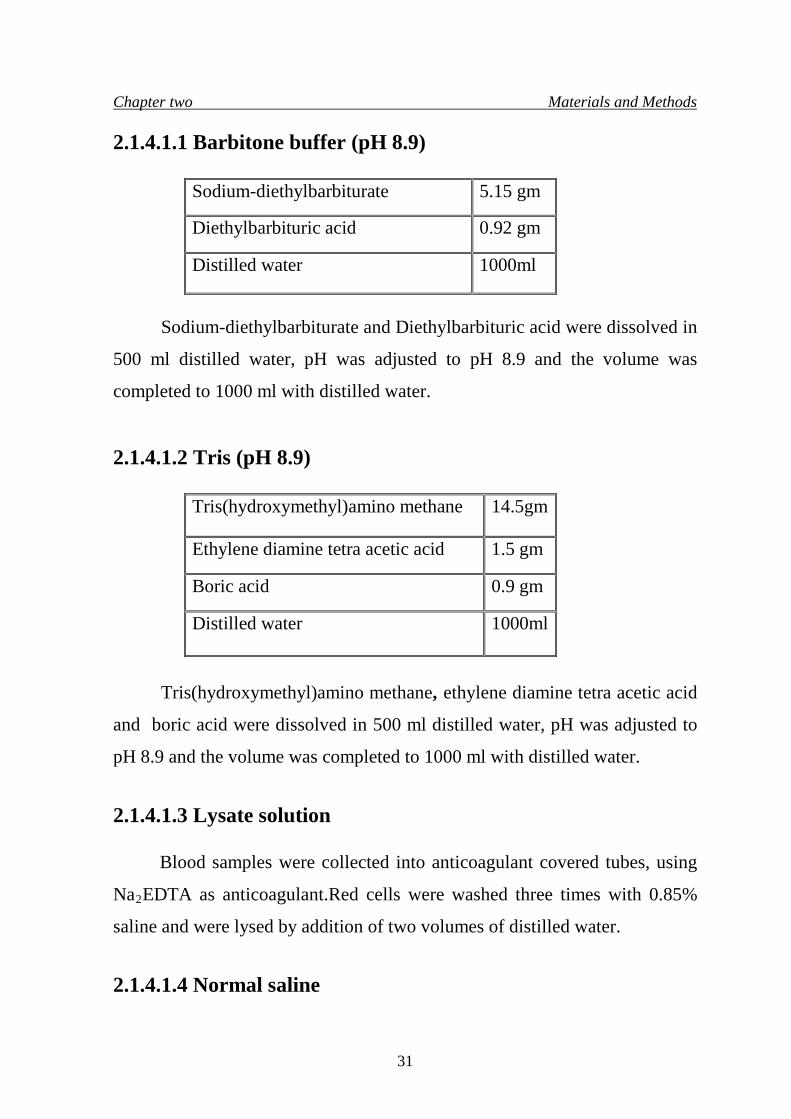
Chapter two Materials and Methods 2.1.4.1.1 Barbitone buffer (pH 8.9)
Sodium-diethylbarbiturate 5.15 gm
Diethylbarbituric acid 0.92 gm
Distilled water 1000ml
Sodium-diethylbarbiturate and Diethylbarbituric acid were dissolved in
500 ml distilled water, pH was adjusted to pH 8.9 and the volume was
completed to 1000 ml with distilled water.
2.1.4.1.2 Tris (pH 8.9)
Tris(hydroxymethyl)amino methane 14.5gm
Ethylene diamine tetra acetic acid 1.5 gm
Boric acid 0.9 gm
Distilled water 1000ml
Tris(hydroxymethyl)amino methane, ethylene diamine tetra acetic acid
and boric acid were dissolved in 500 ml distilled water, pH was adjusted to
pH 8.9 and the volume was completed to 1000 ml with distilled water.
2.1.4.1.3 Lysate solution
Blood samples were collected into anticoagulant covered tubes, using
Na2EDTA as anticoagulant.Red cells were washed three times with 0.85%
saline and were lysed by addition of two volumes of distilled water.
2.1.4.1.4 Normal saline
31
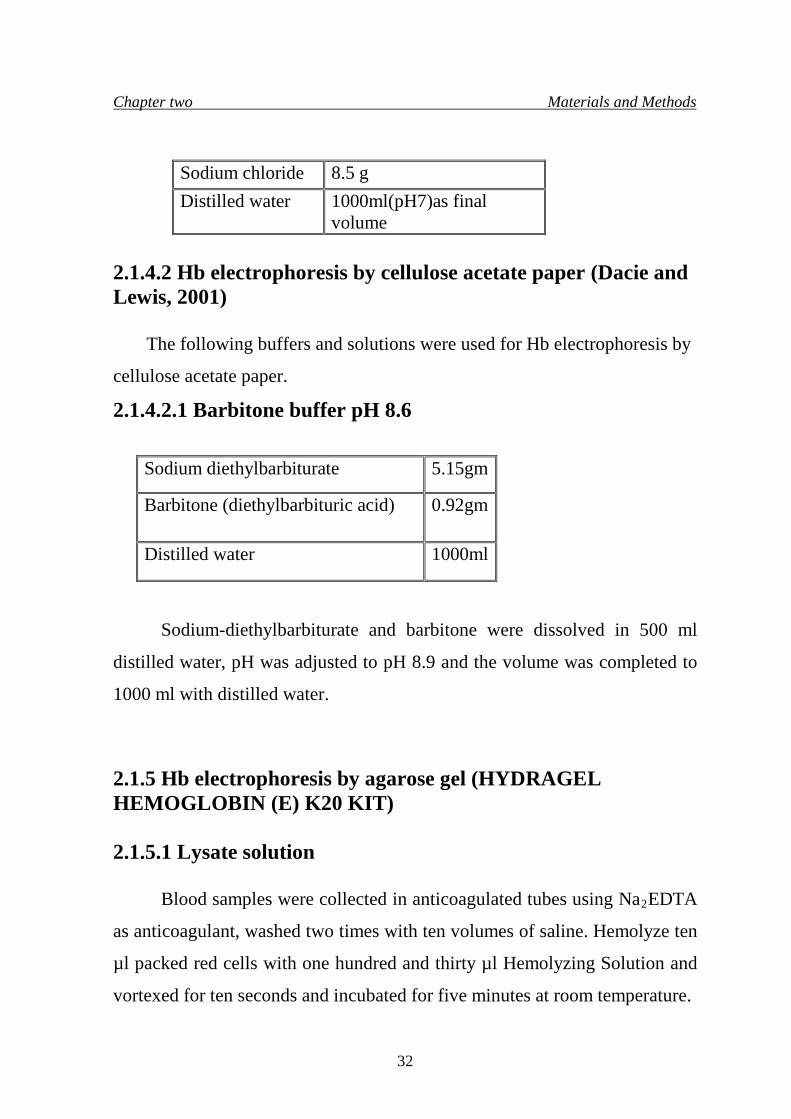
Chapter two Materials and Methods
Sodium chloride 8.5 g Distilled water 1000ml(pH7)as final
volume
2.1.4.2 Hb electrophoresis by cellulose acetate paper (Dacie and Lewis, 2001)
The following buffers and solutions were used for Hb electrophoresis by
cellulose acetate paper.
2.1.4.2.1 Barbitone buffer pH 8.6
Sodium-diethylbarbiturate and barbitone were dissolved in 500 ml
distilled water, pH was adjusted to pH 8.9 and the volume was completed to
1000 ml with distilled water.
2.1.5 Hb electrophoresis by agarose gel (HYDRAGEL HEMOGLOBIN (E) K20 KIT)
2.1.5.1 Lysate solution
Blood samples were collected in anticoagulated tubes using Na2EDTA
as anticoagulant, washed two times with ten volumes of saline. Hemolyze ten
µl packed red cells with one hundred and thirty µl Hemolyzing Solution and
vortexed for ten seconds and incubated for five minutes at room temperature.
Sodium diethylbarbiturate 5.15gm
Barbitone (diethylbarbituric acid) 0.92gm
Distilled water 1000ml
32
Chapter two Materials and Methods
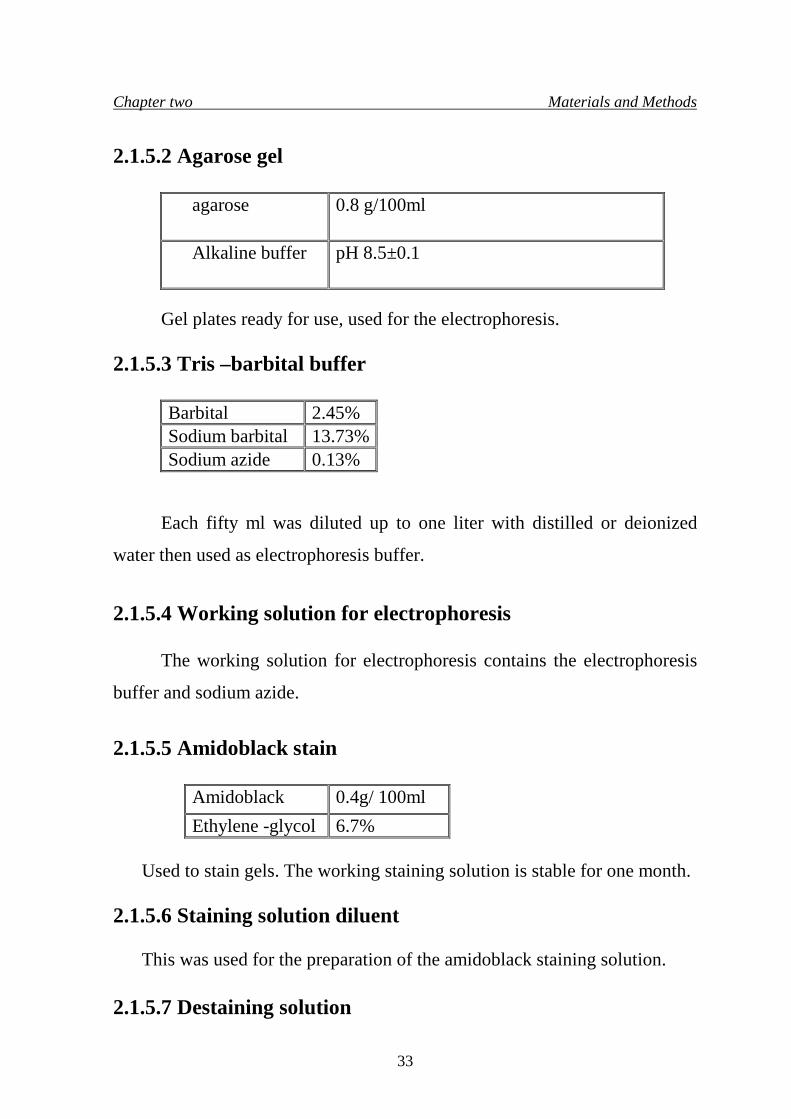
2.1.5.2 Agarose gel
agarose
0.8 g/100ml
Alkaline buffer
pH 8.5±0.1
Gel plates ready for use, used for the electrophoresis.
2.1.5.3 Tris –barbital buffer
Barbital 2.45% Sodium barbital 13.73% Sodium azide 0.13%
Each fifty ml was diluted up to one liter with distilled or deionized
water then used as electrophoresis buffer.
2.1.5.4 Working solution for electrophoresis
The working solution for electrophoresis contains the electrophoresis
buffer and sodium azide.
2.1.5.5 Amidoblack stain
Amidoblack 0.4g/ 100ml Ethylene -glycol 6.7%
Used to stain gels. The working staining solution is stable for one month.
2.1.5.6 Staining solution diluent This was used for the preparation of the amidoblack staining solution.
2.1.5.7 Destaining solution
33
Chapter two Materials and Methods
Each vial of stock destaining solution to be diluted up to hundred liters
with distilled or deionized water. It is convenient to dilute only one ml of the
stock solution to one liter .After dilution, the working destaining solution
contains:
The stock of destaining solution was stored at room temperature or
refrigerated.It is stable until the expiration date indicated on the kit package or
destaining solution vial label.Working destaining solution is stable for one
week at room temperature in closed bottle.
2.1.5.8 Hemolyzing solution
Hemolyzing solution is a buffer with additives, nonhazardous at the
concentration used, necessary for optimum performance, usually stored at
room temperature or refrigerated, it is stable until the expiration date indicated
on the kit package or Hemolyzing solution vial label.
2.1.5.9 Fixative solution
This solution contains (vol. /vol.):
60% ethanol 10% acetic acid 30% distilled or deionized water
Mixed well, stored at room temperature, tightly capped to prevent
evaporation and it was discarded after three months.
Citric acid 0.05 g/100ml
34
Chapter two Materials and Methods
2.1.6 MS9 devise (automatic full digital cell counter) (BIO –
RAD)
This technique was used for obtaining complete blood picture (Hb, PCV,
MCV,MCHC, MCH, RBC count,WBC count, platelets count, and differential
count).The technique depends on electrical impedance technology as a
principle of its work.
2.1.7 Hb analysis by variant beta thalassemia short program
This technique is used for automatic Hb separation to obtain different Hb
structure with their percentage in a blood sample. Different Hb molecules can
be separated by this devise such as: (HbA, HbA2, HbF, HbS, HbC, and HbD),
utilizing the principle of cation –exchange of High Performance Liquid
Chromatography (HPLC).
2.1.8 Leishman stain (Frei et al., 1995)
Leishman powder 1.5 gm Methanol (absolute) 1000 ml
The mixture was heated to 50˚C and allowed to cool at room
temperature and shaked several times during the day after standing for 24
hour, it was filtered to obtain clear stain.
2.1.9 Isolation of DNA from whole blood
The AB ANALITICA kit was used to isolate DNA from whole
blood.The kit contains:
35
Chapter two Materials and Methods
Solution 1 (lysis reagent) Solution 2 (washing buffer 2) Solution 3 (washing buffer 3) Filter columns Tubes and caps
Solution 1 should be shaken before use to resuspend the binding resin.
2.1.10 PCR Amplification The following reagents were used for PCR amplification.
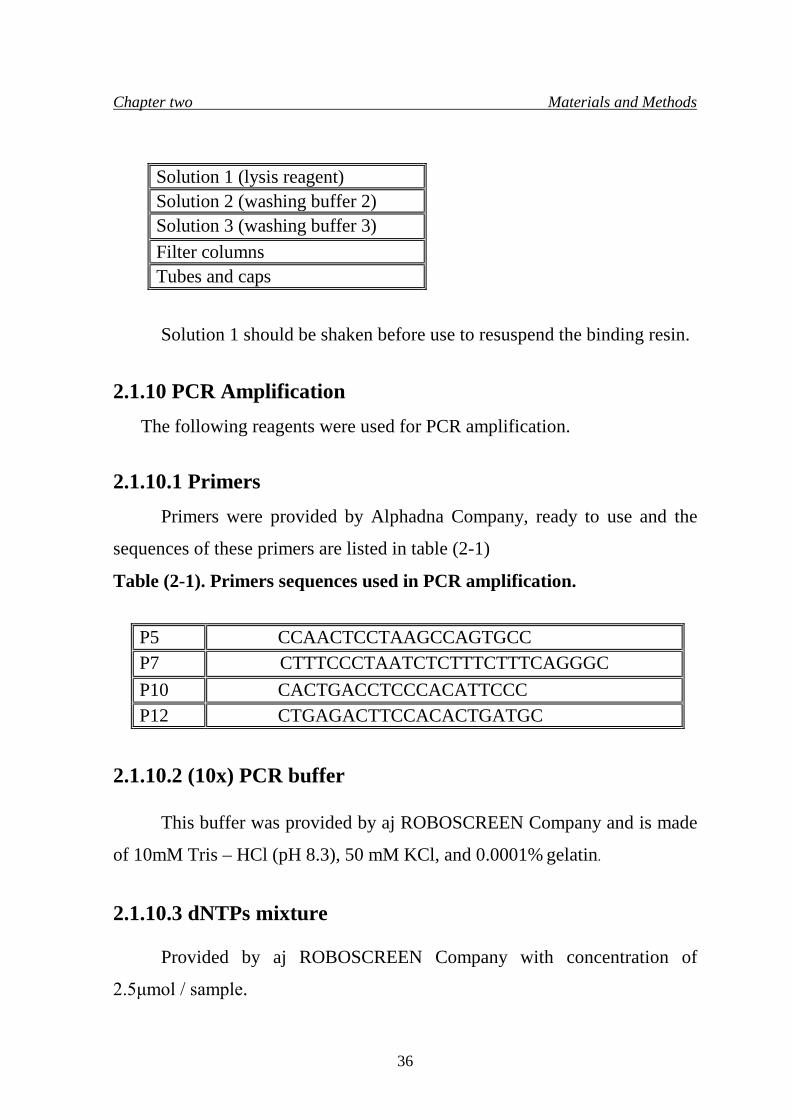
2.1.10.1 Primers
Primers were provided by Alphadna Company, ready to use and the
sequences of these primers are listed in table (2-1)
Table (2-1). Primers sequences used in PCR amplification.
P5 CCAACTCCTAAGCCAGTGCC P7 CTTTCCCTAATCTCTTTCTTTCAGGGC P10 CACTGACCTCCCACATTCCC P12 CTGAGACTTCCACACTGATGC
2.1.10.2 (10x) PCR buffer
This buffer was provided by aj ROBOSCREEN Company and is made
of 10mM Tris – HCl (pH 8.3), 50 mM KCl, and 0.0001% gelatin.
2.1.10.3 dNTPs mixture
Provided by aj ROBOSCREEN Company with concentration of
2.5μmol / sample.
36
Chapter two Materials and Methods
2.1.10.4 Taq polymerase
Provided by aj ROBOSCREEN Company in a concentration of 5u /μl
of the enzyme.
2.1.10.5 Bsu 36I
Restriction enzyme, provided by Promega Company, in a concentration
of 10u / 5μl.
2.2 Methods
2.2.1 Sterilization methods
• Autoclaving : buffers and solutions were sterilized by pressure
vessel (autoclave) at 121˚ C and 15 Ib/ In2 for 15 minutes.
• Dry heat: a laboratory oven was used for glassware sterilization.
Glassware were placed in the oven at 180˚ C for 2 hours.
2.2.2 Preparation of Hb electrophoresis by cellulose acetate
paper (Dacie and Lewis, 2001)
1. Blood lysate prepared according to (2.1.4.1.3).
2. Distilled water added to the precipitate at twice the volume of the
precipitate, shaked by hands for two minutes , then left for an hour.
3. Five or six drops of chloroform is added then shaked for four minutes
then centrifuged at 3500 rpm for 15 minutes.
4. The lysate was removed by Pasteur pipette.
5. With the power supply is still disconnected, the compartments of electrop-
horesis tank were filled with barbitone buffer, the wicks were soaked and
37
Chapter two Materials and Methods
positioned in place.
6. The cellulose paper was soaked in barbitone buffer for at least 5 minutes.
The paper was immersed slowly to avoid trapping air bubbles and ensure
even saturation of the membrane.
7. The membrane was placed between two pieces of absorbent papers.
8. A small volume (10 µl) of each sample was placed into the sample well.
9.The applicator was dipped into the sample wells, and the samples were
applied to cellulose-acetate membrane approximately 2 cm from one end
of the membrane, the tips of the applicator were allowed to remain in
contact with the membrane for 3 seconds.
10. The cellulose-acetate membrane was then placed across the bridge of the
tank so that the membrane surface is in contact with the buffer, with the
line of the cathode end.
11. The power supply was connected and run at 280-300 volt for 20 minutes
or until a visible separation was obtained.
12.The power supply was disconnected and the cellulose -acetate membrane
was removed .Followed by HbA2 estimation steps.
2.2.3 Estimation of HbA2 (Marengo and Rowe, 1965)
1. Following the electrophoresis of blood samples carried according to
(2.2.2), the HbA2 estimation was done by cutting the strip containing the
HbA band and placed in a universal bottle containing 20 ml of
distilled water. The HbA2 band was also eluted from strip in a universal
bottle containing 4 ml of distilled water.
2. The universal bottles were placed on rotating mixer for 15 minutes.
3. The absorbance was read at 413 nm for HbA2 and HbA.
4. The percentage of HbA2 was calculated as following:-
38
Chapter two Materials and Methods
%HbA2 = {A413 HbA2 / [A413HbA2 + (A413HbA x 5)] x 100
2.2.4 Preparation of blood films on slides (Ingram and Minter, 1969)
1. A drop of patients' blood was placed on in the center of a glass slide and
spread on the glass in a monolayer.
2. The blood film was stained with Leishman stain for 5-7 minutes.
3. The film was then washed with distilled water for 10 minutes, dried, and
examined.
2.2.5 Variant beta thalassemia short program
2.2.5.1 Specimens collection At least 5µl of venous blood are required for this test. Whole blood
specimens should be collected in a vacuum blood collection tube containing
EDTA as an anticoagulant. Patient specimens are stable for 7 days when
stored at 2-8 ºC.
2.2.5.2 Sample preparation and analysis 1. Five µl of whole blood from each patient sample was pipetted into separate
1.5 ml sample vial, then 1.0 ml of Hemolysis Reagent was added to each
sample vial, covered parafilm and mixed by inversion.
2. The sample vial was placed into the VARIANT devise. The hemolysate are
stable for 24 hours when stored at 2-8 ºC.
3. Then the analysis was carried out by using the β- thalassemia short
program in which samples were placed in the devise and the analysis done
automatically on them. 2.2.6 Preparation of Hb electrophoresis by agarose gel
39
Chapter two Materials and Methods
2.2.6.1 Sample preparation 1. Anticoagulated blood was centrifuged at 5000 rpm for five minutes, the
plasma was discarded.
2. The red blood cells pellets washed two times with ten volumes of saline.
3. Ten µl of washed packed red cells were hemolyzed with one hundred and
thirty µl of Hemolyzing Solution, then vortexed for ten seconds and
incubated for five minutes at room temperature.
2.2.6.2 Procedure
I. Migration step:
1. HYDRAGEL K20 applicator was placed on a flat surface and raised the
part of the applicator carrier with the numbered notches.
2. One hundred and twenty µl distilled water was pooled on the lower third of
the frame printed on the HYDRAGEL K20 applicator carrier.
3. The HYDRAGEL agarose gel plate was unpacked.
4. One thin filter paper was rolled onto the gel surface to absorb the excess of
liquid. Remove the paper immediately .Do not leave the filter paper for a
too long contact with the gel to avoid its dehydration.
5. The plate was placed (the gel side up) with its edge against the stop at the
bottom of the printed frame.
6. The gel was bended and lowered down onto the water pool; with no air
bubbles are trapped. Water is spread underneath the entire gel plate and the
gel is lined up with the printed frame.
7. The applicator carrier was lowered with the numbered notches down to the
intermediate position with the switch in high position.
40
Chapter two Materials and Methods
8. The applicator was placed on a flat surface with the well numbers in the
right –side –up position.
9. Ten µl of hemolyzed sample was added into the applicator wells; loaded
within two minutes. Then it was placed on the applicator carrier and
lowered, so that the applicator contacts the gel surface for one minute,
then the switch was turned to rise up the applicator, after that it was
removed and then discarded.
10. The gel was placed into an appropriate electrophoresis chamber according
to the polarity indicated on the gel, the lower side of the gel on the
cathodic side.
11. The chamber was plugged to the power supply.
Migration condition
K20
Volume of buffer per compartment 150 ml
Total buffer volume 300 ml
Migration time 15 minutes
Constant voltage 165 v
Initial current (per gel ) 7±2 mA
12. After migration, the chamber was unplugged and the gel plate was
removed.
II. Fixation:
The gel plate was dried completely in the incubator –dryer at 80º C (for
ten minutes minimum).
III. Staining –Destaining:
1. The dried and cooled gel was immersed in the staining solution for five
41
Chapter two Materials and Methods
minutes, and then it was placed into three baths containing destaining
solution until the background was completely colorless and clear.
2. The gel was dried completely with hot 80ºC airs 2.2.7 MS9 (automatic full digital cell counter)
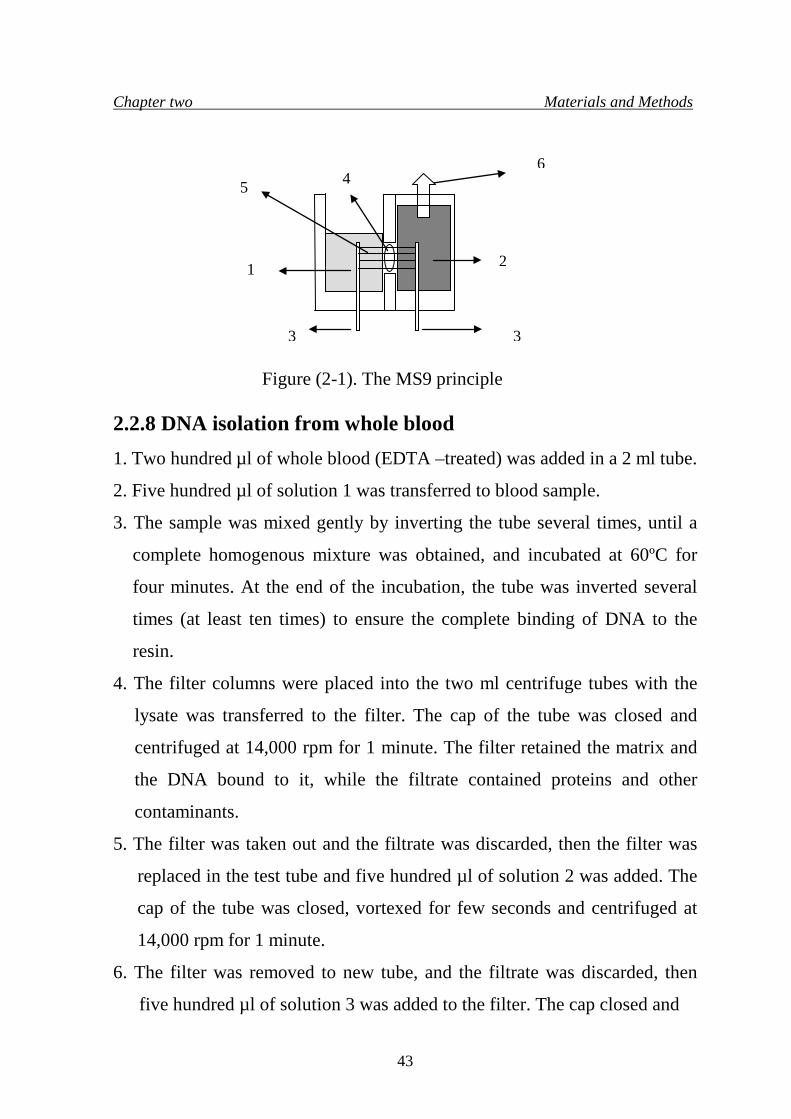
2.2.7.1 Principle
The MS9 principle is impendancemetrie:-
• Mechanical structure:-
The measuring chamber is made of 2 parts: one part (1) is to receipt the
dilute in which are the blood cells to analyze and count. The other part filled
with detergent, is the aspiration part, (2) in which a vacuum is applied (6) the
blood cell dilution of the first part cross by aspiration a calibrated aperture (4)
which separates both of them.
• Electrical structure:-
Two electrodes (3) are in both of these two parts of measuring
chamber. A constant current (5) is established between these two electrodes
across the aperture.
• Phenomena :-
When a cell, coming from the whole blood dilution part, passes by a
simple mechanical aspiration, to the aspiration part (1) because of its different
resistivity in front the diluent one, the cell disturbs the constant current
established between the two electrodes and generates a pulse (3). Figure (2-1)
illustrate the MS9 principle.
42
Chapter two Materials and Methods
Figure (2-1). The MS9 principle
2.2.8 DNA isolation from whole blood 1. Two hundred µl of whole blood (EDTA –treated) was added in a 2 ml tube. 2. Five hundred µl of solution 1 was transferred to blood sample.
3. The sample was mixed gently by inverting the tube several times, until a
complete homogenous mixture was obtained, and incubated at 60ºC for
four minutes. At the end of the incubation, the tube was inverted several
times (at least ten times) to ensure the complete binding of DNA to the
resin.
4. The filter columns were placed into the two ml centrifuge tubes with the
lysate was transferred to the filter. The cap of the tube was closed and
centrifuged at 14,000 rpm for 1 minute. The filter retained the matrix and
the DNA bound to it, while the filtrate contained proteins and other
contaminants.
5. The filter was taken out and the filtrate was discarded, then the filter was
replaced in the test tube and five hundred µl of solution 2 was added. The
cap of the tube was closed, vortexed for few seconds and centrifuged at
14,000 rpm for 1 minute.
6. The filter was removed to new tube, and the filtrate was discarded, then
five hundred µl of solution 3 was added to the filter. The cap closed and
4 5 6
3 3
1
2
43
Chapter two Materials and Methods
incubated for two to four minutes at room temperature and centrifuged at
14,000 rpm for 1 minute.
7. Five hundred µl of ethanol 80% was added, so that any salt traces were
removed from the sample.
8. The filter was removed and placed into a new 1.5 ml Eppendorf and 100 µl
of 65-70ºC preheated water was added, vortexed for few seconds to
resuspend the resin and then the tube was allowed to stand for 2-5 minutes
at 65-70ºC to obtain the complete DNA releasing. The tube was vortexed
again and centrifuged at 14,000 rpm for 1 minute, to avoid DNA breaking,
the resin was resuspended with a pipette's tip instead of vortexing.
9. The filter was removed; the DNA contained in the filtrate is stable for some
weeks if stored at 4ºC and for at least one year if it is stored at -20ºC.
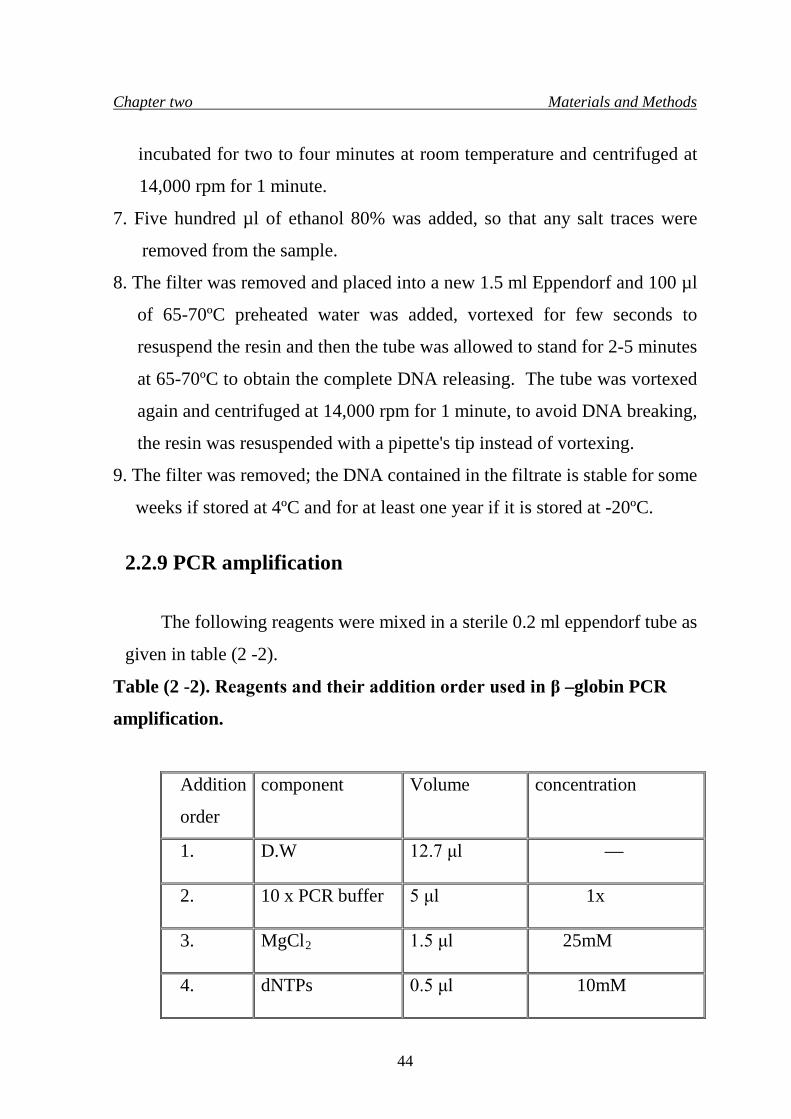
2.2.9 PCR amplification
The following reagents were mixed in a sterile 0.2 ml eppendorf tube as
given in table (2 -2).
Table (2 -2). Reagents and their addition order used in β –globin PCR
amplification.
Addition
order
component Volume concentration
1. D.W 12.7 μl —
2. 10 x PCR buffer 5 μl 1x
3. MgCl2 1.5 μl 25mM
4. dNTPs 0.5 μl 10mM
44
Chapter two Materials and Methods
5. primer 1.5 μl from each primer
10 pmol for each primer
6. Taq polymerase 0.3 μl 1.5 u /R
7. DNA 2 μl —
total 25μl —
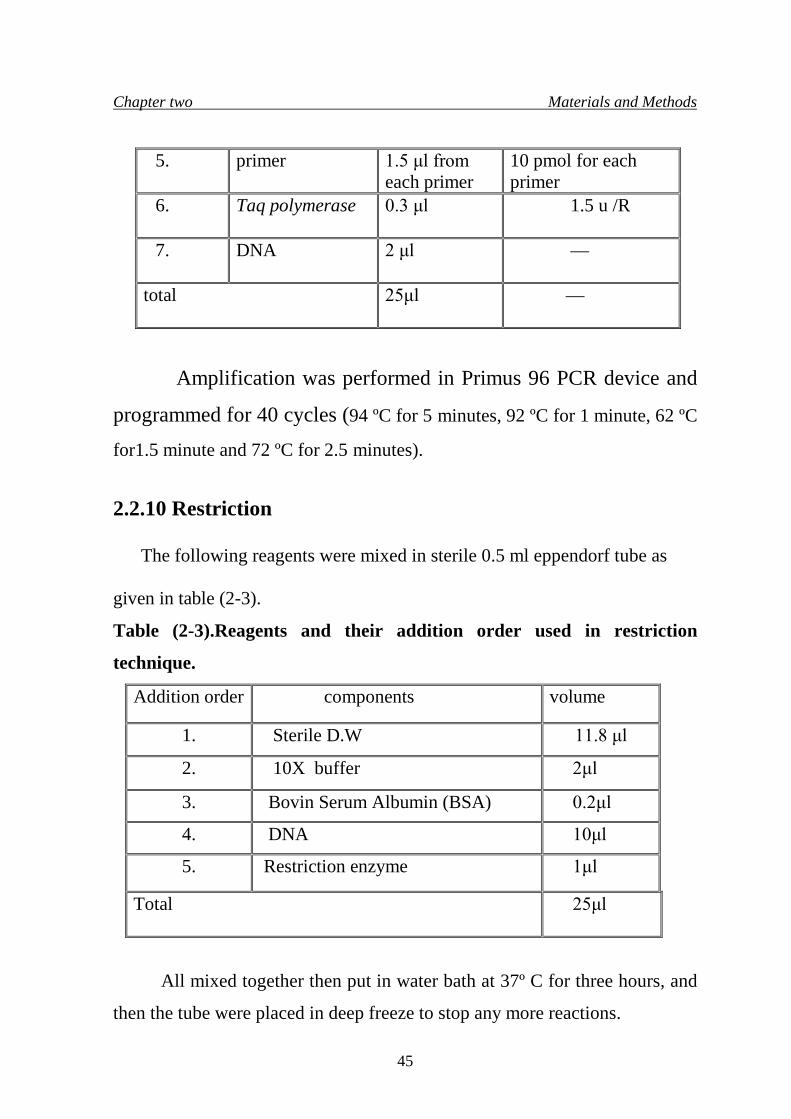
Amplification was performed in Primus 96 PCR device and
programmed for 40 cycles (94 ºC for 5 minutes, 92 ºC for 1 minute, 62 ºC
for1.5 minute and 72 ºC for 2.5 minutes).
2.2.10 Restriction
The following reagents were mixed in sterile 0.5 ml eppendorf tube as
given in table (2-3).
Table (2-3).Reagents and their addition order used in restriction
technique.
Addition order components volume
1. Sterile D.W 11.8 μl
2. 10X buffer 2μl
3. Bovin Serum Albumin (BSA) 0.2μl
4. DNA 10μl
5. Restriction enzyme 1μl
Total 25μl
All mixed together then put in water bath at 37º C for three hours, and
then the tube were placed in deep freeze to stop any more reactions.
45
Chapter three Results and Discussion
3. Results and Discussion
In this study 100 β –thalassemia carriers and their families attending
Central Public Health laboratory have been subjected to following analysis to
ascertain their status:
1. Pedigree analysis of families with β –thalassemia syndrome.
2. Red blood cells indices.
3. Hemoglobin analysis (Al –Awamy, 2000).
3.1 Pedigree analysis of families showing β –thalassemia
syndrome
Pedigree analysis might show how presumably healthy looking parents
will give rise to children with β –thalassemia major, thus in the following six
samples, it was possible to demonstrate the risk behind marriage of β –
thalassemia minor individuals. The squares with light and dark sides
represent a male with thalassemia minor, and the circles with light and dark
sides represent female with thalassemia minor, dark square and circle
represent an affected male and female with β –thalassemia major,
respectively. The six examples as listed below, summarized all forms of the
disease inheritance that found in families under this study, and some cases
showed the coexistence of another inherited disease beside the β –thalassemia
syndrome.
3.1.1 First case: is represented by a family composed of eight individuals
as in figure (3-1)
46
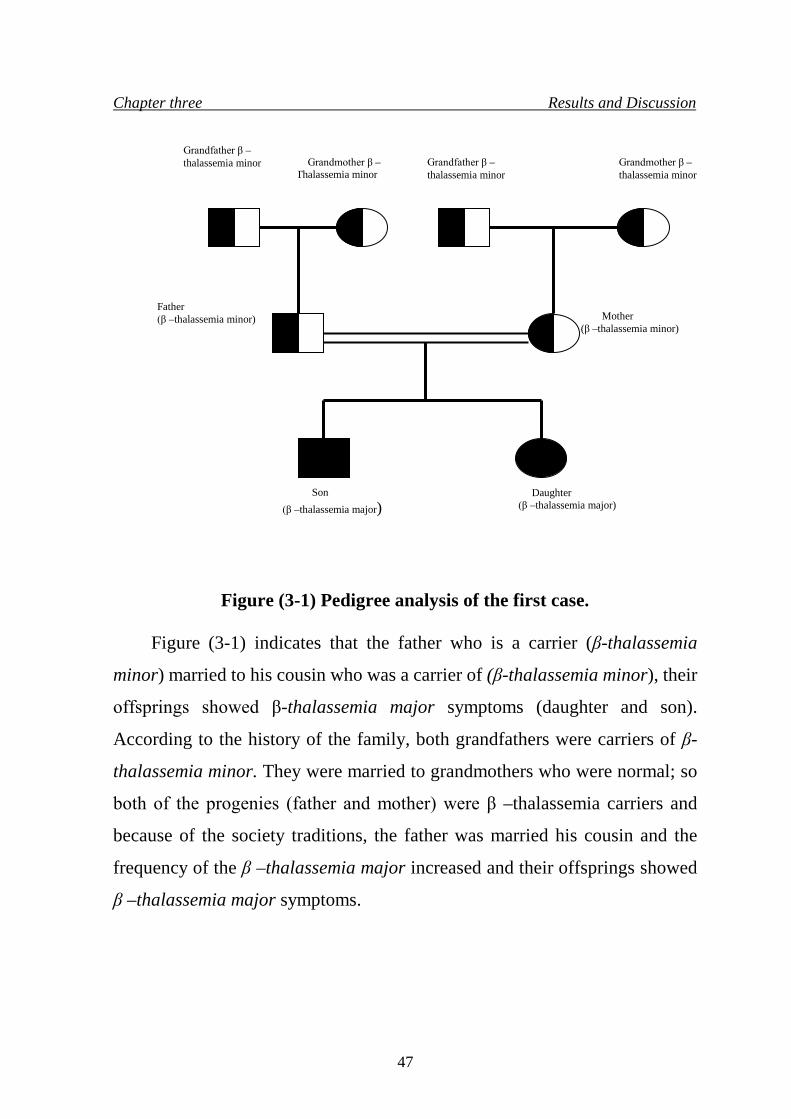
Chapter three Results and Discussion
Figure (3-1) Pedigree analysis of the first case.
Figure (3-1) indicates that the father who is a carrier (β-thalassemia
minor) married to his cousin who was a carrier of (β-thalassemia minor), their
offsprings showed β-thalassemia major symptoms (daughter and son).
According to the history of the family, both grandfathers were carriers of β-
thalassemia minor. They were married to grandmothers who were normal; so
both of the progenies (father and mother) were β –thalassemia carriers and
because of the society traditions, the father was married his cousin and the
frequency of the β –thalassemia major increased and their offsprings showed
β –thalassemia major symptoms.
Son (β –thalassemia major)
Daughter (β –thalassemia major)
Father (β –thalassemia minor)
Grandmother β – Thalassemia minor
Grandfather β –thalassemia minor Grandmother β –
thalassemia minor Grandfather β –thalassemia minor
Mother (β –thalassemia minor)
47
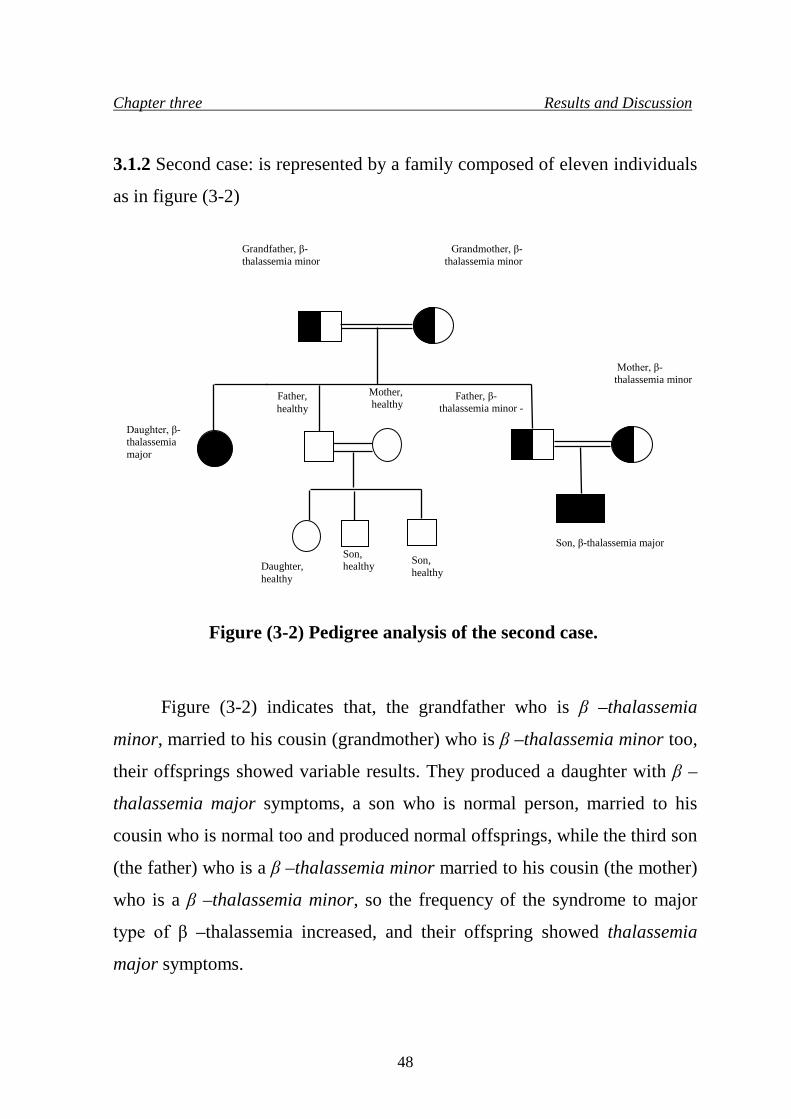
Chapter three Results and Discussion
3.1.2 Second case: is represented by a family composed of eleven individuals
as in figure (3-2)
Figure (3-2) Pedigree analysis of the second case.
Figure (3-2) indicates that, the grandfather who is β –thalassemia
minor, married to his cousin (grandmother) who is β –thalassemia minor too,
their offsprings showed variable results. They produced a daughter with β –
thalassemia major symptoms, a son who is normal person, married to his
cousin who is normal too and produced normal offsprings, while the third son
(the father) who is a β –thalassemia minor married to his cousin (the mother)
who is a β –thalassemia minor, so the frequency of the syndrome to major
type of β –thalassemia increased, and their offspring showed thalassemia
major symptoms.
Daughter, healthy
Son, healthy
Son, healthy
Father, healthy
Mother, healthy
Daughter, β-thalassemia major
Father, β- thalassemia minor -
Mother, β-thalassemia minor
Grandfather, β-thalassemia minor
Grandmother, β-thalassemia minor
Son, β-thalassemia major
48
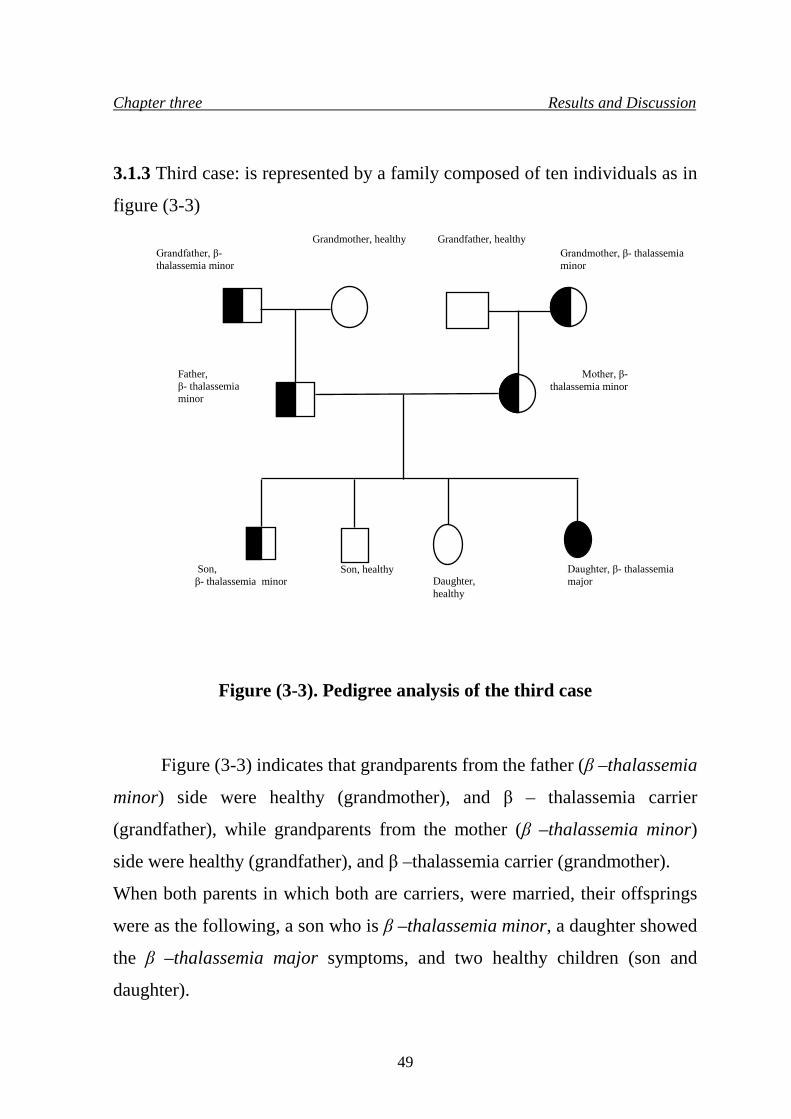
Chapter three Results and Discussion
3.1.3 Third case: is represented by a family composed of ten individuals as in
figure (3-3)
Figure (3-3). Pedigree analysis of the third case
Figure (3-3) indicates that grandparents from the father (β –thalassemia
minor) side were healthy (grandmother), and β – thalassemia carrier
(grandfather), while grandparents from the mother (β –thalassemia minor)
side were healthy (grandfather), and β –thalassemia carrier (grandmother).
When both parents in which both are carriers, were married, their offsprings
were as the following, a son who is β –thalassemia minor, a daughter showed
the β –thalassemia major symptoms, and two healthy children (son and
daughter).
Son, β- thalassemia minor
Son, healthy
Daughter, healthy
Daughter, β- thalassemia major
Mother, β- thalassemia minor
Father, β- thalassemia minor
Grandfather, β- thalassemia minor
Grandmother, healthy Grandfather, healthy Grandmother, β- thalassemia minor
49
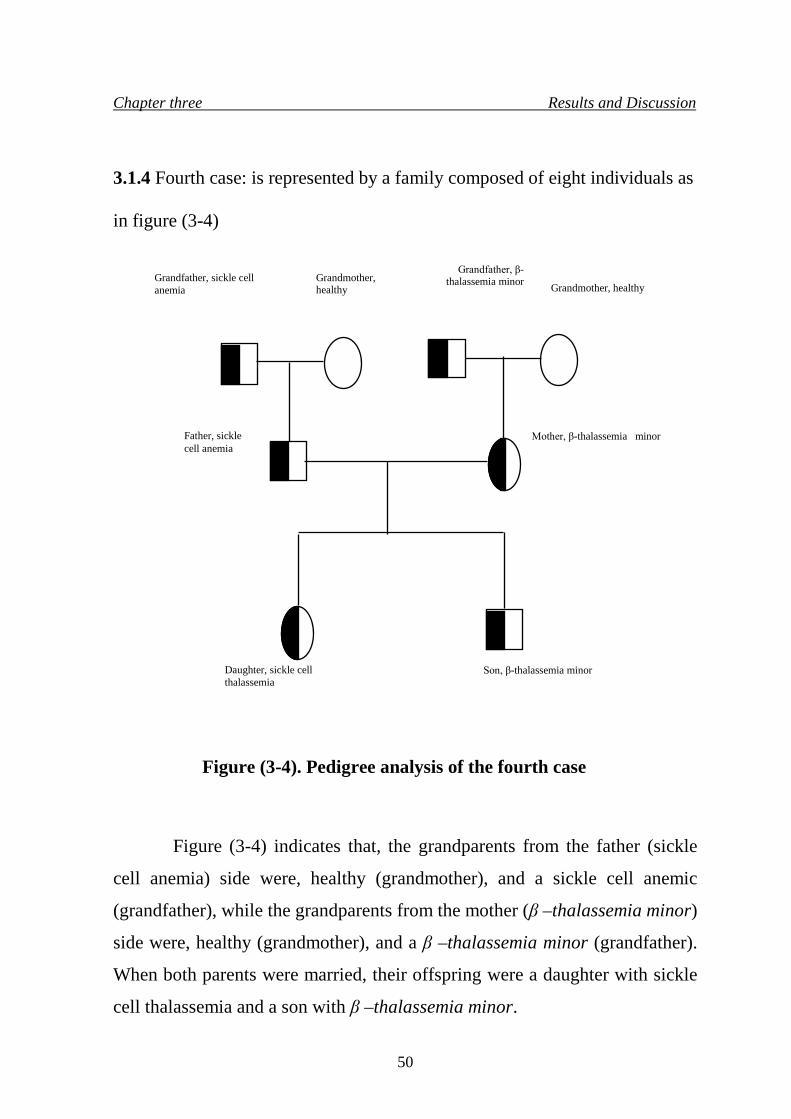
Chapter three Results and Discussion
3.1.4 Fourth case: is represented by a family composed of eight individuals as
in figure (3-4)
Figure (3-4). Pedigree analysis of the fourth case
Figure (3-4) indicates that, the grandparents from the father (sickle
cell anemia) side were, healthy (grandmother), and a sickle cell anemic
(grandfather), while the grandparents from the mother (β –thalassemia minor)
side were, healthy (grandmother), and a β –thalassemia minor (grandfather).
When both parents were married, their offspring were a daughter with sickle
cell thalassemia and a son with β –thalassemia minor.
Daughter, sickle cell thalassemia
Father, sickle cell anemia
Grandfather, sickle cell anemia
Grandmother, healthy
Grandmother, healthy
Grandfather, β-thalassemia minor
Mother, β-thalassemia minor
Son, β-thalassemia minor
50
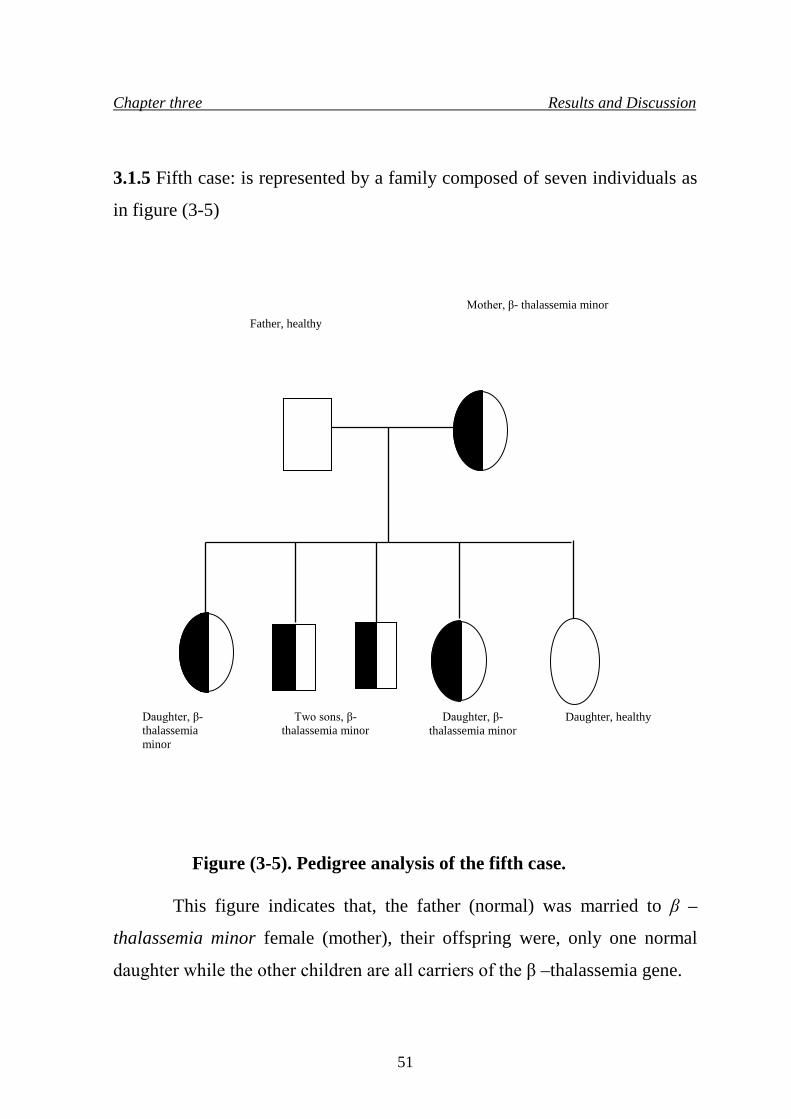
Daughter, β- thalassemia minor
Daughter, healthy
Mother, β- thalassemia minor
Father, healthy
Daughter, β- thalassemia minor
Two sons, β- thalassemia minor
Chapter three Results and Discussion
3.1.5 Fifth case: is represented by a family composed of seven individuals as
in figure (3-5)
Figure (3-5). Pedigree analysis of the fifth case.
This figure indicates that, the father (normal) was married to β –
thalassemia minor female (mother), their offspring were, only one normal
daughter while the other children are all carriers of the β –thalassemia gene.
51
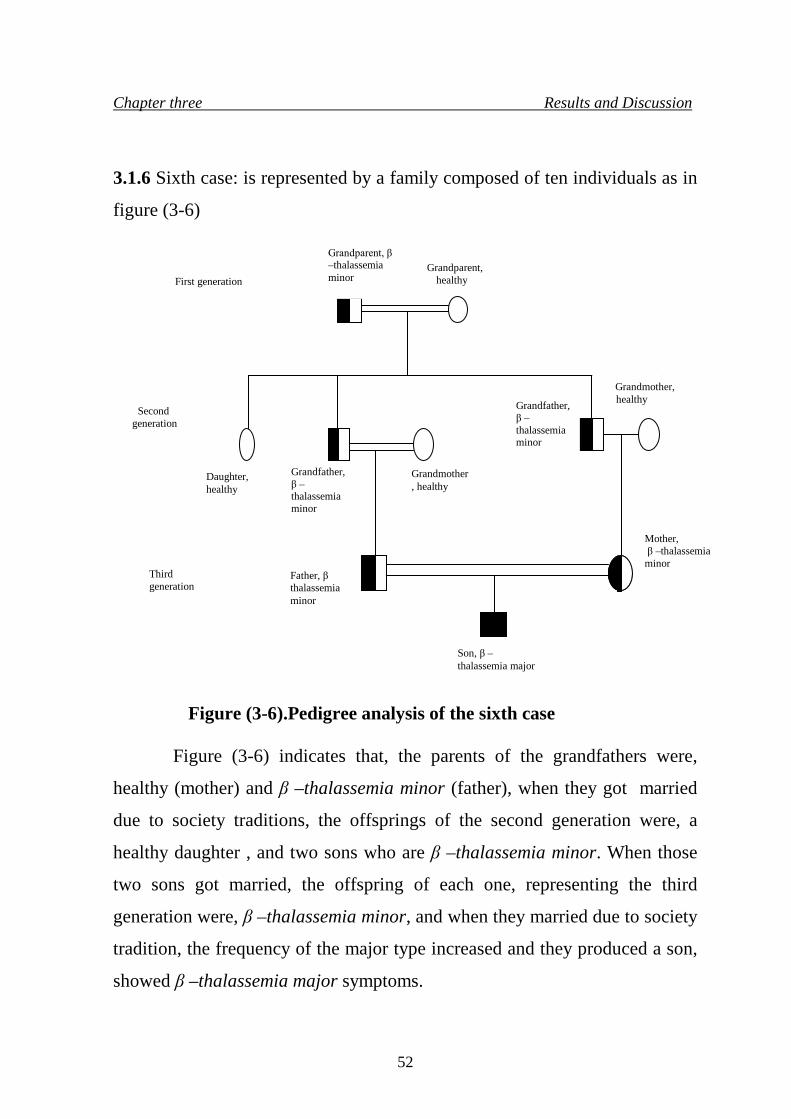
Chapter three Results and Discussion
3.1.6 Sixth case: is represented by a family composed of ten individuals as in
figure (3-6)
Figure (3-6).Pedigree analysis of the sixth case
Figure (3-6) indicates that, the parents of the grandfathers were,
healthy (mother) and β –thalassemia minor (father), when they got married
due to society traditions, the offsprings of the second generation were, a
healthy daughter , and two sons who are β –thalassemia minor. When those
two sons got married, the offspring of each one, representing the third
generation were, β –thalassemia minor, and when they married due to society
tradition, the frequency of the major type increased and they produced a son,
showed β –thalassemia major symptoms.
Grandmother, healthy
Grandmother, healthy
Grandfather, β –thalassemia minor
Daughter, healthy
Grandparent, healthy
Grandparent, β –thalassemia minor
Grandfather, β –thalassemia minor
Father, β thalassemia minor
Mother, β –
thalassemia
Son, β –thalassemia major
Mother, β –thalassemia minor
First generation
Second generation
Third generation
52
Chapter three Results and Discussion
3.2 Hematological analysis of β –thalassemia
3.2.1 Complete blood picture (blood count and film) The blood count and film provide valuable information useful in the
diagnosis of both α and β thalassemia, it is also useful to investigate the
presence of other structural variants combined with thalassemia, by observing
the morphological characteristics of the red blood cells and the presence of
other abnormal cells in the blood smear, for this all the families were
investigated for blood count and film. Generally, in most carriers the results
showed the same values, in which, carriers have blood count of low MCH (19
-26) pg, MCV (62-65) fl, Hb (11- 12) g/dl, PCV (32-38) %, these values are
low as compared with normal values, while blood film showed microcytic
hypochromic red blood cells, and few target and oval cells in comparison with
normal blood film.
53
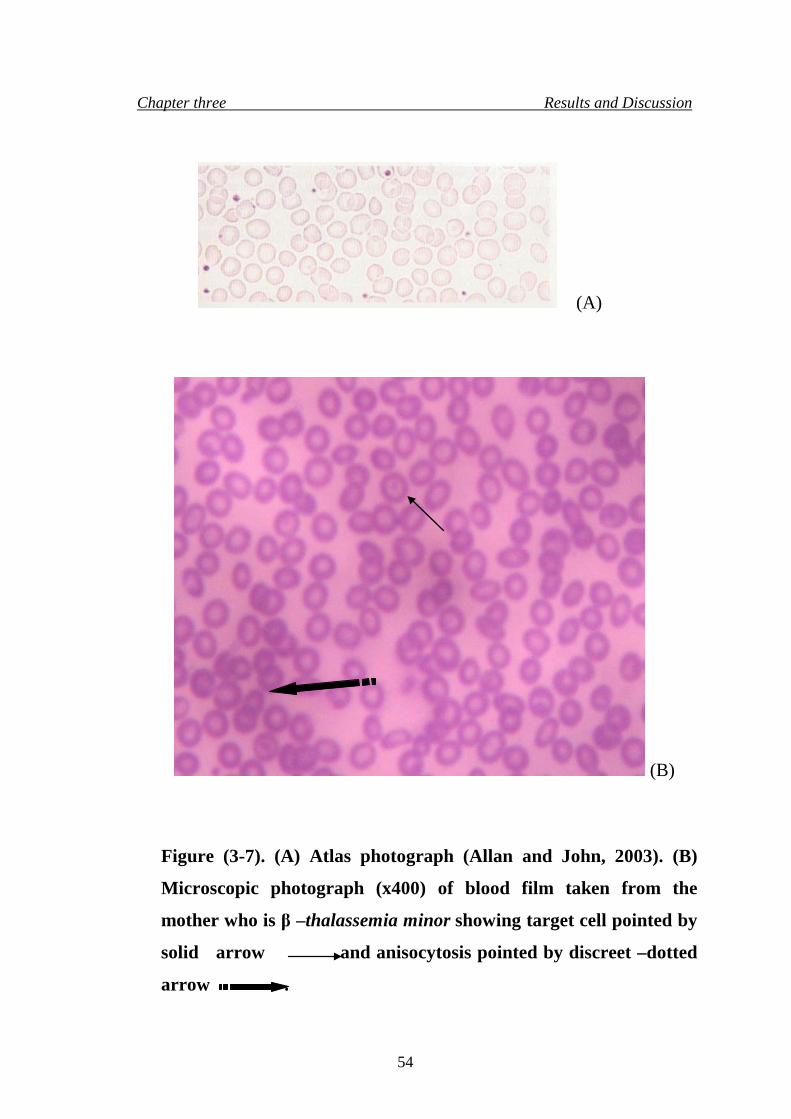
Chapter three Results and Discussion
(A)
(B)
Figure (3-7). (A) Atlas photograph (Allan and John, 2003). (B)
Microscopic photograph (x400) of blood film taken from the
mother who is β –thalassemia minor showing target cell pointed by
solid arrow and anisocytosis pointed by discreet –dotted
arrow .
54
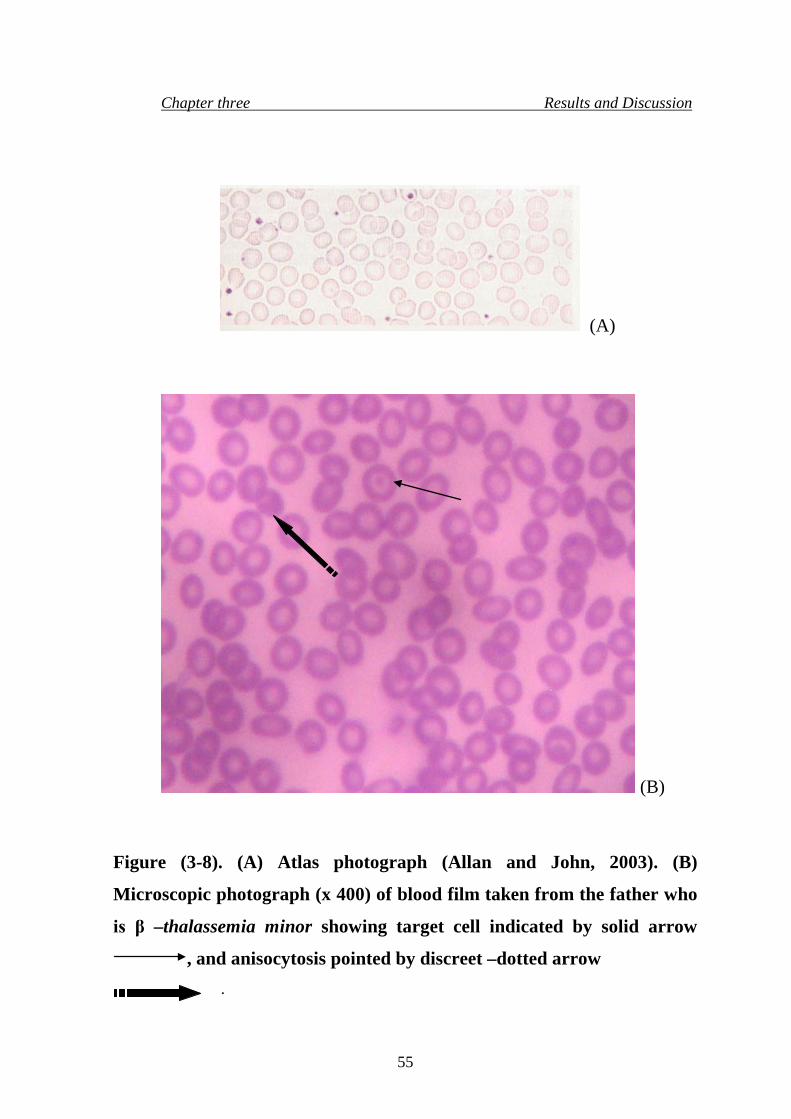
Chapter three Results and Discussion
(A)
(B)
Figure (3-8). (A) Atlas photograph (Allan and John, 2003). (B)
Microscopic photograph (x 400) of blood film taken from the father who
is β –thalassemia minor showing target cell indicated by solid arrow
, and anisocytosis pointed by discreet –dotted arrow
.
55
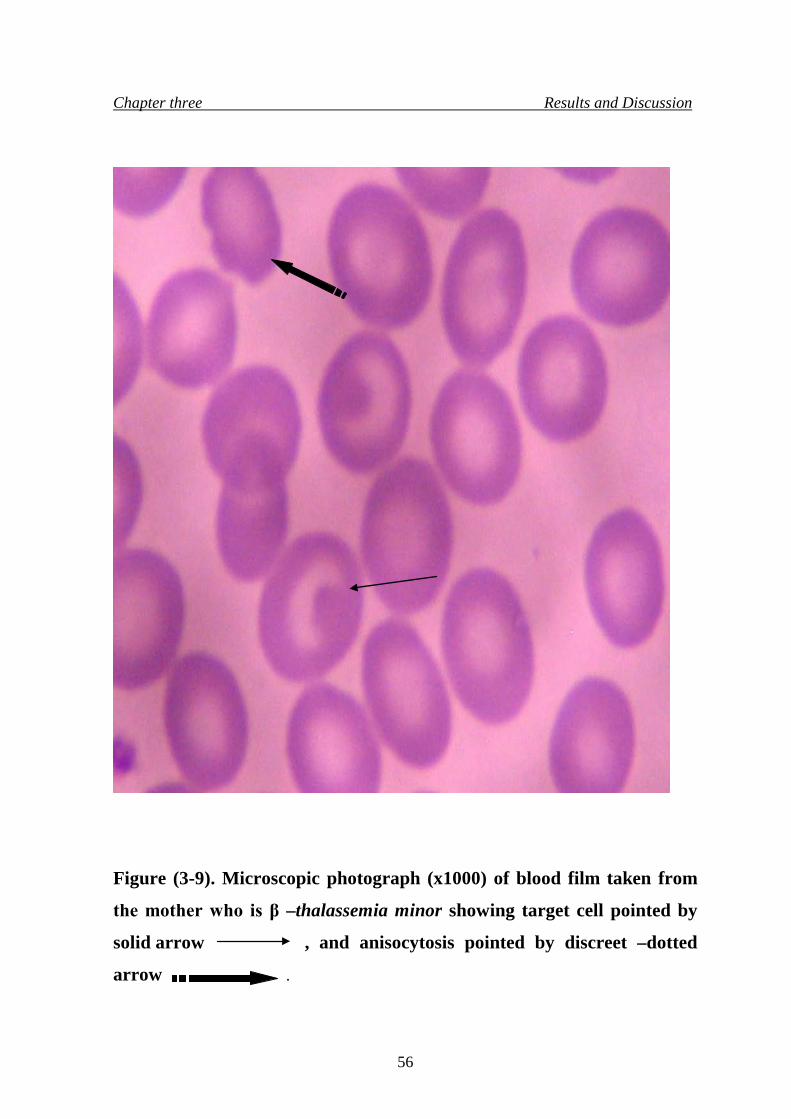
Chapter three Results and Discussion
Figure (3-9). Microscopic photograph (x1000) of blood film taken from
the mother who is β –thalassemia minor showing target cell pointed by
solid arrow , and anisocytosis pointed by discreet –dotted
arrow .
56
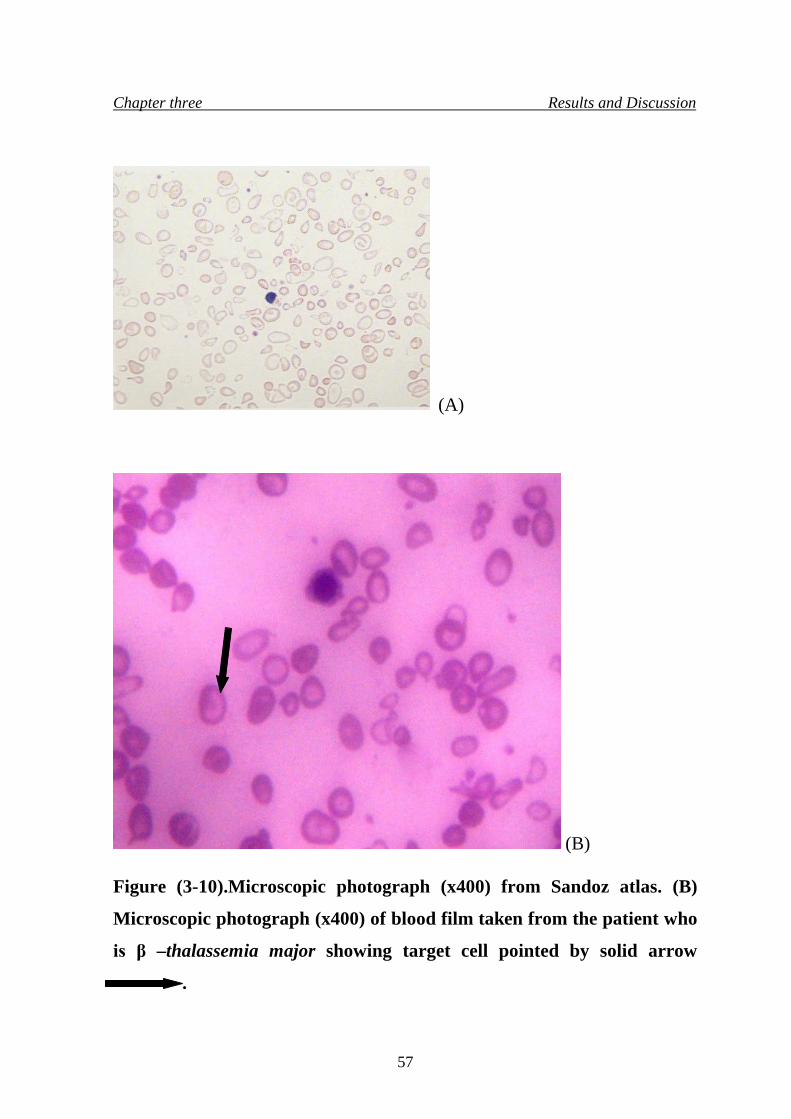
Chapter three Results and Discussion
(A)
(B)
Figure (3-10).Microscopic photograph (x400) from Sandoz atlas. (B)
Microscopic photograph (x400) of blood film taken from the patient who
is β –thalassemia major showing target cell pointed by solid arrow
.
57

Chapter three Results and Discussion
Figure (3-11).Microscopic photograph (x1000) of blood film taken from
the patient who is β –thalassemia major showing target cell pointed with
solid arrow .
It was concluded that a carrier of the β –thalassemia minor is
suspected when microcytic hypochromic RBCs, and target cells were also
found in blood sample smear in which they are the common feature in this
type of disease, but β -thalassemia major patient is suspected when severe
58
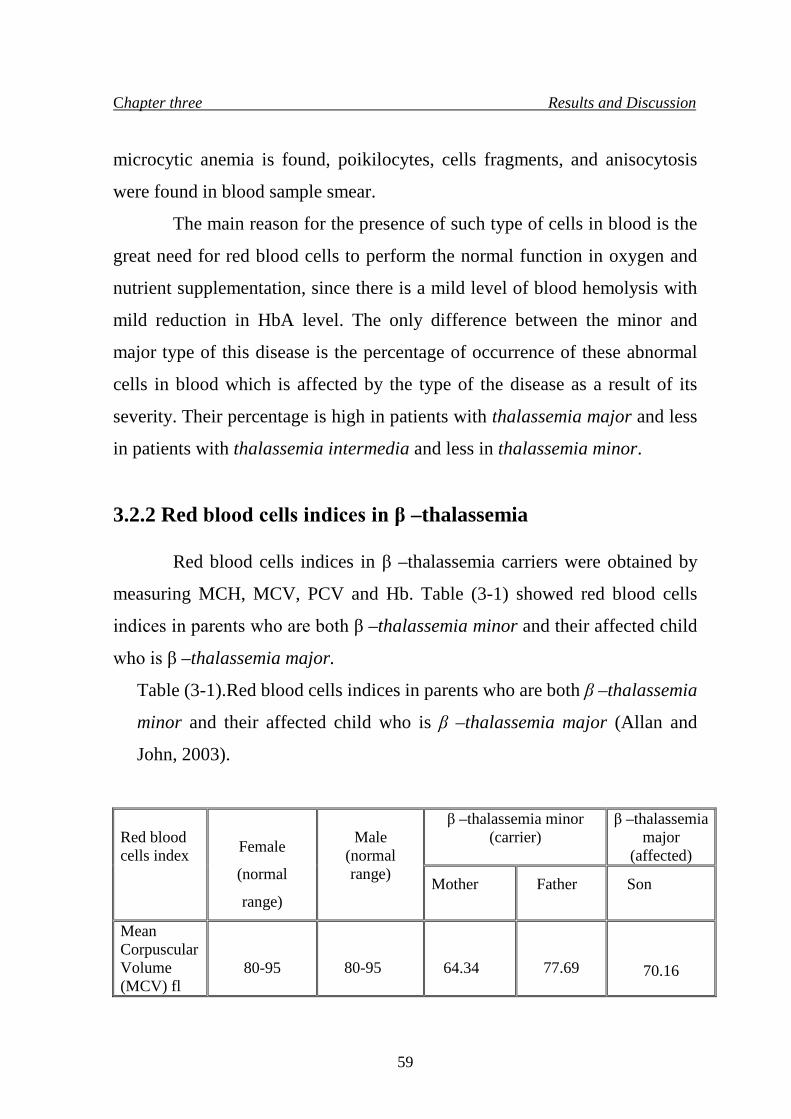
Chapter three Results and Discussion
microcytic anemia is found, poikilocytes, cells fragments, and anisocytosis
were found in blood sample smear.
The main reason for the presence of such type of cells in blood is the
great need for red blood cells to perform the normal function in oxygen and
nutrient supplementation, since there is a mild level of blood hemolysis with
mild reduction in HbA level. The only difference between the minor and
major type of this disease is the percentage of occurrence of these abnormal
cells in blood which is affected by the type of the disease as a result of its
severity. Their percentage is high in patients with thalassemia major and less
in patients with thalassemia intermedia and less in thalassemia minor.
3.2.2 Red blood cells indices in β –thalassemia
Red blood cells indices in β –thalassemia carriers were obtained by
measuring MCH, MCV, PCV and Hb. Table (3-1) showed red blood cells
indices in parents who are both β –thalassemia minor and their affected child
who is β –thalassemia major.
Table (3-1).Red blood cells indices in parents who are both β –thalassemia
minor and their affected child who is β –thalassemia major (Allan and
John, 2003).
Red blood cells index
Female
(normal
range)
Male
(normal range)
β –thalassemia minor (carrier)
β –thalassemia major
(affected) Mother Father Son
Mean Corpuscular Volume (MCV) fl
80-95
80-95
64.34
77.69
70.16
59
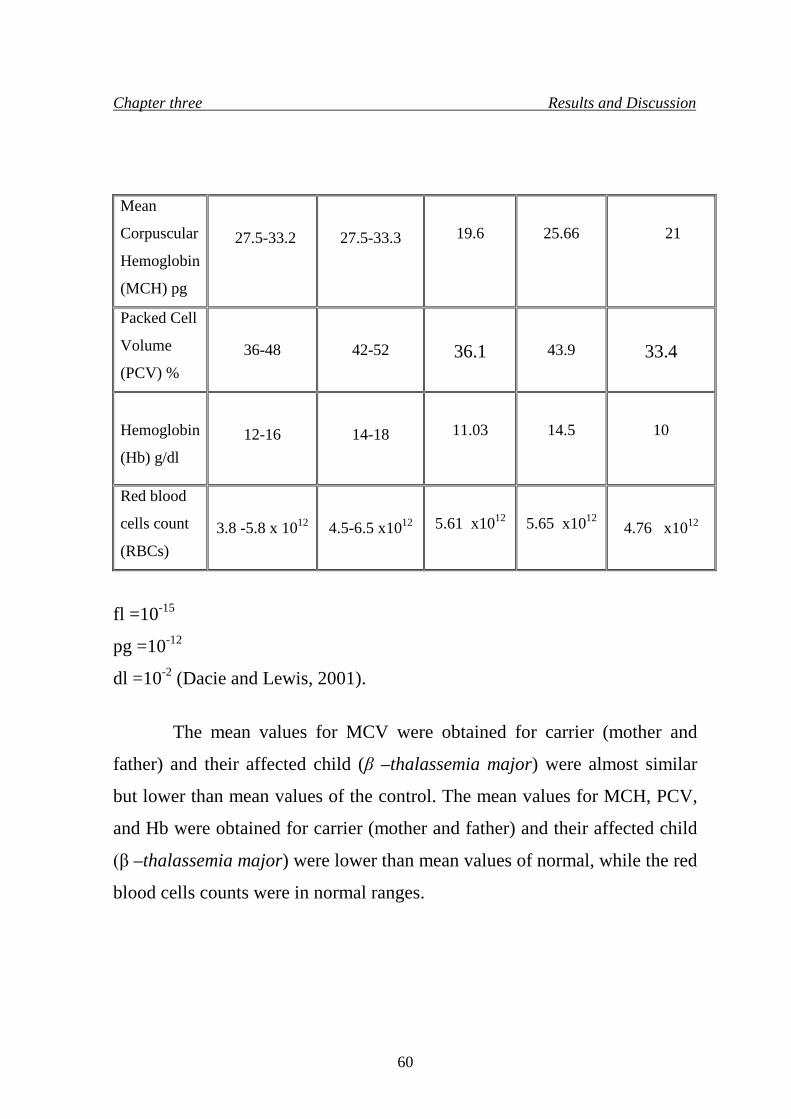
Chapter three Results and Discussion
Mean
Corpuscular
Hemoglobin
(MCH) pg
27.5-33.2
27.5-33.3
19.6
25.66
21
Packed Cell
Volume
(PCV) %
36-48
42-52
36.1
43.9
33.4
Hemoglobin
(Hb) g/dl
12-16
14-18
11.03
14.5
10
Red blood
cells count
(RBCs)
3.8 -5.8 x 10¹²
4.5-6.5 x10¹²
5.61 x10¹²
5.65 x10¹²
4.76 x10¹²
fl =10-15
pg =10-12
dl =10-2 (Dacie and Lewis, 2001).
The mean values for MCV were obtained for carrier (mother and
father) and their affected child (β –thalassemia major) were almost similar
but lower than mean values of the control. The mean values for MCH, PCV,
and Hb were obtained for carrier (mother and father) and their affected child
(β –thalassemia major) were lower than mean values of normal, while the red
blood cells counts were in normal ranges.
60
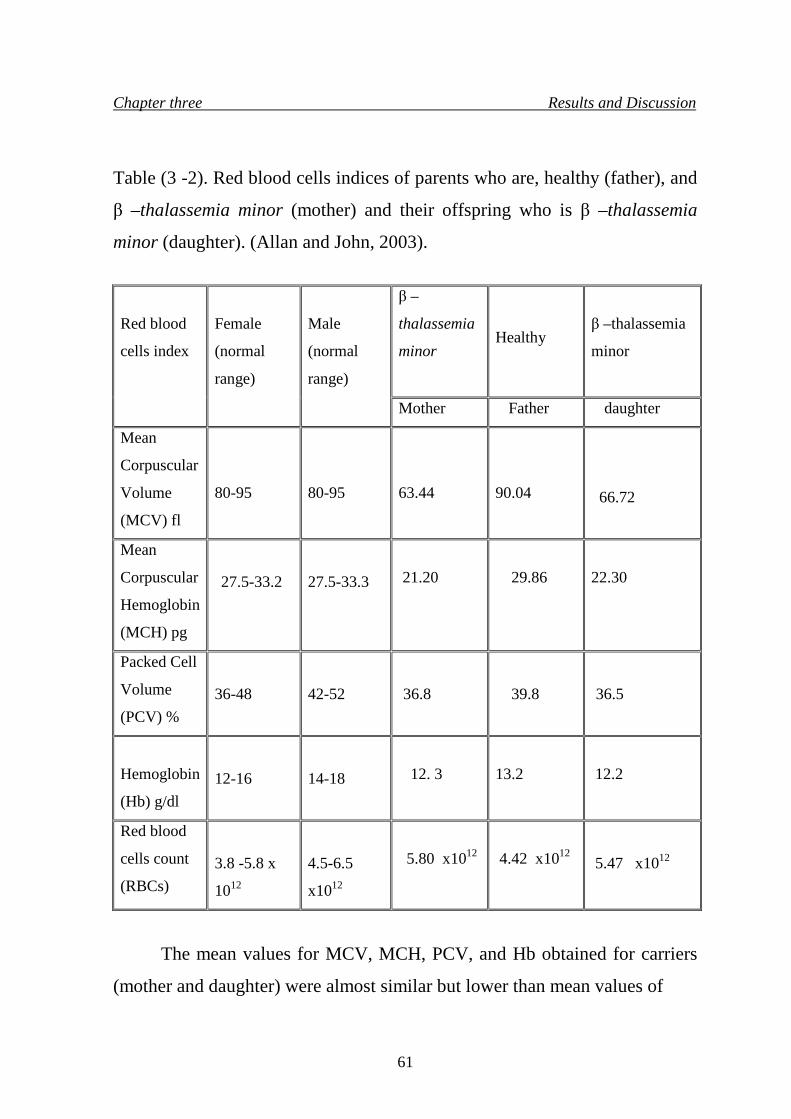
Chapter three Results and Discussion
Table (3 -2). Red blood cells indices of parents who are, healthy (father), and
β –thalassemia minor (mother) and their offspring who is β –thalassemia
minor (daughter). (Allan and John, 2003).
Red blood
cells index
Female
(normal
range)
Male
(normal
range)
β –
thalassemia
minor
Healthy β –thalassemia minor
Mother Father daughter
Mean
Corpuscular
Volume
(MCV) fl
80-95
80-95
63.44
90.04
66.72
Mean
Corpuscular
Hemoglobin
(MCH) pg
27.5-33.2
27.5-33.3
21.20
29.86
22.30
Packed Cell
Volume
(PCV) %
36-48
42-52
36.8
39.8
36.5
Hemoglobin
(Hb) g/dl
12-16
14-18
12. 3
13.2
12.2
Red blood
cells count
(RBCs)
3.8 -5.8 x
1012
4.5-6.5
x1012
5.80 x10¹²
4.42 x10¹² 5.47 x10¹²
The mean values for MCV, MCH, PCV, and Hb obtained for carriers
(mother and daughter) were almost similar but lower than mean values of
61
Chapter three Results and Discussion
normal, while these values for the healthy (father) were within the normal
range. The red blood cells count of both parents and their daughter were
within the normal range. It was concluded that carriers demonstrate low
MCV, MCH values in relation to severity of anemia; they represent the ratio
between red blood cells with PCV and red blood cells with Hb respectively
that gives good indication for the red blood cells hemolysis as a result of the
disease. Carriers also demonstrate morphological changes in red blood cells
that are less severe than in affected individuals.
Moreover, erythroblasts are normally not seen and carriers are
symptoms free (Camaschella and Cappellini, 1995). So, red blood cells
appearance and their indices are important in the diagnosis of β –thalassemia
(Antonio and Renzo, 2000). These cells are found to perform the normal
function in oxygen supplementation to the body and since there is a mild level
of blood hemolysis with reduced rate of HbA level in β –thalassemia minor
syndrome, in spite of the mild Hemolysis, the bone marrow of a carrier is
normal and the life age of the red blood cell is normal or nearly so.
β –thalassemia carrier is suspected when there are hypochromic
microcytic red blood cells, anisocytsis, few target and oval cells. The rate of
these cells differs among β –thalassemia population, they are found in high
levels in patients of β –thalassemia major, and less in patients of β –
thalassemia intermedia, and β –thalassemia minor.
3.2.3 Hemoglobin abnormality
All the families who were represented by samples within Baghdad
population and grouped according to their family relationship (father, mother,
and children) were investigated for hemoglobin abnormality, the results
showed various hemoglobin abnormalities, e.g. elevated levels of HbA2 in β –
62
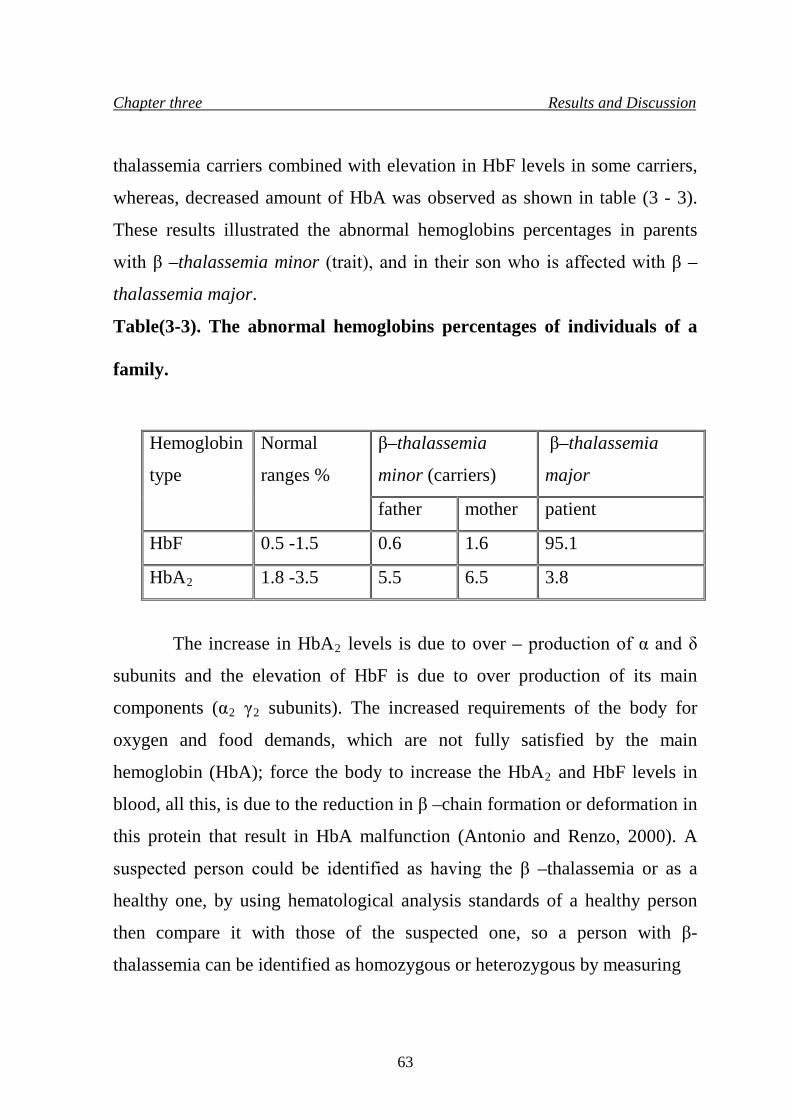
Chapter three Results and Discussion
thalassemia carriers combined with elevation in HbF levels in some carriers,
whereas, decreased amount of HbA was observed as shown in table (3 - 3).
These results illustrated the abnormal hemoglobins percentages in parents
with β –thalassemia minor (trait), and in their son who is affected with β –
thalassemia major.
Table(3-3). The abnormal hemoglobins percentages of individuals of a
family.
The increase in HbA2 levels is due to over – production of α and δ
subunits and the elevation of HbF is due to over production of its main
components (α2 γ2 subunits). The increased requirements of the body for
oxygen and food demands, which are not fully satisfied by the main
hemoglobin (HbA); force the body to increase the HbA2 and HbF levels in
blood, all this, is due to the reduction in β –chain formation or deformation in
this protein that result in HbA malfunction (Antonio and Renzo, 2000). A
suspected person could be identified as having the β –thalassemia or as a
healthy one, by using hematological analysis standards of a healthy person
then compare it with those of the suspected one, so a person with β-
thalassemia can be identified as homozygous or heterozygous by measuring
Hemoglobin
type
Normal
ranges %
β–thalassemia
minor (carriers)
β–thalassemia
major
father mother patient
HbF 0.5 -1.5 0.6 1.6 95.1
HbA2 1.8 -3.5 5.5 6.5 3.8
63
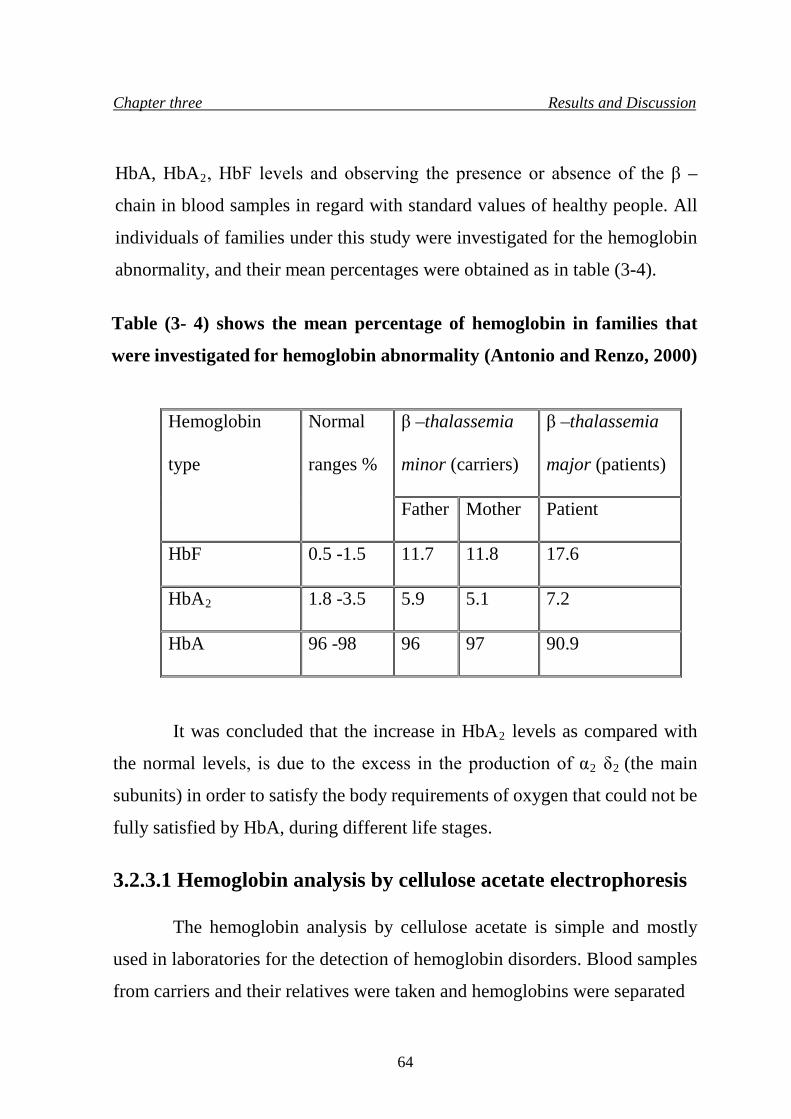
Chapter three Results and Discussion
HbA, HbA2, HbF levels and observing the presence or absence of the β –
chain in blood samples in regard with standard values of healthy people. All
individuals of families under this study were investigated for the hemoglobin
abnormality, and their mean percentages were obtained as in table (3-4).
Table (3- 4) shows the mean percentage of hemoglobin in families that
were investigated for hemoglobin abnormality (Antonio and Renzo, 2000)
Hemoglobin
type
Normal
ranges %
β –thalassemia
minor (carriers)
β –thalassemia
major (patients)
Father Mother Patient
HbF 0.5 -1.5 11.7 11.8 17.6
HbA2 1.8 -3.5 5.9 5.1 7.2
HbA 96 -98 96 97 90.9
It was concluded that the increase in HbA2 levels as compared with
the normal levels, is due to the excess in the production of α2 δ2 (the main
subunits) in order to satisfy the body requirements of oxygen that could not be
fully satisfied by HbA, during different life stages. 3.2.3.1 Hemoglobin analysis by cellulose acetate electrophoresis
The hemoglobin analysis by cellulose acetate is simple and mostly
used in laboratories for the detection of hemoglobin disorders. Blood samples
from carriers and their relatives were taken and hemoglobins were separated
64
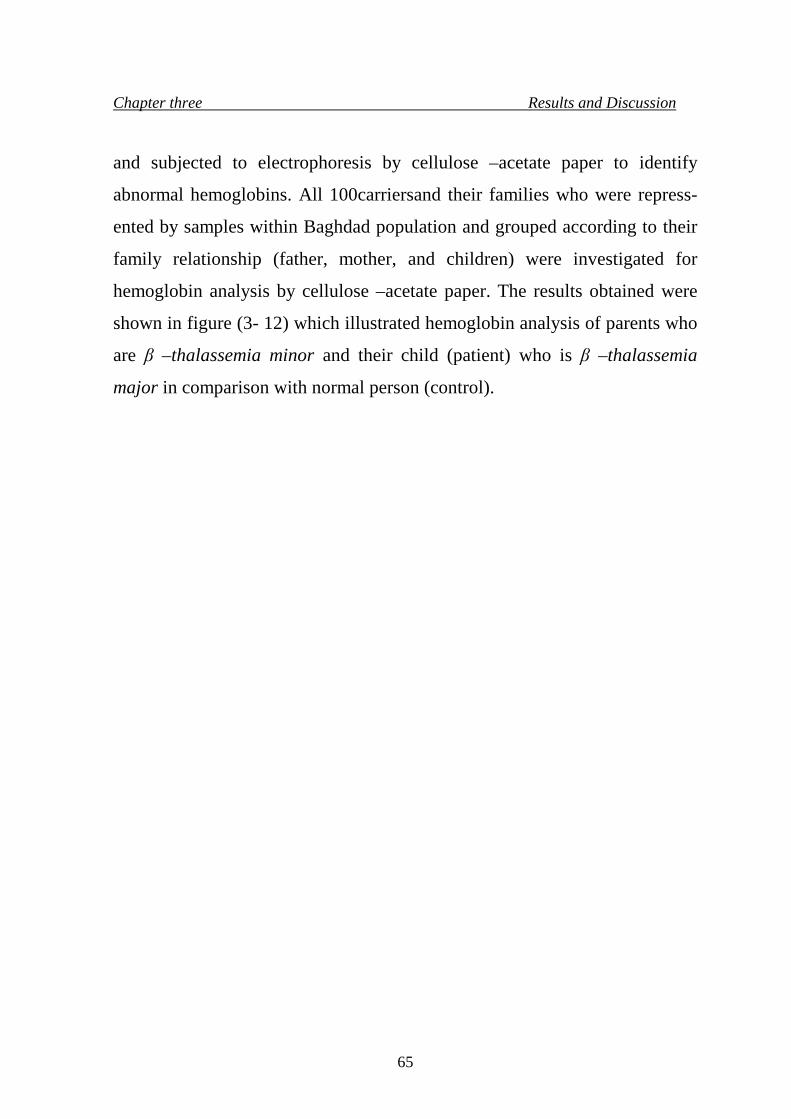
Chapter three Results and Discussion
and subjected to electrophoresis by cellulose –acetate paper to identify
abnormal hemoglobins. All 100carriersand their families who were repress-
ented by samples within Baghdad population and grouped according to their
family relationship (father, mother, and children) were investigated for
hemoglobin analysis by cellulose –acetate paper. The results obtained were
shown in figure (3- 12) which illustrated hemoglobin analysis of parents who
are β –thalassemia minor and their child (patient) who is β –thalassemia
major in comparison with normal person (control).
65
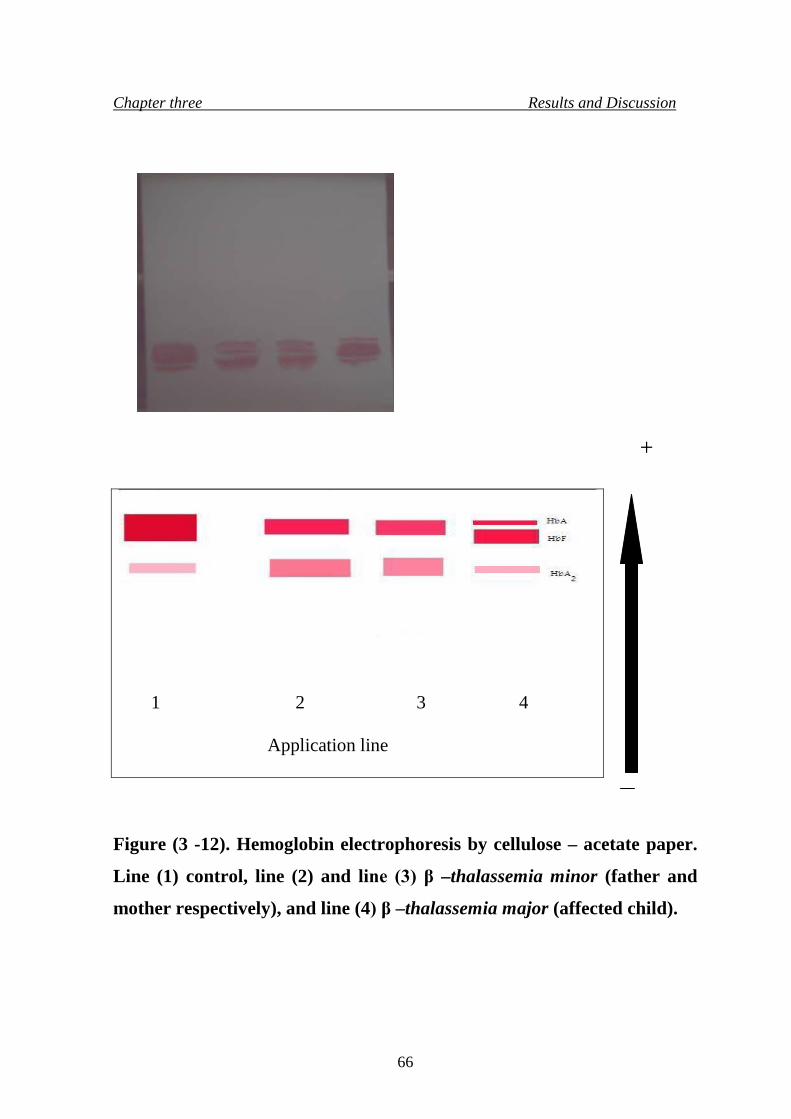
Chapter three Results and Discussion
+
1 2 3 4
Application line
Figure (3 -12). Hemoglobin electrophoresis by cellulose – acetate paper.
Line (1) control, line (2) and line (3) β –thalassemia minor (father and
mother respectively), and line (4) β –thalassemia major (affected child).
66
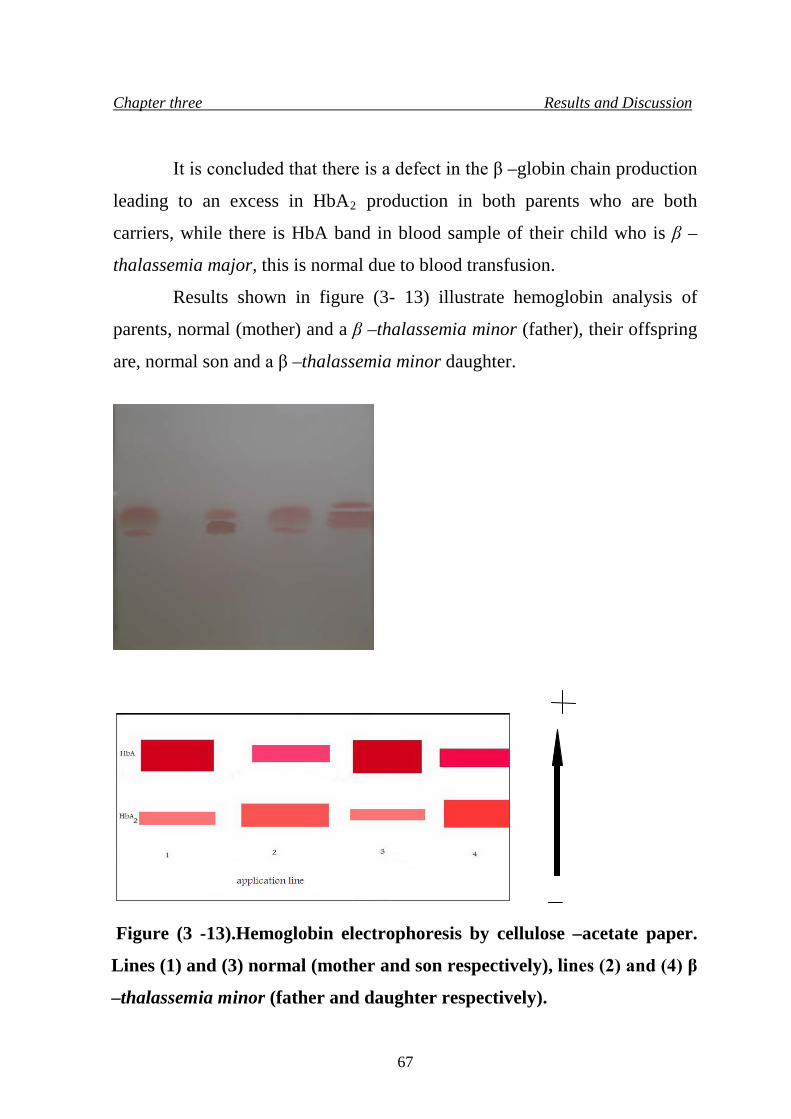
Chapter three Results and Discussion
It is concluded that there is a defect in the β –globin chain production
leading to an excess in HbA2 production in both parents who are both
carriers, while there is HbA band in blood sample of their child who is β –
thalassemia major, this is normal due to blood transfusion.
Results shown in figure (3- 13) illustrate hemoglobin analysis of
parents, normal (mother) and a β –thalassemia minor (father), their offspring
are, normal son and a β –thalassemia minor daughter.
Figure (3 -13).Hemoglobin electrophoresis by cellulose –acetate paper.
Lines (1) and (3) normal (mother and son respectively), lines (2) and (4) β
–thalassemia minor (father and daughter respectively).
67
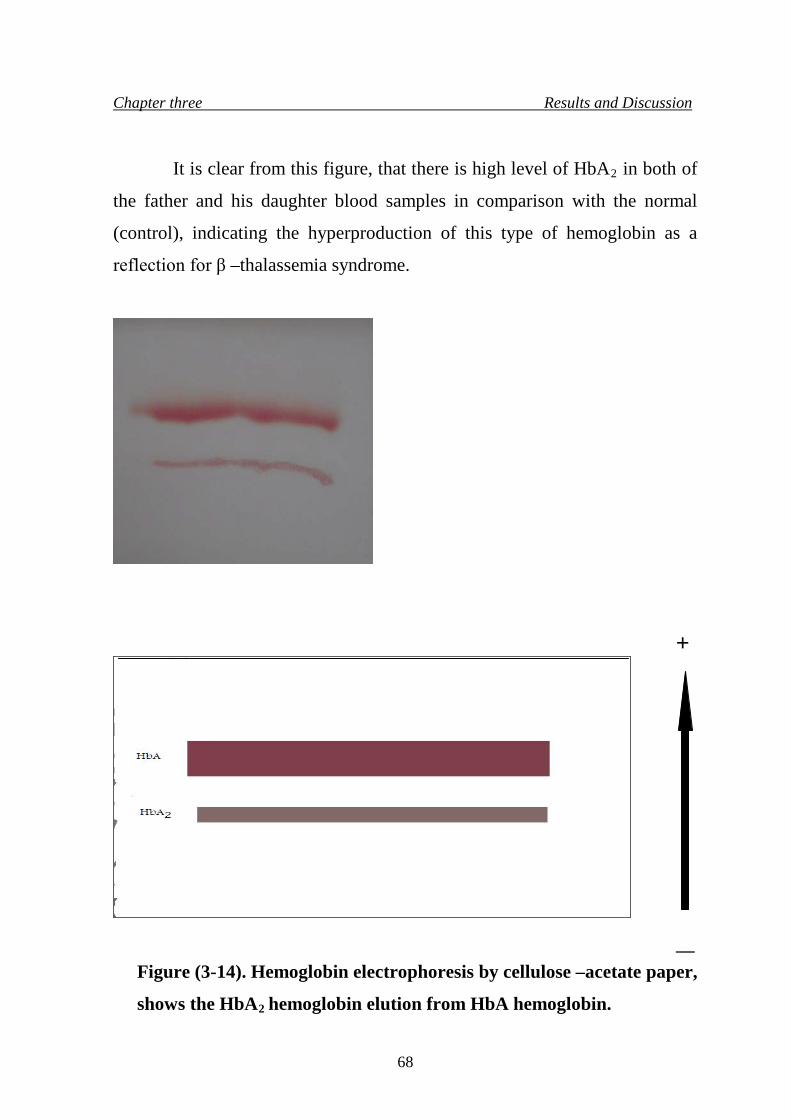
Chapter three Results and Discussion
It is clear from this figure, that there is high level of HbA2 in both of
the father and his daughter blood samples in comparison with the normal
(control), indicating the hyperproduction of this type of hemoglobin as a
reflection for β –thalassemia syndrome.
+
—
Figure (3-14). Hemoglobin electrophoresis by cellulose –acetate paper,
shows the HbA2 hemoglobin elution from HbA hemoglobin.
68
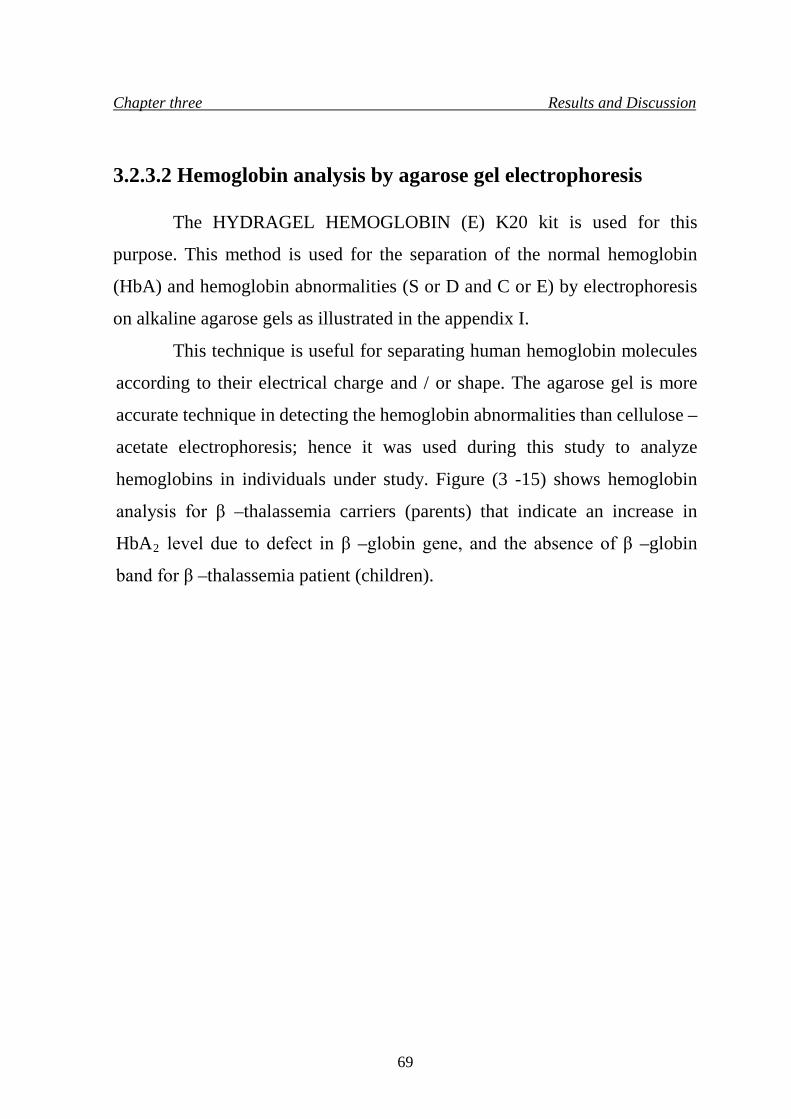
Chapter three Results and Discussion
3.2.3.2 Hemoglobin analysis by agarose gel electrophoresis
The HYDRAGEL HEMOGLOBIN (E) K20 kit is used for this
purpose. This method is used for the separation of the normal hemoglobin
(HbA) and hemoglobin abnormalities (S or D and C or E) by electrophoresis
on alkaline agarose gels as illustrated in the appendix I.
This technique is useful for separating human hemoglobin molecules
according to their electrical charge and / or shape. The agarose gel is more
accurate technique in detecting the hemoglobin abnormalities than cellulose –
acetate electrophoresis; hence it was used during this study to analyze
hemoglobins in individuals under study. Figure (3 -15) shows hemoglobin
analysis for β –thalassemia carriers (parents) that indicate an increase in
HbA2 level due to defect in β –globin gene, and the absence of β –globin
band for β –thalassemia patient (children).
69
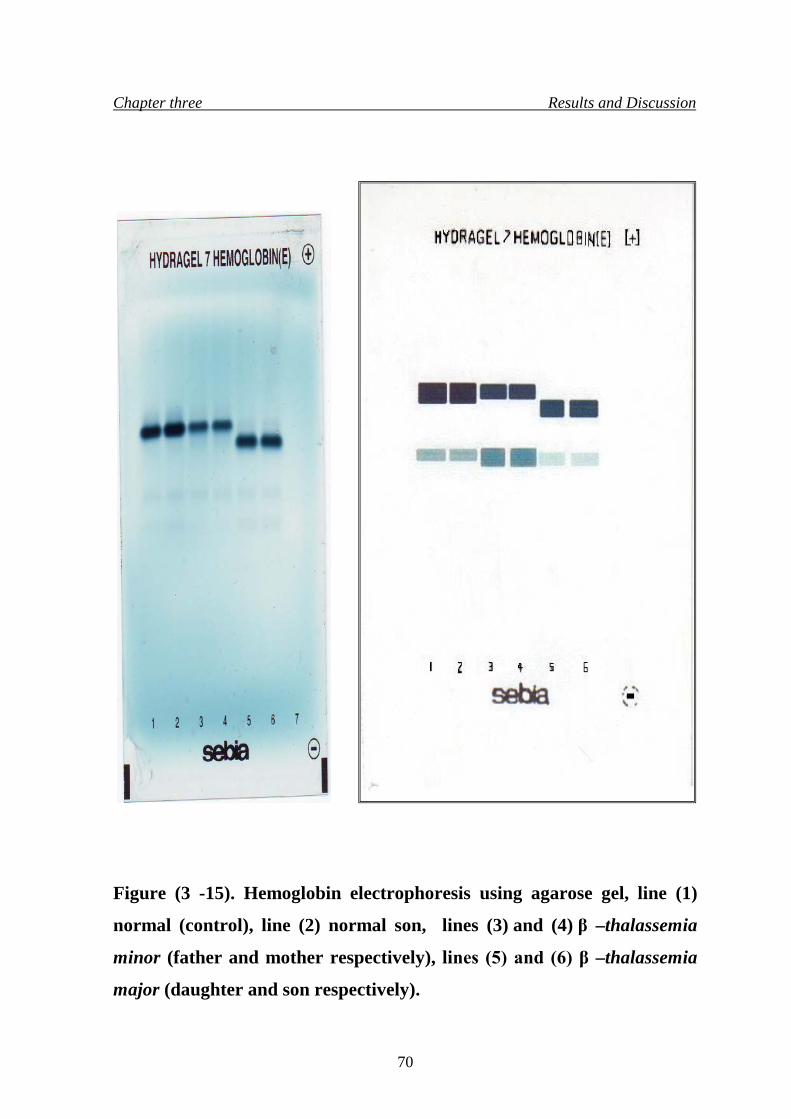
Chapter three Results and Discussion
Figure (3 -15). Hemoglobin electrophoresis using agarose gel, line (1)
normal (control), line (2) normal son, lines (3) and (4) β –thalassemia
minor (father and mother respectively), lines (5) and (6) β –thalassemia
major (daughter and son respectively).
70
Chapter three Results and Discussion
3.2.3.3 Hemoglobin analysis by High Performance Liquid
Chromatography (HPLC)
The VARIANT β –thalassemia Short Program represents the
automated High Performance Liquid Chromatography (HPLC). The HPLC is
being used increasingly as the initial diagnostic method of hemoglobinopa -
thies (Dacie and Lewis, 2001).
It is very accurate technique and provides a provisional identification
of a large proportion of variant hemoglobins using a very small amount from
each blood sample.
This program provides an area percent determination of hemoglobins
A2 and F, as well as qualitative separation of normal and commonly occurring
abnormal hemoglobins. Other less frequently variants may also elute within
the established analyte identification windows. Figures (3-16), (3-17) and (3-
18) show the hemoglobin separation of a family in which parents are carriers
of β –thalassemia minor, and their son who was β –thalassemia major. The
obtained percentages for father were 5.6% for HbA2 and 0.0% for HbF, while
the percentages for mother were 6.2% for HbA2 and 1.8% for HbF. On the
other hand, the child gave percentages of 3.7% for HbA2 and 91.8% for HbF.
71
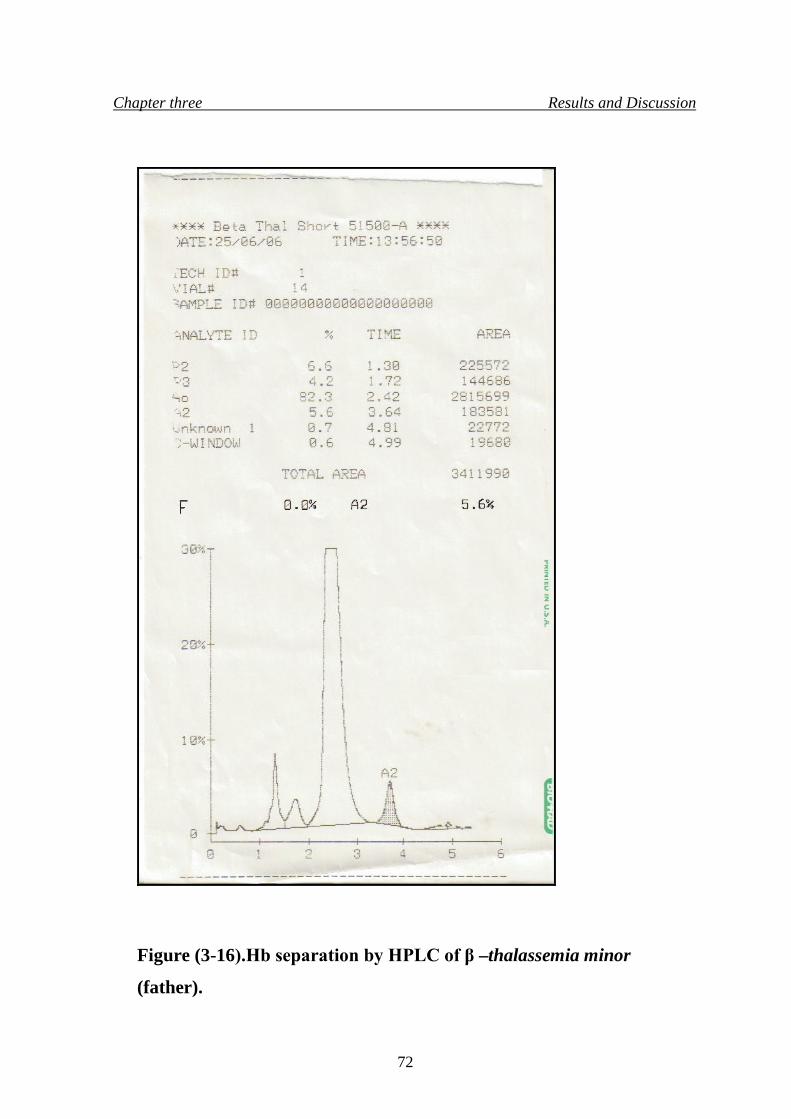
Chapter three Results and Discussion
Figure (3-16).Hb separation by HPLC of β –thalassemia minor
(father).
72
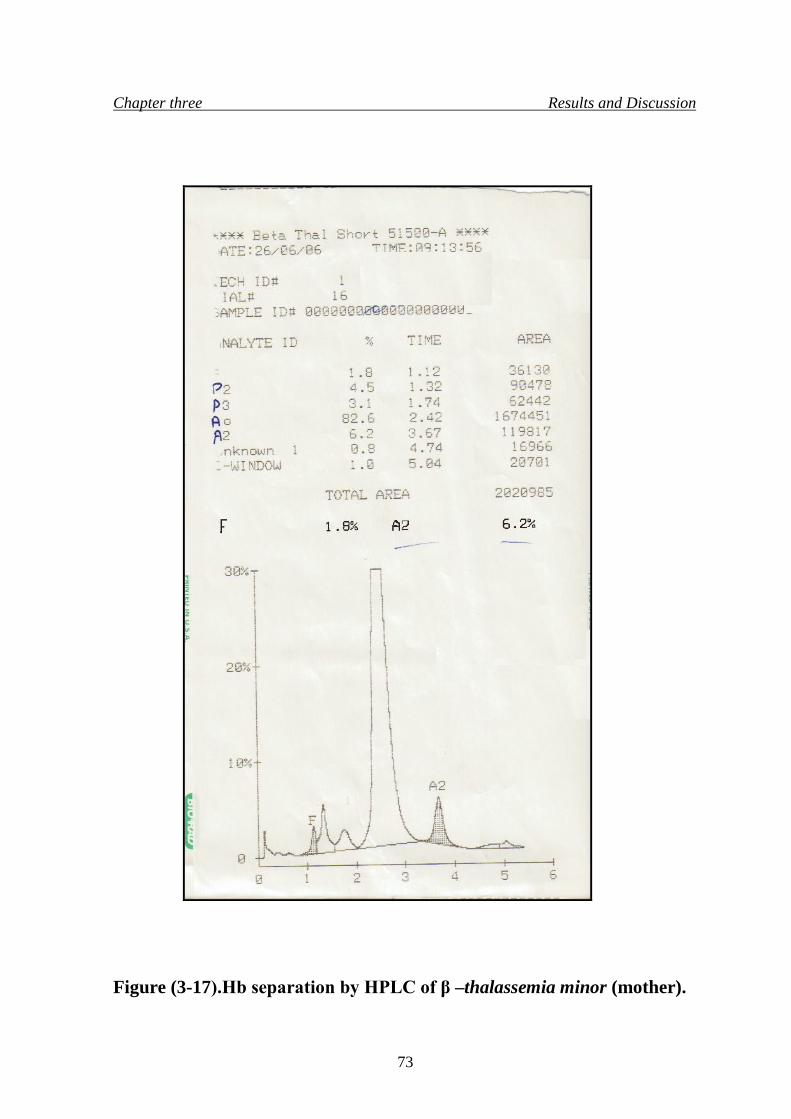
Chapter three Results and Discussion
Figure (3-17).Hb separation by HPLC of β –thalassemia minor (mother).
73
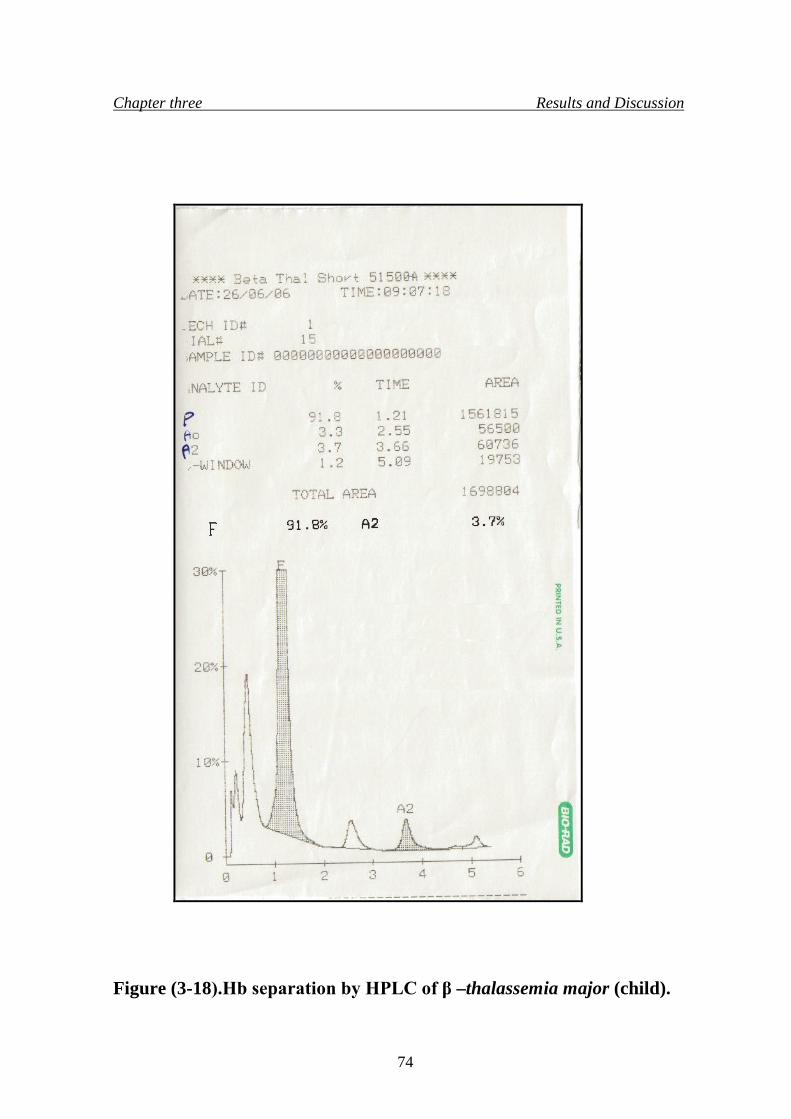
Chapter three Results and Discussion
Figure (3-18).Hb separation by HPLC of β –thalassemia major (child).
74
Chapter three Results and Discussion
The parents were carriers of the β –thalassemia minor showed
elevated levels of HbA2, while their child who was β –thalassemia major
showed elevated level of HbF.
3.3 β –globin chain analysis using Polymerase Chain Reaction
(PCR)
The diagnosis of β –thalassemia has progressed widely during 1980s
from the phenotype diagnosis to genotype diagnosis. The PCR reaction
involves using a very small amount of DNA, in which it can be amplified
millions of times in vitro. This technique is very useful in the detection of
thalassemia mutation among population (Beris, et al., 1991).
In this study four specific primers were used to detect β –globin gene
in members of two families as shown in figures (3-19) and (3-20).
Amplification was performed in Primas for 40 cycles (94 ºC for 5 minutes, 92
ºC for 1 minute, 62 ºC for1.5 minute and 72 ºC for 2.5 minutes).
At the beginning, this study was initiated by screening genomic DNA
sample of normal healthy and clinically diagnosed individual, the isolated
DNA was subjected to in vitro gene amplification using the four specific
primers. These primers are designated (P5, P7, P10, P12) are complementary
to a defined region in β –globin gene.
Each two primers will amplify a specific fragment of the β –globin
gene, in which P7 and P10 will amplify the 616bp fragment of the β –globin
gene, P5 and P12 will amplify the 799bp fragment of the β –globin gene,
while P5 and P10 will amplify the whole β –globin gene. Results obtained
from the normal blood sample amplification, as in figure (3-20) showed that
only the 616bp fragment was amplified while the 799bp fragment showed no
response for amplification. Then the PCR product was subjected to restriction
75
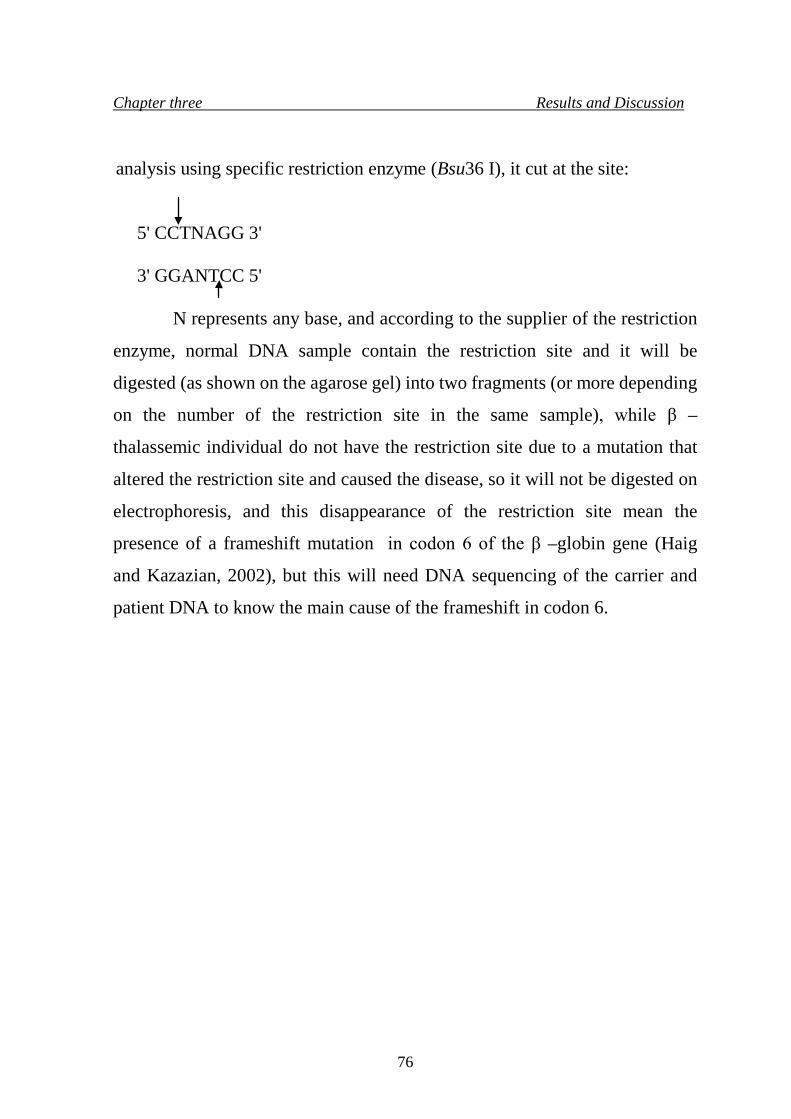
Chapter three Results and Discussion
analysis using specific restriction enzyme (Bsu36 I), it cut at the site:
5' CCTNAGG 3'
3' GGANTCC 5'
N represents any base, and according to the supplier of the restriction
enzyme, normal DNA sample contain the restriction site and it will be
digested (as shown on the agarose gel) into two fragments (or more depending
on the number of the restriction site in the same sample), while β –
thalassemic individual do not have the restriction site due to a mutation that
altered the restriction site and caused the disease, so it will not be digested on
electrophoresis, and this disappearance of the restriction site mean the
presence of a frameshift mutation in codon 6 of the β –globin gene (Haig
and Kazazian, 2002), but this will need DNA sequencing of the carrier and
patient DNA to know the main cause of the frameshift in codon 6.
76
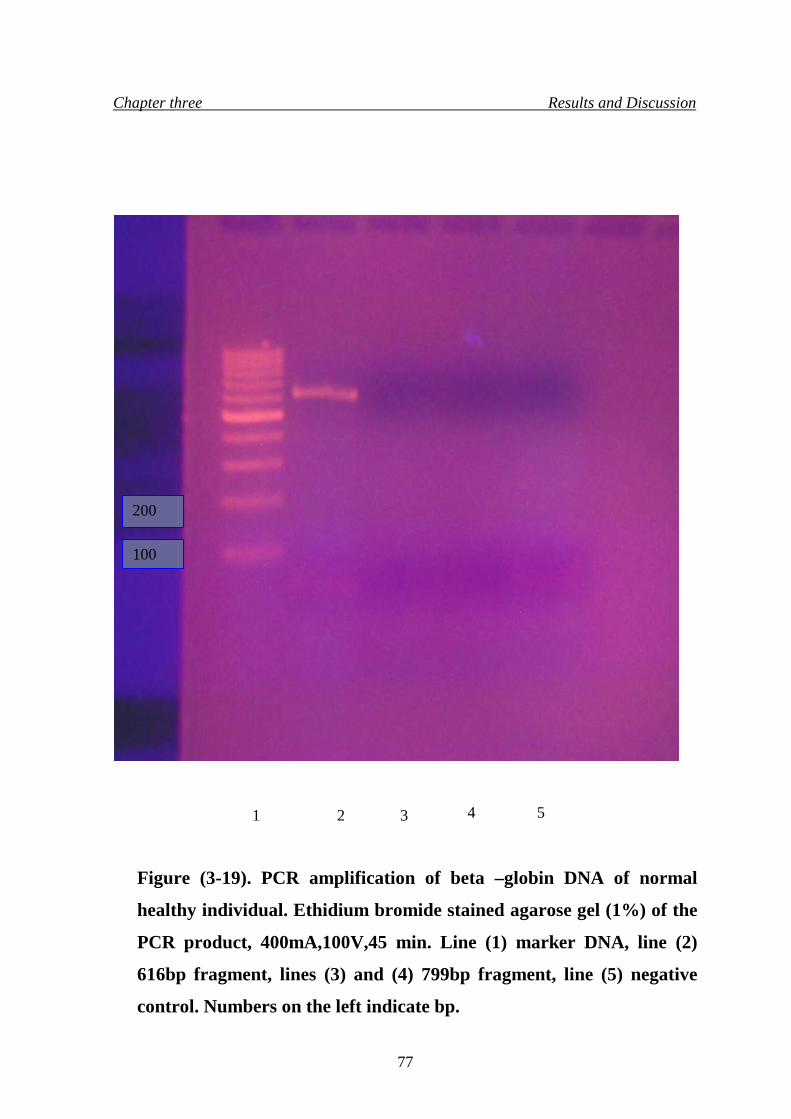
Chapter three Results and Discussion
Figure (3-19). PCR amplification of beta –globin DNA of normal
healthy individual. Ethidium bromide stained agarose gel (1%) of the
PCR product, 400mA,100V,45 min. Line (1) marker DNA, line (2)
616bp fragment, lines (3) and (4) 799bp fragment, line (5) negative
control. Numbers on the left indicate bp.
1 2 3 4 5
100
200
77
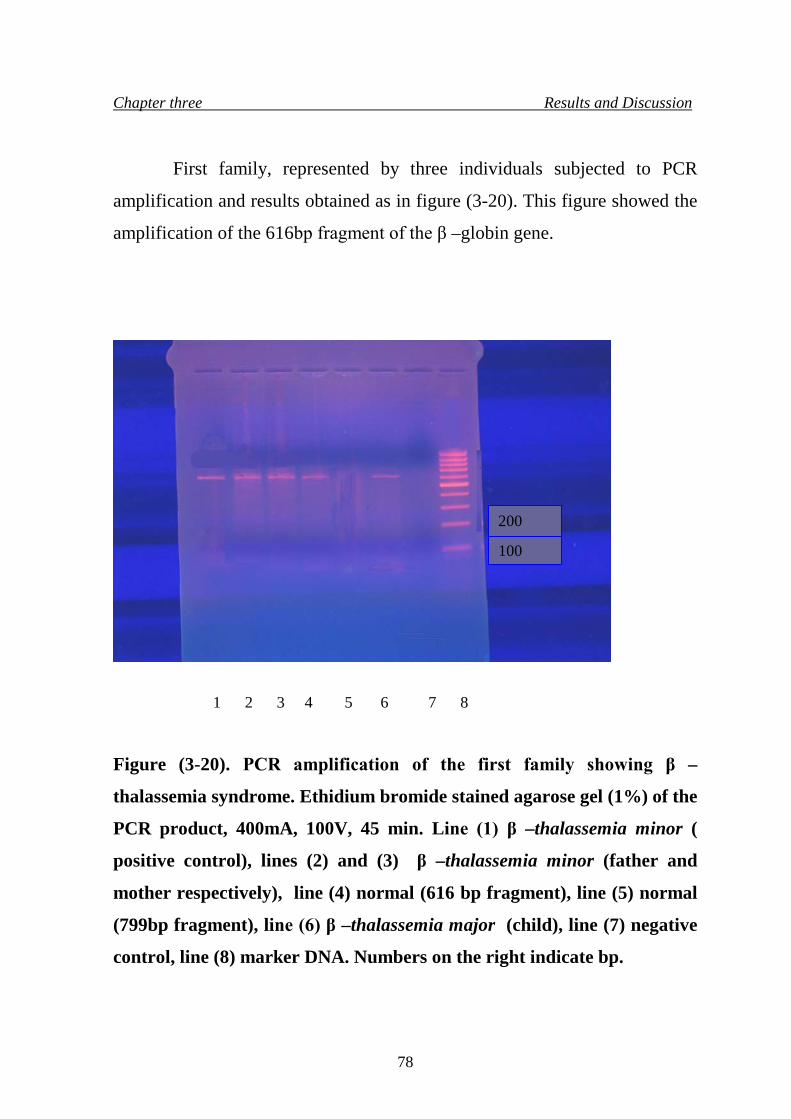
Chapter three Results and Discussion
First family, represented by three individuals subjected to PCR
amplification and results obtained as in figure (3-20). This figure showed the
amplification of the 616bp fragment of the β –globin gene.
Figure (3-20). PCR amplification of the first family showing β –
thalassemia syndrome. Ethidium bromide stained agarose gel (1%) of the
PCR product, 400mA, 100V, 45 min. Line (1) β –thalassemia minor (
positive control), lines (2) and (3) β –thalassemia minor (father and
mother respectively), line (4) normal (616 bp fragment), line (5) normal
(799bp fragment), line (6) β –thalassemia major (child), line (7) negative
control, line (8) marker DNA. Numbers on the right indicate bp.
1 2 3 4 5 6 7 8
100
200
78
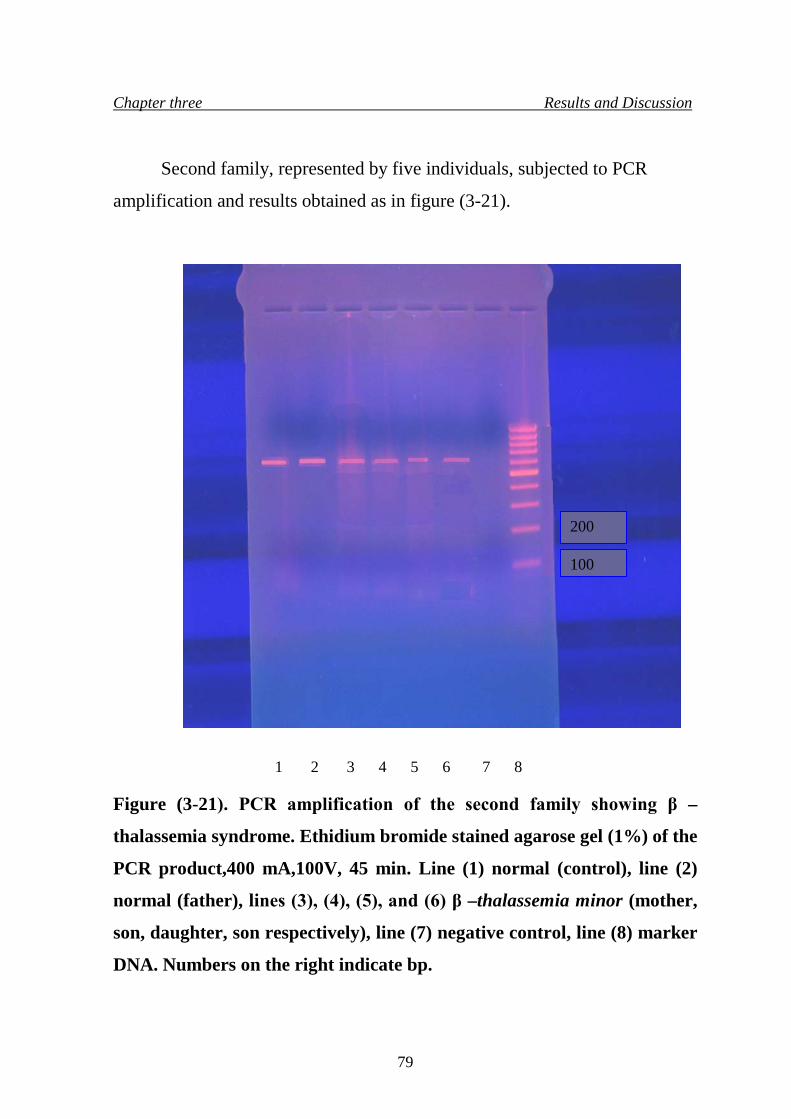
Chapter three Results and Discussion
Second family, represented by five individuals, subjected to PCR
amplification and results obtained as in figure (3-21).
Figure (3-21). PCR amplification of the second family showing β –
thalassemia syndrome. Ethidium bromide stained agarose gel (1%) of the
PCR product,400 mA,100V, 45 min. Line (1) normal (control), line (2)
normal (father), lines (3), (4), (5), and (6) β –thalassemia minor (mother,
son, daughter, son respectively), line (7) negative control, line (8) marker
DNA. Numbers on the right indicate bp.
1 2 3 4 5 6 7 8
100
200
79
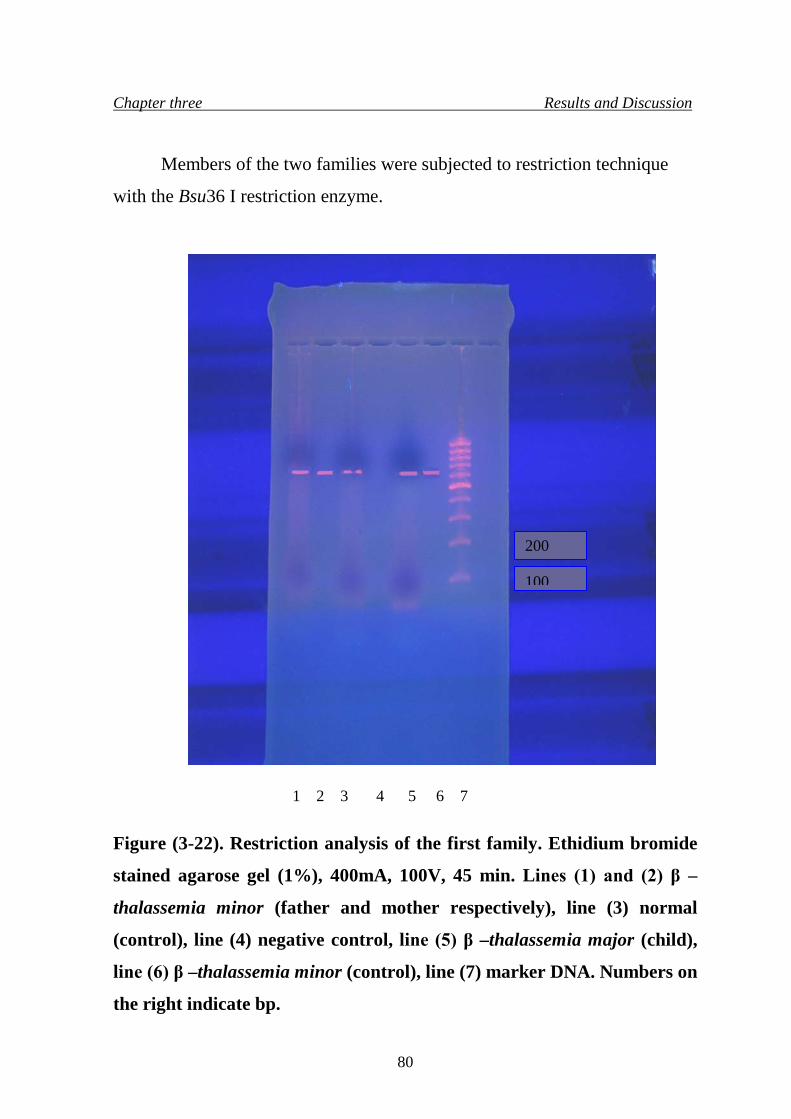
Chapter three Results and Discussion
Members of the two families were subjected to restriction technique
with the Bsu36 I restriction enzyme.
Figure (3-22). Restriction analysis of the first family. Ethidium bromide
stained agarose gel (1%), 400mA, 100V, 45 min. Lines (1) and (2) β –
thalassemia minor (father and mother respectively), line (3) normal
(control), line (4) negative control, line (5) β –thalassemia major (child),
line (6) β –thalassemia minor (control), line (7) marker DNA. Numbers on
the right indicate bp.
1 2 3 4 5 6 7
100
200
80
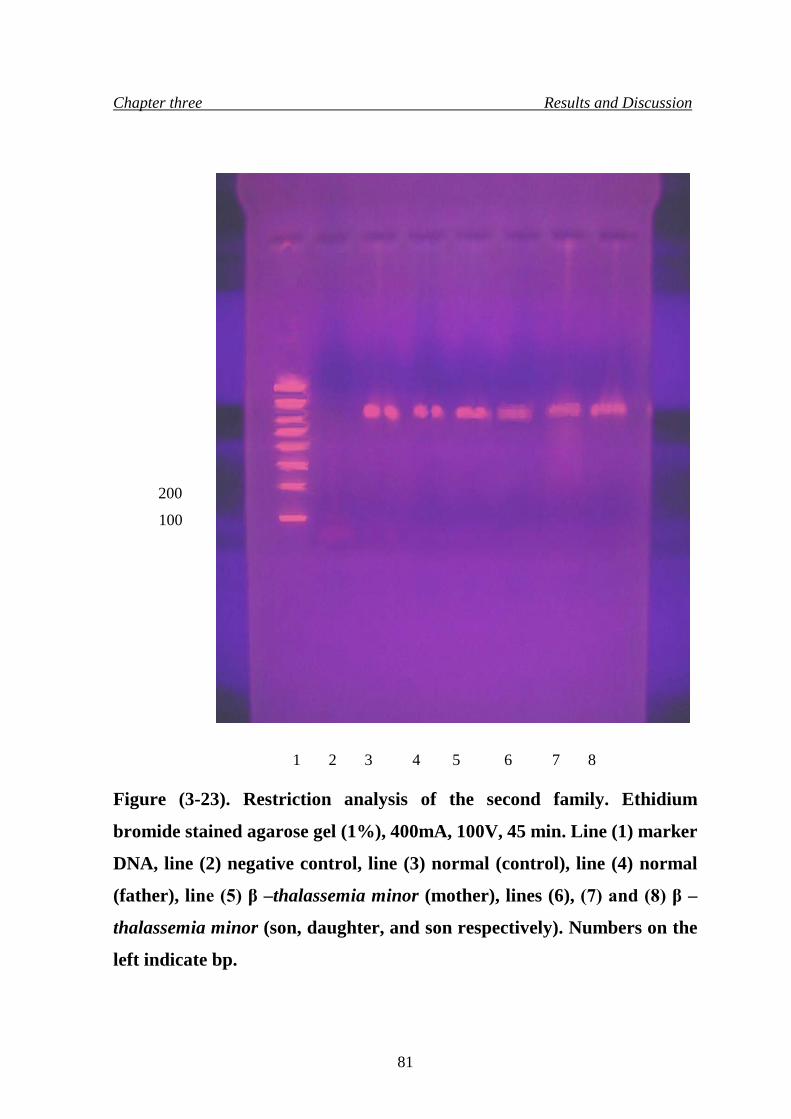
Chapter three Results and Discussion
Figure (3-23). Restriction analysis of the second family. Ethidium
bromide stained agarose gel (1%), 400mA, 100V, 45 min. Line (1) marker
DNA, line (2) negative control, line (3) normal (control), line (4) normal
(father), line (5) β –thalassemia minor (mother), lines (6), (7) and (8) β –
thalassemia minor (son, daughter, and son respectively). Numbers on the
left indicate bp.
1 2 3 4 5 6 7 8
100
200
81
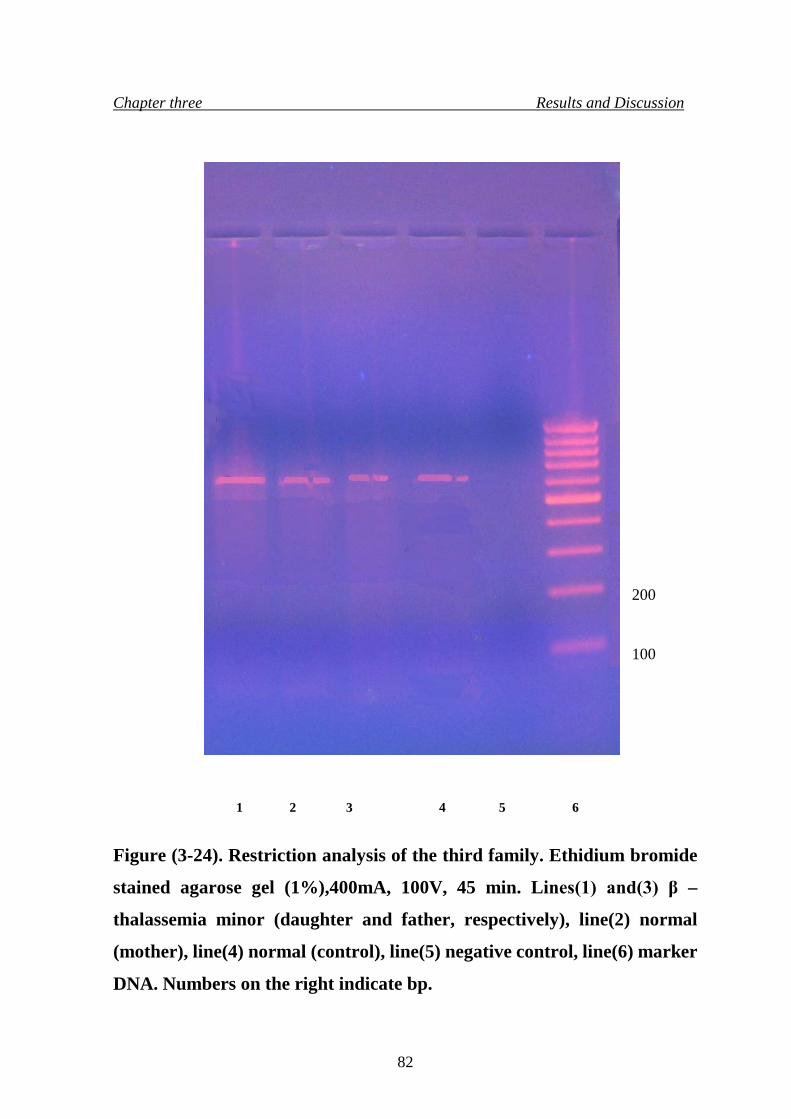
Chapter three Results and Discussion
Figure (3-24). Restriction analysis of the third family. Ethidium bromide
stained agarose gel (1%),400mA, 100V, 45 min. Lines(1) and(3) β –
thalassemia minor (daughter and father, respectively), line(2) normal
(mother), line(4) normal (control), line(5) negative control, line(6) marker
DNA. Numbers on the right indicate bp.
1 2 3 4 5 6
100
200
82
Conclusions and Recommendations
Conclusions
1. Blood films of carriers showed hypochromic microcytic red blood cells
with the presence of target cells, while blood count showed that red blood
cells count were within normal ranges, but the red blood indices were
lower than the normal levels.
2. The VARIANT β –thalassemia Short Program had proved to be more
sensitive and accurate than cellulose acetate paper electrophoresis and
agarose gel electrophoresis in detection of β –thalassemia, so it is
recommended for the detection and analysis of β –thalassemia.
3. Hemoglobin electrophoresis of HbA2 in carriers with β –thalassemia minor
showed elevated levels of HbA2 than normal ratio due to reduction in β –
chain formation, which resulted in malfunction of the normal hemoglobin
HbA.
4. Amplification of the 616bp and 799bp fragments of the β –globin gene of
normal healthy clinically recognized individual by using specific PCR
primers, in which results showed that amplification of the 616bp fragment
only while the 799bp fragment did not response to amplification.
5. The 616bp fragment was subjected to specific restriction enzyme and result
obtained subjected to electrophoresis, showed two DNA bands, indicating
that the normal sample have the restriction site, while most carriers showed
only single DNA band after restriction indicating the presence of
frameshift mutation in codon 6 that altered the restriction site of the
specific restriction enzyme (Bsu36 I) used in this study, while some
carriers showed two DNA bands indicating the presence of the restriction
site, so the disease caused by another type of mutation.
83
Conclusions and Recommendations
Recommendations 1. Amplification of the whole gene using specific primers to define other
types of mutation that cause the disease followed by DNA sequencing of
the carriers gene.
2. Including the other parts of Iraq in such types of study, and define the most
popular types of mutations that cause this disease.
84
References
References
• Al-Awamy, B.H.; Niazi, G.A.; El –Monzan, M.F., Al –Torki, M.T.;
Naeem, M.A. (1986). Newborn screening for sickle cell haemoglo-
binopathy and other inherited erythrocytic disorders in eastern province of
Saudia Arabia. Saudi. Med. J., 7:502 -504.
• Allan, V. H and John, E. P. (2003). Clinical Haematology. London, pp.
86-91.
• Altay, C. and Gurgey, A. (1992). β –thalassemia in Turkey. Hematol.
Rev., 6:77 -81.
• Alter, B. P. (1985). Antenatal diagnosis of thalassemia, a review. Ann.
NY. Acad. Sci., 6:393 – 445.
• Antoio, C. and Renzo, G. (2000). Beta thalassemia. Gene. Clinc. 34: 1-4.
• Azer, K. and Chingiz, A. (1995). The crisis of beta thalassemia in
Azerbaijan. Hematol.Rev., 5:66-70.
• Bartlett and Stirling (2003). A Short History of the Polymerase Chain
Reaction. In: Methods Mol. Biol. 226:3-6.
http://en.wikipedia.org/wiki/PCR
• Basak, A. N.; Ozcelik, H. and Ozer, A. (1992). The molecular basis of
thalassemia.Blood, 50:100-113.
• Baserga, S. J. and Benz, E. J. (1988). Nonsense mutation in the human β –
globin gene affect mRNA metabolism. Proc. Nat. Acad. Sci. USA,
85:2056 -2060.
• Baysal, E.; Kleathous, M. and Bozkurt, G. (1995). β –thalassemia in the
population of Cyprus. Br. J. haematol. 89:496 -499.
85
References
• Beris, P. H.; Darbellay, R.; Donier, C. (1991). Prenatal diagnosis of
thalassemia and hemoglobinopathies in Switzerland. Eur. J. Haematol.
46:163-171.
• Betke K.; Marti, H.R. and Schlicht, L. (1959). Estimation of small
percentage of fetal haemoglobin. Nature., 6:184. • Brambati, B.; Tului, L. and Lanzan, A.(1991). First – trimester genetic
diagnosis in multiple pregnancy. Prenat. Diagn., 11:767 -774.
• Brown, B.A. (1993). Special hematology procedures, In Brown BA (ed),
Haematology, Principles and Procedures, 6th ed, Philadelphia, Lea &
Feiger.
• Bunn, H. F. and Forget, B.G. (1986). Hemoglobin molecular genetics and
clinical aspects, Saunders, Philadelphia.
• Camaschella, C. and Cappellini, M. D. (1995). Thalassemia intermedia.
Haemotologica, 80:58 -68.
• Cao, A.; Rosatelli, M –C. and Leoni, G.B. (1990). Antenatal diagnosis of
β –thalassemia in Sardinia. Ann. NY. Acad. Sci.,12:215 -225.
• Chehab, F. F.; Doherty, M. and Cai, S. (1987). Detection of sickle cell
anemia and thalassemias. Nature (London), 6:329-293.
• Chene – Frempong, K. and Schwartz, E. (1999). Clinical features of
thalassemia. Pediatric clinical of North America., 27:403 - 420.
• Chudwin, D.S. and Rucknagel, D.L. (1974). Immunological quantification
of haemoglobin F and A2. Clin.chimica. Acta., 50:400-413.
• Chui, D. H. K.; Waye, J. S. (1998). Hydrops fetalis caused by β –thalas
semia . Blood, 91:2213-2222.
86
References
• Cooley, T. B. and Lee, P. (1925). A series of cases of splenomegaly in
children with anemia and peculiar bone changes. Trans. Am. Pediat. Soc.,
29-37.
• Dacie, V. and Lewis, S. M. (2001). Practical Hematology, 9ed, Churchill
Livingston Inc., USA, 98-112.
• Dammas, A. S.; adedoyin, M. A. and Cheriya, A. (1995). Experience with
thalassemia major in Al –Bahrain. Ann. Saudi. Med. J., 15:589 -593.
• Deisseroth, A.; Nienhuis, A.W. and Turner, P. (1975). Chromosome
localization of human beta – globin gene on human chromosome II in
somatic cell hybrids. Proc. Nat. Acad. Sci. USA, 75:1456.
• Diaz –Chico, J. C.; Yang, K. G. and Kultar, A. (1987). An ~ 300 bp
deletion involving part of the 5' β –globin gene region is observed in
members of a Turkish family with β –thalassemia. Blood., 70:583.
• Dimarzo, R.; Dowling , C. E. and Wong, C. (1988). The spectrum of β –
thalassemia in Sicily. Br. J. Hematol., 69:393 -397.
• Driscoll, A.; Mackie, L.; Porter, J. and Machin, S. (1995). Low plasma
heparin factor II levels in thalassemia syndromes are corrected by chronic
blood transfusion. Br.J. Hematol., 90:65 -70.
• Frei, J.; Henck, C.; Kiesn, W.; Lang, H. and Hill, P. (1995). Production of
basic diagnostic laboratory reagents. WHO, Alexandria, Egypt, pp:17.
• Fritsch, E.F.; Lawn, R.M. and Maniantist, T. (1980). Molecular cloning
and characterization of the human β –like globin gene cluster. Cell.,
19:959 -972.
• Fucharoen , S.; Winichagoon, P. and Thonglairuam, V. (1988). β –
thalassemia associated with α –thalassemia in Thailand hemoglobin.
Haem. J., 12:581 -592.
87
References
• Giordano, P. C.; Harteled, C. L. and Heister, A. G. (1998). The molecular
spectrum of β–thalassemia and abnormal hemoglobins in the
allochthonous and autochthonous Dutch population. Comm. Genet., 1:243
-251.
• Green, R. and King, K. (1990). A new red cell discriminate incorporating
volume dispersion for differentiating iron deficiency anemia from
thalassemia minor. Blood Cells., 15: 481.
• Griese, E. U.; Kohen, E. and Horst, J. (1985). Heterogenity of the α –
globin gene defects in German α –thalassemia affected families. Human.
Genet., 71:134 -137.
• Gulen, M. D.; Mehmet Akif; Ozgunen, M. D.; Gunes, T. and Yurger, M.
(1999). Prenatal diagnosis of hemoglobinopathies. Ann. Med. Sci., 8:93 -
97.
• Gurgey, A.; Mesci, L.; Beksac, S. and Onderoglu, L. (1991). Prenatal
diagnosis in hemoglobinopathies. TUJ. Med.Sci., 5: 491 – 425.
• Haig, H. and Kazazian, J. (2002). PCR Technology Principles and
Application. edt. Erlich, H. A. Stockton Press, New York.
• Hall, G. W.; Franklin, I. M.; Sura, T. and Thein, S. L. (1991). A novel
mutation in exon 3 of the beta globin gene produces a variable thalassemia
phenotype. Br. J. Haematol., 79: 342 -344.
• Hamilton, S.R.; Miller, M.E. and Jess, P.M. (1979). Comparison of
microchromatography and electrophorsis with elution of hemoglobin
(HbA2) quantitation. Am. J. Cli. Pathol., 71: 388.
• Hartveled, C. L.; Beijer, C.; Van delft, P.; Zanardini, R.; Bernini, L. F. and
Giordano, P. C. (2000). α –thalassemia as aresult of a novel splice donor
site mutation of the α –globin gene. Br. J. Haematol., 110: 694 -698.
88
References
• Heisman, T. H. (1992). The beta and delta –thalassemia repository.
Hemoglobin., 16:237 -258.
• Ingram, V.M. and Stretton, A. (1959). Genetic basis of thalassemia
disease. Nature., 19 :1903 – 1909.
• Ingram, M. and Minter, F. (1969). Semi –automatic preparation coverglass
blood smears using a centrifugal device. Am. J. Clin. Pathol. 5:214.
• Kanavakis, E.; Traeger, J.; Vertuo, C.; Maragoudaki, E.; Tzetis, M. and
Kattamis, C. (1997). Prenatal diagnosis of thalassemia syndromes by rapid
DNA analytical methods. Mol. Human. Rep. 3:523-528.
• Kattamis, A. C.; Camaschella, C.; Sivera, P.; Surrey, S. and Fortina, P.
(1996). Human α –thalassemia syndromes: detection of molecular defects.
Am. J. Haematol., 53: 81 -91.
• Kattamis, C.; Panayotis, L.; Metaxotou –Mavromati, A. and Matsaniatis,
N.J. (1972). Serum iron and unsaturated iron binding capacity in β–
thalassemia trait; their relation to the levels of HbA2 and F. Med. Genet.,
9: 154.
• Kattamis, C.; Efremov, G. and Pootrakul, S. (1981). Effectiveness of one
tube osmotic fragility screening in detecting β –thalassemia trait. J. Med.
Genet., 18: 266 -270.
• Kazazin, H.H. and behm, C.D. (1988). Molecular basis and prenatal
diagnosis of β –thalasemia . Blood., 72: 1107 -1116.
• Khider, H.H. (1986). Beta thalassemia major in Mosul, A thesis submitted
to College of Medicine in Mosul. Ministry of Higher Education and
Scientific Research. Iraq.
89
References
• KO. T.M.; Hsu, P.M.; Chen, C.J.; Hsieh, F.J.; Hsieh, C.Y. and Lee TY.
(1989). Incidence study of heterozygous beta thalassemia in Northern
Taiwan. Taiwan I . Hsueh. Hin. Tsa Chin., 88 :678 -681.
• Lacerra, G.; Fioretti, G.; Anglioletto, M.; Pagano, L.; Guardino, E.; Bonis,
C.; Viola, A.; Maglione, G.; Scarallo, A.; De Rosa, L. and Carestia, C.
(1991). A novel α – thalassemia deletion with the break points in the α2 –
globin gene and in close proximity to an Alu family repeat between the
pseudo α2 – pseudo α1 –globin genes. Blood, 78: 2740 -2746. • Lam, Y. H.; Ghosh, A.; Tang, M. H. and Chan, V. (1997). The risk of α –
thalassemia carriers in Hong Kong. Prenat. Diagn., 17: 733 -736.
• Losekoot, M.; Fodde, R.; Gerritsen, E. J.; Van de Kut, I.; Schreuder, A.;
Giordano, P. C.; Vossen, M. and Bernini, L. F. (1991). Interaction of two
different disorders in the β –globin gene cluster associated with an
increased HbF production. Blood. 77:861-867.
• Loukopoulos, D., Hadji, A. and Papadakis, M. (1990). Prenatal diagnosis
of thalassemia and sickle cell syndrome in Greece. Ann. NY. Acad. Sci.,
612: 226 -236.
• Lucarelli, G.; Galimberti, M. and Polchi, P. (1992). Bone marrow
transplantation in adult thalassemia. Blood, 80: 1603 -1607.
• Makerydimas, G.; georgion, I.; Karnas, V.; Zikopoulos, K. and Lotis, D.
(1997). Prenatal diagnosis of β –thalassemia by coelocentesis. Mol. Hum.
Reprod., 3: 729 – 731.
• Makler, M.T. and Pesce, A.J. (1980). ELIZA assay for measurement of
haemoglobin A and haemoglobin F. AM. J. clin. Path., 74: 673.
• Marengo –Rowe, A. (1965). Rapid electrophoresis and quantitation of
hemoglobins on cellulose acetate. J. Clin. Pathol. 18:790.
90
References
• McGhee, D. and Payne, M. Haemoglobinopathies and haemoglobin
defects. In: Rodak BF (1995). Diagnosis Haematology, Philadelphia, W.
B. Saunders Company. 266 -268.
• Michiels, J. J. and Giordano, P. C. (1996). A de novo deletion causing εγ
δβ –thalassemia in Dutch patient. Acta Haematologica. 96:108-109.
• Nico, P.; Villiers, J. and Maritha, J. (1999). Significans of linkage
disequilibrium between mutation C282 Y and an Mse I polymorphism in
population screening and DNA dignosis of hemochromatosis. Blood Cells.
Mol. Dis., 15: 250 -252.
• Olivieri, N. F. and Nathan, D. G. (1994). Survivalin medically treated
patients with homozygous β –thalassemia. J. Med. 331:574-578.
• Pearson, H. A. (1996). Current trends in the management of homozygous
β –thalassemia . Ann. Saudi. Med., 16:554 – 558.
• Perniola, R.; de Rinaldis, C. and Muratore, M. (1998). Thalassemic
patients with osteopenia. J. Pediatr. End, Met., 11: 995 -996.
• Renney, H.M. and Sharma, V. Structure and function of hemoglobin. In.
Butler E, Lichtman MA, Coller BS, Kipps TJ. (1995). Williams
Hematology, 5th ed. New York, McGraw Hill, pp. 417-425.
• Rodeck, C. H. (1993). Fetal development after Chorionic villus sampling.
Lancet, 241:468 -469.
• Rowley, P. T.; Fisher, L.; Lipkin, M. (1976). Screening and genetic
counseling for beta thalassemia trait. Am. J. Hum. Genet. 31:781.
• Rucknagel, D.L.; Schmidt, R.M. and Necheles, T.F. (1974). Comparison
of methologies for thalassemia screening by haemoglobin A2 quantitation.
J. Lab. Clin. Med., 86:873 -880.
91
References
• Ryan, T. M.; Sun, C. W.; Jinxiang, R. and Towns, T. M. (2000). Human δ
–globin gene promoter element regulates. Nuc. Acid. Res., 28:2736 –
2740.
• Schier, S.L.; Rachmilewitz, E. and Mohandas, N. (1989). Cellular and
membrane properties of alpha and beta thalassaemic erythrocyte are
different : Implication for differences in clinical manifestations. Blood.,
74: 2194 – 2202.
• Schwartz, E. (1969). The silent carrier of beta thalassaemia. N. Eng. J.
Med., 24: 1327 -1333.
• Slighton, J. L.; Blechl, A.E. and Smithies, O. (1980). Human fetal Gγ – and Aγ –globin genes: complete nucleotide sequences suggest that DNA can be
exchanged between these duplicated genes. Cell, 21: 627 -630.
• Steinberg, M.H. and Dreiling, B.J. (1983). Microcytosis, its significance
and evaluation. JAMA., 249(1): 85 -87.
• Takihara, Y.; Nakamura, T. and yamada, H. (1986). A novel mutation in
the TATA box in Japanese patient with β+ -thalassemia. Blood., 67:547 -
549.
• Telen, M.J. and Kaufman RE. The mature erythrocyte. In :Lee GR,
Foerster J, Lukens J, Paraskevas F, Greer JP, Rodgers GM. (1999).
Wintrobe's Clinical Hematology, 10th ed. Baltimore, Williams and
Wilkins, pp 193 – 227.
• Thein, S.L.; Hesketh, C.; Tayler, P.; Temperely, I. J.;Hutchinson, R. M.;
Old, J. M.; Wood, W. G.; Cleeg, J. B. and Weatherall, D. J. (1990). The
beta –thalassemia; non –deletional mutants. Proc. Nat. Acad. Sci. USA,
87:3924 -3928.
92
References
• Thein, S. L.; Old, J. M.; Wainscot, J. S. and Weatherall, D. J. (1994).
Population and genetic studies suggest a single origin for the Indian
deletion β0 –thalassemia. Br. J. Haematol., 57:271-274.
• Trager, S. J.; Kanavakis, E.; Tzetis, M.; Kattamis, A. and Kattamis, C.H.
(1993). Characterization of non – deletional α –thalassemia mutation in the
Greek population. Am. J. Hematol., 44:162- 167.
• Vara walla, N. Y.; Fitches, A. C. and Old, J. M. (1992). Analysis of β –
gene haplotypes in Asian Indians. Human. Genet., 90:443 -449.
• Wainscoat,J. S.; Old, J. M. and Orkin, S. H. (1983). The molecular basis
for the clinical diversity of β –thalassemia in Cypriots. Lancet. 1:1235-
1237.
• Wasi, P. (1969). Alpha and beta thalassemia in Thailand. Annals of New
York Academy of Science., 60-165.
• Watson, H. and Kendrew, C. (1961). Comparison between the amino acid
sequences of sperm whale muoglobin and human hemoglobin. Nature
(London), 190:670.
• Weatherall, D.J. and Clegg, J.B. (1972). Thalassemia syndromes, 2nd ed.
Oxford, Blackwell Scientific Publications, 100-113.
• Weatherall, D.J. and Clegg, J.B. (1981). The thalassemia syndrome, 3rd
ed., Blackwell Scientific Publications, 200-208.
• Weatherall, D. J. (1986). Molecular biology at the beside. Br. Med. J.
292:1505.
• Weatherall, D. J.; Clegg, J. B.; Higgs, D. R. and Wood, W. G. (1989). The
hemoglobinopathies, in the metabolic basis of inherited disease. Scriver,
C. R.; Al –Beaudet, W. S. sly; Valle, D.(eds.), McGraw Hill, New York,
USA.81.
93
References
• Weatherall D. J. (1995). Thalassemia. In: Ernest B.; Marshall, A.; Barry,
S. C. and Tomas, J. K. McGrow Hill.:581 -589.
• Weatherall, D.J. (1996). Disorders of the synthesis and function of
hemoglobin. In: Weatherall DJ, Ledingham JGG, Warell DA, (eds.)
Oxford Texybook of Medicine, 3rd ed. oxford, New York, pp. 3500- 3520.
• Weatherall, D.J. (1999). Genetic disorders of hemoglobin. In: Hoffbrand A
V, Lewis S M, Tuddenham EGD. (eds.): Post graduate Hematology, 4th ed.
Oxford, Butterworth –Heinemann, pp. 91 -119.
• Weatherall, J. S. and Weather, D. J. (1987). Thalassemia intermedia.
Blood Review, 1:273 -279.
• W.H.O. Working Group. (1982). Hereditary anaemias, Genetic basis,
clinical features, di8agnosis and treatment. Bulletin of the World Health
Organization, 60:643 -660.
• Wickramasinghe, S. N. and Lee, M. J. (1998). Evidence that the ubiquitin
proteolytic pathway is involved in the degradation of precipitated globin
chains in thalassemia. Br. J. Hematol. 101:245 -250.
• Wilson, J.B.; Headlee, M.E. and Huisman, T.H. (1983). A new high
performance liquid chromatographic procedure for the separation and
quantitation of various hemoglobin variants in adults and newborn babies.
J. Lab. Clin. Med., 102(2):174 -86.
• Winchagoon, P.; Thonglairoam, V.; Fucharoen, S.; Wiliarat, P.; Fukumaki,
Y. and Wasi, P. (1993). Severity difference in β0 –thalassemia syndromes.
Br. J. hematol. 83:633-639.
• Wong, C.; Dowling, C. E. and Saiki, R. K. (1987). Characterization of β –
thalassemia mutations using direct genomic sequencing of amplified single
copy DNA. Nature (London), 330: 384 -387.
94
References
• Yuregir, G. T.; Arpacl, A.; Aksoy, K.; Tuli, A.; Dikmen, N.; Ozgonen, T.
and Kilinc, Y. (1995). Population at risk for hemoglobinopathies in
Cukurova Turkey: need for prenatal diagnosis. Ann. Med. Sci. 4:61-69.
• Zhang, J.; Cai, S. and Kan, Y.W. (1990). Prenatal diagnosis of thalassemia
in South China. Ann. NY. Acad. Sci., 612:264 -267.
95
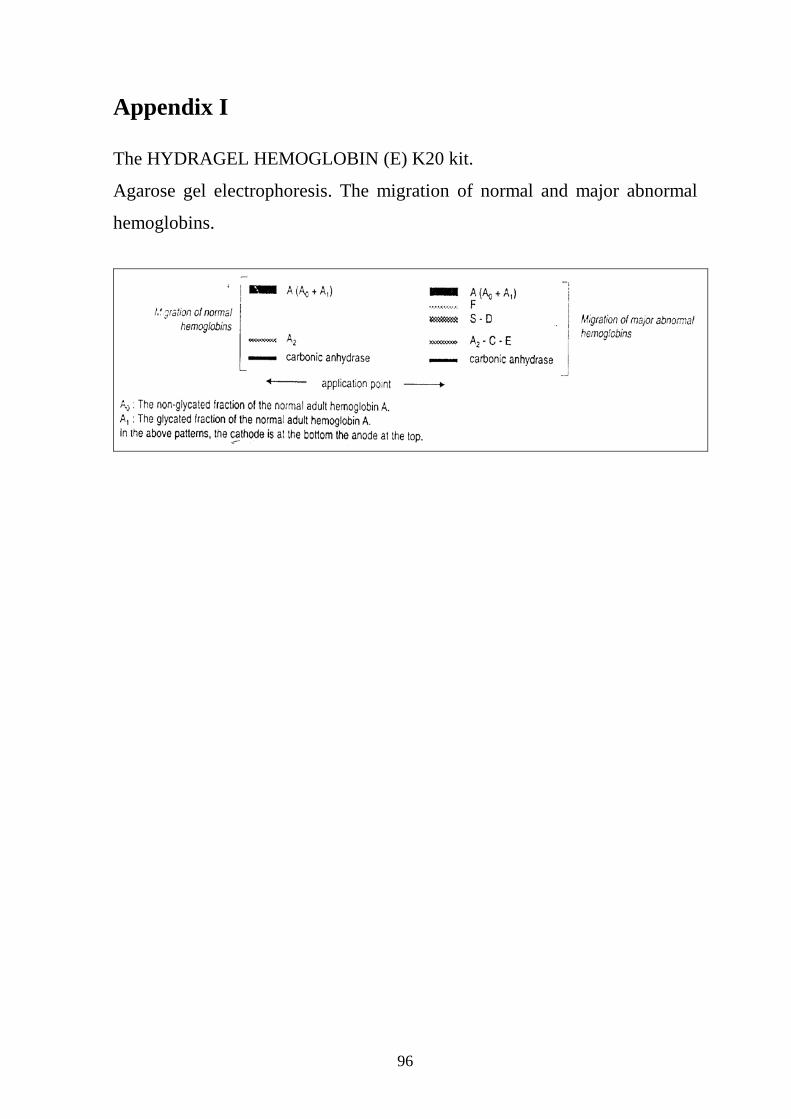
Appendix I The HYDRAGEL HEMOGLOBIN (E) K20 kit.
Agarose gel electrophoresis. The migration of normal and major abnormal
hemoglobins.
96
الملخصم�ن ةمئة عینفي لفقر دم البحر الابیض المتوسط في ھذه الدراسة تم اجراء تحلیل جزیئي ووراثي
العائل�ة دراس�ة ش�جرة و مول�ي لل�دالتحلی�ل الا، الدراس�ة تض�منت. من سكان مدینة بغداد حاملي المرض
وتحلی�ل ، لھیموغل�وبینا الكھرب�ائي لن�وع تحلی�لالو (pedigree analysis)لحاملي الم�رض واق�اربھم
.خاص الطبیعیینشبالمقارنة مع الا مكل ذلك ت، جین البیتا غلوبین على المستوى الجزیئي
، β- minorثلاسیمیا نوع لل حامللمئة الجزء الاول من الدراسة تضمن اجراء الفحص المختبري
، PCV ،MCVتض�من لي للدمالاوالتحلیل . في بغداد والذین قدموا الى مختبر الصحة العام المركزي
النس�ب للاش�خاص بینم�ابص�ورة عام�ة لن�اقلینل% ۳۸-۳۲ك�ان PCVاظھرت ان النتائج . MCHو
۹٥fl-۸۰و للناقلین ٦٥fl-٦۲كان MCVو، للذكور% ٥۲-٤۲للاناث و% ٤۸-۳٦الطبیعیین كانت
.بیعیینللاشخاص الط pg ۳۳٫۲-۲۷٫٥و للناقلین ۲٦pg-۱۹كان MCHو ، للاشخاص الطبیعیین
A2 ، ارتف��اع نس��ب ھیموغل��وبین النت��ائج تاظھ��ر Fو A2 A و تحلی��ل ت��م عل��ى ذل��ك ع��لاوة
الن�اقلین ف�ي .قارنة مع الاش�خاص الطبیعی�ینبالم ھیموغلوبین A ونق�ص بنس�ب
ھیموغلوبین
حی�ث ان�ھ ھ�ذه ) RBCs(ال�دم الحم�راء تاكری�وج�د بان�ھ ھن�اك تغی�رات مظھری�ة ل، لذلك لاضافةاب
ت ال�دم الب�یض كری�ابینم�ا ،كنتیجة لھذا الم�رض تكون اصغر من الحجم الطبیعي وشاحبة اللونالخلایا
.كانت في المستویات الطبیعیة للناقلین
تحلی��ل الھیموغل��وبین للاب��اء الن��اقلین واطف��الھم المص��ابین ، "تض��من ھ��ذا الج��زء م��ن الدراس��ة ایض��ا
النت�ائج بان�ھ ھن�اك اخ�تلاف اظھ�رت ثلاثة تقنی�ات للتحلی�ل الكھرب�ائي و استخدامب، بتناذر البیتا ثلاسیمیا
بالاضافة .التي اخذت لاكمال ھذه الدراسةبسیط بنسب الھیموغلوبین بین الناقلین الذین مثلو عینات الدم
بالمقارنة م�ع الاش�خاص ، الھیموغلوبین بین الناقلین والمصابینبنسب واضح ھناك اختلاف لذلك كان
.الطبیعیین
ة بتن�اذر البیت�ا ثلاس�یمیا بالاعتم�اد عل�ى بیان�ات ت�م الحص�ول علیھ�ا دراسة العوائل المصاب كما تمت
في " خصوصا، وعلى تاریخ العائلة حیث اظھرت الدراسة كیفیة انتقال ھذه الصفة عبر الاجیال" مسبقا
.العوائل التي تفضل زواج الاقارب
تقنی�ة وذل�ك باس�تخدام الجزء الثاني من الدراسة تضمن اجراء التحلی�ل الجزیئ�ي عل�ى مس�توى ال�دنا
بلاضافة لاس�تخدام ان�زیم ، واربعة بوادئ خاصة لھذا التفاعل PCR)(التفاعل المتسلسل لانزیم البلمرة
ز. .(Bsu I)خاص لغرض القطع
وجود طفرة في الكودون السادس لجین البیتا غلوبین في الناقلین والتي ادت القطع نتائجاظھرت
ي في عملیة التعبیر الجیني لجین البیتا غلوبین بالمقارنة مع الاشخاص الطبیعیین حیث ان الى تثبیط جزئ
. (Bsu36 I)

مما ادى الى ظھور حزمة واحدة للدنا عند ترحیل العینة على ھذه الطفرة حدثت في الیل واحد لھذا الجین
وج�ود موق�ع مؤك�دة ملاھ�وجود ح�زمتین عل�ى ال بینما اظھرت نتائج ترحیل دنا الشخص الطبیعي، ملاھال
. دوث اي تغیی��������������������ر ف�������������������ي التعبی��������������������ر الجین��������������������يالقط�������������������ع وع��������������������دم ح�������������������
جمھوریة العراق
وزارة التعلیم العالي والبحث العلمي جامعة النھرین
كلیة العلوم
β –minorدراسة وراثیة جزیئیة لتنادر ثلاسیمیا
رسالة
ة العلوم في جامعة النھرینمقدمة الى كلی
وھي جزء من متطلبات نیل درجة الماجستیر في علوم التقانة الاحیائیة
من قبل
رقیة حازم عبد اللطیف العزي
2004 –كلیة العلوم -بكالوریوس تقانة إحیائیة
جامعة النھرین بإشراف
محمد عبد القادر ابراھیم. د.أ
عبد الباسط نصیف جاسم. د
تشرین الاول ۲۰۰۷ ۱٤۲۸ شوال