Modelling city specific situations - European Commission · - It is based on a unique full air...
13
Modelling city specific situations O. Väkevä, A. Kousa (Helsinki City/HSY) E. Pisoni (Jrc)
Transcript of Modelling city specific situations - European Commission · - It is based on a unique full air...
Modelling city specific
situationsO. Väkevä,
A. Kousa(Helsinki City/HSY)
E. Pisoni (Jrc)
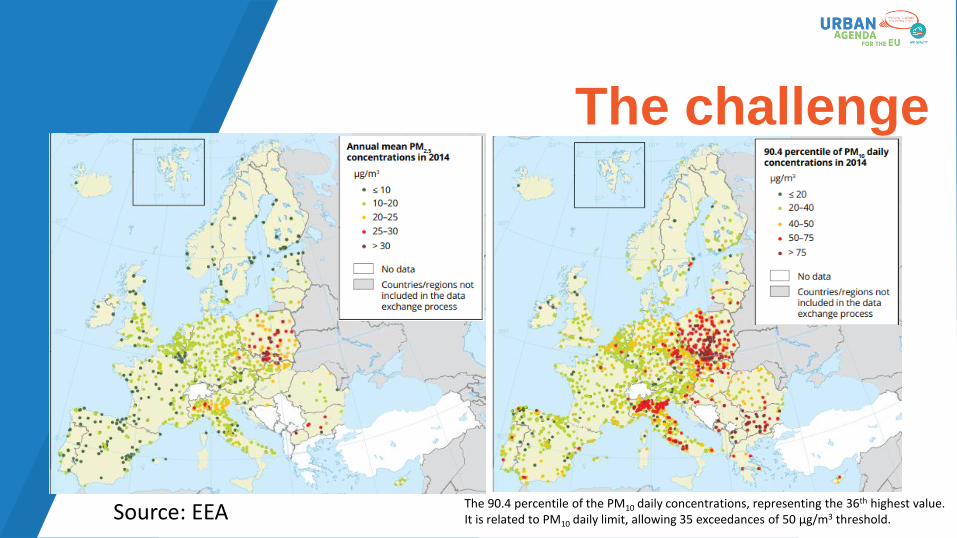
The challenge
Source: EEA The 90.4 percentile of the PM10 daily concentrations, representing the 36th highest value. It is related to PM10 daily limit, allowing 35 exceedances of 50 μg/m3 threshold.
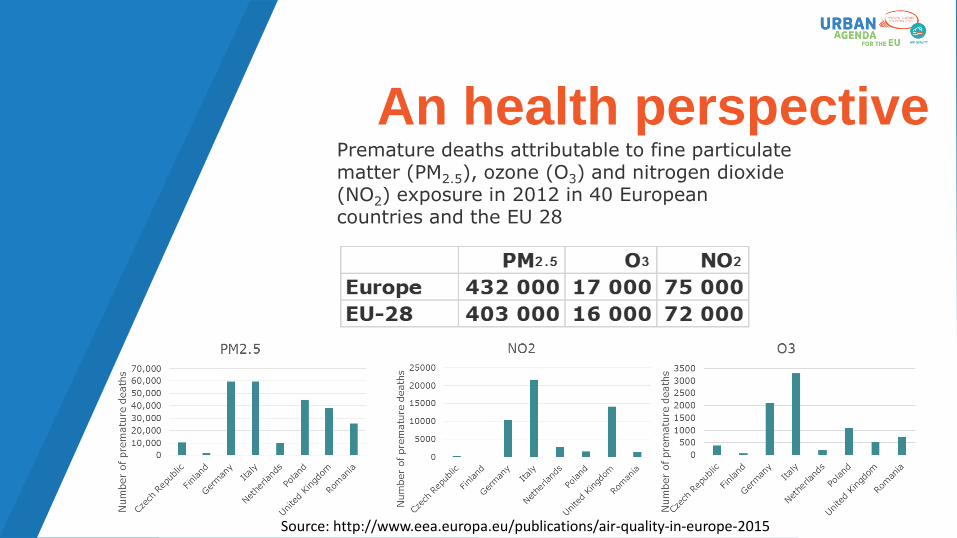
An health perspectivePremature deaths attributable to fine particulate matter (PM2.5), ozone (O3) and nitrogen dioxide (NO2) exposure in 2012 in 40 European countries and the EU 28
Source: http://www.eea.europa.eu/publications/air-quality-in-europe-2015

Outline of the work
- Bottom-up approachQuestionnaire and “Catalogue of measures”
- Top-down approachSHERPA model (http://aqm.jrc.ec.europa.eu/sherpa.aspx)
How the cities defined key
measures• On the basis of emission inventories (national, regional, local)
• On the basis of modelling: all cities used different models, from national, regional and city level to local street canyon models
• Through projections of future emissions without measures (BAU) and with the planned measures taking place
• Linking with other plans, such as SUMP (Sustainable Urban Mobility Plan) and SEAP (Sustainable Energy Action Plan)
Barriers and positive issues
Barriers
• Governance: air quality planning is not always the responsibility of the
city (but cities in charge of SUMP, SEAP, …)
• Uncertainty of emission factors for traffic emissions (esp. diesel) and
residential biomass burning
• Legislation does not everywhere allow for a city to collect congestion
charges, and use the revenue to finance local investments
Positive issue:
• Cooperation between national, regional and local government
• Synergies between AQ effects and climate as well as noise
• Use of modelling to test effect of measures

Outline of the work
- Bottom-up approachQuestionnaire and “Catalogue of measures”
- Top-down approachSHERPA model (http://aqm.jrc.ec.europa.eu/sherpa.aspx)
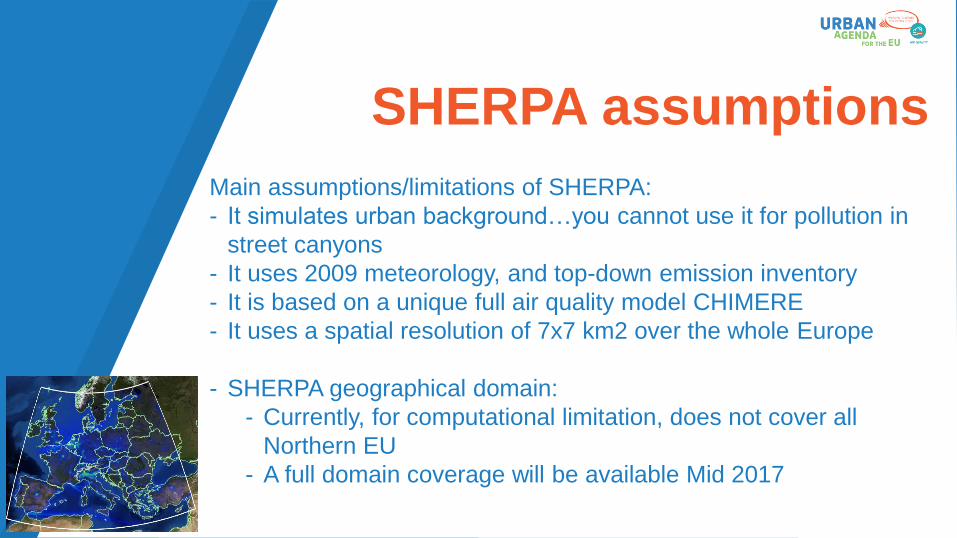
SHERPA assumptions
Main assumptions/limitations of SHERPA:
- It simulates urban background…you cannot use it for pollution in
street canyons
- It uses 2009 meteorology, and top-down emission inventory
- It is based on a unique full air quality model CHIMERE
- It uses a spatial resolution of 7x7 km2 over the whole Europe
- SHERPA geographical domain:
- Currently, for computational limitation, does not cover all
Northern EU
- A full domain coverage will be available Mid 2017
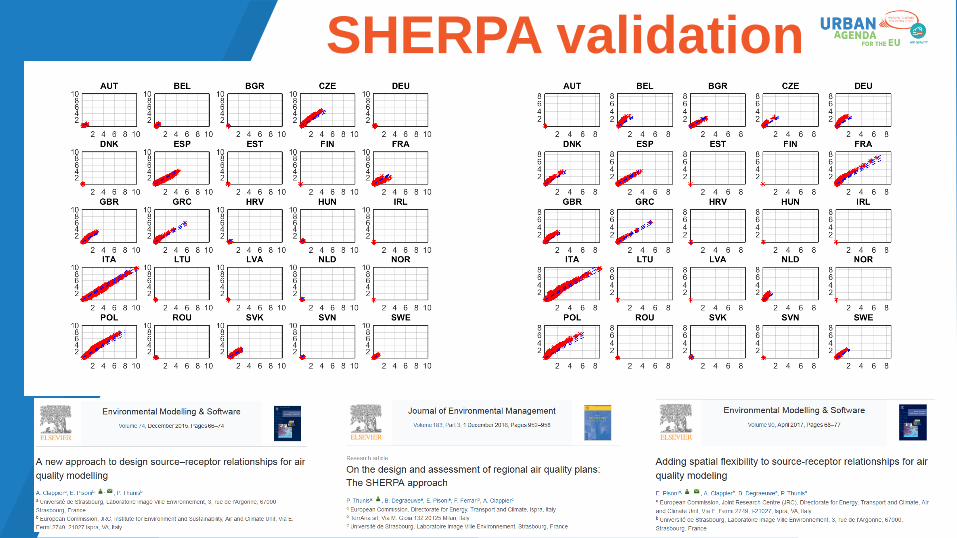
SHERPA validation
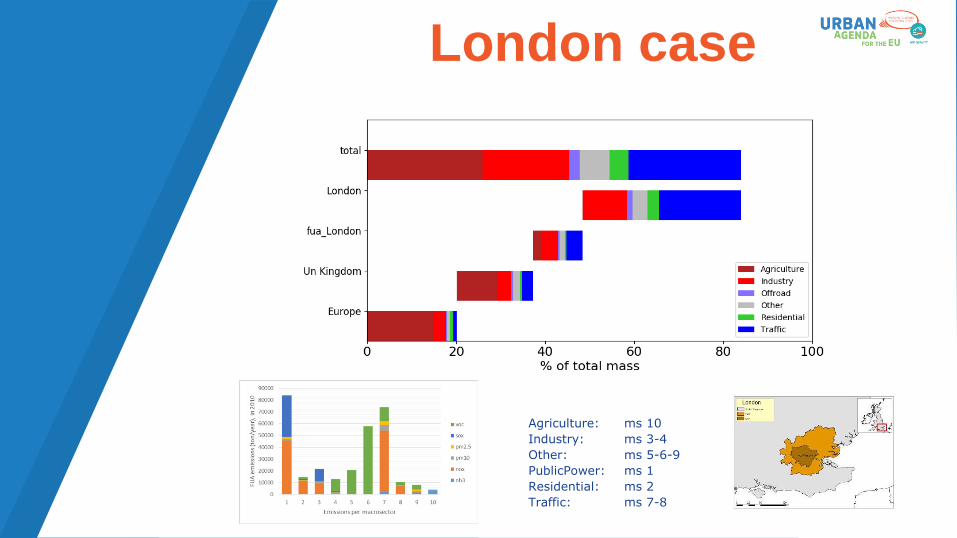
London case
Agriculture: ms 10
Industry: ms 3-4
Other: ms 5-6-9
PublicPower: ms 1
Residential: ms 2
Traffic: ms 7-8
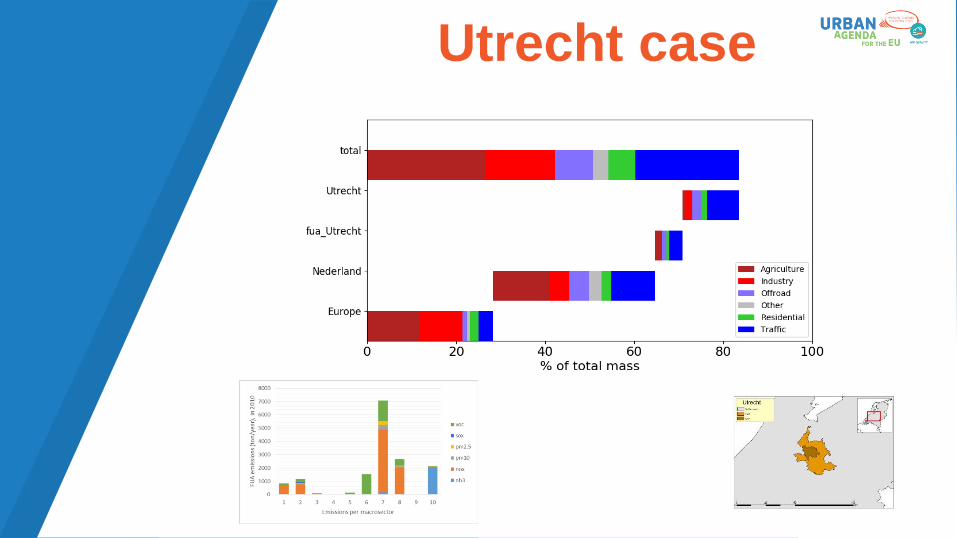
Utrecht case
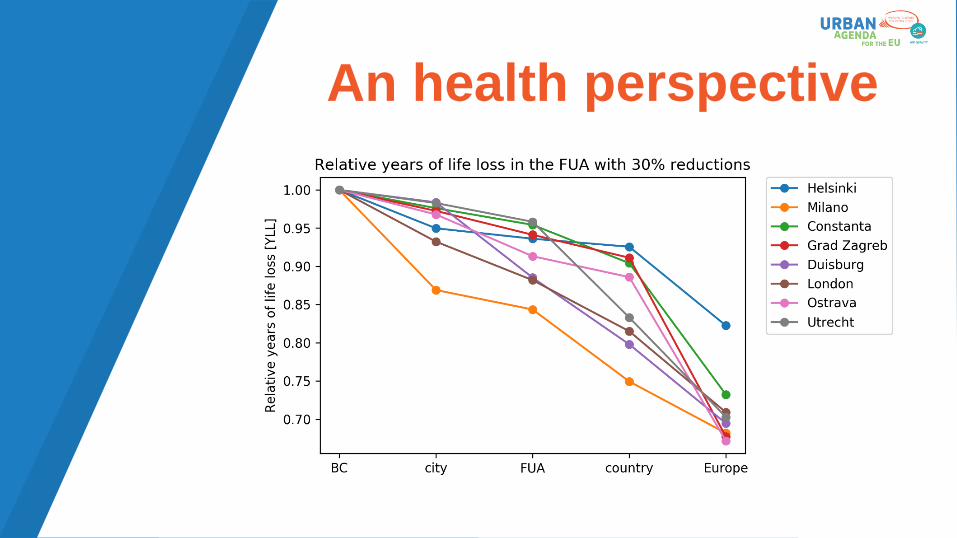
An health perspective
Conclusions
• WP1 contributed to better understanding of the current air quality situation (PM and NO2), from geographical and sectoral point of view
• Focus on PM2.5: health impact is still an issue
• For the analysis, there is room for improvement, i.e. with more accurate input data
• One option to be explored: integrating the two information (TP-BU), so that the top-down approach can be applied to more cities in a robust way
Contacts: [email protected] ?


![HOMOLOGY OF CURVES AND SURFACES IN CLOSEDmarkovic/LM.pdf · HOMOLOGY AND QF SUBSURFACES 3 of [KM2] in the 3-dimensional case. For an oriented closed hyperbolic 3-manifold M, we will](https://static.fdocument.org/doc/165x107/5edc9e70ad6a402d66675caa/homology-of-curves-and-surfaces-in-markoviclmpdf-homology-and-qf-subsurfaces.jpg)


![IT [A gymnasiou] ENOTHTA A1](https://static.fdocument.org/doc/165x107/55842287d8b42a785e8b45dd/it-a-gymnasiou-enothta-a1.jpg)