JournalofGeotechnicalandGeoenvironmentalEngineering,Vol ... · E ectof uniformitycoe cienton G=Gmax...
14
Journal of Geotechnical and Geoenvironmental Engineering, Vol. 139, No. 1, pp. 59-72, 2013 Effect of uniformity coefficient on G/G max and damping ratio of uniform to well graded quartz sands T. Wichtmann i) ; Th. Triantafyllidis ii) Abstract: The modulus degradation curves G(γ )/G max and the damping ratio D(γ ) of 27 clean quartz sands with specially mixed grain size distribution curves were measured in approximately 280 resonant column tests. For each material, tests with different pressures and densities were performed. Based on the test data it is demonstrated that the shear modulus degradation is larger for higher values of the uniformity coefficient, C u = d 60 /d 10 , while it is rather independent of the mean grain size, d 50 . The observed C u -dependence of the curves G(γ )/G max is not adequately described by common empirical equations, because theses equations were developed based on tests on uniform granular materials. In order to consider the influence of the uniformity coefficient, the paper proposes correlations of the parameters of the common empirical equations with C u . Good agreement between the prediction of the extended empirical equations and experimental data collected from the literature is demonstrated. Furthermore, the test data reveal that the curves of damping ratio, D(γ ), and the threshold shear strain amplitude indicating the onset of residual deformation accumulation, γ tv , are rather independent of d 50 and C u . The threshold shear strain amplitude at the onset of modulus degradation, γ tl , slightly decreases with increasing values of d 50 and C u . CE Database subject headings: Shear modulus; Damping ratio; Quartz sand; Grain size distribution curve; Uniformity coefficient; Resonant column tests; 1 Introduction The secant shear modulus, G, and the damping ratio, D, are key design parameters for soils subjected to dynamic loading. It is well known that both quantities are strongly strain- dependent. If a certain threshold value of the shear strain amplitude, γ , is surpassed, the shear modulus, G, decreases with γ while the damping ratio, D, increases. Contrary to the small-strain shear modulus, G max = G(γ< 10 -6 ), which can be determined from shear wave velocity measurements, the modulus degradation curves, G(γ )/G max , and the damping ratio, D(γ ), cannot be easily quantified in-situ. Therefore, if laboratory test data are not available, the modulus degrada- tion and the damping ratio are often estimated by means of empirical equations or chosen based on typical ranges pro- vided in the literature (see the summary in Section 2). The common empirical equations for G(γ )/G max and D(γ ) were developed based on tests on granular materi- als with uniform grain size distribution curves. It has not been proven experimentally yet that these equations are also applicable to well-graded granular materials. Wichtmann & Triantafyllidis [35,36] have demonstrated that the com- mon empirical equations for the small-strain shear modulus ,G max , e.g. the formula proposed by Hardin and Black [4], do not adequately describe the C u -dependence of G max ob- served in laboratory tests. In those tests, for constant val- ues of void ratio and mean pressure, the small-strain shear modulus, G max , and the P-wave velocity, v P , were found in- dependent of mean grain size, d 50 , but strongly decreasing with increasing uniformity coefficient, C u = d 60 /d 10 . In or- der to consider this influence, correlations of the parameters of several empirical equations for G max and v P with C u have i) Research Assistant, Institute of Soil Mechanics and Rock Mechan- ics, Karlsruhe Institute of Technology (KIT), Germany (corresponding author). Email: [email protected] ii) Professor and Director of the Institute of Soil Mechanics and Rock Mechanics, Karlsruhe Institute of Technology (KIT), Germany been proposed by Wichtmann & Triantafyllidis [35,36]. Based on the data from approximately 280 resonant col- umn tests performed on 27 clean quartz sands, the present paper examines the influence of the grain size distribution curve on modulus degradation, G(γ )/G max , on damping ra- tio, D(γ ) and on the threshold shear strain amplitudes, γ tl and γ tv , indicating the onset of modulus degradation or the onset of residual deformation accumulation, respectively. The need for an extension of the common empirical equations describing modulus degradation considering the influence of C u is demonstrated. 2 Empirical equations for G(γ )/G max and D(γ ) It is well known that the modulus degradation and the damping ratio are pressure-dependent. For certain shear strain amplitude, the ratio G/G max increases with increas- ing pressure while the damping ratio, D, decreases (Hardin & Drnevich [6], Kokusho [11], Seed et al. [25]). In contrast, the curves G(γ )/G max and D(γ ) are rather independent of soil density (e.g. Kokusho [11]). Several empirical formulas have been proposed in the lit- erature. Those used in this paper are presented in the follow- ing. Hardin & Drnevich [5] describe the curves G(γ )/G max by: G G max = 1 1+ γ γr (1) or by the more flexible function G G max = 1 1+ γ γr h 1+ a exp -b γ γr i (2) with two curve-fitting parameters a and b and with the ref- erence shear strain defined as γ r = τ max G max (3) 1
Transcript of JournalofGeotechnicalandGeoenvironmentalEngineering,Vol ... · E ectof uniformitycoe cienton G=Gmax...
Journal of Geotechnical and Geoenvironmental Engineering, Vol. 139, No. 1, pp. 59-72, 2013
Effect of uniformity coefficient on G/Gmax and
damping ratio of uniform to well graded quartz sands
T. Wichtmanni); Th. Triantafyllidisii)
Abstract: The modulus degradation curves G(γ)/Gmax and the damping ratio D(γ) of 27 clean quartz sands with speciallymixed grain size distribution curves were measured in approximately 280 resonant column tests. For each material, testswith different pressures and densities were performed. Based on the test data it is demonstrated that the shear modulusdegradation is larger for higher values of the uniformity coefficient, Cu = d60/d10, while it is rather independent of the meangrain size, d50. The observed Cu-dependence of the curves G(γ)/Gmax is not adequately described by common empiricalequations, because theses equations were developed based on tests on uniform granular materials. In order to consider theinfluence of the uniformity coefficient, the paper proposes correlations of the parameters of the common empirical equationswith Cu. Good agreement between the prediction of the extended empirical equations and experimental data collected fromthe literature is demonstrated. Furthermore, the test data reveal that the curves of damping ratio, D(γ), and the thresholdshear strain amplitude indicating the onset of residual deformation accumulation, γtv, are rather independent of d50 and Cu.The threshold shear strain amplitude at the onset of modulus degradation, γtl, slightly decreases with increasing values ofd50 and Cu.
CE Database subject headings: Shear modulus; Damping ratio; Quartz sand; Grain size distribution curve; Uniformitycoefficient; Resonant column tests;
1 IntroductionThe secant shear modulus, G, and the damping ratio, D, arekey design parameters for soils subjected to dynamic loading.It is well known that both quantities are strongly strain-dependent. If a certain threshold value of the shear strainamplitude, γ, is surpassed, the shear modulus, G, decreaseswith γ while the damping ratio,D, increases. Contrary to thesmall-strain shear modulus, Gmax = G(γ < 10−6), which canbe determined from shear wave velocity measurements, themodulus degradation curves, G(γ)/Gmax, and the dampingratio, D(γ), cannot be easily quantified in-situ. Therefore, iflaboratory test data are not available, the modulus degrada-tion and the damping ratio are often estimated by means ofempirical equations or chosen based on typical ranges pro-vided in the literature (see the summary in Section 2).
The common empirical equations for G(γ)/Gmax andD(γ) were developed based on tests on granular materi-als with uniform grain size distribution curves. It has notbeen proven experimentally yet that these equations are alsoapplicable to well-graded granular materials. Wichtmann& Triantafyllidis [35, 36] have demonstrated that the com-mon empirical equations for the small-strain shear modulus,Gmax, e.g. the formula proposed by Hardin and Black [4],do not adequately describe the Cu-dependence of Gmax ob-served in laboratory tests. In those tests, for constant val-ues of void ratio and mean pressure, the small-strain shearmodulus, Gmax, and the P-wave velocity, vP , were found in-dependent of mean grain size, d50, but strongly decreasingwith increasing uniformity coefficient, Cu = d60/d10. In or-der to consider this influence, correlations of the parametersof several empirical equations for Gmax and vP with Cu have
i)Research Assistant, Institute of Soil Mechanics and Rock Mechan-ics, Karlsruhe Institute of Technology (KIT), Germany (correspondingauthor). Email: [email protected]
ii)Professor and Director of the Institute of Soil Mechanics and RockMechanics, Karlsruhe Institute of Technology (KIT), Germany
been proposed by Wichtmann & Triantafyllidis [35, 36].Based on the data from approximately 280 resonant col-
umn tests performed on 27 clean quartz sands, the presentpaper examines the influence of the grain size distributioncurve on modulus degradation, G(γ)/Gmax, on damping ra-tio, D(γ) and on the threshold shear strain amplitudes, γtland γtv, indicating the onset of modulus degradation orthe onset of residual deformation accumulation, respectively.The need for an extension of the common empirical equationsdescribing modulus degradation considering the influence ofCu is demonstrated.
2 Empirical equations for G(γ)/Gmax and D(γ)It is well known that the modulus degradation and thedamping ratio are pressure-dependent. For certain shearstrain amplitude, the ratio G/Gmax increases with increas-ing pressure while the damping ratio, D, decreases (Hardin& Drnevich [6], Kokusho [11], Seed et al. [25]). In contrast,the curves G(γ)/Gmax and D(γ) are rather independent ofsoil density (e.g. Kokusho [11]).
Several empirical formulas have been proposed in the lit-erature. Those used in this paper are presented in the follow-ing. Hardin & Drnevich [5] describe the curves G(γ)/Gmax
by:
G
Gmax
=1
1 + γγr
(1)
or by the more flexible function
G
Gmax
=1
1 + γγr
[
1 + a exp(
−b γγr
)] (2)
with two curve-fitting parameters a and b and with the ref-erence shear strain defined as
γr =τmax
Gmax
(3)
1
Wichtmann & Triantafyllidis J. Geotech. Geoenviron. Eng., ASCE, Vol. 139, No. 1, pp. 59-72, 2013
where τmax is the shear strength. Hardin & Kalinski [7]demonstrated that a normalization of γ with a simplifiedfactor
√
p/patm instead of γr (p = effective mean pressure,patm = 100 kPa) is also suitable to purify the modulus degra-dation curves from the influence of pressure. In that case noinformation about τmax is necessary. According to Hardin &Kalinski [7], setting b = 1 in Eq. (2) is sufficient in order todescribe the modulus degradation curves.
A modification of Eq. (1) was proposed by Stokoe et al.[28]:
G
Gmax
=1
1 + (γ/γr)α(4)
with the curvature parameter α. Unlike Eq. (3), the referenceshear strain used in Eq. (4) is defined as γr = γ(G/Gmax =0.5). The pressure-dependence of γr can be described by(Stokoe et al. [28]):
γr = γr1 (p/patm)k (5)
with the reference shear strain, γr1, at p = patm = 100 kPaand with an exponent k.
Hardin & Drnevich [5] proposed the following formulas forthe damping ratio, D(γ):
D
Dmax
=
γγr
1 + γγr
and (6)
D
Dmax
=
γγr
[
1 + a exp(
−b γγr
)]
1 + γγr
[
1 + a exp(
−b γγr
)] (7)
Therein Dmax is an asymptotic value of D at large strainamplitudes and a and b are curve-fitting parameters. Alter-natively, damping ratio is often formulated as a function ofG/Gmax (e.g. Hardin & Drnevich [5], Tatsuoka et al. [30],Khouri [10]). Zhang et al. [40] described this relationship by
D −Dmin = c1 (G/Gmax)2 + c2 (G/Gmax)− (c1 + c2) (8)
with the minimum damping ratio, Dmin, at very small shearstrain amplitudes and with parameters c1 = 0.106, c2 = -0.316 for torsional shear test data and c1 = 0.094, c2 = -0.265for resonant column (RC) test data. The equation proposedby Khouri [10] based on experimental data collected fromthe literature is retrieved from Eq. (8) with Dmin = 0.013,c1 = 0.195 and c2 = -0.515.
The various empirical equations are inspected in the fol-lowing sections, based on the data from the present test se-ries.
3 Tested materials, test device and testing proce-dure
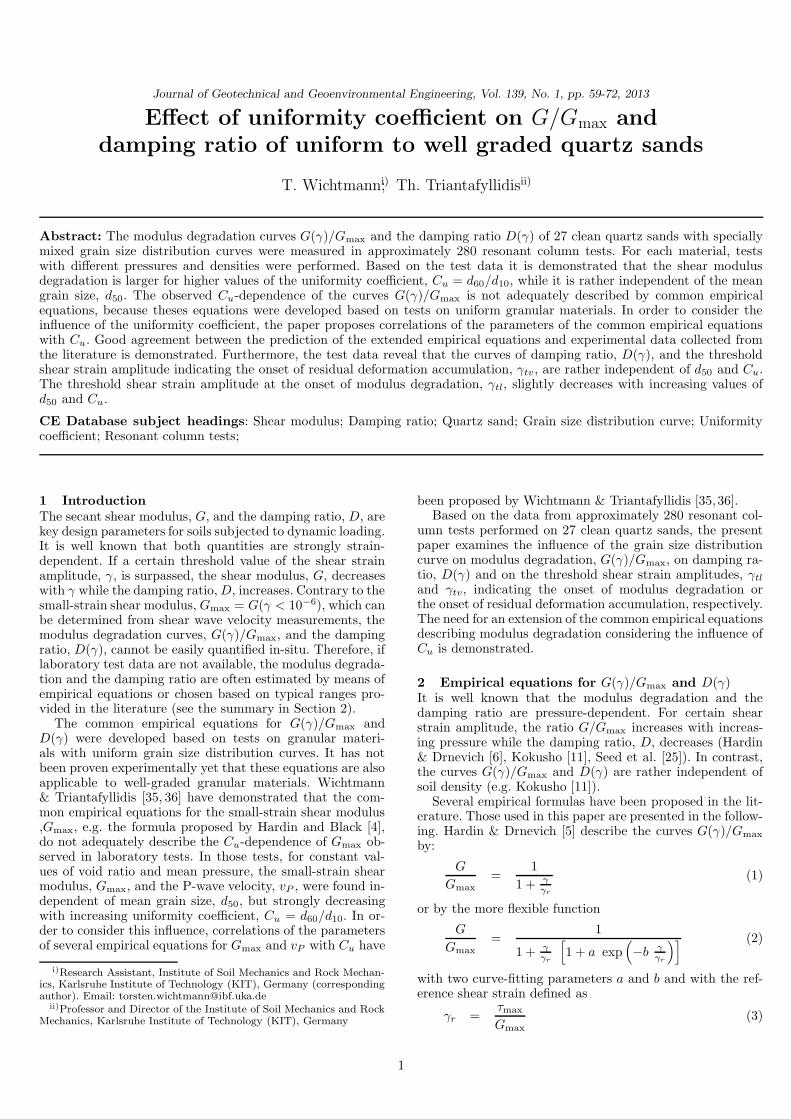
The natural quartz sand and gravel used for the presentstudy was obtained from a sand pit near Dorsten, Germany.Its grain shape is sub-angular and the specific gravity is %s= 2.65 g/cm3. First, the granular material was sieved into 25gradations with grain sizes between 0.063 mm and 16 mm.Then, the grain size distribution curves shown in Fig. 1 weremixed from these gradations. They are linear in the semi-logarithmic scale. The sands and gravels L1 to L8 (Fig. 1a)have a uniformity coefficient of Cu = 1.5 and different meangrain sizes in the range 0.1 ≤ d50 ≤ 6 mm. These materi-als were used to study the influence of d50. The materials
L1 L2 L3 L4
L5 L6
L7 L8
L23L22L21L20
L2L24L25L26
L4L10
L11L12
L16L15
L14L13
L6L17L18L19
0.06 0.2 0.6 2 60.02 200
20
40
60
80
100
SandSiltcoarse coarsefine finemedium medium
Gravel
Gravel
0
20
40
60
80
100
SandSiltcoarse coarsefine finemedium medium
Fin
er b
y w
eigh
t [%
]
Mean grain size [mm]
0.06 0.2 0.6 2 60.02 20Mean grain size [mm]
Fin
er b
y w
eigh
t [%
]
a)
b)
L27
L28
Fig. 1: Tested grain size distribution curves (adapted from Wicht-mann & Triantafyllidis [35])
L24 to L26 (d50 = 0.2 mm, 2 ≤ Cu ≤ 3), L10 to L16 (d50= 0.6 mm, 2 ≤ Cu ≤ 8) and L17 to L23 (d50 = 2 mm,2 ≤ Cu ≤ 8, Fig. 1b) were used to study the Cu-influencefor different values of d50. The two sand-gravel-mixtures L27and L28 (Fig. 1a) have even higher uniformity coefficients(Cu = 12.6 and 15.9). The d50- and Cu-values as well as theminimum and maximum void ratios of the tested materialsare summarized in Table 1.
The resonant column (RC) device used for the presentstudy (see a scheme and a foto given by Wichtmann & Tri-antafyllidis [35]) is a ”free - free” type, meaning both thetop and the base mass are freely rotatable. The cuboidal topmass is equipped with two electrodynamic exciters each ac-celerating a small mass. This acceleration and the resultingacceleration of the top mass are measured with accelerome-ters. From these signals the torsional moment, M(t), and theangle of twist, θ(t), at the top of the sample can be calcu-lated. The sample is enclosed in a pressure cell that can sus-tain cell air pressures, σ3, up to 800 kPa. The state of stressis almost isotropic. A small stress anisotropy results from theweight of the top mass (m ≈ 9 kg), such that the verticalstress, σ1, is slightly higher than the lateral one, σ3. How-ever, for higher cell pressures this anisotropy is of secondaryimportance. Furthermore, test results of Yu & Richart [39]revealed that a stress anisotropy becomes significant onlynear failure.
A sinusoidal electrical signal is generated by a functiongenerator, amplified and applied to the electrodynamic ex-citers. The frequency of excitation is varied until the resonantfrequency, fR, of the system composed of the two end massesand the specimen has been found. By definition, this is the
2
Wichtmann & Triantafyllidis J. Geotech. Geoenviron. Eng., ASCE, Vol. 139, No. 1, pp. 59-72, 2013
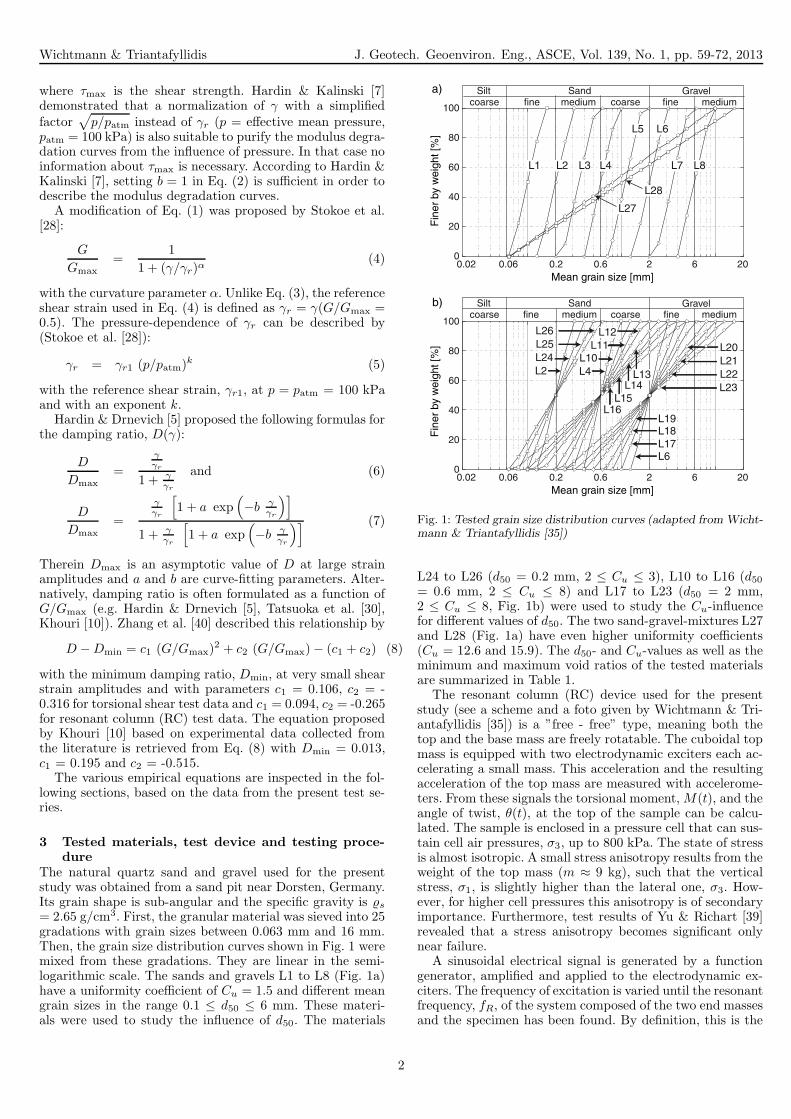
Mat. d50 Cu emin emax Range of Mat. d50 Cu emin emax Range of Mat. d50 Cu emin emax Range of[mm] [-] [-] [-] tested Dr0 [mm] [-] [-] [-] tested Dr0 [mm] [-] [-] [-] tested Dr0
L1 0.1 1.5 0.634 1.127 0.46-0.78 L11 0.6 2.5 0.495 0.856 0.46-1.00 L20 2 4 0.439 0.728 0.65-1.00L2 0.2 1.5 0.596 0.994 0.45-0.94 L12 0.6 3 0.474 0.829 0.45-0.93 L21 2 5 0.401 0.703 0.61-0.99L3 0.35 1.5 0.591 0.931 0.42-0.98 L13 0.6 4 0.414 0.791 0.47-0.87 L22 2 6 0.401 0.553 0.39-1.04L4 0.6 1.5 0.571 0.891 0.43-1.05 L14 0.6 5 0.394 0.749 0.46-0.84 L23 2 8 0.398 0.521 0.45-1.04L5 1.1 1.5 0.580 0.879 0.46-1.02 L15 0.6 6 0.387 0.719 0.54-0.86 L24 0.2 2 0.559 0.958 0.52-0.93L6 2 1.5 0.591 0.877 0.48-0.95 L16 0.6 8 0.356 0.673 0.51-0.87 L25 0.2 2.5 0.545 0.937 0.61-0.95L7 3.5 1.5 0.626 0.817 0.49-0.99 L17 2 2 0.555 0.827 0.50-0.98 L26 0.2 3 0.540 0.920 0.64-0.93L8 6 1.5 0.634 0.799 0.38-1.10 L18 2 2.5 0.513 0.810 0.54-0.99 L27 0.79 12.6 0.327 0.564 0.66-0.94L10 0.6 2 0.541 0.864 0.43-1.02 L19 2 3 0.491 0.783 0.64-1.00 L28 1.0 15.9 0.300 0.460 0.54-0.96
Table 1: Parameters d50, Cu, emin and emax (determined according to German standard code DIN 18126) of the tested grain sizedistribution curves, range of tested initial relative densities Dr0
case when M(t) and θ(t) have a phase-shift of π/2 in time,t. The secant shear modulus
G =
(
2π h fRa
)2
% (9)
is calculated from the resonant frequency, the height, h, andthe density, %, of the specimen. The parameter a is obtainedfrom:
a tan (a) −J2
J0 JL
tan (a)
a=
J
J0+
J
JL(10)
In Eq. (10), J , J0 = 1.176 kg m2, and JL = 0.0663 kg m2
are the polar mass moments of inertia of the specimen, thebase mass and the top mass, respectively. The polar massmoment of inertia of the top mass has been calibrated bymeans of aluminium rods with different diameters and knownstiffnesses.
Different shear strain amplitudes can be tested by varyingthe amplitude of the torsional excitation. All tested speci-mens had a full cross section and measured d = 10 cm indiameter and h = 20 cm in height. The variation of theshear strain amplitude with radius, r, and distance, x, fromthe base of the sample can be calculated from
γ(r, x) = −rθ(x = h)
cos (a) −J0
J a sin (a)
a
h[
sin(ax
h
)
+J0J
a cos(ax
h
)
]
(11)
with the amplitude of the angle of twist θ(x = h) measuredat the top of the sample. Evaluating Eq. (11) for typical a-values reveals only a slight variation of γ with x (about 2%).The variation with r is considered by calculating a meanvalue over the sample volume:
γ =1
V
∫
V
γ(r, x) dV (12)
This mean value is simply denoted by γ in the followinganalysis of the test results. The shear strain amplitudes thatcan be tested in the device lie in the range 5× 10⁻⁷ ≤ γ ≤
5× 10⁻⁴.Measurements of the shear wave velocity by means of ben-
der elements delivered very similar Gmax values compared totests performed with the RC device [37]. Preliminary testson hollow cylinder samples (outer diameter da = 10 cm, in-ner diameter di = 6 cm, h = 10 cm), having a more uniform
distribution of shear strains over the cross section, showedsimilar curves, G(γ) and D(γ), as full cylinder specimens.Therefore, the use of full cylinder specimens was regardedas sufficient for the present study. The comparison was un-dertaken for a medium coarse uniform sand. However, theconclusion is assumed valid also for more well-graded sands.
The settlement of the samples was measured with a non-contact displacement transducer placed approximately 1 mmabove the center of the top mass, i.e., in a position wherethe torsional displacement is very small. This gap sensormeasures against an aluminium target rigidly connected tothe top mass.
All samples were prepared by air pluviation and tested inthe air-dry condition. For each material, five to ten tests withdifferent initial relative densities Dr0 = (emax − e0)/(emax −
emin) were performed. The tested ranges of relative densitiesare given in Table 1. The mean pressure, p, was increasedstep-wise from p= 50 to 400 kPa in order to obtain theGmax-and vP -data documented by Wichtmann & Triantafyllidis[35,36]. The curves G(γ) and D(γ) were measured at p = 400kPa. In three additional tests on medium dense specimens,the modulus degradation and the damping ratio were alsomeasured at p = 50, 100 and 200 kPa.
The shear strength, τmax, is necessary in order to calculatethe reference shear strain, γr, from Eq. (3). For each mate-rial, the peak friction angle, ϕP , was determined from at leastthree monotonic triaxial tests on isotropically consolidated(p0 = 100 kPa) samples prepared with different relative den-sities. The measured decrease of the peak-friction angle withincreasing void ratio was described by an exponentially de-creasing function, ϕP (e0), where e0 is the initial void ratioof the sample before shearing.
4 Test results4.1 Modulus degradation4.1.1 Influence of d50 and Cu
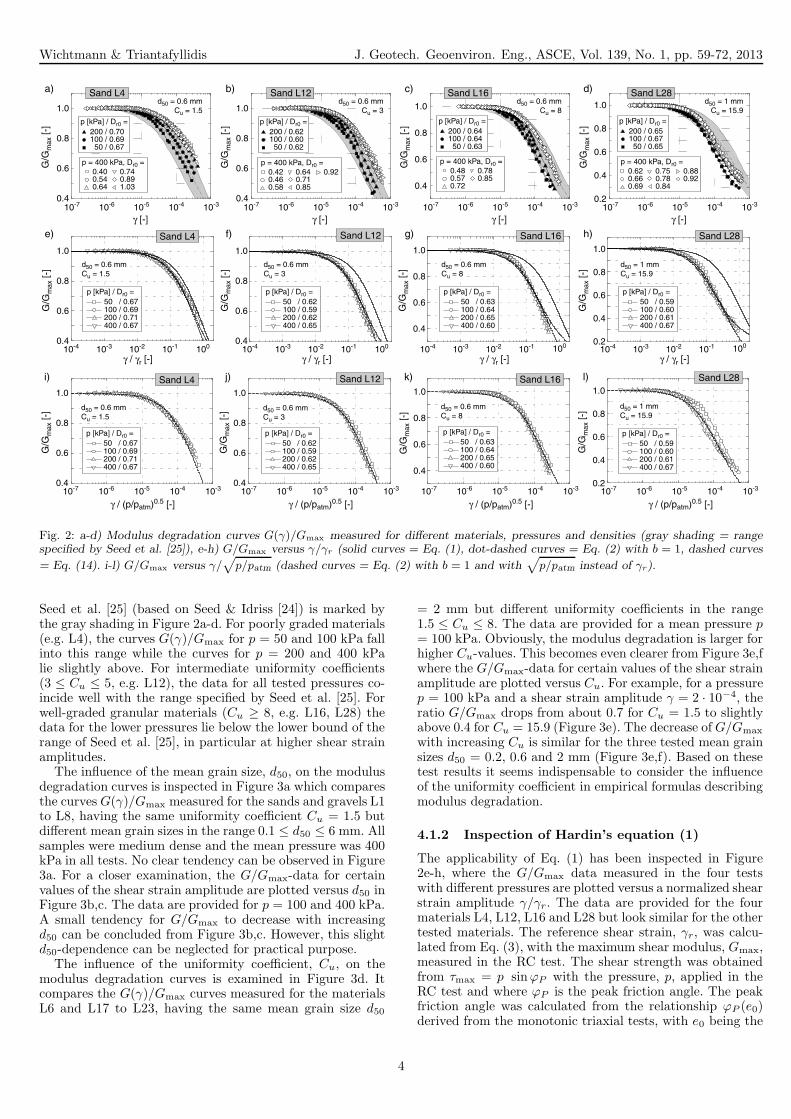
For a constant value of the strain amplitude, the data fromthe present test series confirm the well-known increase ofG/Gmax with increasing mean pressure and the indepen-dence of density. This becomes obvious from Figure 2a-dwhere the modulus degradation curves for different pressuresand densities are presented for four selected materials. Thefirst three diagrams show the data for the three sands L4,L12 and L16, having a mean grain size of d50 = 0.6 mm anduniformity coefficients between Cu = 1.5 and 8. The fourthdiagram contains data for the sand-gravel-mixture L28 (Cu
= 15.9). The typical range of G/Gmax-values specified by
3
Wichtmann & Triantafyllidis J. Geotech. Geoenviron. Eng., ASCE, Vol. 139, No. 1, pp. 59-72, 2013
G/G
max [-]
γ / γr [-]
0.4
0.6
0.8
1.0
e) f) g) h)
a) b) c) d)
10-4 10-3 10-2 10-1 100
G/G
max [-]
γ / γr [-]
0.4
0.6
0.8
1.0
10-4 10-3 10-2 10-1 100
G/G
max [-]
γ / γr [-]
0.4
0.6
0.8
1.0
10-4 10-3 10-2 10-1 100
G/G
max [-]
γ / γr [-]
0.4
0.2
0.6
0.8
1.0
10-4 10-3 10-2 10-1 100
Sand L4 Sand L12 Sand L16
p [kPa] / Dr0 =
50 / 0.67 100 / 0.69 200 / 0.71 400 / 0.67
p [kPa] / Dr0 =
50 / 0.62 100 / 0.59 200 / 0.62 400 / 0.65
p [kPa] / Dr0 =
50 / 0.63 100 / 0.64 200 / 0.65 400 / 0.60
d50 = 0.6 mm
Cu = 1.5
d50 = 0.6 mm
Cu = 3
d50 = 0.6 mm
Cu = 8
Sand L28
p [kPa] / Dr0 =
50 / 0.59 100 / 0.60 200 / 0.61 400 / 0.67
d50 = 1 mm
Cu = 15.9
i) j) k) l)
G/G
max [-]
γ / (p/patm)0.5 [-]
0.4
0.6
0.8
1.0
10-7 10-6 10-5 10-4 10-3
G/G
max [-]
γ / (p/patm)0.5 [-]
0.4
0.6
0.8
1.0
10-7 10-6 10-5 10-4 10-3
G/G
max [-]
0.4
0.6
0.8
1.0
γ / (p/patm)0.5 [-]
10-7 10-6 10-5 10-4 10-3
γ / (p/patm)0.5 [-]
10-7 10-6 10-5 10-4 10-3
Sand L4 Sand L12 Sand L16
p [kPa] / Dr0 =
50 / 0.67 100 / 0.69 200 / 0.71 400 / 0.67
p [kPa] / Dr0 =
50 / 0.62 100 / 0.59 200 / 0.62 400 / 0.65
p [kPa] / Dr0 =
50 / 0.63 100 / 0.64 200 / 0.65 400 / 0.60
d50 = 0.6 mm
Cu = 1.5
d50 = 0.6 mm
Cu = 8d50 = 0.6 mm
Cu = 3
G/G
max [-]
0.4
0.2
0.6
0.8
1.0
Sand L28
p [kPa] / Dr0 =
50 / 0.59 100 / 0.60 200 / 0.61 400 / 0.67
d50 = 1 mm
Cu = 15.9
p = 400 kPa, Dr0 =
0.620.660.69
0.750.780.84
0.880.92
p [kPa] / Dr0 =
50 / 0.65100 / 0.67200 / 0.65
p = 400 kPa, Dr0 =
0.420.460.58
0.640.710.85
0.92
p [kPa] / Dr0 =
50 / 0.62100 / 0.60200 / 0.62
p = 400 kPa, Dr0 =
0.400.540.64
0.740.891.03
p [kPa] / Dr0 =
50 / 0.67100 / 0.69200 / 0.70
p = 400 kPa, Dr0 =
0.480.570.72
0.780.85
p [kPa] / Dr0 =
50 / 0.63100 / 0.64200 / 0.64
γ [-]
10-7 10-6 10-5 10-4 10-3
γ [-]
10-7 10-6 10-5 10-4 10-3
G/G
max [-]
0.4
0.2
0.6
0.8
1.0
G/G
max [-]
0.4
0.6
0.8
1.0
γ [-]
10-7 10-6 10-5 10-4 10-3
G/G
max [-]
0.4
0.6
0.8
1.0
γ [-]
10-7 10-6 10-5 10-4 10-3
G/G
max [-]
0.4
0.6
0.8
1.0
Sand L28Sand L16Sand L12d50 = 1 mm
Cu = 15.9
d50 = 0.6 mm
Cu = 8
d50 = 0.6 mm
Cu = 3
Sand L4d50 = 0.6 mm
Cu = 1.5
Fig. 2: a-d) Modulus degradation curves G(γ)/Gmax measured for different materials, pressures and densities (gray shading = rangespecified by Seed et al. [25]), e-h) G/Gmax versus γ/γr (solid curves = Eq. (1), dot-dashed curves = Eq. (2) with b = 1, dashed curves
= Eq. (14). i-l) G/Gmax versus γ/√
p/patm (dashed curves = Eq. (2) with b = 1 and with√
p/patm instead of γr).
Seed et al. [25] (based on Seed & Idriss [24]) is marked bythe gray shading in Figure 2a-d. For poorly graded materials(e.g. L4), the curves G(γ)/Gmax for p = 50 and 100 kPa fallinto this range while the curves for p = 200 and 400 kPalie slightly above. For intermediate uniformity coefficients(3 ≤ Cu ≤ 5, e.g. L12), the data for all tested pressures co-incide well with the range specified by Seed et al. [25]. Forwell-graded granular materials (Cu ≥ 8, e.g. L16, L28) thedata for the lower pressures lie below the lower bound of therange of Seed et al. [25], in particular at higher shear strainamplitudes.
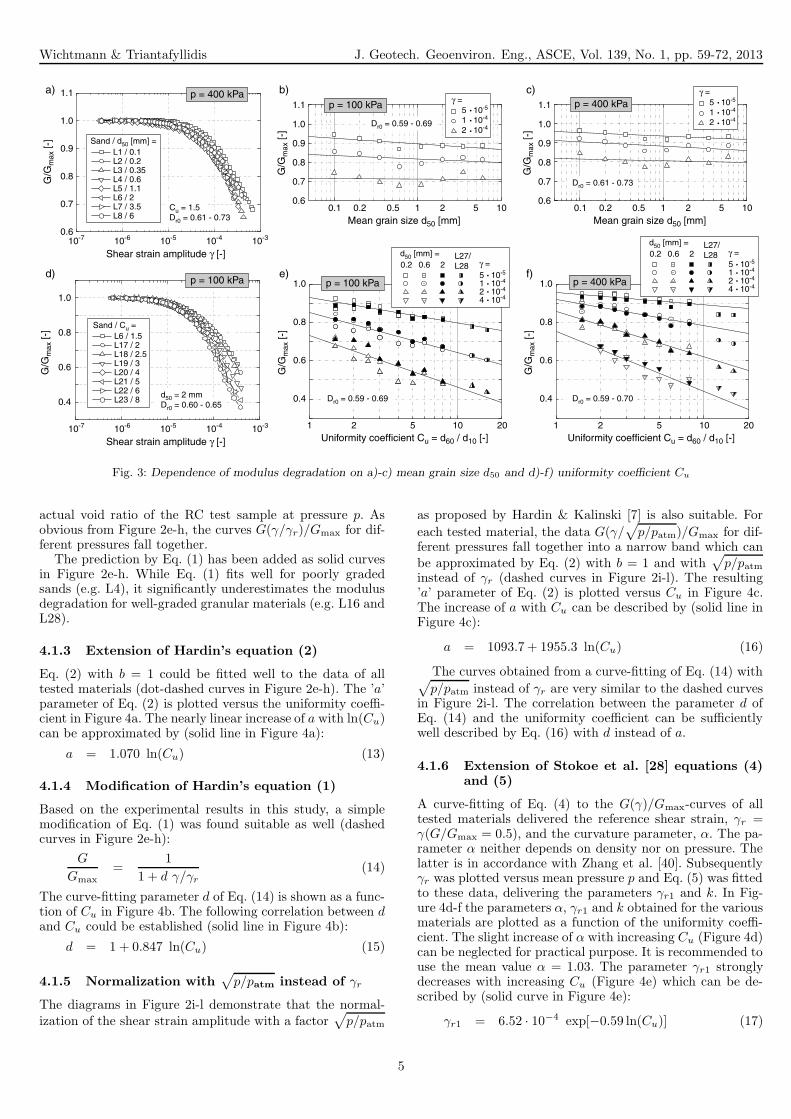
The influence of the mean grain size, d50, on the modulusdegradation curves is inspected in Figure 3a which comparesthe curves G(γ)/Gmax measured for the sands and gravels L1to L8, having the same uniformity coefficient Cu = 1.5 butdifferent mean grain sizes in the range 0.1 ≤ d50 ≤ 6 mm. Allsamples were medium dense and the mean pressure was 400kPa in all tests. No clear tendency can be observed in Figure3a. For a closer examination, the G/Gmax-data for certainvalues of the shear strain amplitude are plotted versus d50 inFigure 3b,c. The data are provided for p = 100 and 400 kPa.A small tendency for G/Gmax to decrease with increasingd50 can be concluded from Figure 3b,c. However, this slightd50-dependence can be neglected for practical purpose.
The influence of the uniformity coefficient, Cu, on themodulus degradation curves is examined in Figure 3d. Itcompares the G(γ)/Gmax curves measured for the materialsL6 and L17 to L23, having the same mean grain size d50
= 2 mm but different uniformity coefficients in the range1.5 ≤ Cu ≤ 8. The data are provided for a mean pressure p= 100 kPa. Obviously, the modulus degradation is larger forhigher Cu-values. This becomes even clearer from Figure 3e,fwhere the G/Gmax-data for certain values of the shear strainamplitude are plotted versus Cu. For example, for a pressurep = 100 kPa and a shear strain amplitude γ = 2 · 10−4, theratio G/Gmax drops from about 0.7 for Cu = 1.5 to slightlyabove 0.4 for Cu = 15.9 (Figure 3e). The decrease of G/Gmax
with increasing Cu is similar for the three tested mean grainsizes d50 = 0.2, 0.6 and 2 mm (Figure 3e,f). Based on thesetest results it seems indispensable to consider the influenceof the uniformity coefficient in empirical formulas describingmodulus degradation.
4.1.2 Inspection of Hardin’s equation (1)
The applicability of Eq. (1) has been inspected in Figure2e-h, where the G/Gmax data measured in the four testswith different pressures are plotted versus a normalized shearstrain amplitude γ/γr. The data are provided for the fourmaterials L4, L12, L16 and L28 but look similar for the othertested materials. The reference shear strain, γr, was calcu-lated from Eq. (3), with the maximum shear modulus, Gmax,measured in the RC test. The shear strength was obtainedfrom τmax = p sinϕP with the pressure, p, applied in theRC test and where ϕP is the peak friction angle. The peakfriction angle was calculated from the relationship ϕP (e0)derived from the monotonic triaxial tests, with e0 being the
4
Wichtmann & Triantafyllidis J. Geotech. Geoenviron. Eng., ASCE, Vol. 139, No. 1, pp. 59-72, 2013
0.6
0.7
0.8
0.9
1.0
1.1
Sand / d50 [mm] = L1 / 0.1 L2 / 0.2 L3 / 0.35 L4 / 0.6 L5 / 1.1 L6 / 2 L7 / 3.5 L8 / 6
G/G
max
[-]
G/G
max
[-]
G/G
max
[-]
G/G
max
[-]
Cu = 1.5 Dr0 = 0.61 - 0.73
0.4
0.6
0.8
1.0
Sand / Cu = L6 / 1.5 L17 / 2 L18 / 2.5 L19 / 3 L20 / 4 L21 / 5 L22 / 6 L23 / 8
d50 = 2 mm Dr0 = 0.60 - 0.65
0.6
0.7
0.8
0.9
1.0
1.1
0.1 0.2 0.5 1 2 5 10Mean grain size d50 [mm]
G/G
max
[-]
0.6
0.7
0.8
0.9
1.0
1.1
0.1 0.2 0.5 1 2 5 10Mean grain size d50 [mm]
p = 400 kPap = 400 kPaγ =
5 10-5
1 10-4
2 10-4
γ = 5 10-5
1 10-4
2 10-4
1 2 5 10 20
0.4
0.6
0.8
1.0
Uniformity coefficient Cu = d60 / d10 [-] Uniformity coefficient Cu = d60 / d10 [-]
G/G
max
[-]
1 2 5 10 20
0.4
0.6
0.8
1.0p = 100 kPa
p = 100 kPa
p = 100 kPa
γ = 5 10-5
1 10-4
2 10-4
4 10-4
d50 [mm] =0.2 0.6 2
L27/ L28
γ = 5 10-5
1 10-4
2 10-4
4 10-4
d50 [mm] =0.2 0.6 2
L27/ L28
a) b) c)
d) e) f)
Shear strain amplitude γ [-]10-7 10-6 10-5 10-4 10-3
Shear strain amplitude γ [-]10-7 10-6 10-5 10-4 10-3
p = 400 kPa
Dr0 = 0.59 - 0.69
Dr0 = 0.59 - 0.69 Dr0 = 0.59 - 0.70
Dr0 = 0.61 - 0.73
Fig. 3: Dependence of modulus degradation on a)-c) mean grain size d50 and d)-f) uniformity coefficient Cu
actual void ratio of the RC test sample at pressure p. Asobvious from Figure 2e-h, the curves G(γ/γr)/Gmax for dif-ferent pressures fall together.
The prediction by Eq. (1) has been added as solid curvesin Figure 2e-h. While Eq. (1) fits well for poorly gradedsands (e.g. L4), it significantly underestimates the modulusdegradation for well-graded granular materials (e.g. L16 andL28).
4.1.3 Extension of Hardin’s equation (2)
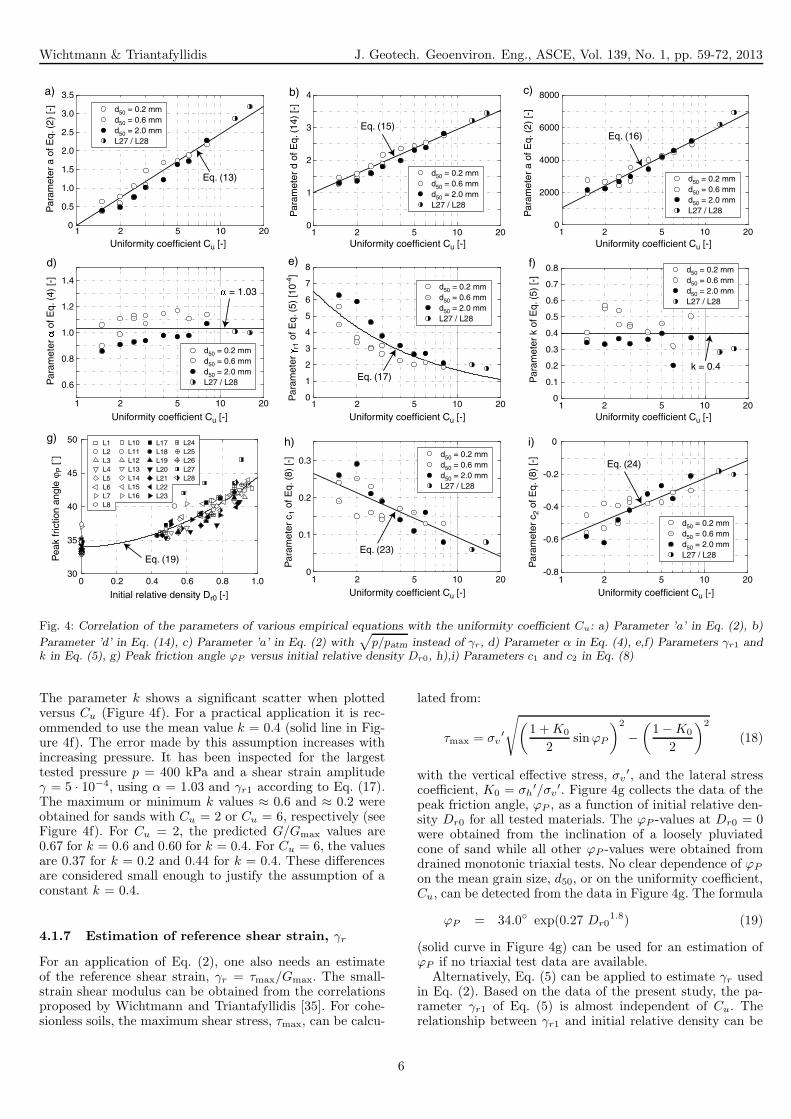
Eq. (2) with b = 1 could be fitted well to the data of alltested materials (dot-dashed curves in Figure 2e-h). The ’a’parameter of Eq. (2) is plotted versus the uniformity coeffi-cient in Figure 4a. The nearly linear increase of a with ln(Cu)can be approximated by (solid line in Figure 4a):
a = 1.070 ln(Cu) (13)
4.1.4 Modification of Hardin’s equation (1)
Based on the experimental results in this study, a simplemodification of Eq. (1) was found suitable as well (dashedcurves in Figure 2e-h):
G
Gmax
=1
1 + d γ/γr(14)
The curve-fitting parameter d of Eq. (14) is shown as a func-tion of Cu in Figure 4b. The following correlation between dand Cu could be established (solid line in Figure 4b):
d = 1 + 0.847 ln(Cu) (15)
4.1.5 Normalization with√
p/patm instead of γr
The diagrams in Figure 2i-l demonstrate that the normal-ization of the shear strain amplitude with a factor
√
p/patm
as proposed by Hardin & Kalinski [7] is also suitable. For
each tested material, the data G(γ/√
p/patm)/Gmax for dif-ferent pressures fall together into a narrow band which canbe approximated by Eq. (2) with b = 1 and with
√
p/patminstead of γr (dashed curves in Figure 2i-l). The resulting’a’ parameter of Eq. (2) is plotted versus Cu in Figure 4c.The increase of a with Cu can be described by (solid line inFigure 4c):
a = 1093.7+ 1955.3 ln(Cu) (16)
The curves obtained from a curve-fitting of Eq. (14) with√
p/patm instead of γr are very similar to the dashed curvesin Figure 2i-l. The correlation between the parameter d ofEq. (14) and the uniformity coefficient can be sufficientlywell described by Eq. (16) with d instead of a.
4.1.6 Extension of Stokoe et al. [28] equations (4)and (5)
A curve-fitting of Eq. (4) to the G(γ)/Gmax-curves of alltested materials delivered the reference shear strain, γr =γ(G/Gmax = 0.5), and the curvature parameter, α. The pa-rameter α neither depends on density nor on pressure. Thelatter is in accordance with Zhang et al. [40]. Subsequentlyγr was plotted versus mean pressure p and Eq. (5) was fittedto these data, delivering the parameters γr1 and k. In Fig-ure 4d-f the parameters α, γr1 and k obtained for the variousmaterials are plotted as a function of the uniformity coeffi-cient. The slight increase of α with increasing Cu (Figure 4d)can be neglected for practical purpose. It is recommended touse the mean value α = 1.03. The parameter γr1 stronglydecreases with increasing Cu (Figure 4e) which can be de-scribed by (solid curve in Figure 4e):
γr1 = 6.52 · 10−4 exp[−0.59 ln(Cu)] (17)
5
Wichtmann & Triantafyllidis J. Geotech. Geoenviron. Eng., ASCE, Vol. 139, No. 1, pp. 59-72, 2013
a) b) c)
g) h) i)
d) e) f)
1 2 5 10 200
0.5
1.0
1.5
2.0
2.5
3.0
3.5
Par
amet
er a
of E
q. (
2) [-
]
Uniformity coefficient Cu [-] Uniformity coefficient Cu [-] Uniformity coefficient Cu [-]
Uniformity coefficient Cu [-]Uniformity coefficient Cu [-]
Uniformity coefficient Cu [-] Uniformity coefficient Cu [-]
Uniformity coefficient Cu [-]
1 2 5 10 20 1 2 5 10 20
1 2 5 10 20 1 2 5 10 20 1 2 5 10 20
d50 = 0.2 mmd50 = 0.6 mmd50 = 2.0 mmL27 / L28
0
1
2
3
4
Par
amet
er d
of E
q. (
14)
[-]
Par
amet
er a
of E
q. (
2) [-
]
d50 = 0.2 mmd50 = 0.6 mmd50 = 2.0 mmL27 / L28
Eq. (15)
Eq. (13)
0.6
0.8
1.0
1.2
1.4
Par
amet
er
� of E
q. (
4) [-
]
d50 = 0.2 mmd50 = 0.6 mmd50 = 2.0 mmL27 / L28
0
1
2
3
4
5
6
7
8
Par
amet
er
� r1 o
f Eq.
(5)
[10-4
]d50 = 0.2 mmd50 = 0.6 mmd50 = 2.0 mmL27 / L28
Eq. (17)
0
0.1
0.2
0.3
0.4
0.5
0.6
0.7
0.8
Par
amet
er k
of E
q. (
5) [-
]
d50 = 0.2 mmd50 = 0.6 mmd50 = 2.0 mmL27 / L28
� = 1.03
k = 0.4
0
2000
4000
6000
8000
d50 = 0.2 mmd50 = 0.6 mmd50 = 2.0 mmL27 / L28
0 0.2 0.4 0.6 0.8 1.030
35
40
45
50 L1 L2 L3 L4 L5 L6 L7 L8
L10 L11 L12 L13 L14 L15 L16
L17 L18 L19 L20 L21 L22 L23
L24 L25 L26 L27 L28
Pea
k fr
ictio
n an
gle
ϕ P [˚
]
Initial relative density Dr0 [-]
-0.8
-0.6
-0.4
-0.2
0
d50 = 0.2 mmd50 = 0.6 mmd50 = 2.0 mmL27 / L28
0
0.1
0.2
0.3
Par
amet
er c
1 of
Eq.
(8)
[-]
Par
amet
er c
2 of
Eq.
(8)
[-]d50 = 0.2 mm
d50 = 0.6 mmd50 = 2.0 mmL27 / L28
Eq. (24)
Eq. (23)Eq. (19)
1 2 5 10 201 2 5 10 20
Eq. (16)
Fig. 4: Correlation of the parameters of various empirical equations with the uniformity coefficient Cu: a) Parameter ’a’ in Eq. (2), b)
Parameter ’d’ in Eq. (14), c) Parameter ’a’ in Eq. (2) with√
p/patm instead of γr, d) Parameter α in Eq. (4), e,f) Parameters γr1 andk in Eq. (5), g) Peak friction angle ϕP versus initial relative density Dr0, h),i) Parameters c1 and c2 in Eq. (8)
The parameter k shows a significant scatter when plottedversus Cu (Figure 4f). For a practical application it is rec-ommended to use the mean value k = 0.4 (solid line in Fig-ure 4f). The error made by this assumption increases withincreasing pressure. It has been inspected for the largesttested pressure p = 400 kPa and a shear strain amplitudeγ = 5 · 10−4, using α = 1.03 and γr1 according to Eq. (17).The maximum or minimum k values ≈ 0.6 and ≈ 0.2 wereobtained for sands with Cu = 2 or Cu = 6, respectively (seeFigure 4f). For Cu = 2, the predicted G/Gmax values are0.67 for k = 0.6 and 0.60 for k = 0.4. For Cu = 6, the valuesare 0.37 for k = 0.2 and 0.44 for k = 0.4. These differencesare considered small enough to justify the assumption of aconstant k = 0.4.
4.1.7 Estimation of reference shear strain, γr
For an application of Eq. (2), one also needs an estimateof the reference shear strain, γr = τmax/Gmax. The small-strain shear modulus can be obtained from the correlationsproposed by Wichtmann and Triantafyllidis [35]. For cohe-sionless soils, the maximum shear stress, τmax, can be calcu-
lated from:
τmax = σv′
√
(
1 +K0
2sinϕP
)2
−
(
1−K0
2
)2
(18)
with the vertical effective stress, σv′, and the lateral stress
coefficient, K0 = σh′/σv
′. Figure 4g collects the data of thepeak friction angle, ϕP , as a function of initial relative den-sity Dr0 for all tested materials. The ϕP -values at Dr0 = 0were obtained from the inclination of a loosely pluviatedcone of sand while all other ϕP -values were obtained fromdrained monotonic triaxial tests. No clear dependence of ϕP
on the mean grain size, d50, or on the uniformity coefficient,Cu, can be detected from the data in Figure 4g. The formula
ϕP = 34.0◦ exp(0.27 Dr01.8) (19)
(solid curve in Figure 4g) can be used for an estimation ofϕP if no triaxial test data are available.
Alternatively, Eq. (5) can be applied to estimate γr usedin Eq. (2). Based on the data of the present study, the pa-rameter γr1 of Eq. (5) is almost independent of Cu. Therelationship between γr1 and initial relative density can be
6
Wichtmann & Triantafyllidis J. Geotech. Geoenviron. Eng., ASCE, Vol. 139, No. 1, pp. 59-72, 2013
0.4 0.6 0.8 1.0
0.4
0.6
0.8
1.0
Measured G/Gmax [-]
Pre
dic
ted G
/Gm
ax [
-]
0.4 0.6 0.8 1.0
0.4
0.6
0.8
1.0
Measured G/Gmax [-]
Pre
dic
ted G
/Gm
ax [
-]
0.40.2 0.6 0.8 1.0
0.4
0.2
0.6
0.8
1.0
Measured G/Gmax [-]
Pre
dic
ted G
/Gm
ax [
-]
0.40.2 0.6 0.8 1.0
0.4
0.2
0.6
0.8
1.0
Measured G/Gmax [-]
Pre
dic
ted G
/Gm
ax [
-]
0.4 0.6 0.8 1.0
0.4
0.6
0.8
1.0
Measured G/Gmax [-]
Pre
dic
ted G
/Gm
ax [
-]
0.4 0.6 0.8 1.0
0.4
0.6
0.8
1.0
Measured G/Gmax [-]
Pre
dic
ted G
/Gm
ax [
-]
0.4 0.6 0.8 1.0
0.4
0.6
0.8
1.0
Measured G/Gmax [-]
Pre
dic
ted G
/Gm
ax [
-]
0.4 0.6 0.8 1.0
0.4
0.6
0.8
1.0
Measured G/Gmax [-]
Pre
dic
ted G
/Gm
ax [
-]
0.4 0.6 0.8 1.0
0.4
0.6
0.8
1.0
Measured G/Gmax [-]
Pre
dic
ted G
/Gm
ax [
-]
0.4 0.6 0.8 1.0
0.4
0.6
0.8
1.0
Measured G/Gmax [-]
Pre
dic
ted G
/Gm
ax [
-]
L4 L10 L11 L12
L13 L14 L15 L16
L4 L10 L11 L12
L13 L14 L15 L16
L4 L10 L11 L12
L13 L14 L15 L16
L4 L10 L11 L12
L13 L14 L15 L16
L4 L10 L11 L12
L13 L14 L15 L16
L6 L17 L18 L19
L20 L21 L22 L23
L6 L17 L18 L19
L20 L21 L22 L23
L6 L17 L18 L19
L20 L21 L22 L23
L6 L17 L18 L19
L20 L21 L22 L23
L6 L17 L18 L19
L20 L21 L22 L23
Eq. (2) with b = 1
and a from Eq. (13)
Eq. (14) with
d from Eq. (15)
Eq. (14) with
(p/patm)0.5 instead γr
and d from Eq. (16)
Eq. (2) with b = 1,
(p/patm)0.5 instead γr
and a from Eq. (16)
Eqs. (4) and (5) with
α = 1.03, k = 0.4 and
γr1 from Eq. (17)Predicted
- Measured
= 0.1
-0.1
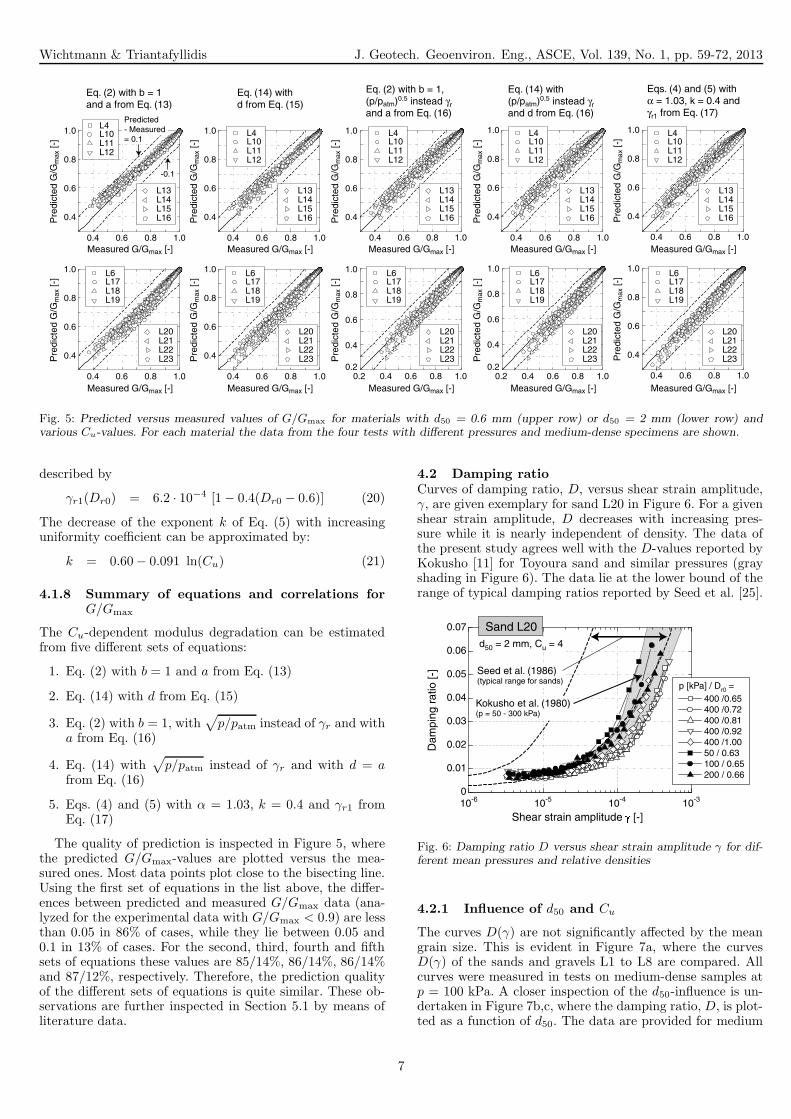
Fig. 5: Predicted versus measured values of G/Gmax for materials with d50 = 0.6 mm (upper row) or d50 = 2 mm (lower row) andvarious Cu-values. For each material the data from the four tests with different pressures and medium-dense specimens are shown.
described by
γr1(Dr0) = 6.2 · 10−4 [1− 0.4(Dr0 − 0.6)] (20)
The decrease of the exponent k of Eq. (5) with increasinguniformity coefficient can be approximated by:
k = 0.60− 0.091 ln(Cu) (21)
4.1.8 Summary of equations and correlations forG/Gmax
The Cu-dependent modulus degradation can be estimatedfrom five different sets of equations:
1. Eq. (2) with b = 1 and a from Eq. (13)
2. Eq. (14) with d from Eq. (15)
3. Eq. (2) with b = 1, with√
p/patm instead of γr and witha from Eq. (16)
4. Eq. (14) with√
p/patm instead of γr and with d = afrom Eq. (16)
5. Eqs. (4) and (5) with α = 1.03, k = 0.4 and γr1 fromEq. (17)
The quality of prediction is inspected in Figure 5, wherethe predicted G/Gmax-values are plotted versus the mea-sured ones. Most data points plot close to the bisecting line.Using the first set of equations in the list above, the differ-ences between predicted and measured G/Gmax data (ana-lyzed for the experimental data with G/Gmax < 0.9) are lessthan 0.05 in 86% of cases, while they lie between 0.05 and0.1 in 13% of cases. For the second, third, fourth and fifthsets of equations these values are 85/14%, 86/14%, 86/14%and 87/12%, respectively. Therefore, the prediction qualityof the different sets of equations is quite similar. These ob-servations are further inspected in Section 5.1 by means ofliterature data.
4.2 Damping ratioCurves of damping ratio, D, versus shear strain amplitude,γ, are given exemplary for sand L20 in Figure 6. For a givenshear strain amplitude, D decreases with increasing pres-sure while it is nearly independent of density. The data ofthe present study agrees well with the D-values reported byKokusho [11] for Toyoura sand and similar pressures (grayshading in Figure 6). The data lie at the lower bound of therange of typical damping ratios reported by Seed et al. [25].
Dam
ping
rat
io [-
]
Shear strain amplitude � [-]10-6 10-5 10-4 10-30
0.01
0.02
0.03
0.04
0.05
0.06
0.07
p [kPa] / Dr0 = 400 /0.65 400 /0.72 400 /0.81 400 /0.92 400 /1.00 50 / 0.63 100 / 0.65 200 / 0.66
Sand L20
Seed et al. (1986)�(typical range for sands)
Kokusho et al. (1980)�(p = 50 - 300 kPa)
d50 = 2 mm, Cu = 4
Fig. 6: Damping ratio D versus shear strain amplitude γ for dif-ferent mean pressures and relative densities
4.2.1 Influence of d50 and Cu
The curves D(γ) are not significantly affected by the meangrain size. This is evident in Figure 7a, where the curvesD(γ) of the sands and gravels L1 to L8 are compared. Allcurves were measured in tests on medium-dense samples atp = 100 kPa. A closer inspection of the d50-influence is un-dertaken in Figure 7b,c, where the damping ratio, D, is plot-ted as a function of d50. The data are provided for medium
7
Wichtmann & Triantafyllidis J. Geotech. Geoenviron. Eng., ASCE, Vol. 139, No. 1, pp. 59-72, 2013
0
0.02
0.04
Dam
ping
rat
io D
[-]
Dam
ping
rat
io D
[-]
Dam
ping
rat
io D
[-]
Dam
ping
rat
io D
[-]
0.1 0.2 0.5 1 2 5 10Mean grain size d50 [mm]
0.1 0.2 0.5 1 2 5 10Mean grain size d50 [mm]
0
0.02
0.04
0.06
p = 400 kPa
p = 100 kPa γ = 5 10-5
1 10-4
2 10-4
0
0.02
0.04
0.06
0.08
Dam
ping
rat
io D
[-]
0
0.02
0.04
Dam
ping
rat
io D
[-]
1 2 5 10 20Uniformity coefficient Cu = d60 / d10 [-]
Uniformity coefficient Cu = d60 / d10 [-]1 2 5 10 20
γ = 5 10-5
2 10-4
d50 [mm] =
0.2 0.6 20.79/ 1 p = 400 kPap = 50 kPa
b)a)
e)d)
c)
f)
0
0.02
0.04
0.06
0.08
0.10
Shear strain amplitude � [-]10-6 10-5 10-4 10-3
Shear strain amplitude � [-]10-6 10-5 10-4 10-3
Sand / d50 [mm] = L1 / 0.1 L2 / 0.2 L3 / 0.35 L4 / 0.6 L5 / 1.1 L6 / 2 L7 / 3.5 L8 / 6
p = 100 kPaCu = 1.5�Dr0 = 0.59 - 0.69
0
0.01
0.02
0.03
0.04
0.05
0.06
0.07
Sand / Cu = L6 / 1.5 L17 / 2 L18 / 2.5 L19 / 3 L20 / 4 L21 / 5 L22 / 6 L23 / 8
d50 = 2 mm,�Dr0 = 0.59 - 0.65
p = 400 kPa
Dr0 = 0.59 - 0.69
Dr0 = 0.59 - 0.69
Dr0 = 0.59 - 0.70
Dr0 = 0.61 - 0.73
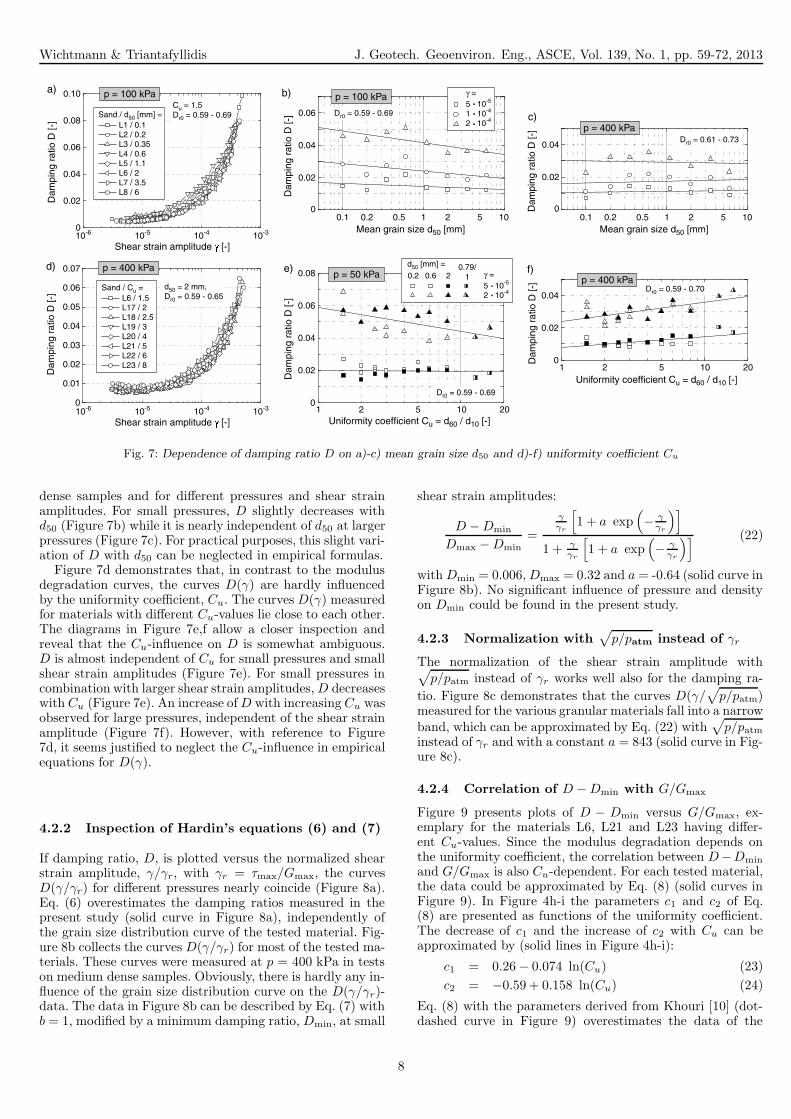
Fig. 7: Dependence of damping ratio D on a)-c) mean grain size d50 and d)-f) uniformity coefficient Cu
dense samples and for different pressures and shear strainamplitudes. For small pressures, D slightly decreases withd50 (Figure 7b) while it is nearly independent of d50 at largerpressures (Figure 7c). For practical purposes, this slight vari-ation of D with d50 can be neglected in empirical formulas.
Figure 7d demonstrates that, in contrast to the modulusdegradation curves, the curves D(γ) are hardly influencedby the uniformity coefficient, Cu. The curves D(γ) measuredfor materials with different Cu-values lie close to each other.The diagrams in Figure 7e,f allow a closer inspection andreveal that the Cu-influence on D is somewhat ambiguous.D is almost independent of Cu for small pressures and smallshear strain amplitudes (Figure 7e). For small pressures incombination with larger shear strain amplitudes,D decreaseswith Cu (Figure 7e). An increase ofD with increasing Cu wasobserved for large pressures, independent of the shear strainamplitude (Figure 7f). However, with reference to Figure7d, it seems justified to neglect the Cu-influence in empiricalequations for D(γ).
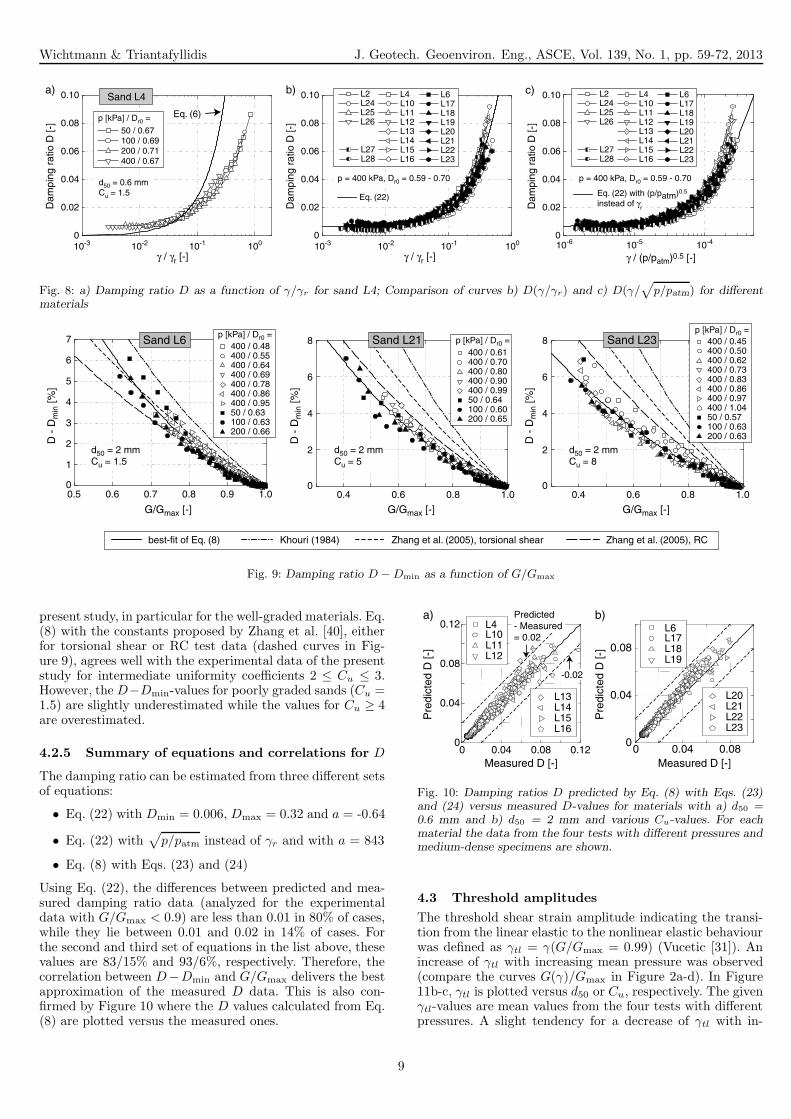
4.2.2 Inspection of Hardin’s equations (6) and (7)
If damping ratio, D, is plotted versus the normalized shearstrain amplitude, γ/γr, with γr = τmax/Gmax, the curvesD(γ/γr) for different pressures nearly coincide (Figure 8a).Eq. (6) overestimates the damping ratios measured in thepresent study (solid curve in Figure 8a), independently ofthe grain size distribution curve of the tested material. Fig-ure 8b collects the curves D(γ/γr) for most of the tested ma-terials. These curves were measured at p = 400 kPa in testson medium dense samples. Obviously, there is hardly any in-fluence of the grain size distribution curve on the D(γ/γr)-data. The data in Figure 8b can be described by Eq. (7) withb = 1, modified by a minimum damping ratio, Dmin, at small
shear strain amplitudes:
D −Dmin
Dmax −Dmin
=
γγr
[
1 + a exp(
−γγr
)]
1 + γγr
[
1 + a exp(
−γγr
)] (22)
withDmin = 0.006,Dmax = 0.32 and a = -0.64 (solid curve inFigure 8b). No significant influence of pressure and densityon Dmin could be found in the present study.
4.2.3 Normalization with√
p/patm instead of γr
The normalization of the shear strain amplitude with√
p/patm instead of γr works well also for the damping ra-
tio. Figure 8c demonstrates that the curves D(γ/√
p/patm)measured for the various granular materials fall into a narrowband, which can be approximated by Eq. (22) with
√
p/patminstead of γr and with a constant a = 843 (solid curve in Fig-ure 8c).
4.2.4 Correlation of D −Dmin with G/Gmax
Figure 9 presents plots of D − Dmin versus G/Gmax, ex-emplary for the materials L6, L21 and L23 having differ-ent Cu-values. Since the modulus degradation depends onthe uniformity coefficient, the correlation between D−Dmin
and G/Gmax is also Cu-dependent. For each tested material,the data could be approximated by Eq. (8) (solid curves inFigure 9). In Figure 4h-i the parameters c1 and c2 of Eq.(8) are presented as functions of the uniformity coefficient.The decrease of c1 and the increase of c2 with Cu can beapproximated by (solid lines in Figure 4h-i):
c1 = 0.26− 0.074 ln(Cu) (23)
c2 = −0.59+ 0.158 ln(Cu) (24)
Eq. (8) with the parameters derived from Khouri [10] (dot-dashed curve in Figure 9) overestimates the data of the
8
Wichtmann & Triantafyllidis J. Geotech. Geoenviron. Eng., ASCE, Vol. 139, No. 1, pp. 59-72, 2013D
ampi
ng r
atio
D [-
]
Dam
ping
rat
io D
[-]
10-3 10-2 10-1 100 0
0.02
0.04
0.06
0.08
0.10 Sand L4
p [kPa] / Dr0 =
50 / 0.67 100 / 0.69 200 / 0.71 400 / 0.67
γ / γr [-] γ / γr [-]10-3 10-2 10-1 100 10-6 10-5 10-4
γ / (p/patm)0.5 [-]
0
0.02
0.04
0.06
0.08
0.10
Dam
ping
rat
io D
[-]
0
0.02
0.04
0.06
0.08
0.10 L2 L24 L25 L26
L4 L10 L11 L12 L13 L14 L15 L16
L6 L17 L18 L19 L20 L21 L22 L23
L27 L28
Eq. (22) with (p/patm)0.5 �instead of γr
a) b) c)
Eq. (6)
d50 = 0.6 mm�Cu = 1.5
p = 400 kPa, Dr0 = 0.59 - 0.70p = 400 kPa, Dr0 = 0.59 - 0.70
L2 L24 L25 L26
L4 L10 L11 L12 L13 L14 L15 L16
L6 L17 L18 L19 L20 L21 L22 L23
L27 L28
Eq. (22)
Fig. 8: a) Damping ratio D as a function of γ/γr for sand L4; Comparison of curves b) D(γ/γr) and c) D(γ/√
p/patm) for differentmaterials
0.5 0.6 0.7 0.8 0.9 1.0
D -
Dm
in [%
]
G/Gmax [-]
D -
Dm
in [%
]
G/Gmax [-]
0
1
2
3
4
5
6
7 p [kPa] / Dr0 =400 / 0.48400 / 0.55400 / 0.64400 / 0.69400 / 0.78400 / 0.86400 / 0.9550 / 0.63100 / 0.63200 / 0.66
Sand L6
0.4 0.6 0.8 1.00
2
4
6
8 p [kPa] / Dr0 =400 / 0.61400 / 0.70400 / 0.80400 / 0.90400 / 0.9950 / 0.64100 / 0.60200 / 0.65
p [kPa] / Dr0 =400 / 0.45400 / 0.50400 / 0.62400 / 0.73400 / 0.83400 / 0.86400 / 0.97400 / 1.0450 / 0.57100 / 0.63200 / 0.63
best-fit of Eq. (8) Zhang et al. (2005), torsional shear Zhang et al. (2005), RC Khouri (1984)
d50 = 2 mm�Cu = 1.5
d50 = 2 mm�Cu = 5
Sand L21
D -
Dm
in [%
]
G/Gmax [-]0.4 0.6 0.8 1.0
0
2
4
6
8
d50 = 2 mm�Cu = 8
Sand L23
Fig. 9: Damping ratio D −Dmin as a function of G/Gmax
present study, in particular for the well-graded materials. Eq.(8) with the constants proposed by Zhang et al. [40], eitherfor torsional shear or RC test data (dashed curves in Fig-ure 9), agrees well with the experimental data of the presentstudy for intermediate uniformity coefficients 2 ≤ Cu ≤ 3.However, the D−Dmin-values for poorly graded sands (Cu =1.5) are slightly underestimated while the values for Cu ≥ 4are overestimated.
4.2.5 Summary of equations and correlations for D
The damping ratio can be estimated from three different setsof equations:
• Eq. (22) with Dmin = 0.006, Dmax = 0.32 and a = -0.64
• Eq. (22) with√
p/patm instead of γr and with a = 843
• Eq. (8) with Eqs. (23) and (24)
Using Eq. (22), the differences between predicted and mea-sured damping ratio data (analyzed for the experimentaldata with G/Gmax < 0.9) are less than 0.01 in 80% of cases,while they lie between 0.01 and 0.02 in 14% of cases. Forthe second and third set of equations in the list above, thesevalues are 83/15% and 93/6%, respectively. Therefore, thecorrelation between D−Dmin and G/Gmax delivers the bestapproximation of the measured D data. This is also con-firmed by Figure 10 where the D values calculated from Eq.(8) are plotted versus the measured ones.
0 0.04 0.080
0.04
0.08
0 0.04 0.08 0.120
0.04
0.08
0.12
Pre
dic
ted
D [
-]
Measured D [-]
a) b)
Pre
dic
ted
D [
-]
Measured D [-]
L4 L10 L11 L12
L13 L14 L15 L16
L6 L17 L18 L19
L20 L21 L22 L23
Predicted
- Measured
= 0.02
-0.02
Fig. 10: Damping ratios D predicted by Eq. (8) with Eqs. (23)and (24) versus measured D-values for materials with a) d50 =0.6 mm and b) d50 = 2 mm and various Cu-values. For eachmaterial the data from the four tests with different pressures andmedium-dense specimens are shown.
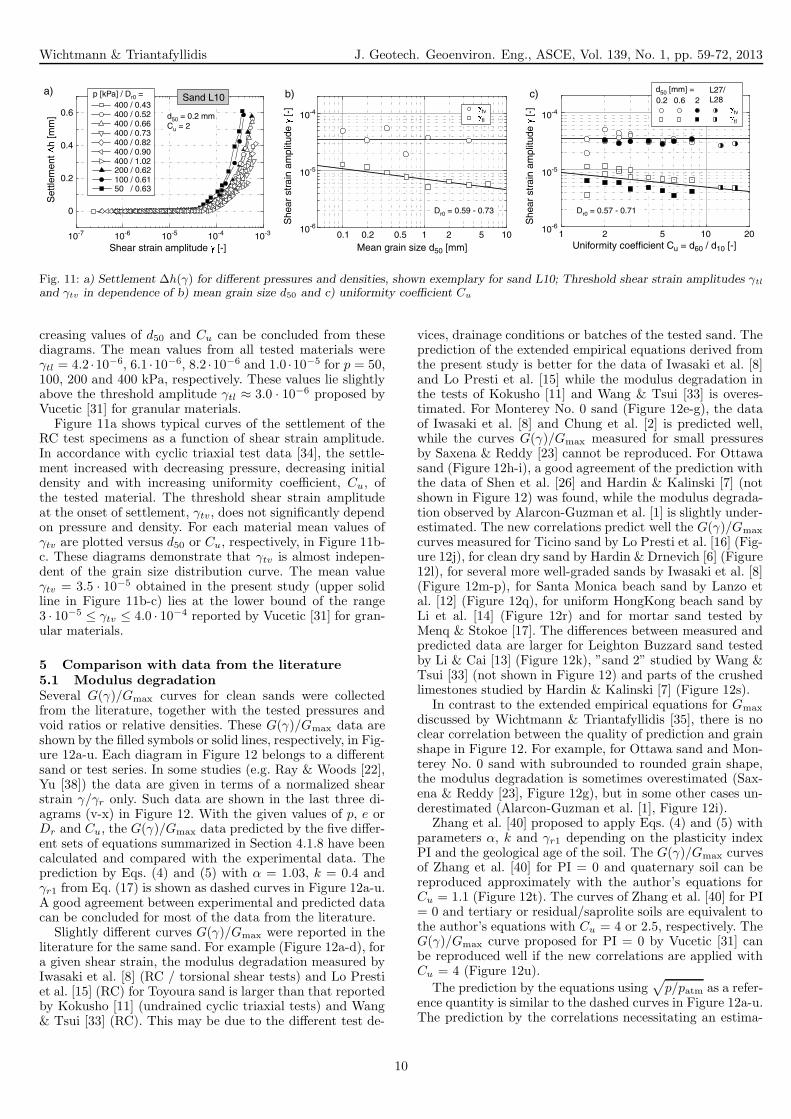
4.3 Threshold amplitudes
The threshold shear strain amplitude indicating the transi-tion from the linear elastic to the nonlinear elastic behaviourwas defined as γtl = γ(G/Gmax = 0.99) (Vucetic [31]). Anincrease of γtl with increasing mean pressure was observed(compare the curves G(γ)/Gmax in Figure 2a-d). In Figure11b-c, γtl is plotted versus d50 or Cu, respectively. The givenγtl-values are mean values from the four tests with differentpressures. A slight tendency for a decrease of γtl with in-
9
Wichtmann & Triantafyllidis J. Geotech. Geoenviron. Eng., ASCE, Vol. 139, No. 1, pp. 59-72, 2013
1 2 5 10 20Uniformity coefficient Cu = d60 / d10 [-]
10-6
10-5
10-4
0.1 0.2 0.5 1 2 5 10Mean grain size d50 [mm]Shear strain amplitude � [-]
10-7 10-6 10-5 10-4 10-3
0
0.2
0.4
0.6
Set
tlem
ent
� h [m
m]
a) b) c)
She
ar s
trai
n am
plitu
de
� [-]
10-6
10-5
10-4
She
ar s
trai
n am
plitu
de
� [-]�
tl
�tv
d50 [mm] =0.2 0.6 2
L27/ L28
�tl
�tv
Sand L10
50 / 0.63100 / 0.61200 / 0.62
p [kPa] / Dr0 =400 / 0.43400 / 0.52400 / 0.66400 / 0.73400 / 0.82400 / 0.90400 / 1.02
d50 = 0.2 mm�Cu = 2
Dr0 = 0.59 - 0.73 Dr0 = 0.57 - 0.71
Fig. 11: a) Settlement ∆h(γ) for different pressures and densities, shown exemplary for sand L10; Threshold shear strain amplitudes γtl
and γtv in dependence of b) mean grain size d50 and c) uniformity coefficient Cu
creasing values of d50 and Cu can be concluded from thesediagrams. The mean values from all tested materials wereγtl = 4.2 ·10−6, 6.1 ·10−6, 8.2 ·10−6 and 1.0 ·10−5 for p = 50,100, 200 and 400 kPa, respectively. These values lie slightlyabove the threshold amplitude γtl ≈ 3.0 · 10−6 proposed byVucetic [31] for granular materials.
Figure 11a shows typical curves of the settlement of theRC test specimens as a function of shear strain amplitude.In accordance with cyclic triaxial test data [34], the settle-ment increased with decreasing pressure, decreasing initialdensity and with increasing uniformity coefficient, Cu, ofthe tested material. The threshold shear strain amplitudeat the onset of settlement, γtv, does not significantly dependon pressure and density. For each material mean values ofγtv are plotted versus d50 or Cu, respectively, in Figure 11b-c. These diagrams demonstrate that γtv is almost indepen-dent of the grain size distribution curve. The mean valueγtv = 3.5 · 10−5 obtained in the present study (upper solidline in Figure 11b-c) lies at the lower bound of the range3 · 10−5 ≤ γtv ≤ 4.0 · 10−4 reported by Vucetic [31] for gran-ular materials.
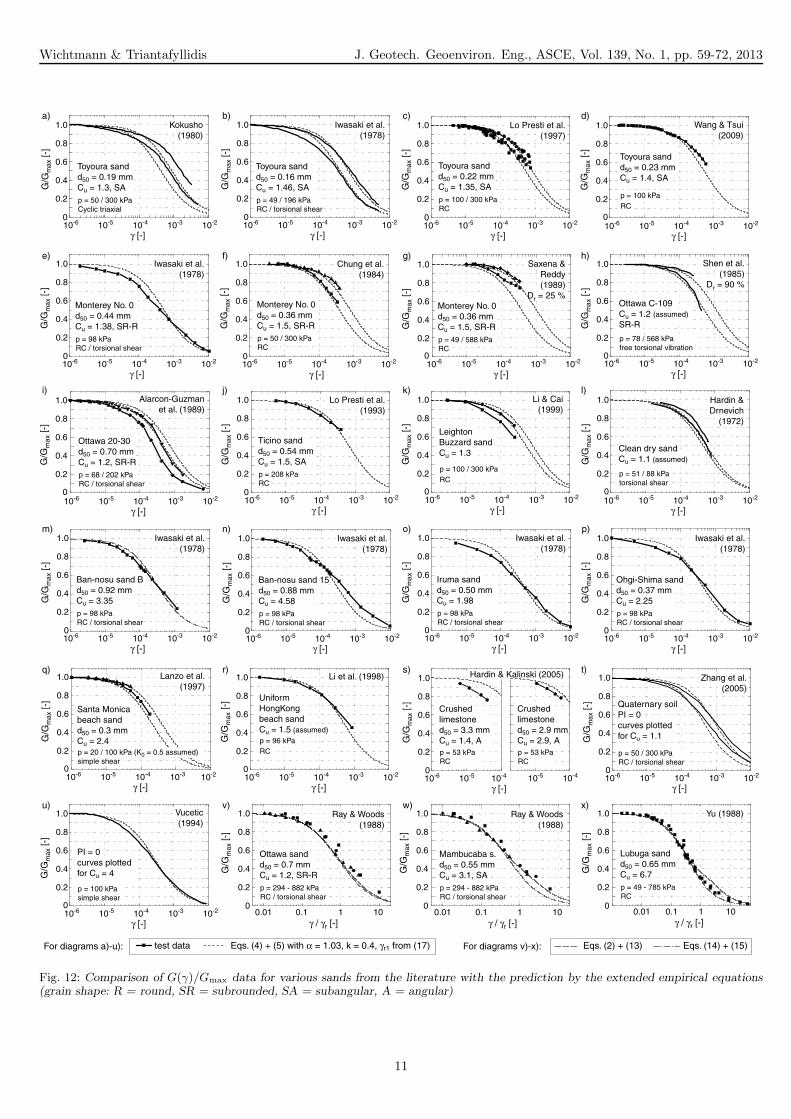
5 Comparison with data from the literature5.1 Modulus degradationSeveral G(γ)/Gmax curves for clean sands were collectedfrom the literature, together with the tested pressures andvoid ratios or relative densities. These G(γ)/Gmax data areshown by the filled symbols or solid lines, respectively, in Fig-ure 12a-u. Each diagram in Figure 12 belongs to a differentsand or test series. In some studies (e.g. Ray & Woods [22],Yu [38]) the data are given in terms of a normalized shearstrain γ/γr only. Such data are shown in the last three di-agrams (v-x) in Figure 12. With the given values of p, e orDr and Cu, the G(γ)/Gmax data predicted by the five differ-ent sets of equations summarized in Section 4.1.8 have beencalculated and compared with the experimental data. Theprediction by Eqs. (4) and (5) with α = 1.03, k = 0.4 andγr1 from Eq. (17) is shown as dashed curves in Figure 12a-u.A good agreement between experimental and predicted datacan be concluded for most of the data from the literature.
Slightly different curves G(γ)/Gmax were reported in theliterature for the same sand. For example (Figure 12a-d), fora given shear strain, the modulus degradation measured byIwasaki et al. [8] (RC / torsional shear tests) and Lo Prestiet al. [15] (RC) for Toyoura sand is larger than that reportedby Kokusho [11] (undrained cyclic triaxial tests) and Wang& Tsui [33] (RC). This may be due to the different test de-
vices, drainage conditions or batches of the tested sand. Theprediction of the extended empirical equations derived fromthe present study is better for the data of Iwasaki et al. [8]and Lo Presti et al. [15] while the modulus degradation inthe tests of Kokusho [11] and Wang & Tsui [33] is overes-timated. For Monterey No. 0 sand (Figure 12e-g), the dataof Iwasaki et al. [8] and Chung et al. [2] is predicted well,while the curves G(γ)/Gmax measured for small pressuresby Saxena & Reddy [23] cannot be reproduced. For Ottawasand (Figure 12h-i), a good agreement of the prediction withthe data of Shen et al. [26] and Hardin & Kalinski [7] (notshown in Figure 12) was found, while the modulus degrada-tion observed by Alarcon-Guzman et al. [1] is slightly under-estimated. The new correlations predict well the G(γ)/Gmax
curves measured for Ticino sand by Lo Presti et al. [16] (Fig-ure 12j), for clean dry sand by Hardin & Drnevich [6] (Figure12l), for several more well-graded sands by Iwasaki et al. [8](Figure 12m-p), for Santa Monica beach sand by Lanzo etal. [12] (Figure 12q), for uniform HongKong beach sand byLi et al. [14] (Figure 12r) and for mortar sand tested byMenq & Stokoe [17]. The differences between measured andpredicted data are larger for Leighton Buzzard sand testedby Li & Cai [13] (Figure 12k), ”sand 2” studied by Wang &Tsui [33] (not shown in Figure 12) and parts of the crushedlimestones studied by Hardin & Kalinski [7] (Figure 12s).
In contrast to the extended empirical equations for Gmax
discussed by Wichtmann & Triantafyllidis [35], there is noclear correlation between the quality of prediction and grainshape in Figure 12. For example, for Ottawa sand and Mon-terey No. 0 sand with subrounded to rounded grain shape,the modulus degradation is sometimes overestimated (Sax-ena & Reddy [23], Figure 12g), but in some other cases un-derestimated (Alarcon-Guzman et al. [1], Figure 12i).
Zhang et al. [40] proposed to apply Eqs. (4) and (5) withparameters α, k and γr1 depending on the plasticity indexPI and the geological age of the soil. The G(γ)/Gmax curvesof Zhang et al. [40] for PI = 0 and quaternary soil can bereproduced approximately with the author’s equations forCu = 1.1 (Figure 12t). The curves of Zhang et al. [40] for PI= 0 and tertiary or residual/saprolite soils are equivalent tothe author’s equations with Cu = 4 or 2.5, respectively. TheG(γ)/Gmax curve proposed for PI = 0 by Vucetic [31] canbe reproduced well if the new correlations are applied withCu = 4 (Figure 12u).
The prediction by the equations using√
p/patm as a refer-ence quantity is similar to the dashed curves in Figure 12a-u.The prediction by the correlations necessitating an estima-
10
Wichtmann & Triantafyllidis J. Geotech. Geoenviron. Eng., ASCE, Vol. 139, No. 1, pp. 59-72, 2013
Eqs. (4) + (5) with α = 1.03, k = 0.4, γr1 from (17)test data
G/G
ma
x [-]
γ [-]10-6 10-5 10-4 10-210-3
0.2
0
0.4
0.6
0.8
1.0
0.2
0
0.4
0.6
0.8
1.0
G/G
ma
x [
-]γ [-]
10-6 10-5 10-4 10-210-3
Toyoura sand
d50 = 0.16 mm
Cu = 1.46, SA
Iwasaki et al.
(1978)
p = 49 / 196 kPa
RC / torsional shear
Toyoura sand
d50 = 0.19 mm
Cu = 1.3, SA
p = 50 / 300 kPa
Cyclic triaxial
Kokusho
(1980)
0.2
0
0.4
0.6
0.8
1.0
G/G
ma
x [
-]
γ [-]10-6 10-5 10-4 10-210-3
Ban-nosu sand 15
d50 = 0.88 mm
Cu = 4.58
Iwasaki et al.
(1978)
p = 98 kPa
RC / torsional shear
0.2
0
0.4
0.6
0.8
1.0
G/G
ma
x [
-]
γ [-]10-6 10-5 10-4 10-210-3
Iruma sand
d50 = 0.50 mm
Cu = 1.98
Iwasaki et al.
(1978)
p = 98 kPa
RC / torsional shear
0.2
0
0.4
0.6
0.8
1.0
G/G
ma
x [
-]
γ [-]10-6 10-5 10-4 10-210-3
Ohgi-Shima sand
d50 = 0.37 mm
Cu = 2.25
Iwasaki et al.
(1978)
p = 98 kPa
RC / torsional shear
0.2
0
0.4
0.6
0.8
1.0
G/G
ma
x [
-]
γ [-]10-6 10-5 10-4 10-210-3
Monterey No. 0
d50 = 0.44 mm
Cu = 1.38, SR-R
Iwasaki et al.
(1978)
p = 98 kPa
RC / torsional shear
0.2
0
0.4
0.6
0.8
1.0
G/G
ma
x [
-]
γ [-]10-6 10-5 10-4 10-210-3
Ticino sand
d50 = 0.54 mm
Cu = 1.5, SA
Lo Presti et al.
(1993)
p = 208 kPa
RC
0.2
0
0.4
0.6
0.8
1.0
G/G
ma
x [-]
γ [-]10-6 10-5 10-4 10-210-3
Wang & Tsui
(2009)
Toyoura sand
d50 = 0.23 mm
Cu = 1.4, SA
p = 100 kPa
RC0.2
0
0.4
0.6
0.8
1.0
G/G
ma
x [-]
γ [-]10-6 10-5 10-4 10-210-3
Toyoura sand
d50 = 0.22 mm
Cu = 1.35, SA
Lo Presti et al.
(1997)
p = 100 / 300 kPa
RC
0.2
0
0.4
0.6
0.8
1.0
G/G
ma
x [
-]
γ [-]10-6 10-5 10-4 10-210-3
Monterey No. 0
d50 = 0.36 mm
Cu = 1.5, SR-R
Chung et al.
(1984)
p = 50 / 300 kPa
RC0.2
0.4
0.6
0.8
1.0
G/G
ma
x [-]
Saxena &
Reddy
(1989)
Dr = 25 %Monterey No. 0
d50 = 0.36 mm
Cu = 1.5, SR-R
p = 49 / 588 kPa
RC
γ [-]10-6 10-5 10-4 10-210-3
Ottawa C-109
Cu = 1.2 (assumed)
SR-R
p = 78 / 568 kPa
free torsional vibration
Shen et al.
(1985)
Dr = 90 %
0.2
00
0.4
0.6
0.8
1.0
G/G
ma
x [-]
γ [-]10-6 10-5 10-4 10-210-3
0.2
0
0.4
0.6
0.8
1.0
G/G
ma
x [
-]
γ [-]10-6 10-5 10-4 10-210-3
Alarcon-Guzman
et al. (1989)
Ottawa 20-30
d50 = 0.70 mm
Cu = 1.2, SR-R
p = 68 / 202 kPa
RC / torsional shear
0.2
0
0.4
0.6
0.8
1.0G
/Gm
ax [
-]
γ [-]10-6 10-5 10-4 10-210-3
Li & Cai
(1999)
Leighton
Buzzard sand
Cu = 1.3
p = 100 / 300 kPa
RC0.2
0
0.4
0.6
0.8
1.0
G/G
ma
x [-]
0.2
0
0.4
0.6
0.8
1.0
G/G
ma
x [
-]
Hardin &
Drnevich
(1972)
Clean dry sand
Cu = 1.1 (assumed)
p = 51 / 88 kPa
torsional shear
Li et al. (1998)
Uniform
HongKong
beach sand
Cu = 1.5 (assumed)
p = 96 kPa
RC
γ [-]10-6 10-5 10-4 10-210-3
γ [-]10-6 10-5 10-4 10-210-3
0.2
0
0.4
0.6
0.8
1.0
G/G
ma
x [
-]
Santa Monica
beach sand
d50 = 0.3 mm
Cu = 2.4
Lanzo et al.
(1997)
γ [-]10-6 10-5 10-4 10-210-3
0.2
0
0.4
0.6
0.8
1.0
G/G
ma
x [
-]
γ [-]10-6 10-5 10-4 10-210-3
Quaternary soil
PI = 0
curves plotted
for Cu = 1.1
Zhang et al.
(2005)
p = 50 / 300 kPa
RC / torsional shear
0.2
0
0.4
0.6
0.8
1.0
G/G
max [
-]
Vucetic
(1994)
PI = 0
curves plotted
for Cu = 4
p = 100 kPa
simple shear
γ [-]10-6 10-5 10-4 10-210-3
0.2
0
0.4
0.6
0.8
1.0
G/G
ma
x [
-]
γ [-]10-6 10-5 10-4
Crushed
limestone
d50 = 3.3 mm
Cu = 1.4, A
Hardin & Kalinski (2005)
p = 53 kPa
RC
p = 53 kPa
RC
10-5 10-4
Crushed
limestone
d50 = 2.9 mm
Cu = 2.9, A
Eqs. (2) + (13) Eqs. (14) + (15)
G/G
ma
x [
-]
0.2
0
0.4
0.6
0.8
1.0
G/G
ma
x [
-]
0.2
0
0.4
0.6
0.8
1.0
G/G
ma
x [
-]
0.2
0
0.4
0.6
0.8
1.0
0.01 0.1 1 10
Ray & Woods
(1988)
Ottawa sand
d50 = 0.7 mm
Cu = 1.2, SR-R
p = 294 - 882 kPa
RC / torsional shear
γ / γr [-]0.01 0.1 1 10
γ / γr [-] γ / γr [-]
Ray & Woods
(1988)
Mambucaba s.
d50 = 0.55 mm
Cu = 3.1, SA
p = 294 - 882 kPa
RC / torsional shear
0.01 0.1 1 10
Yu (1988)
Lubuga sand
d50 = 0.65 mm
Cu = 6.7
p = 49 - 785 kPa
RC
a) b) c) d)
e) f) g) h)
i) j) k) l)
m) n) o) p)
q) r) s) t)
u) v) w) x)
For diagrams v)-x):For diagrams a)-u):
0.2
0
0.4
0.6
0.8
1.0
G/G
ma
x [
-]
γ [-]10-6 10-5 10-4 10-210-3
Ban-nosu sand B
d50 = 0.92 mm
Cu = 3.35
p = 98 kPa
RC / torsional shear
Iwasaki et al.
(1978)
p = 20 / 100 kPa (K0 = 0.5 assumed)
simple shear
Fig. 12: Comparison of G(γ)/Gmax data for various sands from the literature with the prediction by the extended empirical equations(grain shape: R = round, SR = subrounded, SA = subangular, A = angular)
11
Wichtmann & Triantafyllidis J. Geotech. Geoenviron. Eng., ASCE, Vol. 139, No. 1, pp. 59-72, 2013
0
0.10
0.20
0.30
0.40
0
0.05
0.10
0.15
0.20
0.25
D [-]
D [-]
γ [-]10-6 10-5 10-4 10-210-3
γ [-]10-6 10-5 10-4 10-3
D [-]
γ [-]10-6 10-5 10-4 10-210-3
γ [-]10-6 10-5 10-4 10-210-3
Toyoura sand
d50 = 0.19 mm
Cu = 1.3, SA
p = 50 / 300 kPa
cyclic triaxial
N = 10
Kokusho (1980)
0.04
0
0.08
0.12
D [-]
D [-]
γ [-]10-6 10-5 10-4 10-3
γ [-]10-6 10-5 10-4 10-3
0
0.04
0.08
0.12
Monterey No. 0
d50 = 0.36 mm
Cu = 1.5, SR-R
Chung et al. (1984)
p = 100 / 300 kPa
RC
0
0.04
0.08
0.12Saxena & Reddy (1989)
Dr = 25 %
Monterey No. 0
d50 = 0.36 mm
Cu = 1.5, SR-R
p = 49 - 588 kPa
RC
0
0.1
0.2
0.3
Vucetic (1994)
PI = 0
curves plotted
for Cu = 4
p = 100 kPa
simple shear
N = 1
D [-]
D [-]
γ [-]10-6 10-5 10-4 10-210-30
0.05
0.10
0.15
0.20Hardin &
Drnevich (1972)
Clean dry sand
Cu = 1.1 (assumed)
p = 25 - 88 kPa
torsional shear
N = 100
γ [-]10-6 10-5 10-4 10-210-3
γ [-]10-6 10-5 10-4 10-3
D [-]
D [-]
0
0.05
0.10
0.15
0.20
0.25
γ [-]10-6 10-5 10-4 10-210-3
Tatsuoka et al. (1978)
Toyoura sand
d50 = 0.16 mm
Cu = 1.46, SA
p = 49 / 196 kPa
torsional
shear,
N = 10
RC
Ban-nosu sand B
d50 = 0.92 mm
Cu = 3.35
0
0.04
0.08
0.12
Toyoura sand
d50 = 0.22 mm
Cu = 1.35, SA
Lo Presti et al. (1997)
p = 100 / 300 kPa
RC
D [-]
0
0.1
0.2
0.3
torsional
shear,
N = 10RC
Tatsuoka et al. (1978)
Crystal silica sand
d50 = 0.66 mm
Cu = 1.4
Silver & Seed (1971)
p = 16 - 128 kPa
(K0 = 0.5 assum.)
simple shear
0
0.05
0.10
0.15
0.20
D [-]
γ [-]10-6 10-5 10-4 10-3
Li et al. (1998)
Uniform
HongKong
beach sand
Cu = 1.5 (assumed)
p = 96 kPa
RC
0.010.001 0.1 1 10 100
γ/γr [-]
D [-]
0
0.1
0.2
0.3 Yu (1988)
Lubuga sand
d50 = 0.65 mm
Cu = 6.7
p = 49 - 785 kPa
RC
p = 98 kPa
via G/Gmax with Eqs. (8), (23), (24)Eq. (22) with (p/patm)0.5 instead γrtest data Eq. (22) with γrFor diagram l):For diagrams a)-k):
a) b) c) d)
e) f) g) h)
i) j) k) l)
Ottawa C-109
Cu = 1.2 (assumed), SR-R
p = 78 - 568 kPa
free torsional vibration
Shen et al. (1985)
Fig. 13: Comparison of D(γ) data for various sands from the literature with the prediction by the extended empirical equations (grainshape: R = round, SR = subrounded, SA = subangular, A = angular)
tion of the reference shear strain, γr, was found slightly moreinaccurate, probably due to uncertainties in the γr-valuescalculated with estimations of Gmax and τmax.
The diagrams in Figure 12v-x demonstrate a good congru-ence between the G(γ/γr)/Gmax data of Ray & Woods [22]and Yu [38] and the curves calculated from Eqs. (2) and(14) with the parameters from Eqs. (13) or (15), respec-tively. However, due to the uncertainties in the estimatedγr-values, for practical purposes it is recommended to ap-ply the extended Stokoe’s equation (4) or the formulas using
normalization with√
p/patm.
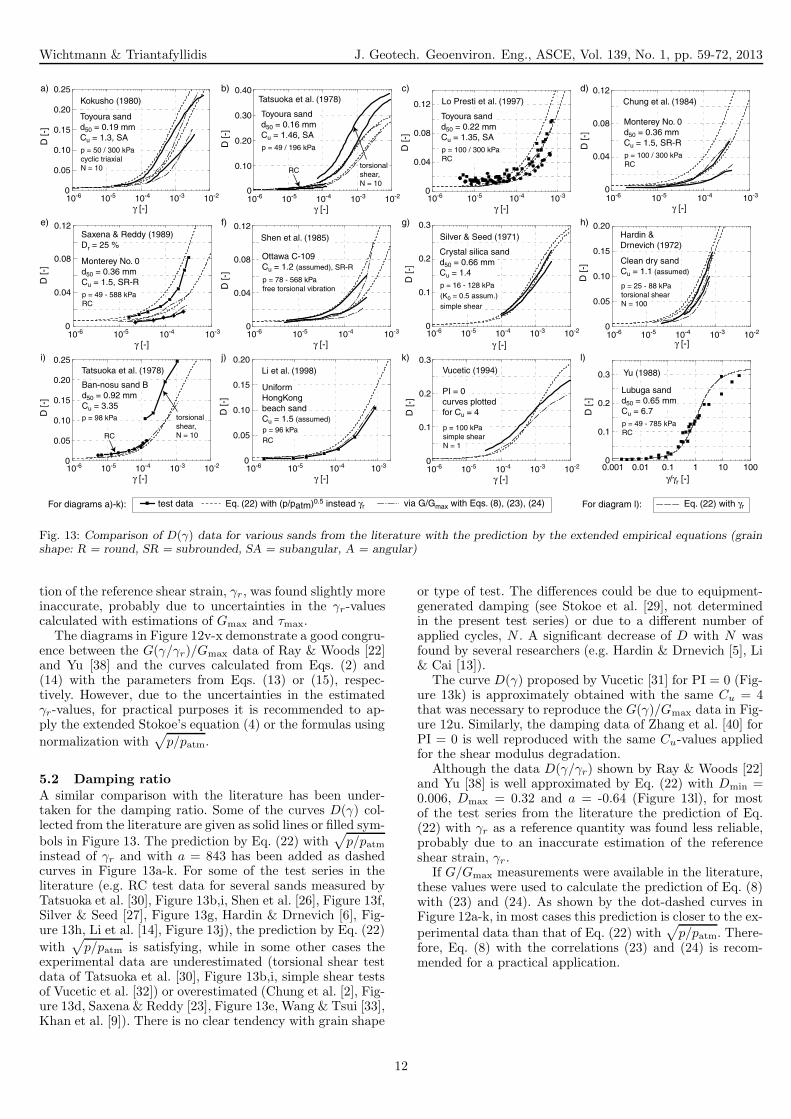
5.2 Damping ratioA similar comparison with the literature has been under-taken for the damping ratio. Some of the curves D(γ) col-lected from the literature are given as solid lines or filled sym-bols in Figure 13. The prediction by Eq. (22) with
√
p/patminstead of γr and with a = 843 has been added as dashedcurves in Figure 13a-k. For some of the test series in theliterature (e.g. RC test data for several sands measured byTatsuoka et al. [30], Figure 13b,i, Shen et al. [26], Figure 13f,Silver & Seed [27], Figure 13g, Hardin & Drnevich [6], Fig-ure 13h, Li et al. [14], Figure 13j), the prediction by Eq. (22)
with√
p/patm is satisfying, while in some other cases theexperimental data are underestimated (torsional shear testdata of Tatsuoka et al. [30], Figure 13b,i, simple shear testsof Vucetic et al. [32]) or overestimated (Chung et al. [2], Fig-ure 13d, Saxena & Reddy [23], Figure 13e, Wang & Tsui [33],Khan et al. [9]). There is no clear tendency with grain shape
or type of test. The differences could be due to equipment-generated damping (see Stokoe et al. [29], not determinedin the present test series) or due to a different number ofapplied cycles, N . A significant decrease of D with N wasfound by several researchers (e.g. Hardin & Drnevich [5], Li& Cai [13]).
The curve D(γ) proposed by Vucetic [31] for PI = 0 (Fig-ure 13k) is approximately obtained with the same Cu = 4that was necessary to reproduce the G(γ)/Gmax data in Fig-ure 12u. Similarly, the damping data of Zhang et al. [40] forPI = 0 is well reproduced with the same Cu-values appliedfor the shear modulus degradation.
Although the data D(γ/γr) shown by Ray & Woods [22]and Yu [38] is well approximated by Eq. (22) with Dmin =0.006, Dmax = 0.32 and a = -0.64 (Figure 13l), for mostof the test series from the literature the prediction of Eq.(22) with γr as a reference quantity was found less reliable,probably due to an inaccurate estimation of the referenceshear strain, γr.
If G/Gmax measurements were available in the literature,these values were used to calculate the prediction of Eq. (8)with (23) and (24). As shown by the dot-dashed curves inFigure 12a-k, in most cases this prediction is closer to the ex-perimental data than that of Eq. (22) with
√
p/patm. There-fore, Eq. (8) with the correlations (23) and (24) is recom-mended for a practical application.
12
Wichtmann & Triantafyllidis J. Geotech. Geoenviron. Eng., ASCE, Vol. 139, No. 1, pp. 59-72, 2013
6 Micromechanical explanation for d50-independence and Cu-influence
The d50-independence of the curves G(γ)/Gmax and D(γ)observed in the experiments can be explained micromechan-ically by means of a simple cubic array of identical quartzspheres as described by Dobry et al. [3]. This theory, basedon Mindlin [18] and Mindlin & Deresiewicz [19], predicts ashear modulus degradation with increasing shear strain am-plitude according to
G
Gmax
=2
3
1− (1− γ/γt)3/2
γ/γt(25)
with the reference (threshold) shear strain, γt, being propor-tional to σ2/3, where σ is the normal stress acting on thearray of spheres. A similar equation giving D in terms ofγ/γt has been also derived by Dobry et al. [3]. Since γt isindependent of the diameter of the spheres, also the curvesG(γ)/Gmax and D(γ) are independent of the grain size.
A micromechanical explanation for the larger modulusdegradation in granular materials with higher uniformity co-efficient can be given based on the study of force transmis-sion chains in monodisperse and in polydisperse materialsdescribed by Radjai & Wolf [20] and Radjai et al. [21]. Ina monodisperse material (particles of equal size) the forcechains are rather equally distributed. In a polydisperse ma-terial (many different particle sizes), strong and weak forcechains are formed through the interparticle contacts. WithNc denoting the contact normal force and N av
c the averagevalue of all contacts, the contact is defined as ”strong” in caseNc ≥ Nav
c and ”weak” if Nc < Nav
c . Numerical simulationsof a polydisperse packing (Radjai & Wolf [20]) showed thatthe weak contacts transmit only approximately 28% of theaverage mean pressure in the granular packing. This meansthat a relatively small number of contacts in a polydispersepacking have large contact stresses and thus large referenceshear strains, γt, while larger parts of the granular assemblyhave low γt values due to comparably low contact stresses.This may lead to a lower average γt value of the polydispersepacking compared to the monodisperse material. Accordingto Eq. (25), for a given shear strain amplitude γ, lower γt-values mean a larger modulus degradation.
However, according to the theory of Dobry et al. [3], adecrease of γt with increasing Cu should be accompaniedby an increase of damping ratio. This was not observed inthe experiments. The damping mechanism in the theory ofDobry et al. [3] is based on sliding between loaded parti-cles. In a polydisperse material, parts of the smaller grainswith weak contacts will probably show a rolling contact be-haviour, especially at larger shear strain amplitude, due totheir lower γt-values. These small grains will act as a kindof lubricant for the larger grains. Rolling of grains involvesa smaller dissipation of energy than the sliding mechanism,i.e., damping ratio decreases. These two mechanisms seemto compensate each other, leading to the Cu-independenceof the curves D(γ).
7 Summary, conclusions and outlookThe influence of the grain size distribution curve on the mod-ulus degradation curves G(γ)/Gmax, on damping ratio D(γ)and on the threshold shear strain amplitudes, γtl and γtv ,was inspected based on the data from approximately 280resonant column (RC) tests on 27 clean quartz sands with
specially mixed grain size distribution curves. For each ma-terial, several RC tests with different relative densities andpressures were performed.
The test results show that the modulus degradation isnot affected by the mean grain size, d50, of the tested ma-terial. In contrast, for a certain shear strain amplitude, theratio G/Gmax significantly decreases with increasing unifor-mity coefficient, Cu = d60/d10. In order to consider this Cu-influence in common empirical equations for modulus degra-dation, the parameters of these equations have been corre-lated with Cu. The curves of damping ratio D(γ) were foundalmost independent of the grain size distribution curve. How-ever, the correlation between D −Dmin and G/Gmax is Cu-dependent. For a practical application, equations consideringthis Cu-influence have been developed. While the thresholdshear strain amplitude γtl slightly decreases with increasingvalues of d50 and Cu, no significant influence of the grainsize distribution curve on the threshold shear strain ampli-tude γtv could be found.
A good agreement between the prediction of the extendedempirical equations and experimental G(γ)/Gmax and D(γ)data collected from the literature could be demonstrated.Furthermore, a micromechanical explanation of the observeddependencies has been provided.
In future work, the proposed correlations will be extendedfor sands containing fines and inspected for sands with gap-graded, stepwise linear, S-shaped or other naturally shapedgrain size distribution curves.
Acknowledgements
The presented study has been performed within the frame-work of the project ”Influence of the uniformity coefficient ofthe grain size distribution curve and of the fines content onthe dynamic properties of non-cohesive soils” funded by theGerman Research Council (DFG, project No. TR218/11-1).The authors are grateful to DFG for the financial support.The RC tests have been performed during the former workof the authors at Ruhr-University Bochum, Germany.
References[1] A. Alarcon-Guzman, J.L. Chameau, G.A. Leonardos, and
J.D. Frost. Shear modulus and cyclic undrained behavior ofsands. Soils and Foundations, 29(4):105–119, 1989.
[2] R.M. Chung, F.Y. Yokel, and V.P. Drnevich. Evaluationof dynamic properties of sands by resonant column testing.Geotechnical Testing Journal, ASTM, 7(2):60–69, 1984.
[3] R. Dobry, R.S. Ladd, F.Y. Yokel, R.M. Chung, and D. Pow-ell. Prediction of pore pressure buildup and liquefaction ofsands during earthquakes by the cyclic strain method. Tech-nical Report 138, U.S. Department of Commerce, Nationalbureau of standards, 1982. NBS Building science series.
[4] B.O. Hardin and W.L. Black. Sand stiffness under varioustriaxial stresses. Journal of the Soil Mechanics and Founda-tions Division, ASCE, 92(SM2):27–42, 1966.
[5] B.O. Hardin and V.P. Drnevich. Shear modulus and damp-ing in soils: design equations and curves. Journal of the SoilMechanics and Foundations Division, ASCE, 98(SM7):667–692, 1972.
[6] B.O. Hardin and V.P. Drnevich. Shear modulus and damp-ing in soils: measurement and parameter effects. Journalof the Soil Mechanics and Foundations Division, ASCE,98(SM6):603–624, 1972.
13
Wichtmann & Triantafyllidis J. Geotech. Geoenviron. Eng., ASCE, Vol. 139, No. 1, pp. 59-72, 2013
[7] B.O. Hardin and M.E. Kalinski. Estimating the shear mod-ulus of gravelly soils. Journal of Geotechnical and Geoenvi-ronmental Engineering, ASCE, 131(7):867–875, 2005.
[8] T. Iwasaki, F. Tatsuoka, and Y. Takagi. Shear moduli ofsands under cyclic torsional shear loading. Soils and Foun-dations, 18(1):39–56, 1978.
[9] Z.H. Khan, G. Cascante, M.H. El Naggar, and C.G. Lai.Measurement of frequency-dependent dynamic properties ofsoils using the resonant-column device. Journal of Geotechni-cal and Geoenvironmental Engineering, ASCE, 134(9):1319–1326, 2008.
[10] N.Q. Khouri. Dynamic properties of soils. Master’s thesis,Department of Civil Engineering, Syracuse, University, 1984.
[11] T. Kokusho. Cyclic triaxial test of dynamic soil propertiesfor wide strain range. Soils and Foundations, 20(2):45–59,1980.
[12] G. Lanzo, M. Vucetic, and M. Doroudian. Reduction ofshear modulus at small strains in simple shear. Journalof Geotechnical and Geoenvironmental Engineering, ASCE,123(11):1035–1042, 1997.
[13] X.S. Li and Z.Y. Cai. Effects of low-number previbration cy-cles on dynamic properties of dry sand. Journal of Geotechni-cal and Geoenvironmental Engineering, ASCE, 125(11):979–987, 1999.
[14] X.S. Li, W.L. Yang, C.K. Chen, and W.C. Wang. Energy-injecting virtual mass resonant column system. Journalof Geotechnical and Geoenvironmental Engineering, ASCE,124(5):428–438, 1998.
[15] D.C.F. Lo Presti, M. Jamiolkowski, O. Pallara, A. Caval-laro, and Pedroni S. Shear modulus and damping of soils.Geotechnique, 47(3):603–617, 1997.
[16] D.C.F. Lo Presti, O. Pallara, R. Lancellotta, M. Armandi,and R. Maniscalco. Monotonic and cyclic loading behaviourof two sands at small strains. Geotechnical Testing Journal,ASTM, (4):409–424, 1993.
[17] F.-Y. Menq and K.H. Stokoe II. Linear dynamic propertiesof sandy and gravelly soils from large-scale resonant tests. InDi Benedetto et al., editor, Deformation Characteristics ofGeomaterials, pages 63–71. Swets & Zeitlinger, Lisse, 2003.
[18] R.D. Mindlin. Compliance of elastic bodies in contact. Jour-nal of Applied Mechanics, pages 259–268, 1949.
[19] R.D. Mindlin and H. Deresiewicz. Elastic spheres in contactunder varying oblique forces. Journal of Applied Mechanics,20:327–344, 1953.
[20] F. Radjai and D.E. Wolf. Features of static pressure in densegranular media. Granular Matter, (1):3–8, 1998.
[21] F. Radjai, D.E. Wolf, M. Jean, and J.-J. Moreau. Bimodalcharacter of stress transmission in granular packings. Phys-ical Review Lett., 80(1):61–64, 1998.
[22] R.P. Ray and R.D. Woods. Modulus and damping due touniform and variable cyclic loading. Journal of GeotechnicalEngineering, ASCE, 114(8):861–876, 1988.
[23] S.K. Saxena and K.R. Reddy. Dynamic moduli and dampingratios for Monterey No. 0 sand by resonant column tests.Soils and Foundations, 29(2):37–51, 1989.
[24] H.B. Seed and I.M. Idriss. Soil moduli and damping factorsfor dynamic response analyses. Technical Report EERC 70-10, Earthquake Engineering Research Center, University ofCalifornia, Berkeley, 1970.
[25] H.B. Seed, R.T. Wong, I.M. Idriss, and K. Tokimatsu.Moduli and damping factors for dynamic analyses of cohe-sionless soil. Journal of Geotechnical Engineering, ASCE,112(11):1016–1032, 1986.
[26] C.K. Shen, X.S. Li, and Y.Z. Gu. Microcomputer based freetorsional vibration test. Journal of Geotechnical Engineer-ing, ASCE, 111(8):971–986, 1985.
[27] M.L. Silver and H.B. Seed. Deformation characteristics ofsands under cyclic loading. Journal of the Soil Mechanicsand Foundations Division, ASCE, 97(SM8):1081–1098, 1971.
[28] K.H. Stokoe, M.B. Darendeli, R.D. Andrus, and L.T. Brown.Dynamic soil properties: laboratory, field and correlationstudies. In Proc. 2nd Int. Conf. on Earthquake Geotech.Eng., volume 3, pages 811–845. A.A. Balkema, 1999.
[29] K.H. Stokoe II, S.K. Hwang, J. N.-K. Lee, and R. Andrus.Effects of various parameters on the stiffness and dampingof soils at small to medium strains. Keynote lecture 2. In ISHokkaido 1994, volume 2, pages 785–816, 1995.
[30] F. Tatsuoka, T. Iwasaki, and Y. Takagi. Hysteretic damp-ing of sands under cyclic loading and its relation to shearmodulus. Soils and Foundations, 18(2):25–40, 1978.
[31] M. Vucetic. Cyclic threshold shear strains in soils. Journal ofGeotechnical Engineering, ASCE, 120(12):2208–2228, 1994.
[32] M. Vucetic, G. Lanzo, and M. Doroudian. Damping at smallstrains in cyclic simple shear test. Journal of Geotechnicaland Geoenvironmental Engineering, ASCE, 124(7):585–594,1998.
[33] Y.-H. Wang and K.-Y. Tsui. Experimental characteriza-tion of dynamic property changes in aged sands. Journalof Geotechnical and Geoenvironmental Engineering, ASCE,135(2):259–270, 2009.
[34] T. Wichtmann, A. Niemunis, and T. Triantafyllidis. Vali-dation and calibration of a high-cycle accumulation modelbased on cyclic triaxial tests on eight sands. Soils and Foun-dations, 49(5):711–728, 2009.
[35] T. Wichtmann and T. Triantafyllidis. On the influence ofthe grain size distribution curve of quartz sand on the smallstrain shear modulus Gmax. Journal of Geotechnical andGeoenvironmental Engineering, ASCE, 135(10):1404–1418,2009.
[36] T. Wichtmann and T. Triantafyllidis. On the influence of thegrain size distribution curve on P-wave velocity, constrainedelastic modulus Mmax and Poisson’s ratio of quartz sands.Soil Dynamics and Earthquake Engineering, 30(8):757–766,2010.
[37] T. Wichtmann and Th. Triantafyllidis. Influence of a cyclicand dynamic loading history on dynamic properties of drysand, part II: cyclic axial preloading. Soil Dynamics andEarthquake Engineering, 24(11):789–803, 2004.
[38] P. Yu. Discussion of ”Moduli and Damping Factors for Dy-namic Analyses of Cohesionless Soils” by Seed et al. Journalof Geotechnical Engineering, ASCE, 114(8):954–957, 1988.
[39] P. Yu and F.E. Richart Jr. Stress ratio effects on shearmodulus of dry sands. Journal of Geotechnical Engineering,ASCE, 110(3):331–345, 1984.
[40] J. Zhang, R.D. Andrus, and C.H. Juang. Normalized shearmodulus and material damping ratio relationships. Journalof Geotechnical and Geoenvironmental Engineering, ASCE,131(4):453–464, 2005.
14


![Slide Materi Fisika Gerak Melingkar [Recovered]](https://static.fdocument.org/doc/165x107/55cf9de3550346d033afb320/slide-materi-fisika-gerak-melingkar-recovered.jpg)