James F. Lynch and Theodore Schroeder · sin φ 2 = sin φ 1 C 2 / C 1 ... Small Incidence Angle:...
30
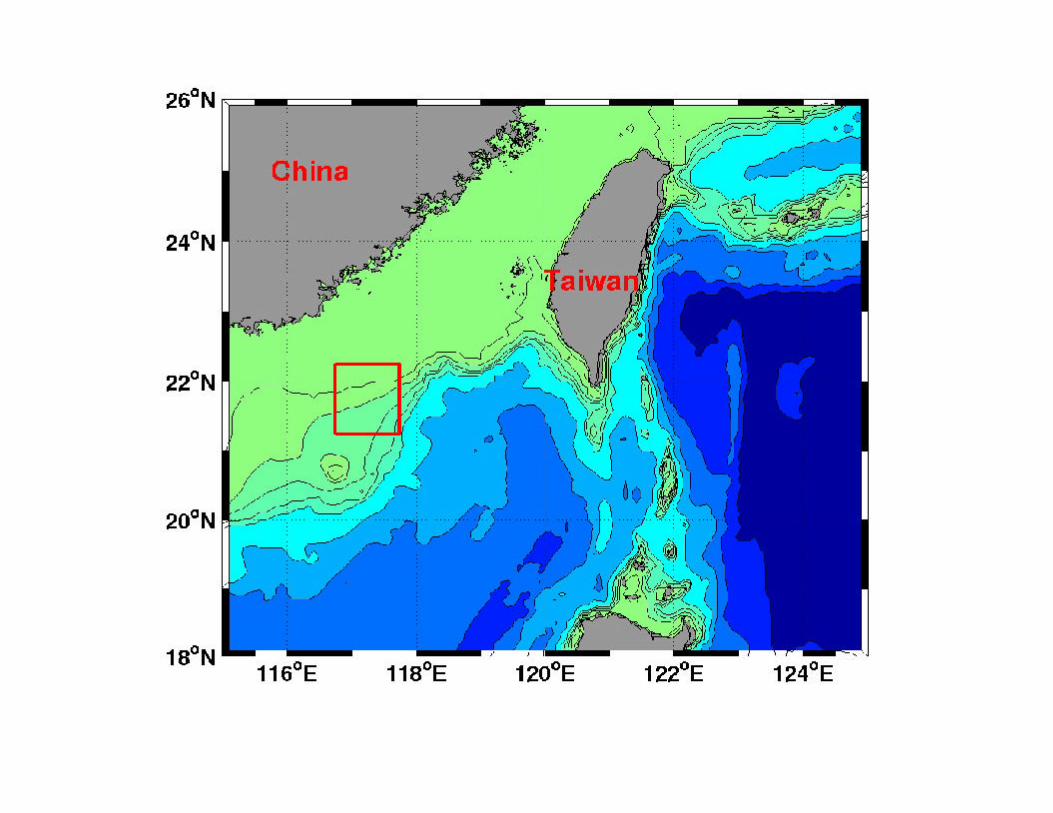
ONR NRL 1930 W O O D S HO L E O C E A NO GR A P H IC I N S T I T U T I O N WHOI NPGS NTU NSYSU Acoustic Horizontal Coherence and Beamwidth Variability Observed in ASIAEX (SCS) Stephen N. Wolf, Bruce H Pasewark, Marshall H. Orr, Peter C. Mignerey US Naval Research Laboratory, Washington DC James F. Lynch and Theodore Schroeder Woods Hole Oceanographic Institution, Woods Hole, MA Supported by the Office of Naval Research ONR ASIAEx Symposium Chengdu, China 14-18 October 2002
Transcript of James F. Lynch and Theodore Schroeder · sin φ 2 = sin φ 1 C 2 / C 1 ... Small Incidence Angle:...
ONR NRL
1930
WO
OD
S H
OLE
OCEANOGRAPHIC INS
TI TU
TION
WHOI NPGS NTU NSYSU
Acoustic Horizontal Coherence and Beamwidth VariabilityObserved in ASIAEX (SCS)
Stephen N. Wolf, Bruce H Pasewark, Marshall H. Orr, Peter C. Mignerey
US Naval Research Laboratory, Washington DC
James F. Lynch and Theodore SchroederWoods Hole Oceanographic Institution, Woods Hole, MA
Supported by the Office of Naval Research
ONR ASIAEx SymposiumChengdu, China
14-18 October 2002
Report Documentation Page Form ApprovedOMB No. 0704-0188
Public reporting burden for the collection of information is estimated to average 1 hour per response, including the time for reviewing instructions, searching existing data sources, gathering andmaintaining the data needed, and completing and reviewing the collection of information. Send comments regarding this burden estimate or any other aspect of this collection of information,including suggestions for reducing this burden, to Washington Headquarters Services, Directorate for Information Operations and Reports, 1215 Jefferson Davis Highway, Suite 1204, ArlingtonVA 22202-4302. Respondents should be aware that notwithstanding any other provision of law, no person shall be subject to a penalty for failing to comply with a collection of information if itdoes not display a currently valid OMB control number.
1. REPORT DATE 18 OCT 2002
2. REPORT TYPE N/A
3. DATES COVERED -
4. TITLE AND SUBTITLE Acoustic Horizontal Coherence and Beamwidth Variability Observed inASIAEX (SCS)
5a. CONTRACT NUMBER
5b. GRANT NUMBER
5c. PROGRAM ELEMENT NUMBER
6. AUTHOR(S) 5d. PROJECT NUMBER
5e. TASK NUMBER
5f. WORK UNIT NUMBER
7. PERFORMING ORGANIZATION NAME(S) AND ADDRESS(ES) US Naval Research Lab., Washington, DC and Woods HoleOceanographic Institution, Woods Hole, MA
8. PERFORMING ORGANIZATIONREPORT NUMBER
9. SPONSORING/MONITORING AGENCY NAME(S) AND ADDRESS(ES) 10. SPONSOR/MONITOR’S ACRONYM(S)
11. SPONSOR/MONITOR’S REPORT NUMBER(S)
12. DISTRIBUTION/AVAILABILITY STATEMENT Approved for public release, distribution unlimited
13. SUPPLEMENTARY NOTES Also See: M001452, The original document contains color images.
14. ABSTRACT
15. SUBJECT TERMS
16. SECURITY CLASSIFICATION OF: 17. LIMITATION OF ABSTRACT
UU
18. NUMBEROF PAGES
29
19a. NAME OFRESPONSIBLE PERSON
a. REPORT unclassified
b. ABSTRACT unclassified
c. THIS PAGE unclassified
Standard Form 298 (Rev. 8-98) Prescribed by ANSI Std Z39-18

GOALS
Relate Acoustic Coherence to Water ColumnInhomogeneity and Anisotropy
Contrast Coherence under Isotropic and AnisotropicConditions
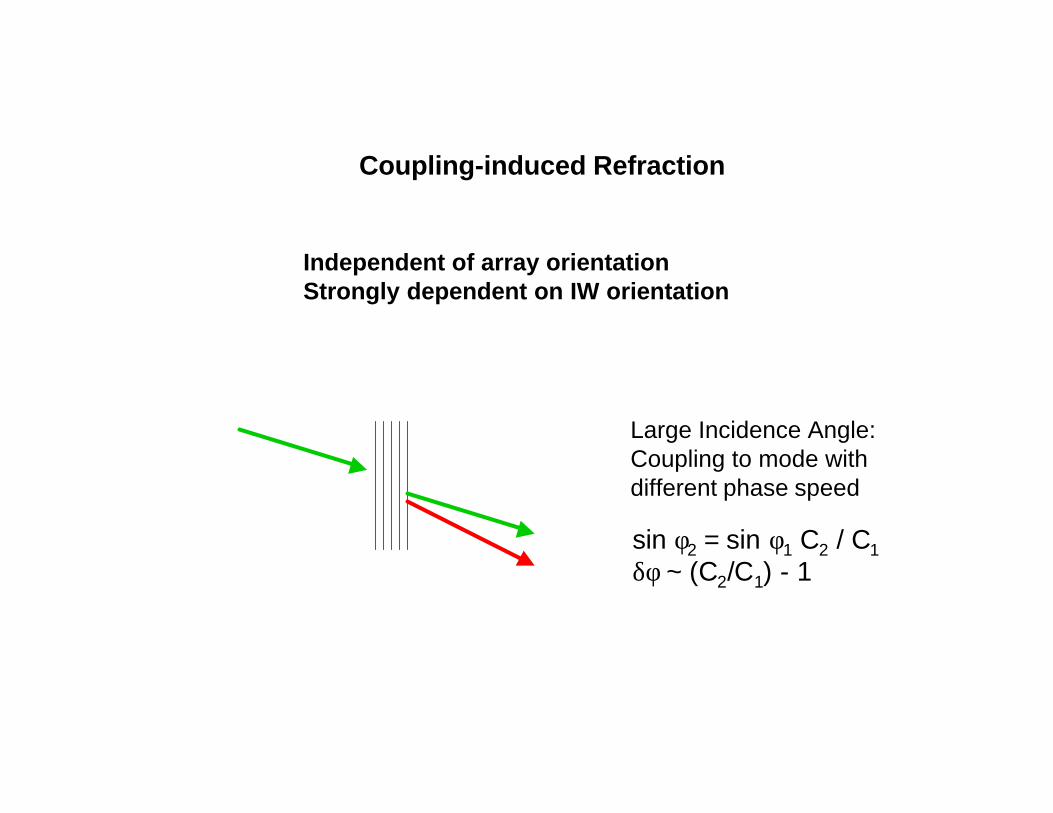
Large Incidence Angle:Coupling to mode withdifferent phase speed
sin φ2 = sin φ1 C2 / C1δφ ~ (C2/C1) - 1
Coupling-induced Refraction
Independent of array orientationStrongly dependent on IW orientation
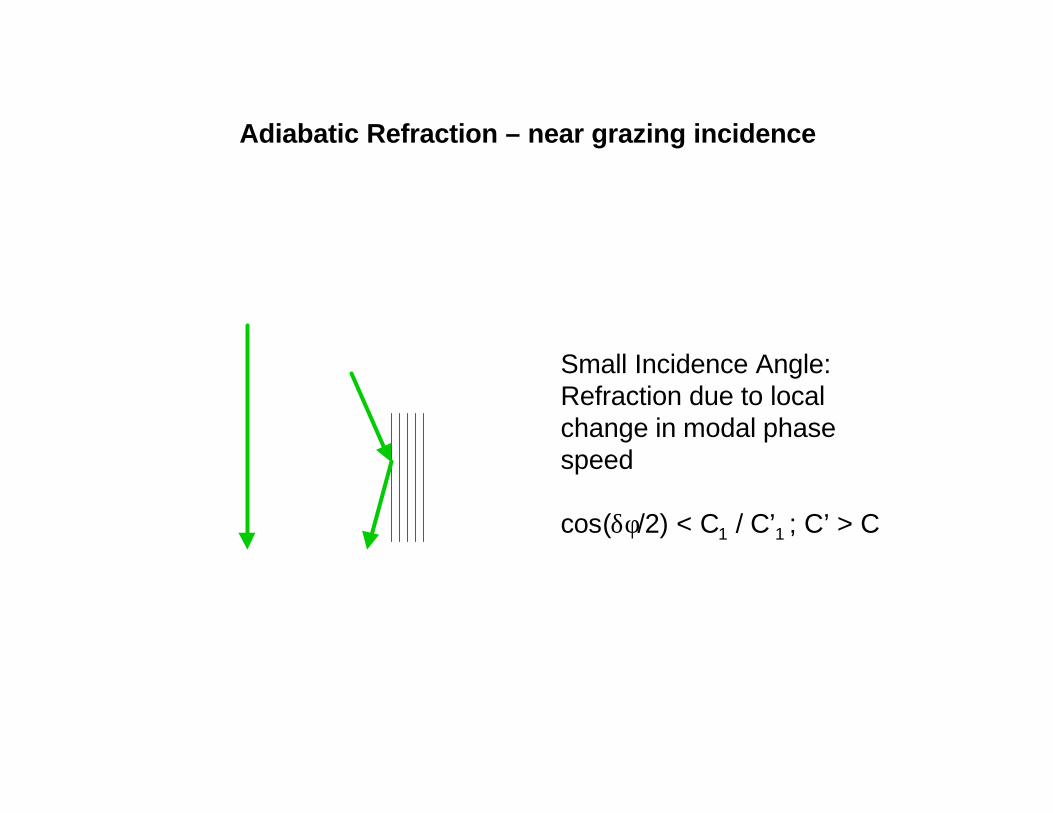
Small Incidence Angle:Refraction due to localchange in modal phasespeed
cos(δφ/2) < C1 / C’1 ; C’ > C
Adiabatic Refraction – near grazing incidence
117 .1 1 1 7 . 3 117 .5 117 .7
22 .2
22 .1
22 .0
21 .9
21 .8
21 .7
21 .6
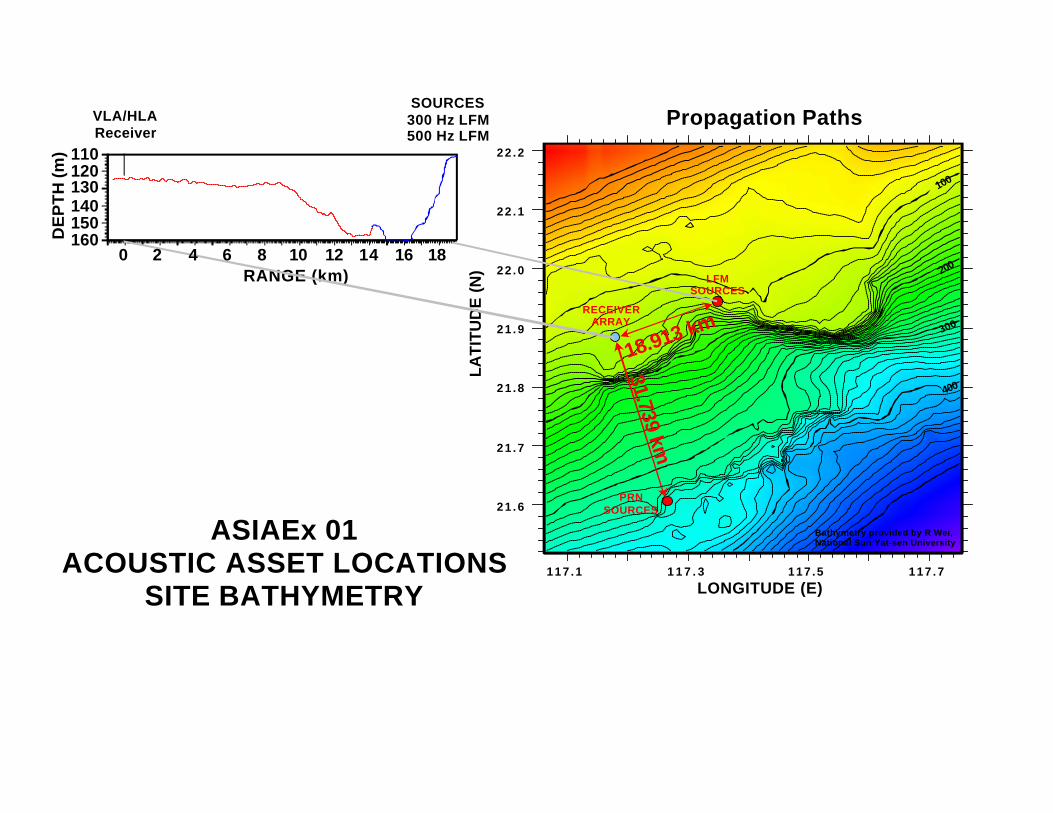
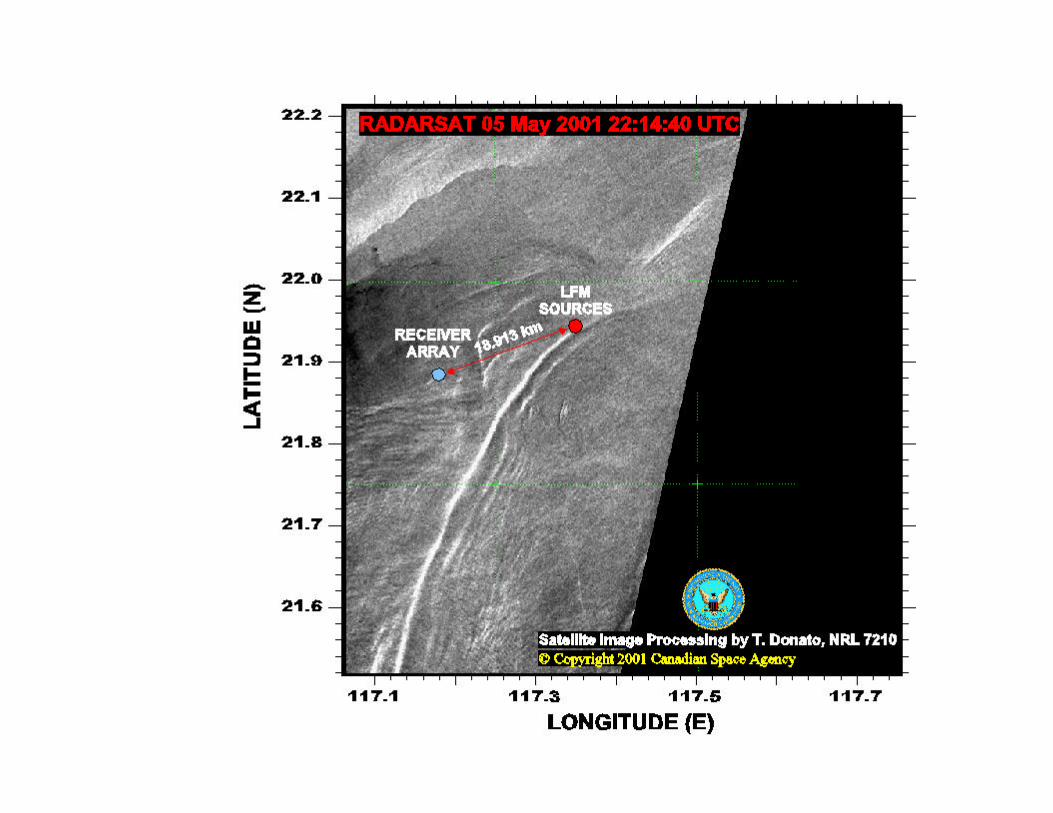
RECEIVERARRAY
LFMSOURCES
18.913 km
Bathymetry provided by R Wei, National Sun Yat-sen University
100
200
300
400
LONGITUDE (E)
LA
TIT
UD
E (
N)
31.739 km
PRNSOURCES
0 10RANGE (km)
DE
PT
H (m
) 110120130140150160
VLA/HLAReceiver
SOURCES300 Hz LFM500 Hz LFM
ASIAEx 01ACOUSTIC ASSET LOCATIONS
SITE BATHYMETRY
2 4 6 8 12 14 16 18
Propagation Paths
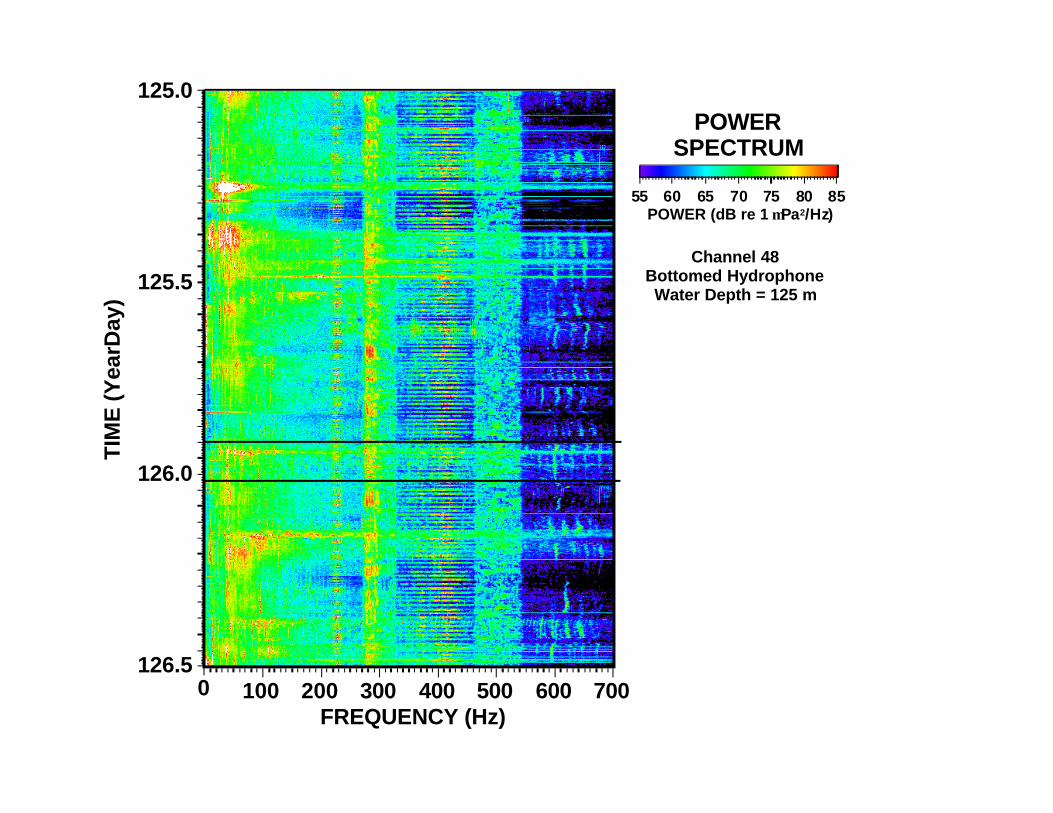
100 200 300 400 500 600 700
125.0
125.5
126.0
126.5
FREQUENCY (Hz)
TIM
E (Y
earD
ay)
0
55 60 65 70 75 80 85POWER (dB re 1 µPa2/Hz)
POWERSPECTRUM
Channel 48Bottomed HydrophoneWater Depth = 125 m
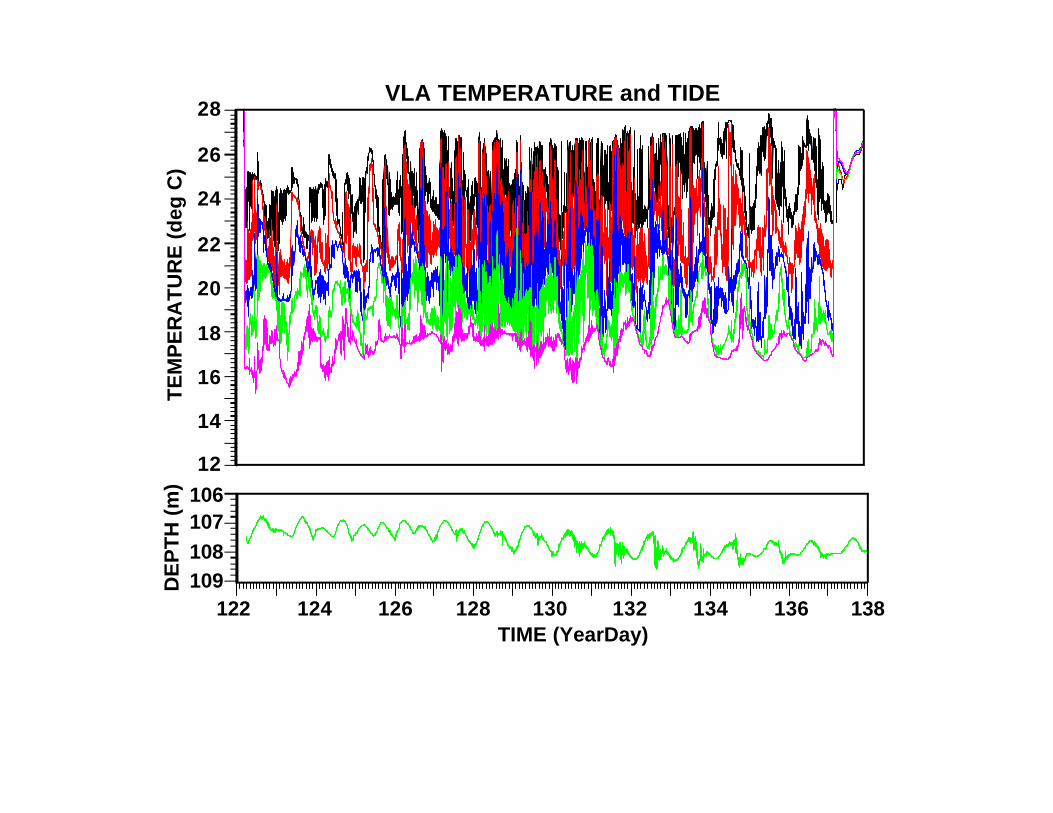
12
14
16
18
20
22
24
26
28
TE
MP
ER
AT
UR
E (
deg
C)
106107108109D
EP
TH
(m
)
122 124 126 128 130 132 134 136 138TIME (YearDay)
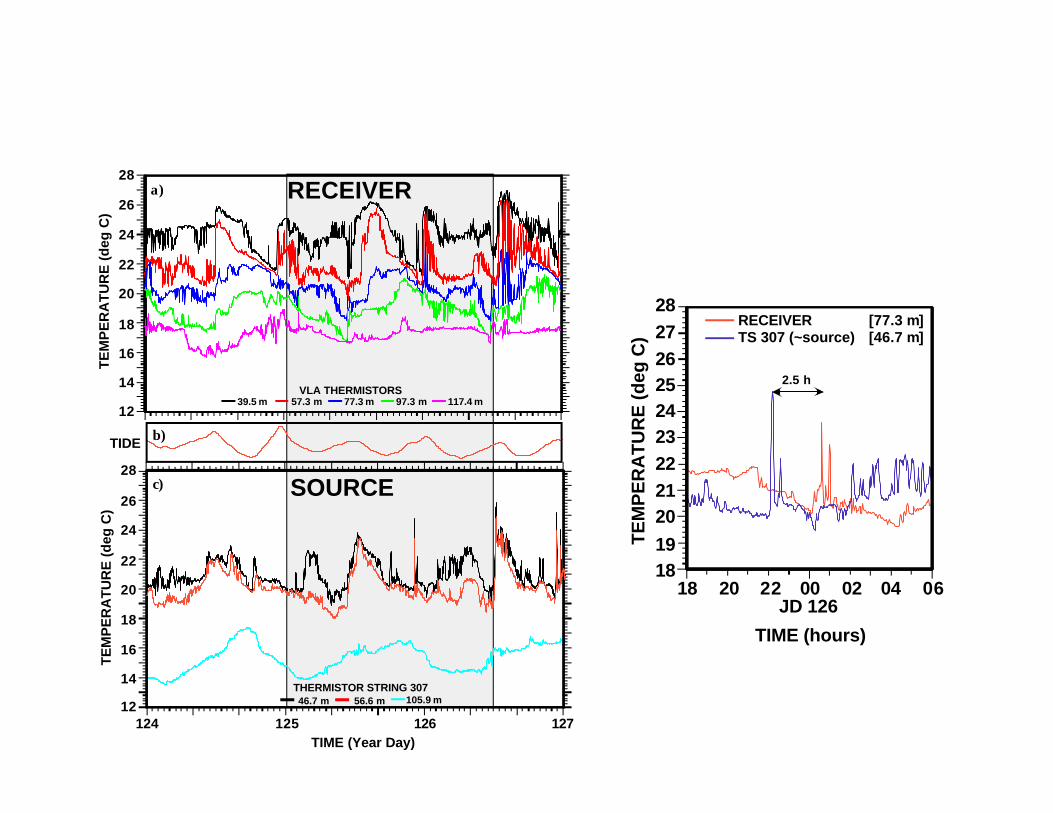
VLA TEMPERATURE and TIDE
Lag Time
Am
plit
ud
e
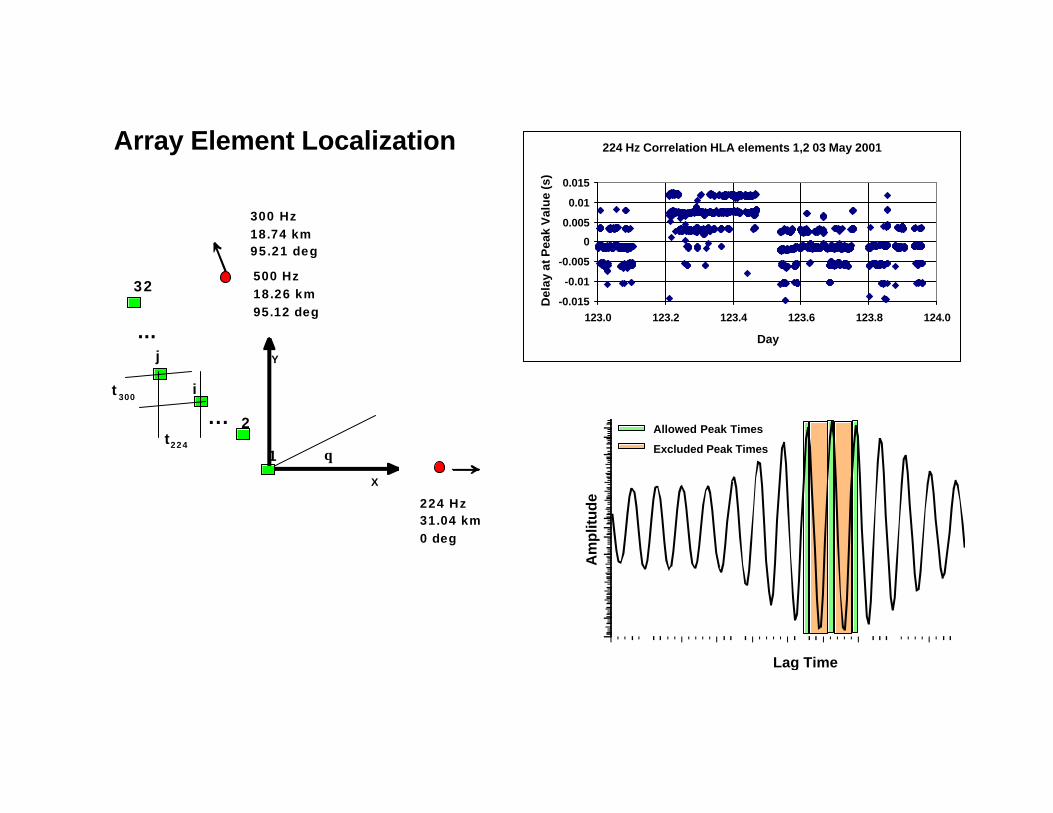
Allowed Peak Times
Excluded Peak Times
224 Hz Correlation HLA elements 1,2 03 May 2001
-0.015
-0.01
-0.005
0
0.005
0.01
0.015
123.0 123.2 123.4 123.6 123.8 124.0
Day
Del
ay a
t Pea
k V
alu
e (s
)
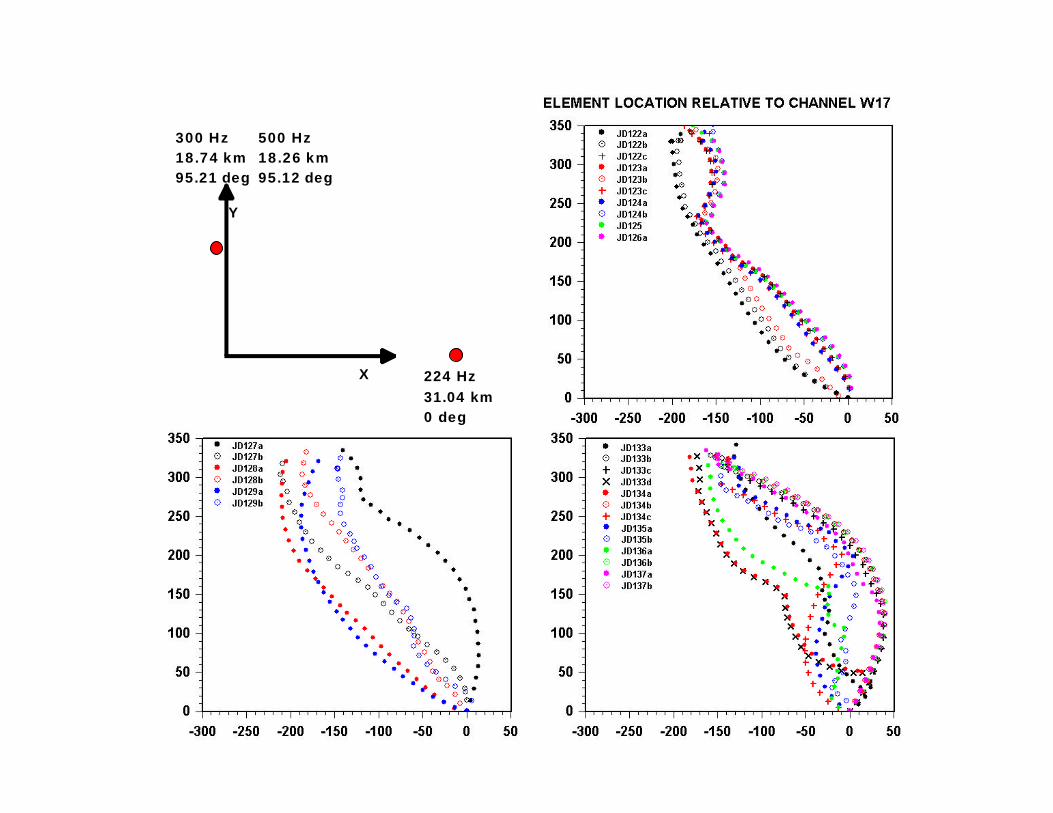
224 Hz 31.04 km0 deg
300 Hz 18.74 km95.21 deg
500 Hz 18.26 km95.12 deg
X
Y
θ
i
j
t224
t300
32
2
1
...
...
Array Element Localization
90o
0o180o
270o
WHOI/NPSSOURCES
NRL/NPSSOURCES
(95o)
N
Y (
m)
X (m)
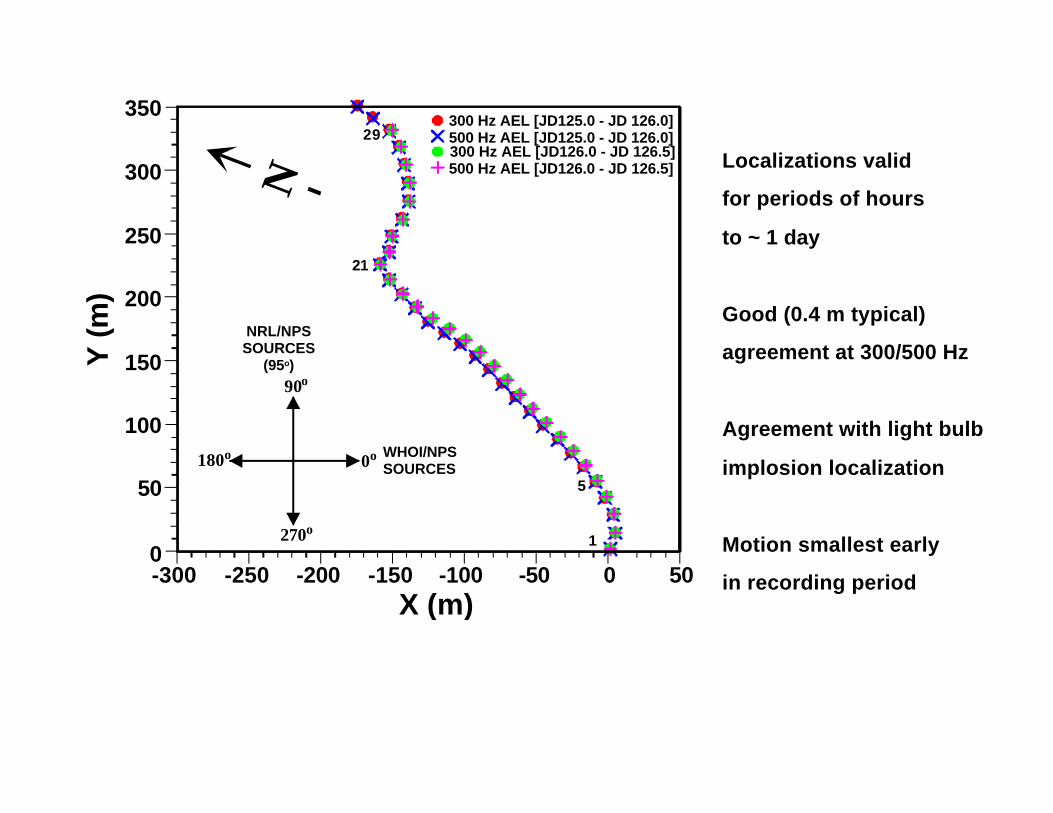
300 Hz AEL [JD125.0 - JD 126.0]500 Hz AEL [JD125.0 - JD 126.0]300 Hz AEL [JD126.0 - JD 126.5]500 Hz AEL [JD126.0 - JD 126.5]
-300 -250 -200 -150 -100 -50 0 50
50
0
150
250
350
100
200
300
29
21
1
5
Localizations valid
for periods of hours
to ~ 1 day
Good (0.4 m typical)
agreement at 300/500 Hz
Agreement with light bulb
implosion localization
Motion smallest early
in recording period
X
Y
224 Hz 31.04 km0 deg
300 Hz 18.74 km95.21 deg
500 Hz 18.26 km95.12 deg
Numerical Testing
Nearfield corrections not required
ASG and resolution can be calculated usingplane wave field
Bearing bias due to phase speed mismatchCan use plane wave field calculation
Planar shape removes grating lobeambiguity
125.000
125.167
125.333
125.500
125.667
125.833
126.000
TIM
E (Y
earD
ay)
0 60 120 180 240 300 360
125.000
125.167
125.333
125.500
125.667
125.833
126.000
BEARING (deg)
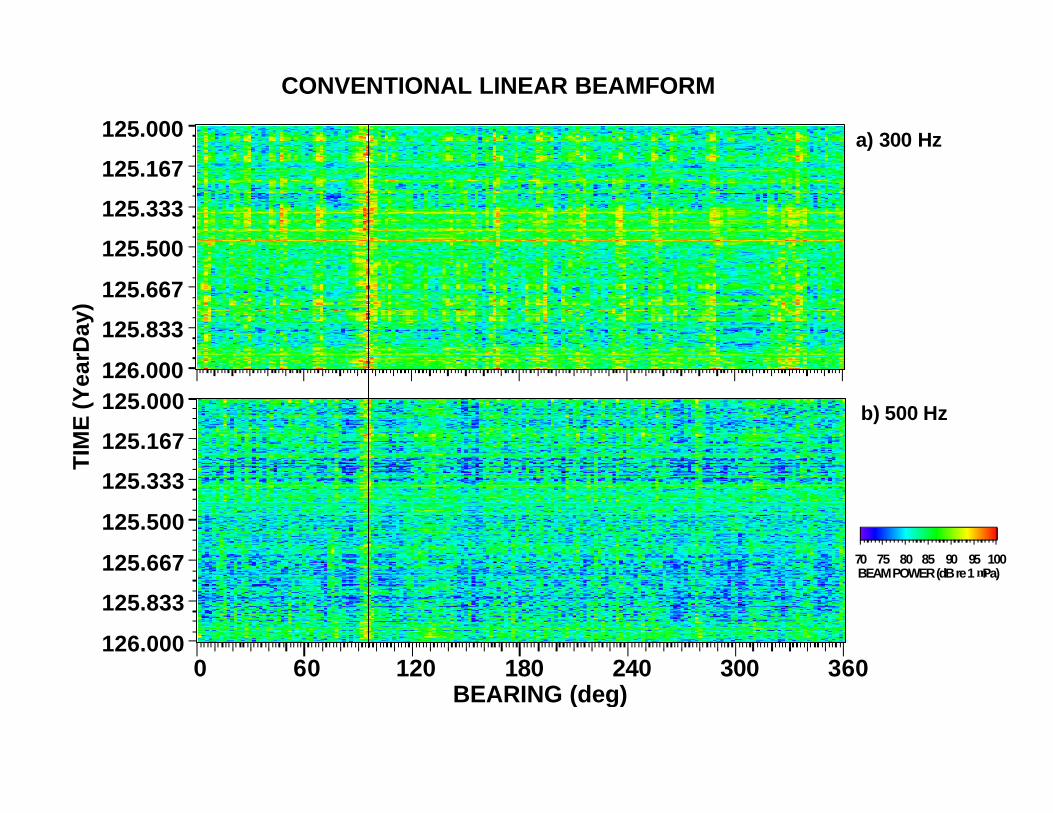
70 75 80 85 90 95 100BEAM POWER (dB re 1 µPa)
a) 300 Hz
b) 500 Hz
CONVENTIONAL LINEAR BEAMFORM
RECEIVER
SOURCE
39.5 m 57.3 m 77.3 m 97.3 m 117.4 mVLA THERMISTORS
12
14
16
18
20
22
24
26
28
TE
MP
ER
AT
UR
E (
deg
C)
124 125 126 12712
14
16
18
20
22
24
26
28
TIME (Year Day)
TE
MP
ER
AT
UR
E (
deg
C)
46.7 m 56.6 mTHERMISTOR STRING 307
105.9 m
a)
c)
TIDE b)
TIME (hours)
18 20 22 00 02 04 06
RECEIVER [77.3 m]TS 307 (~source) [46.7 m]
1819
202122232425262728
TE
MP
ER
AT
UR
E (d
eg C
)
JD 126
2.5 h
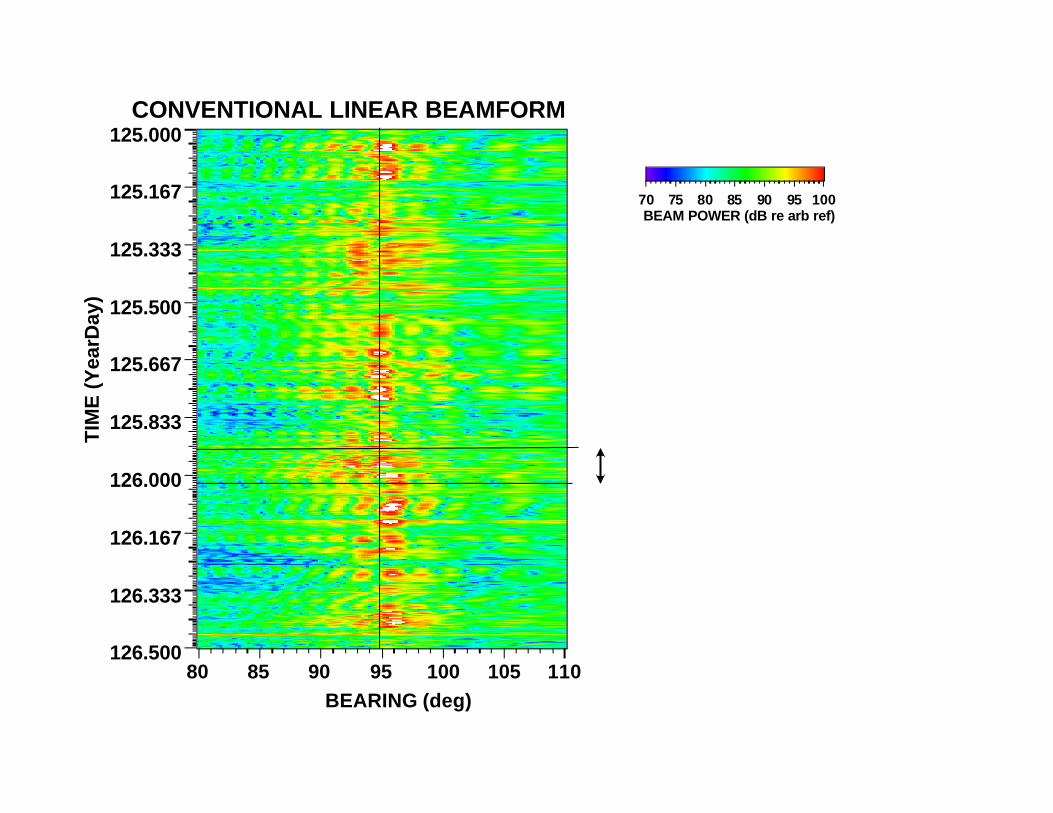
70 75 80 85 90 95 100BEAM POWER (dB re arb ref)
80 85 90 95 100 105 110
125.000
125.167
125.333
125.500
125.667
125.833
126.000
126.167
126.333
126.500
BEARING (deg)
TIM
E (
Yea
rDay
)CONVENTIONAL LINEAR BEAMFORM
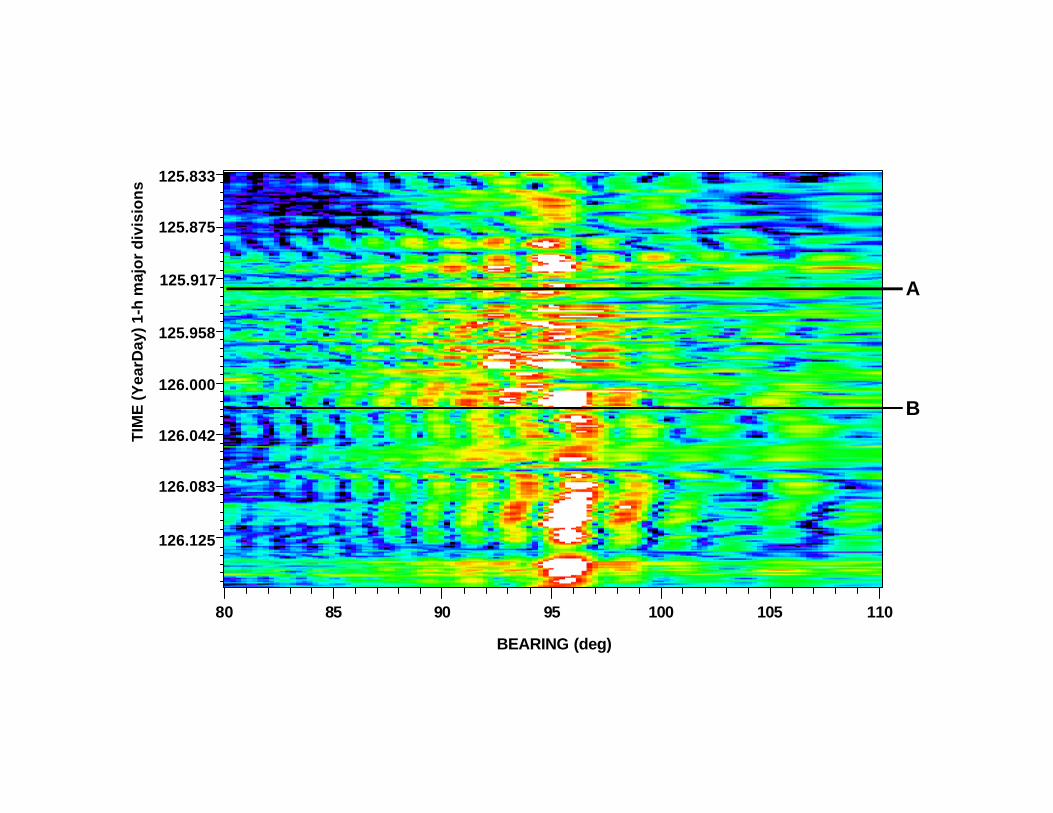
80 85 90 95 100 105 110
125.833
125.875
125.917
125.958
126.000
126.042
126.083
126.125
BEARING (deg)
TIM
E (Y
earD
ay) 1
-h m
ajo
r d
ivis
ion
s
A
B
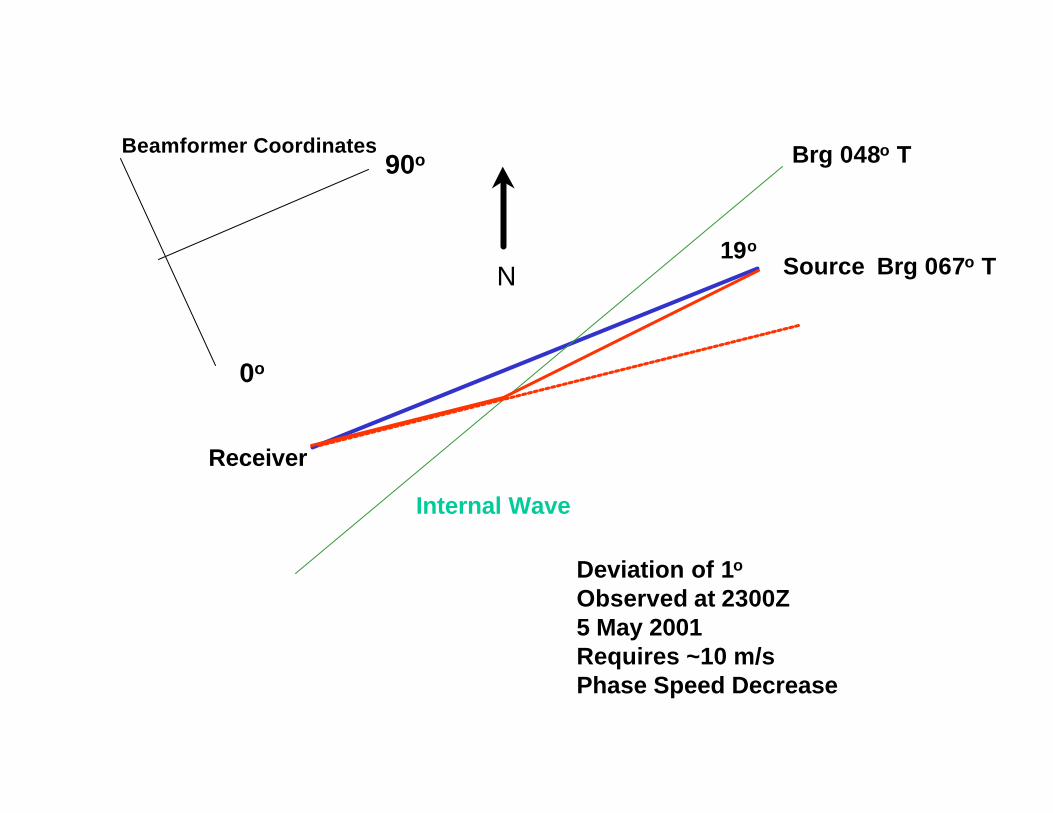
Brg 067o T
Brg 048o T
19o
Receiver
Source
Internal Wave
N
Deviation of 1o
Observed at 2300Z5 May 2001Requires ~10 m/sPhase Speed Decrease
0o
90oBeamformer Coordinates
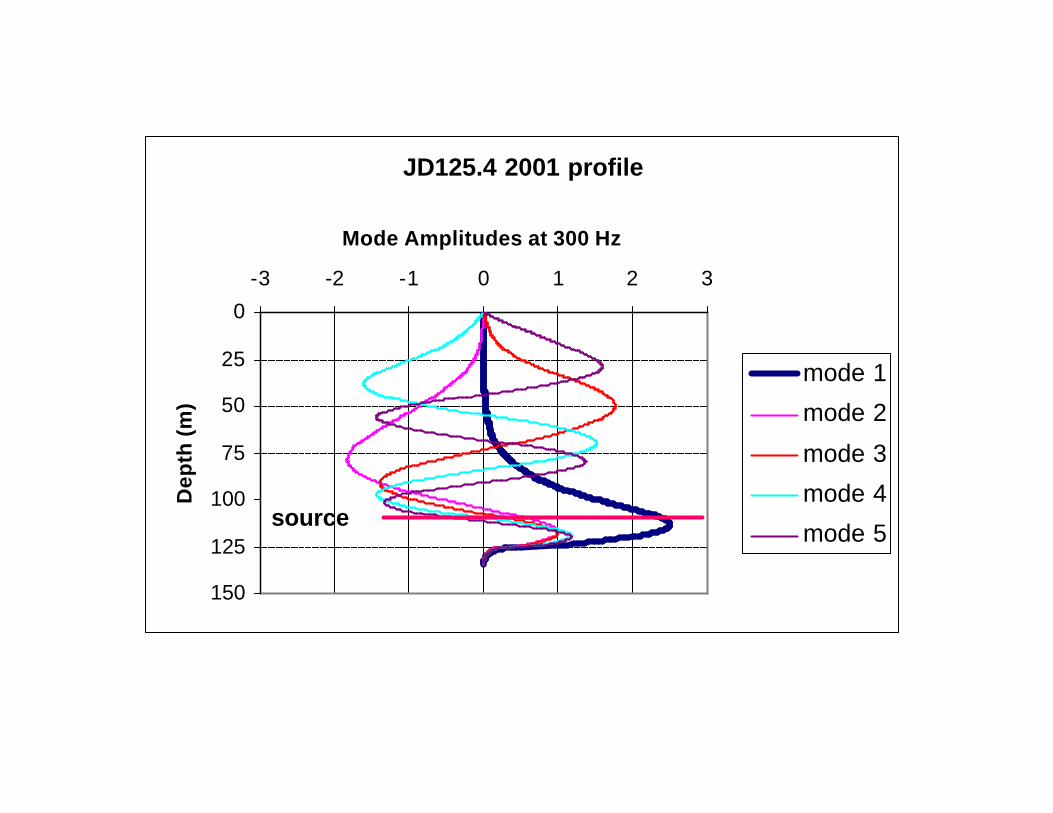
JD125.4 2001 profile
0
25
50
75
100
125
150
-3 -2 -1 0 1 2 3
Mode Amplitudes at 300 Hz
Dep
th (
m)
mode 1
mode 2
mode 3
mode 4
mode 5source
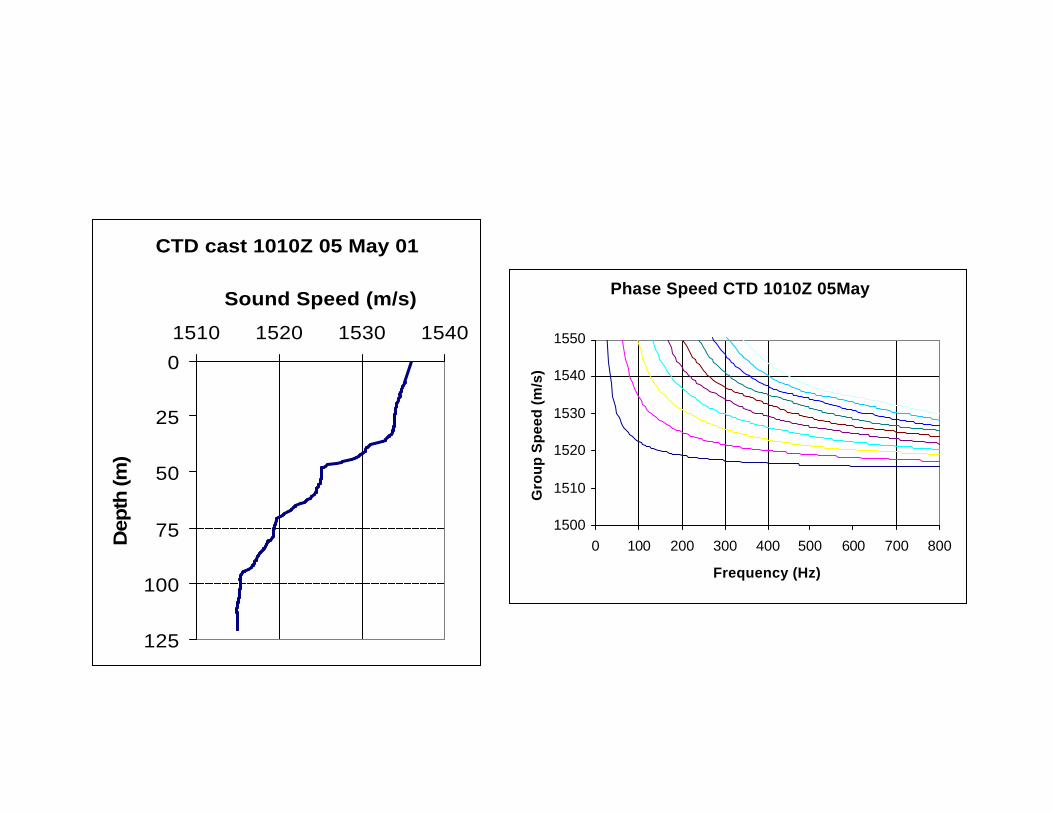
Phase Speed CTD 1010Z 05May
1500
1510
1520
1530
1540
1550
0 100 200 300 400 500 600 700 800
Frequency (Hz)
Gro
up
Sp
eed
(m
/s)
CTD cast 1010Z 05 May 01
0
25
50
75
100
125
1510 1520 1530 1540
Sound Speed (m/s)
Dep
th (m
)
Preliminary Interpretation
Most of energy in NB beam broadening can beattributed to biases associated with multimode(multiple phase-speed) propagation and non-broadside array
Some data may indicate refraction during coupling– work ongoing
Issues complicating observations would disappearat array broadside

X
Y
224 Hz 31.04 km0 deg
300 Hz 18.74 km95.21 deg
500 Hz 18.26 km95.12 deg
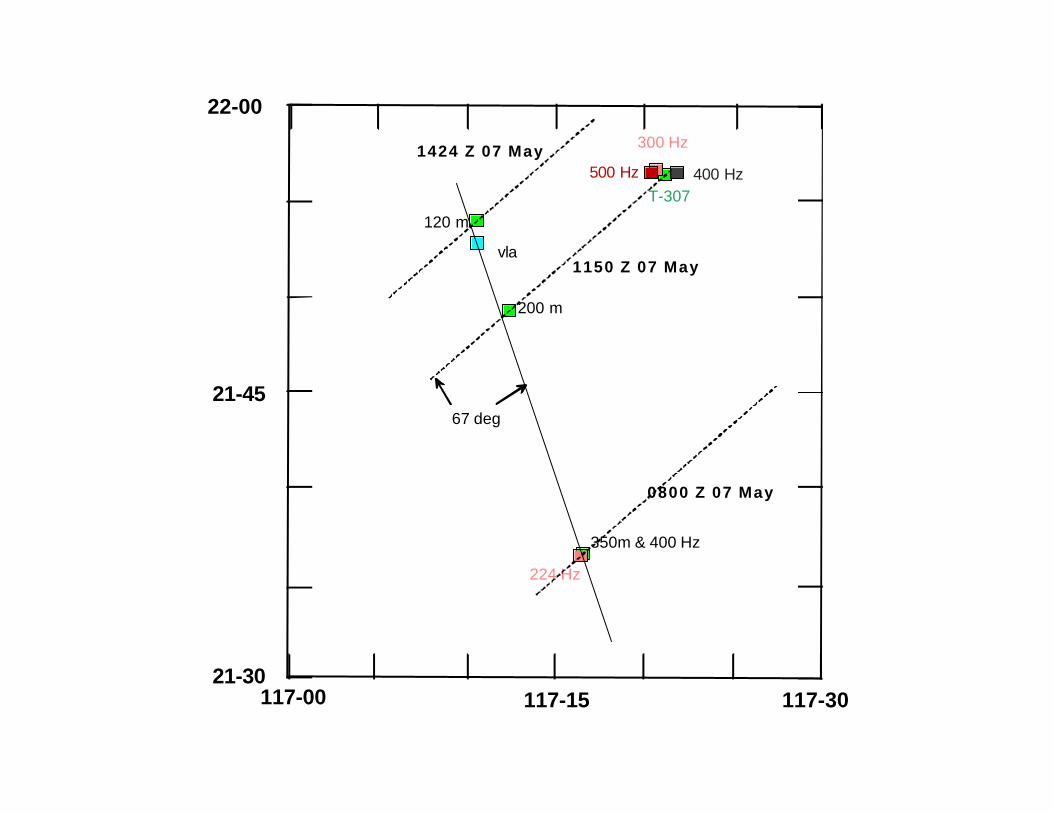
117-00 117-15 117-30
22-00
21-45
21-30
120 m
T-307
200 m
350m & 400 Hz
224 Hz
300 Hz
500 Hz 400 Hz
vla
0800 Z 07 May
1150 Z 07 May
67 deg
1424 Z 07 May
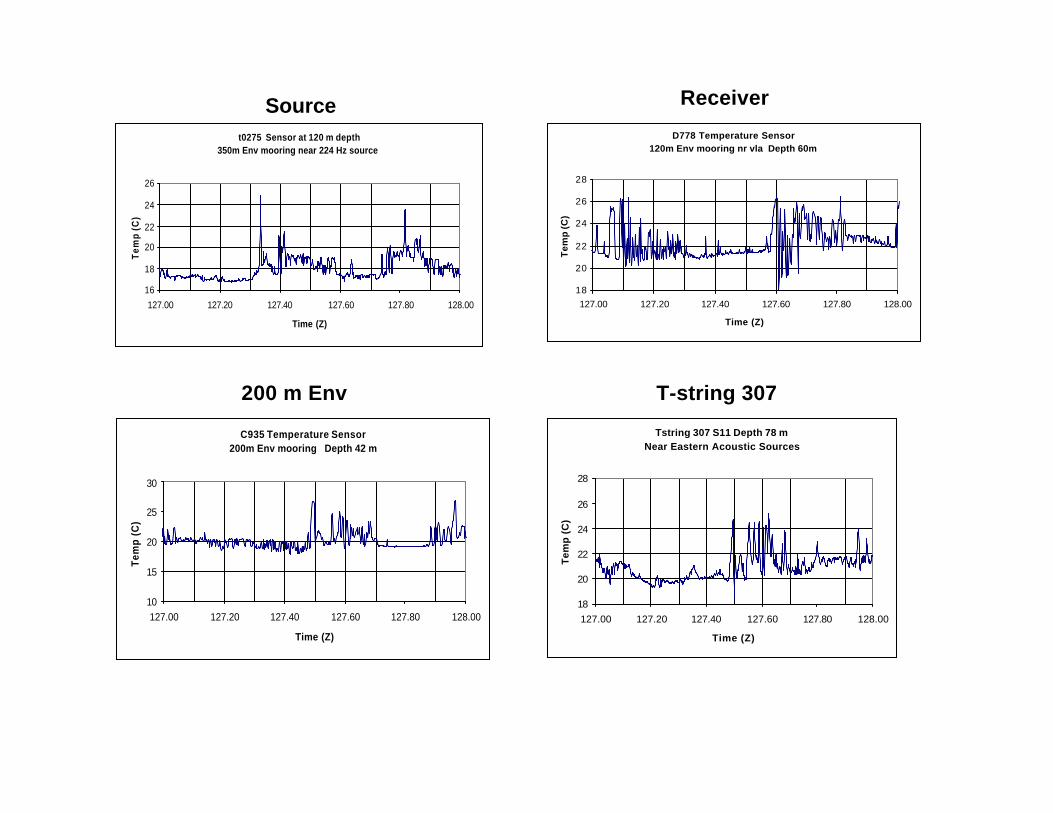
D778 Temperature Sensor120m Env mooring nr vla Depth 60m
18
20
22
24
26
28
127.00 127.20 127.40 127.60 127.80 128.00
Time (Z)
Tem
p (C
)
t0275 Sensor at 120 m depth350m Env mooring near 224 Hz source
16
18
20
22
24
26
127.00 127.20 127.40 127.60 127.80 128.00
Time (Z)
Tem
p (C
)
C935 Temperature Sensor200m Env mooring Depth 42 m
10
15
20
25
30
127.00 127.20 127.40 127.60 127.80 128.00
Time (Z)
Tem
p (C
)
Tstring 307 S11 Depth 78 mNear Eastern Acoustic Sources
18
20
22
24
26
28
127.00 127.20 127.40 127.60 127.80 128.00
Time (Z)
Tem
p (
C)
Source Receiver
200 m Env T-string 307
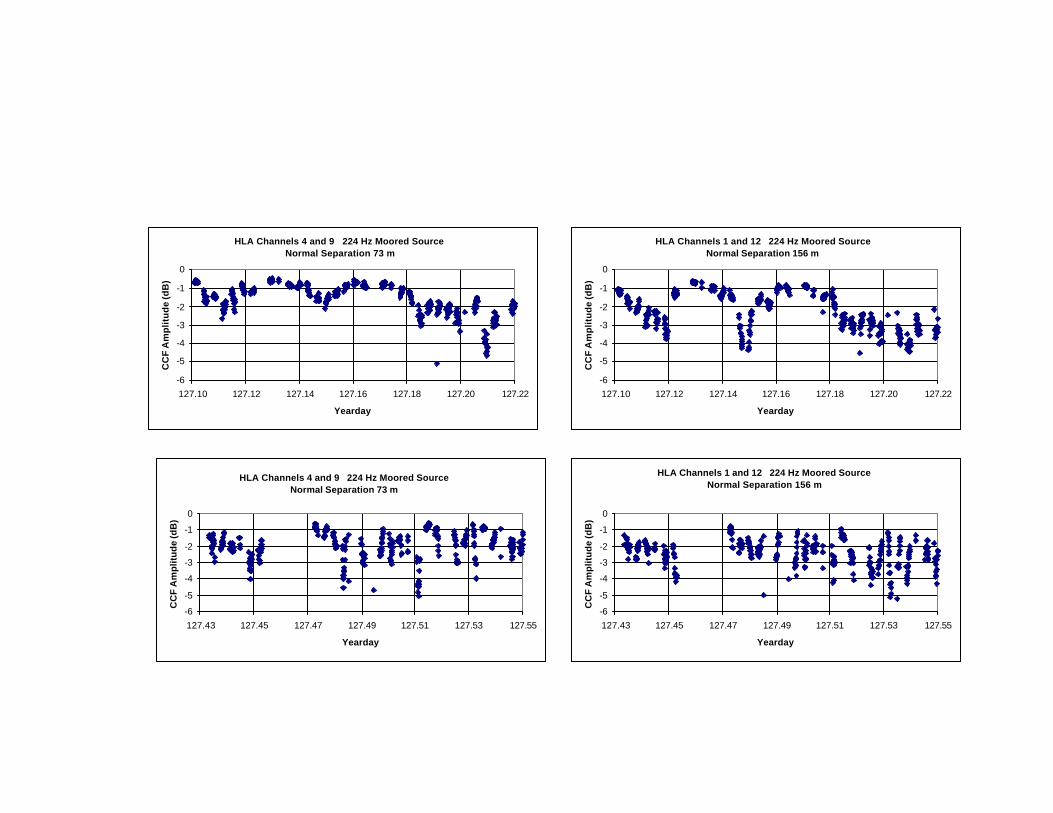
HLA Channels 1 and 12 224 Hz Moored SourceNormal Separation 156 m
-6
-5
-4
-3
-2
-1
0
127.10 127.12 127.14 127.16 127.18 127.20 127.22
Yearday
CC
F A
mp
litu
de
(dB
)
HLA Channels 1 and 12 224 Hz Moored SourceNormal Separation 156 m
-6
-5
-4
-3
-2
-1
0
127.43 127.45 127.47 127.49 127.51 127.53 127.55
Yearday
CC
F A
mp
litu
de
(dB
)
HLA Channels 4 and 9 224 Hz Moored SourceNormal Separation 73 m
-6
-5
-4
-3
-2
-1
0
127.10 127.12 127.14 127.16 127.18 127.20 127.22
Yearday
CC
F A
mp
litu
de
(dB
)
HLA Channels 4 and 9 224 Hz Moored SourceNormal Separation 73 m
-6
-5
-4
-3
-2
-1
0
127.43 127.45 127.47 127.49 127.51 127.53 127.55
Yearday
CC
F A
mp
litu
de
(dB
)
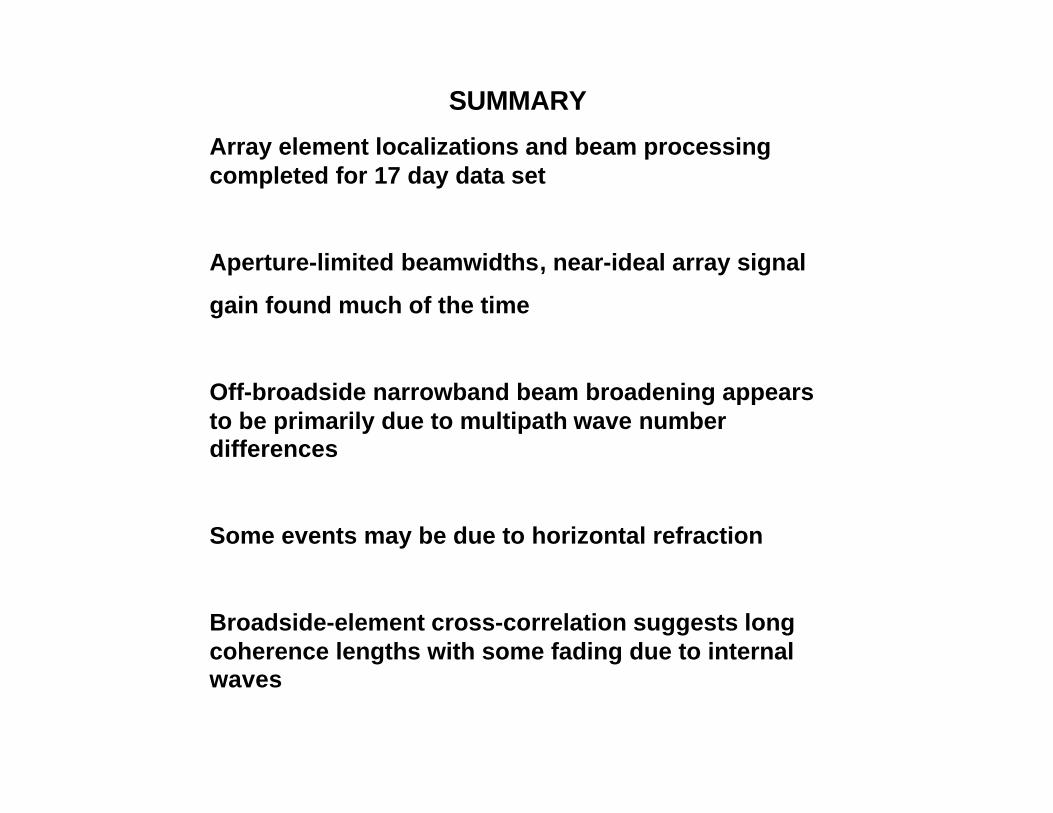
SUMMARY
Array element localizations and beam processingcompleted for 17 day data set
Aperture-limited beamwidths, near-ideal array signal
gain found much of the time
Off-broadside narrowband beam broadening appearsto be primarily due to multipath wave numberdifferences
Some events may be due to horizontal refraction
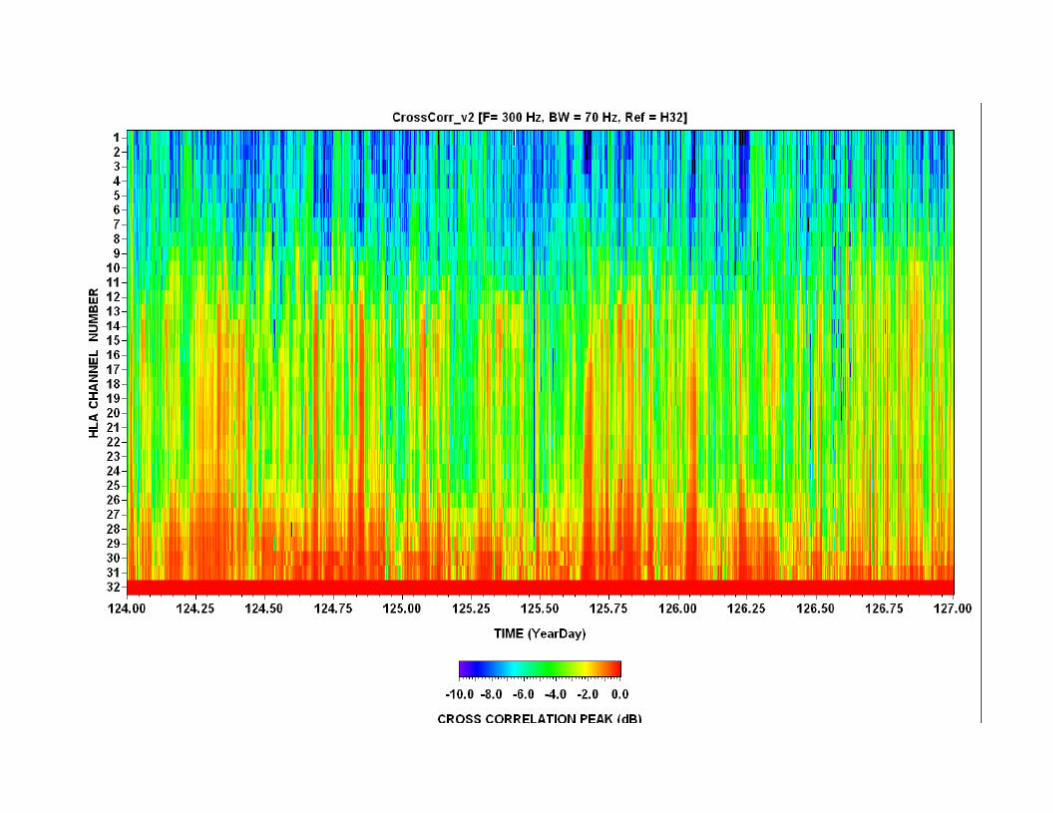
Broadside-element cross-correlation suggests longcoherence lengths with some fading due to internalwaves
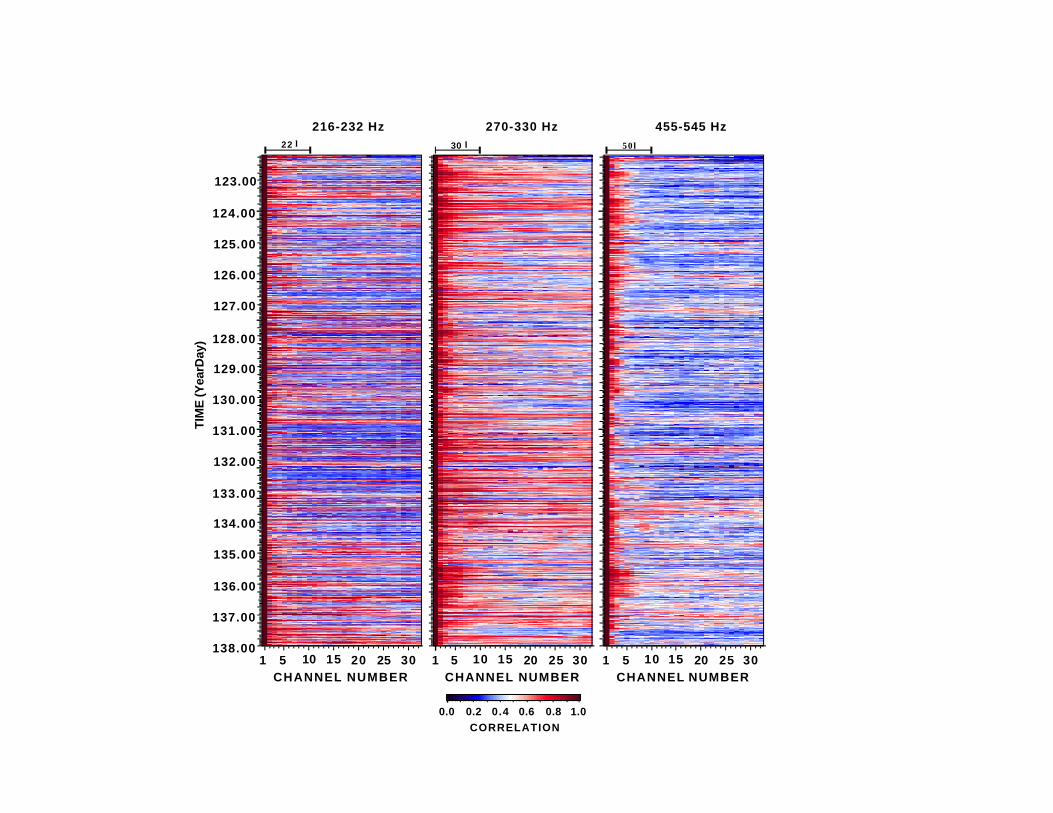
1 5 10 15 20 25 30
124.00
125.00
126.00
127.00
128.00
129.00
130.00
131.00
132.00
133.00
134.00
135.00
136.00
137.00
138.00
CHANNEL NUMBER
TIM
E (Y
earD
ay)
0.0 0.2 0.4 0.6 0.8 1.0CORRELATION
123.00
216-232 Hz 270-330 Hz
1 5 10 15 20 25 30CHANNEL NUMBER
455-545 Hz
1 5 10 15 20 25 30CHANNEL NUMBER
22 λ 30 λ 50λ
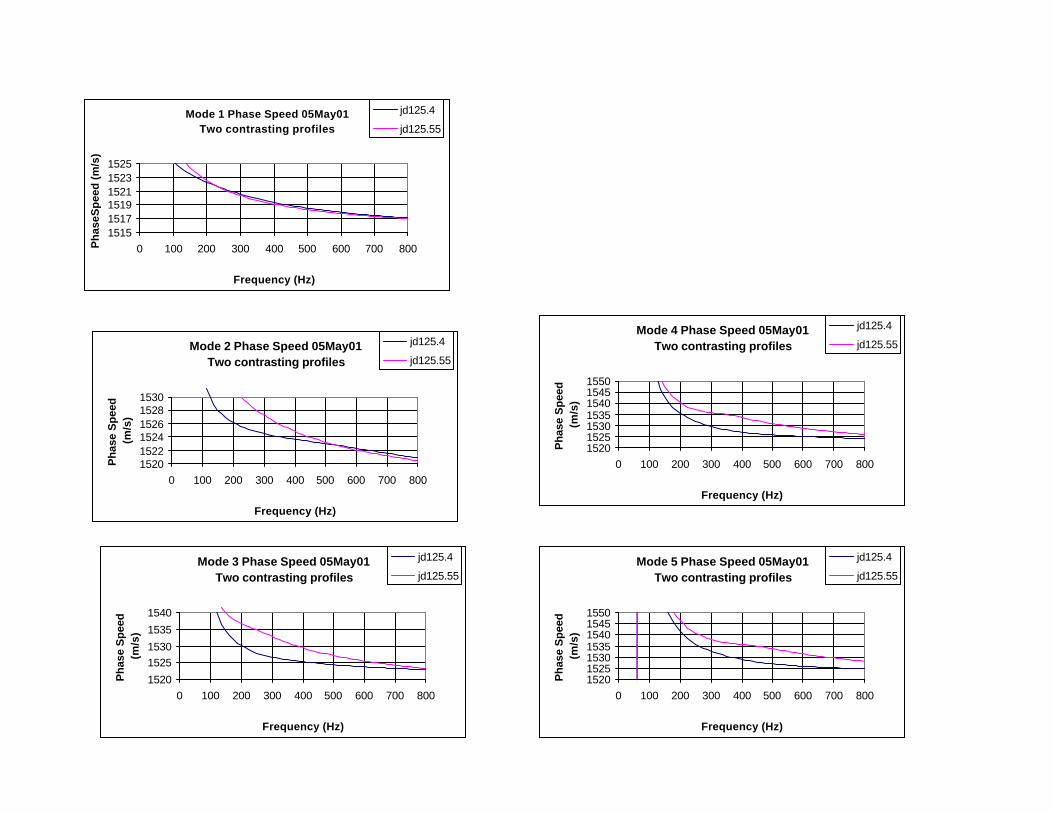
Mode 1 Phase Speed 05May01Two contrasting profiles
151515171519152115231525
0 100 200 300 400 500 600 700 800
Frequency (Hz)
Ph
aseS
pee
d (
m/s
)jd125.4
jd125.55
Mode 2 Phase Speed 05May01Two contrasting profiles
152015221524152615281530
0 100 200 300 400 500 600 700 800
Frequency (Hz)
Ph
ase
Sp
eed
(m
/s)
jd125.4
jd125.55
Mode 3 Phase Speed 05May01Two contrasting profiles
1520
15251530
1535
1540
0 100 200 300 400 500 600 700 800
Frequency (Hz)
Ph
ase
Sp
eed
(m
/s)
jd125.4
jd125.55
Mode 4 Phase Speed 05May01Two contrasting profiles
1520152515301535154015451550
0 100 200 300 400 500 600 700 800
Frequency (Hz)
Ph
ase
Sp
eed
(m
/s)
jd125.4
jd125.55
Mode 5 Phase Speed 05May01Two contrasting profiles
1520152515301535154015451550
0 100 200 300 400 500 600 700 800
Frequency (Hz)
Ph
ase
Sp
eed
(m
/s)
jd125.4
jd125.55


![Geometrie - GVI.cz...vedenou vrcholem C. [v = 13,51 cm; t c = 13,58 cm] 31 GONIOMETRICKÉ FUNKCE V PRAVOÚHLÉM TROJÚHELNÍKU 32 c b c a E D sin sin c a c b E D cos cos 33 a b tg](https://static.fdocument.org/doc/165x107/609923c08b96b278a24f9cfb/geometrie-gvicz-vedenou-vrcholem-c-v-1351-cm-t-c-1358-cm-31-goniometrick.jpg)