In°uence of the nonlinearity and dipole strength on …w3.ualg.pt/~lhansson/jcp05.pdfIn uence of...
22
Influence of the nonlinearity and dipole strength on the Amide I band of protein α-helices Leonor Cruzeiro CCMAR and FCT, University of Algarve, 8000 Faro, Portugal * (Dated: October 21, 2005) Abstract Vibrational energy storage and propagation is simulated in a fully atomic model of an α-helix, by combining the AMBER force field for proteins with an extended version of the Davydov/Scott model for Amide I vibrational transfer (Scott, Phys. Rep. 217, 1 (1992)). Dipole-dipole interactions between transition dipole moments of Amide I and its on-site energies are calculated from the corresponding three dimensional atomic positions. The comparison of the theoretically calculated absorption line-shapes with the experimentally measured ones leads to a putative value of the nonlinearity parameter of -30 pN. PACS numbers: 87.14.Ee; 63.50.+x Keywords: Davydov/Scott model;Amide I band;protein function;VES hypothesis 1
Transcript of In°uence of the nonlinearity and dipole strength on …w3.ualg.pt/~lhansson/jcp05.pdfIn uence of...
Influence of the nonlinearity and dipole strength on the
Amide I band of protein α-helices
Leonor Cruzeiro
CCMAR and FCT, University of Algarve,
8000 Faro, Portugal∗
(Dated: October 21, 2005)
Abstract
Vibrational energy storage and propagation is simulated in a fully atomic model of an α-helix,
by combining the AMBER force field for proteins with an extended version of the Davydov/Scott
model for Amide I vibrational transfer (Scott, Phys. Rep. 217, 1 (1992)). Dipole-dipole interactions
between transition dipole moments of Amide I and its on-site energies are calculated from the
corresponding three dimensional atomic positions. The comparison of the theoretically calculated
absorption line-shapes with the experimentally measured ones leads to a putative value of the
nonlinearity parameter of −30 pN.
PACS numbers: 87.14.Ee; 63.50.+x
Keywords: Davydov/Scott model;Amide I band;protein function;VES hypothesis
1
I. INTRODUCTION
The possibility that vibrational excited states (VES) have a role in protein function,
something that will be designated here as the VES hypothesis, was first proposed in
1973, by McClare, in the context of a “crisis in bioenergetics”1. The VES hypothesis was
taken up by Davydov2 who was interested in the conformational changes responsible for
muscle contraction, where the trigger, and the energy donating reaction, is the hydrolysis
of adenosinetriphosphate (ATP). Davydov’s assumption is that the first event after the
hydrolysis of ATP is the storing of the energy released in the chemical reaction in the form
of a vibrational mode of the peptide group, known as Amide I, which consists essentially
of the stretching of the C=O bond and whose energy varies with the secondary structure
of the protein3. In the Davydov/Scott model4 the interaction of the Amide I mode with
the vibrations of the associated hydrogen bonds leads to a localization of the Amide I
excitation in a few peptide groups, a mechanism known as self-trapping, that leads to a
state designated in the literature as the Davydov soliton. This is the state that arises at
low temperatures. On the other hand, computer simulations showed that, at biological
temperatures, the Davydov soliton is not stable and that Amide I excitations are localized,
not because of self-trapping, but because of static and dynamic irregularities5. The overall
conclusion from these studies is that the Davydov/Scott model can explain how the energy
released at the active site, by a chemical reaction, or by the binding of a ligand, can
propagate, without dissipation, to other regions of the protein, where it is used for work,
for instance, to produce a conformational change.
The first experimental evidence for a Davydov-like state was obtained in the crystal
of Acetanilide (ACN)6 which includes hydrogen bonded chains identical to those that
stabilize the secondary structure of proteins and thus constitutes a possible model system
in which to test the Davydov/Scott model. Careri and co-workers found an anomalous
line, 15 cm−1 lower than the Amide I excitation in that crystal, which was interpreted as
a self-trapped, soliton-like state4,6. This interpretation has been confirmed by Hamm and
co-workers who have applied nonlinear spectroscopic methods to the study of vibrational
excited states in the organic crystals of ACN7–10 and N-methylacetamide (NMA)9,10. Their
measurements show that both the Amide I and the NH stretch excitations in these crystals
2
possess self-trapped states, with the NH stretch, whose energy is approximately twice that
of Amide I, being 20 times more stable. Their experimental data8 also confirms the results
obtained in computer simulations5, according to which, at low temperature, vibrational
excitations are self-trapped while, at biological temperatures, they are localized because of
static and dynamical disorder.
Experimental support for the validity, in proteins, of the Davydov/Scott model, has
also been accumulating. Indeed, while an early objection to a biological role of vibrational
excited states in proteins was their short lifetimes, thought to be in the subpicosecond
range1, according to a very recent experimental measurement it takes, on average, 20 ps
for the Amide I excitations to be transferred from myoglobin to water11. Also, Hamm
and co-workers, in a study of a model α-helix, not only find a self-trapped state for the
NH stretch vibration in this system but also show that it can only arise when the helical
structure is intact12, i.e., only when the C=O groups are hydrogen bonded to each other,
as is assumed in the Davydov/Scott model.
While the summary above shows that experimental evidence for the type of interactions
first postulated by Davydov for Amide I excitations in proteins is now widespread, thus
confirming the theoretical validity of the VES hypothesis, quantitative predictions require
a more precise knowledge of the parameters in the Davydov/Scott Hamiltonian13–15. Two
important ones are the transition dipole moment associated with the Amide I vibration16
and the nonlinear parameter χ (see the next section). The latter has been the object of
several evaluations, some theoretical13–15 and some experimental6,17. The values obtained
range from −60 pN to +62 pN and the value that has been used in the majority of the
studies is that estimated from experimental measurements, namely, +62 pN6. Here, in-
stead of trying to determine the values of these parameters directly, the influence of the
values of these parameters on the absorption line-shape of the Amide I band will be inves-
tigated. As these line-shapes are known to depend on the secondary structure of proteins3,
a particular structure has been selected, namely, the α-helix. The aim is twofold: on the
one hand, it is hoped that the comparison of theoretically calculated absorption line-shapes
with experimental ones will help in selecting appropriate values for the free parameters in
the Davydov/Scott model, and, on the other hand, it is also hoped that these studies will
3
help in the task of deconvoluting the experimentally measured absorption line-shapes into
their underlying components.
II. THEORY
The general philosophy behind the results presented here is to obtain a representative
equilibrium ensemble of the conformations of the helix at thermal equilibrium, while
assuming that Amide I excitations, either static or propagating in the helix, do not
alter these conformations to any significant extent. This is certainly true at biological
temperatures because the changes in the atomic positions induced by these excitations is
at least ten times smaller than the changes induced by thermal agitation5. This being the
case, vibrational energy transfer within the protein is modelled with a Hamiltonian adapted
from the Davydov/Scott model2,4, as detailed below (Eqs. 1-5).
The starting α-helix used here is a poly-L-alanine peptide with 46 amino acids. In order
to be as close to a protein structure as possible, an initial conformation for this helix was ob-
tained by taking the backbone atoms of amino acids 127-172 of the gamma subunit of the F1
ATPase, as detailed in file 1E7918 of the protein data bank19. The AMBER 6.0 package20,21
was used to replace the native residues of the gamma subunit of F1 ATPase by alanines and
to protonate the helical structure thus obtained, as well as to add 4382 water molecules to
simulate a water solution. Using the AMBER 6.0 force field, the helix plus water system was
first energy minimized and, after a period of slow heating to 27 oC, it was equilibrated, at
that temperature and at constant pressure, in a nanosecond molecular dynamics simulation.
After equilibration, 1939 snapshots of the protein-water system were stored from a further
1939 ps simulation, sampled at 1 ps intervals. The 1939 snapshots thus obtained constitute
the ensemble of structures representative of the equilibrium helical conformations at 27 oC.
Although an explicit water solution was considered in order to have a realistic situation,
here only the conformations of the α-helix itself will be used for the determination of the
Amide I states below. Also, in order to have essentially α-helical contributions, the last 5
amino acids in the two extremities are ignored, since these have the most flexible hydrogen
bonds and can more readily transform to conformations close to random coil. The num-
ber of amide I sites left is thus 35 (since the last backbone carbonyl is cutoff from the amine).
4
Vibrational energy storage and propagation among these 35 amide sites is modelled by
the extended Davydov/Scott Hamiltonian, H:
H = Hex + Hat + Hint (1)
where Hex, the exciton Hamiltonian, describes the storage and transfer of Amide I
excitations between the protein amide sites, Hat, describes the motions of all the atoms
in the α-helix including those that constitute the amide sites and Hint, the interaction
Hamiltonian, describes the interaction of the Amide I excitation in a given C=O group
with the deviation from the equilibrium length of the hydrogen bond connected to it, if
there is one (see below).
The exciton Hamiltonian here is as follows:
Hex =N∑
n=1
(ε + ξn) a†nan +N∑
n<m=1
[Vnm
(a†nam + a†man
)](2)
where a†n(an) are the creation(annihilation) operators for an Amide I excitation at site n
and N is the total number of amide sites where a vibrational excitation can be found. As
explained above, N = 35 in this study. ε is the energy of an isolated Amide I vibration
in the backbone of the helix and ξn is a random variable with a Gaussian distribution
centred on zero and with a standard deviation of 10 cm−1 that represents the different local
environments in which the Amide I sites can find themselves in. The Amide I energy of an
isolated excitation is usually taken to be 1660 cm−1 in the simulations of the Davydov/Scott
model4,5, but here it is not necessary to specify it as its value does not affect the results
presented in section III.
The first term in (2) includes the operator for the number of excitations in each site, a†nan,
which, in this study, will be at most one. The second term in (2) describes the transfer of
the excitations from a C=O group n to a C=O group m, which is the more probable the
greater the magnitude of the dipole-dipole interaction, Vnm. (2) goes beyond the nearest
neighbor approximation used in most applications5 in so far as it considers the dipole-dipole
interactions between all N amide sites, and, in that, it resembles the calculations with the
discrete self-trapping equation for ACN22 and for a globular protein23. As it can be found
5
in any textbook, this dipole-dipole interaction has the form:
Vnm =1
4 π ε0 k
|~µn| |~µm|R3
nm
[~en · ~em − 3 (~u · ~en) (~u · ~em)] (3)
where ε0 = 8.8542× 10⁻¹² F/m is the electric permittivity of the vacuum, k is the dielectric
constant of the medium, ~µn is the transition dipole moment of site n, ~u is the unit vector
directed from the center of one dipole to center of the other, ~en is the unit vector that
defines the direction of the transition dipole moment in site n and Rnm is the distance
between the centers of dipoles in sites n and m. In the following, the positions and
orientations of the transition dipole moments for the Amide I excitations are calculated
from the positions of the carbon and oxygen in the carbonyl groups and the position of the
nitrogen in the same peptide group. Nevskaya and Chirgadze24 estimate that, in α-helices,
the transition dipole moment of the Amide I excitation makes an angle of 17o away from
the CO bond and in the direction of the CN bond, a value that is also within the range
of 15o to 25o determined by Krimm and Bandekar3 and that its intensity is 0.3 D24. But
the dipole-dipole interaction also depends on the dielectric constant, k, of the medium
and here the influence that different values of k, and thus, that different values of the
dipole-dipole intensity, Vnm, can have on the absorption spectrum of the helix, is investigated.
Another main difference between the Davydov/Scott Hamiltonian and that used here is in
the second term, Hat, which, instead of representing a set of coupled harmonic oscillators4,5
is in fact the classical energy functional that has been applied to study protein and DNA
structure and dynamics20,21:
Hat = H({~Rn}
)=
∑
bonds
Kr(r − req)2 +
∑
angles
Kθ(θ − θeq)2 + (4)
+∑
dihedrals
Vn
2[1 + cos(nφ− γ)] +
∑i<j
[Aij
R12ij
− Bij
R6ij
+qiqj
εRij
]
where {~Rn}, represents the set of positions of all atoms in the helix-water system described
above. As explained in20,21 this energy functional includes harmonic potentials for bond
stretching and angle bending (first two terms), a truncated Fourier series to represent
torsions (third term), a Lennard-Jones potential to represent hydrogen-bonds and other
nonbonded interactions and, most importantly, electrostatic interactions between atoms
that are more than two covalent bonds away from each other (fourth term). Its parameters
6
have been fitted to a variety of experimental data and it is still used in practical applications
by the pharmaceutical and biotechnology industries. It is this potential that is used to
generate the 1939 snapshots of the helix-water system.
Finally, the interaction Hamiltonian, Hint, describes the change of the Amide I energy
due to the change in the length of the hydrogen bond connected with it:
Hint = χ
N∑n=1
[(|~RO
n − ~RNm| − deq
)a†nan
]cos(θnm) (5)
where(|~RO
n − ~RNm| − deq
)is the deviation, from its equilibrium value, deq, of the hydrogen
bond length between the oxygen of the carbonyl group of amino acid n and the nitrogen
of the amine of an amino acid m, that is hydrogen-bonded to it (if such a bond exists),
and θnm is the angle between the C=O bond of the carbonyl and the H-N bond of the
amine. χ is the nonlinearity parameter whose strength is proportional to the change in the
Amide I energy due to fluctuations in the hydrogen bond lengths and whose influence on
the Amide I states will also be investigated here. On the other hand, deq was estimated
from the ensemble of 1939 conformations to be 2.98 A. The factor cos(θnm) represents an
extension from the usual Davydov/Scott interaction Hamiltonian and takes into account
the strong directionality that characterizes hydrogen bonds. For each carbonyl oxygen, n,
there is, at most, one hydrogen bond to an amine nitrogen of another amino acid, m and
when the distance |~ROn − ~RN
m|, between the oxygen and the nitrogen atoms was greater than
4.5 A, the corresponding hydrogen bond was assumed to be broken and the corresponding
term in (5) was zero. It is necessary to specify a threshold because the interaction
Hamiltonian is proportional to deviations from equilibrium lengths and large values, corre-
sponding to effectively non-existent bonds, would contribute large terms to (5) that would
generate artificial peaks in the calculated Amide I absorption spectra presented in section III.
For each conformation of the 36 amino acid helix, that is, for each set{
~Rn
}, we can find
the N = 35 eigenstates in which the Amide I can find itself in by solving the eigenvalue
equation:
H Ψj = Ej Ψj (6)
where j = 1, · · · , 35 and Ej is the energy of the state Ψj. Considering states with only one
7
Amide I excitation we have:
Ψj =N∑
r=1
ϕjr
({~Rn}
)a†r |0 > (7)
where ϕjr is the probability amplitude for an Amide I excitation in the peptide group r for
the eigenstate of energy Ej, something that depends on the conformation of the helix.
We are interested in finding out how the values of the nonlinearity parameter, χ, and of
the dielectric constant, k, affect the states of the Amide I excitation and how they change
an experimentally measureable quantity, namely, the absorption line-shape. Comparison of
calculated absorption spectra with experimental curves can then be used as a guide to select
the appropriate values for those parameters. The absorption spectra are calculated as in
Fidder et al.25:
A(E) =<<
N∑j=1
∆ (E − Ej) µ2j >> (8)
where << · · · >> indicates thermal average, that is, average over the 1939 conformations
and ∆ (E − Ej) = 1/R for |E − Ej| ≤ R/2 and ∆ (E − Ej) = 0 otherwise. In the figures
presented in the next section R ≈ 5 cm−1. µj =∑N
r=1 ϕjr µ, where µ is the absolute value
of the transition dipole moment of Amide I, i.e. µ = |~µn| = 0.3 D and is assumed to be
equal for all peptide groups. For a better characterization of the states, the average localiza-
tion (or inverse participation ratio) L(E) =<<PN
j=1 ∆(E−Ej) (PN
r=1 ϕ4jr)>>
ρ(E), is also calculated,
ρ(E) =<<∑N
j=1 ∆ (E − Ej) >> being the density of states. It should be pointed out that
the average in (8) is over an equilibrium ensemble in which any phase coherence between the
states involved is disregarded. The results displayed in figures (4-6) may thus not be valid
for measurements performed in times that are shorter than the dephasing time of Amide I
states.
III. RESULTS
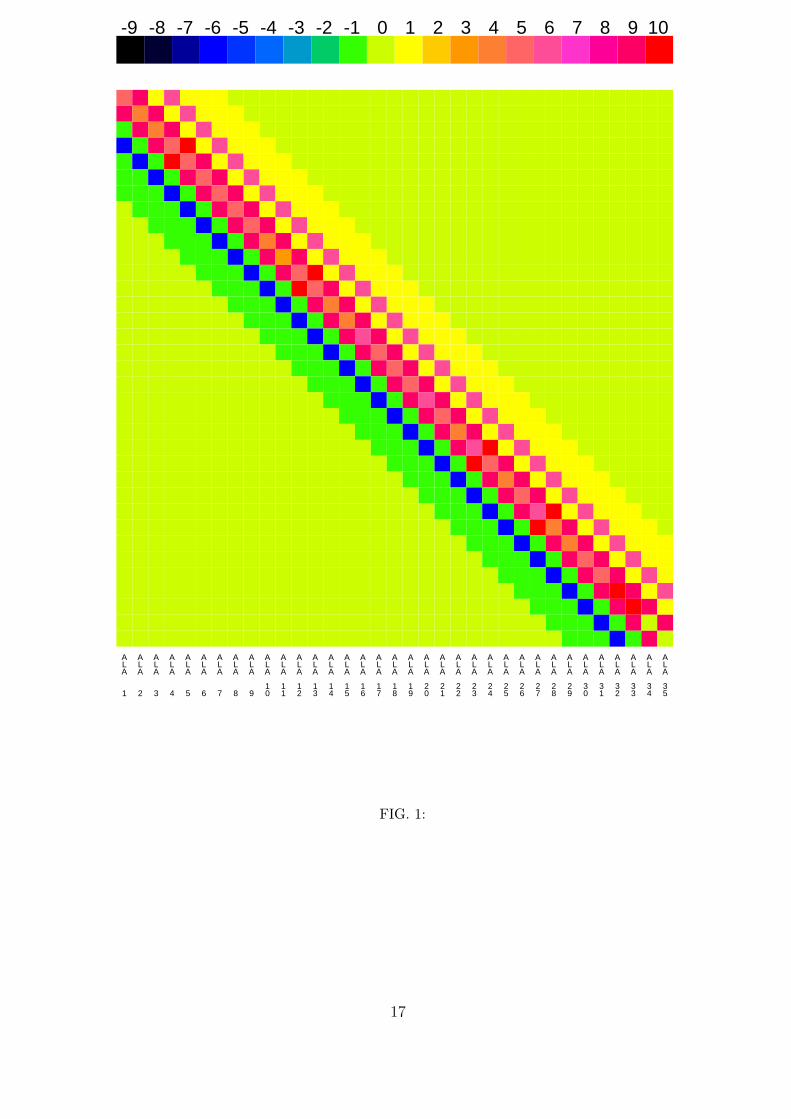
Figure 1 shows the thermal average values of the on-site Amide I energies{ξn + χ
∑Nj=1
[(|~RO
n − ~RNm| − deq
)|ϕjn|2
]cos(θnm)
}(diagonal elements of the energy
matrix) and the thermal average values of the intersite interactions Vnm (off-diagonal
elements of the energy matrix) over the 1939 conformations, in the color scale indicated
8
on top. The underlying matrix is of course symmetric with respect to the main diagonal
and its apparent asymmetry is due to the fact that the bottom half (and the diagonal)
has the real values while the top half has the absolute values of these variables. Figure 1
shows that there are significant dipole-dipole interactions beyond those found in the one
dimensional chain with nearest neighbour interactions that is considered in most studies5
for which the energy matrix includes only the diagonal and a parallel to it above and
below. Indeed, for the three-dimensional structure considered here, the energy matrix
may include significant contributions up to six parallels. The α-helix is stabilized by three
hydrogen-bonded chains and figure 1 shows that the strongest dipole-dipole interactions is
between consecutive carbonyls in the primary sequence, i.e. between carbonyls that belong
to different chains, with an average value of +9 cm−1, the positive sign indicating that this
dipole-dipole interaction is, on average, repulsive. The three hydrogen-bonded chains link
carbonyl i to carbonyl i + 3 in the primary sequence and we see that the next strongest
dipole-dipole interaction is between nearest neighbor carbonyls in each chain, with an
average negative value of −6 cm−1. The next neighbor dipole-dipole interaction in the same
chain is approximately five times weaker, being similar to the inter-chain dipole-dipole inter-
actions between amino acids i and i+2, which are negative and on average equal to −1 cm−1.
The values of nonlinearity parameter, χ, and of dielectric constant, k in figure 1were,
respectively, χ = 15 pN and k = 1. For this value of k, which maximizes the dipole-dipole
interaction, the average dipole-dipole interaction within each hydrogen-bonded chain of the
α-helix is −6 cm−1 and the on-site energies vary between 4− 6 cm−1. Notice that although
a positive χ is used, which tends to favor shorter hydrogen bonds and negative on-site
energies, all of the on-site energies are positive because the dynamics of the hydrogen bonds
here is governed by the Lennard-Jones potential of the classical AMBER potential which
makes expansions of the hydrogen bonds more favorable than contractions.
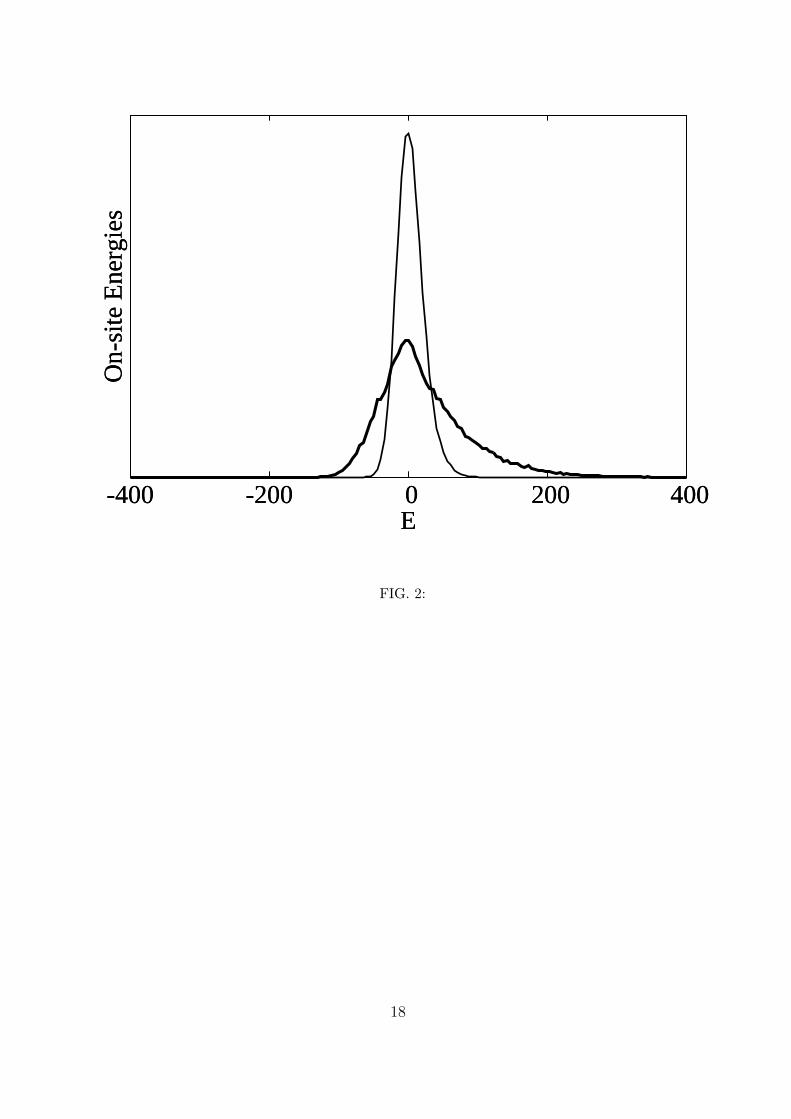
It is also interesting to find out what the distributions for the on-site energies and for
the off-diagonal elements are. Figure 2 shows the distributions of the on-site energies for
χ = 15 pN and for χ = 62 pN (the value of k does not influence these distributions). For
the lower value, the distribution is approximately Gaussian and centered on ε (the zero in
this figure is the value of ε), with a slight tail towards the high energies which explains the
9
positive average values of the on-site energies seen in figure 1. For the value of χ that has
been most used in the literature, namely, χ = 62 pN, the distribution is of course much
broader and the tail towards the higher energies becomes much more visible.
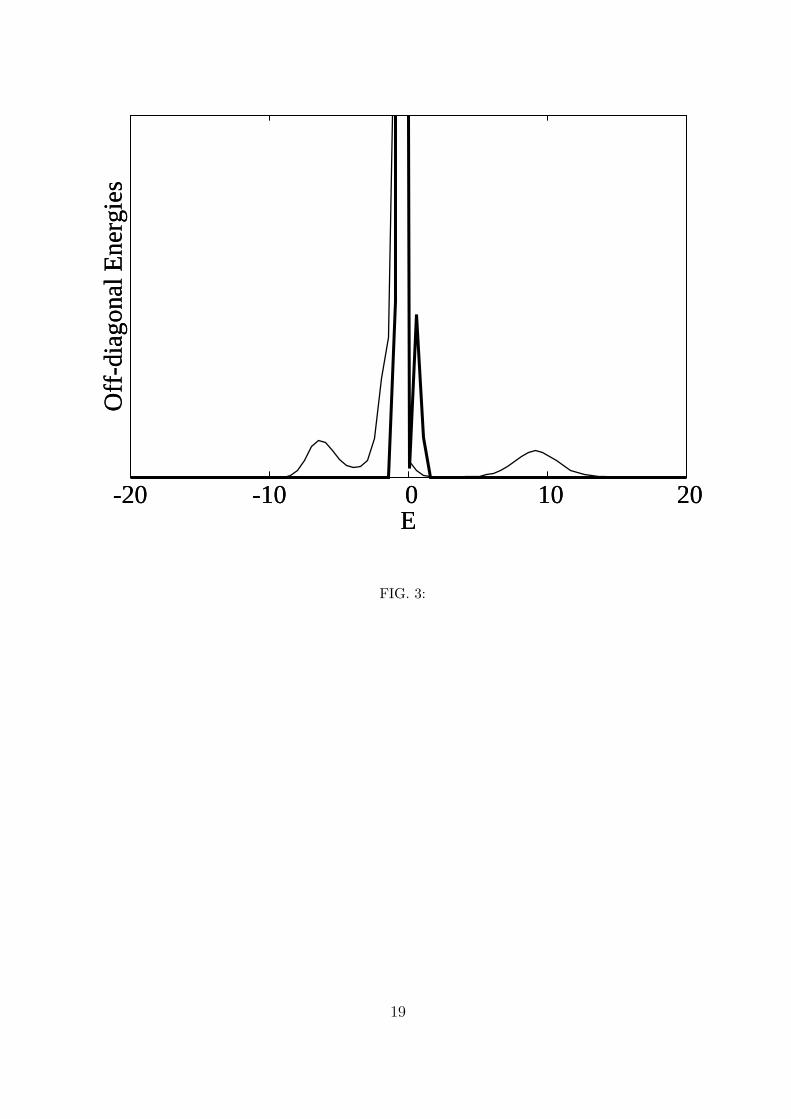
The distribution of the off-diagonal elements, on the other hand, does not depend on
χ and only depends on the dielectric constant. Figure 3 shows this distribution for k = 1
and for k = 10 which has recently been determined experimentally to be the value for the
interior of proteins26. Although in the case of a single helix in water we cannot speak of
a protein interior, it should be noted the variation of k is interesting in more than one
way since changing the dielectric constant by a factor of 10 is equivalent to changing the
strength of the dipole-dipole interaction by the same factor or the strength of the transition
dipole moment by a factor of√
10. In figure 3 the scale was truncated to allow for a better
appreciation of the structure of the two distributions. Figure 3 shows that, contrary to the
distributions of the diagonal elements, the distributions of the off-diagonal elements are, in
both cases, far from being Gaussian: for k = 10 the distribution has two peaks, one with
a maximum at −0.4 cm−1 which is twenty times larger than the maximum of the second
peak, centered at +0.6 cm−1 and for k = 1, the distribution has three peaks, the higher of
which is also centered at −0.4 cm−1 while the one to the left of it is 64 times smaller and
centered at −6.2 cm−1, and the one to the right of it is centered at +9.1 cm−1 and is 90
times smaller than the main peak.
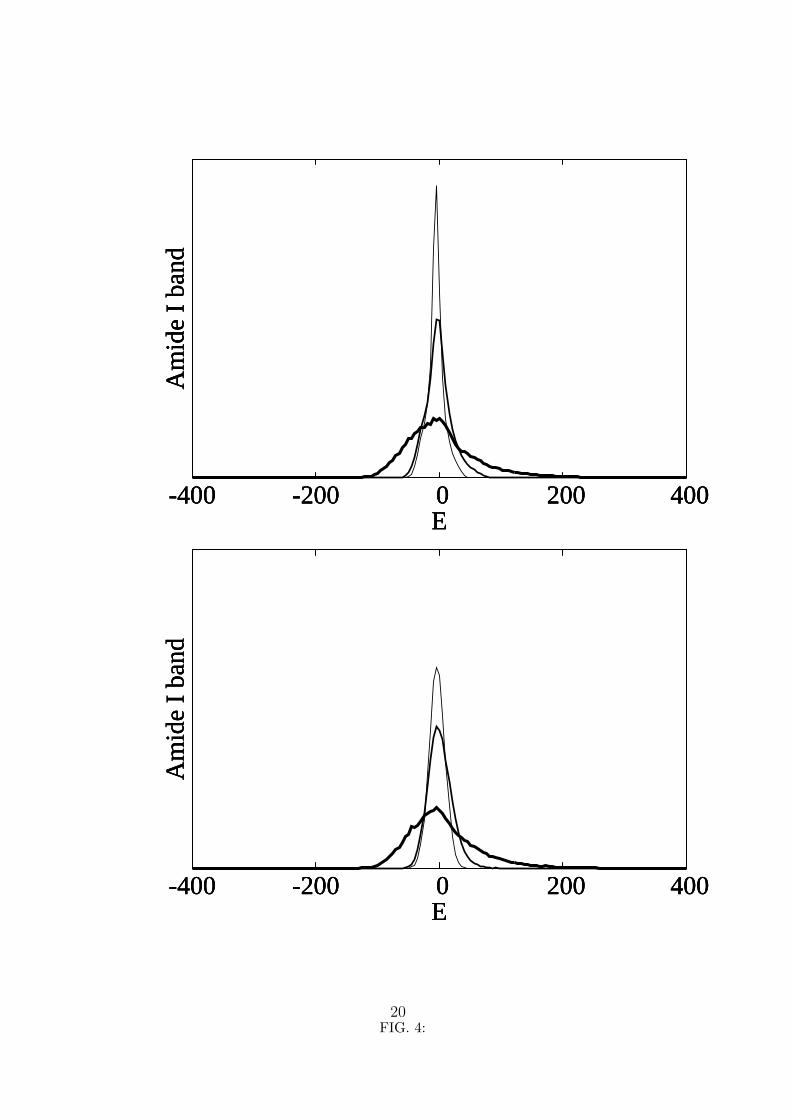
Figure 4 shows the absorption line-shapes for the two values of the dielectric constant
considered before and for three values of the nonlinearity parameter. The units are
arbitrary, but the six curves displayed are normalized so that the area under them is the
same for all and the scales are the same for all the curves. The maxima for the bands
obtained with k = 10 are generally slightly lower than for k = 1, that is, the bands for
k = 10 are generally slightly broader than for k = 1. For k = 10, the off-diagonal elements
are ten times weaker than those shown in figure 1 and the Amide I states are more localized.
The width of the bands, however, is only weakly dependent on the value of the dielectric
constant. In fact, for χ = 62 pN, the width of the bands is very similar for the two values
of k, which means that for this value of the nonlinearity parameter the on-site energies
are already sufficiently larger than the dipole-dipole energies, even for k = 1. On the
10
other hand, the width of the bands is strongly dependent on the value of the nonlinearity
parameter χ: the full width at half maximum (FWHM) is approximately 30 cm−1 for
χ = 15 pN and it is approximately 90 cm−1 for χ = 62 pN.
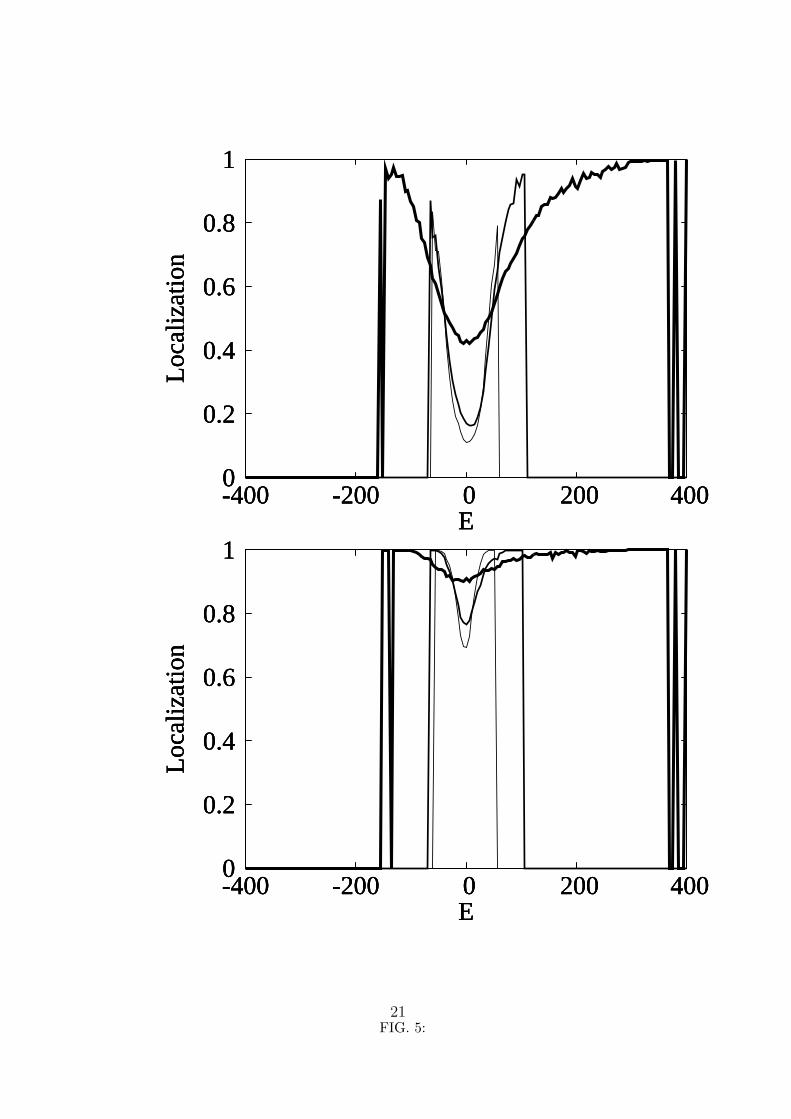
To understand better the connection between localization and the absorption line-shape
the average localization as function of the energy and for the same values of the dielectric
constant and nonlinearity parameter is displayed in figure 5. This figure shows that, even
for χ = 62 pN, the average localization is very different for k = 1 and for k = 10, since
all the states, for all the energies, are much more localized in the latter case. A common
feature is that for all the values of k and χ there is a minimum in average localization of
the states with an energy in the vicinity of the energy ε of an isolated Amide I excitation
(that is, around zero, in the figure). It should be noted that since our system has 35 sites,
complete delocalization corresponds to an average localization of 0.028, a value that is
never reached by any of the curves in figure 5, not even in the vicinity of ε. However, for
k = 1, and in spite of the diagonal disorder (which is the same for k = 10) which, according
to Anderson localization, should lead to localized states, the states with energy around ε
show some delocalization. For k = 1 we can say that the states that contribute to the peak
in the absorption band are somewhat delocalized, while for k = 10, all states are localized.
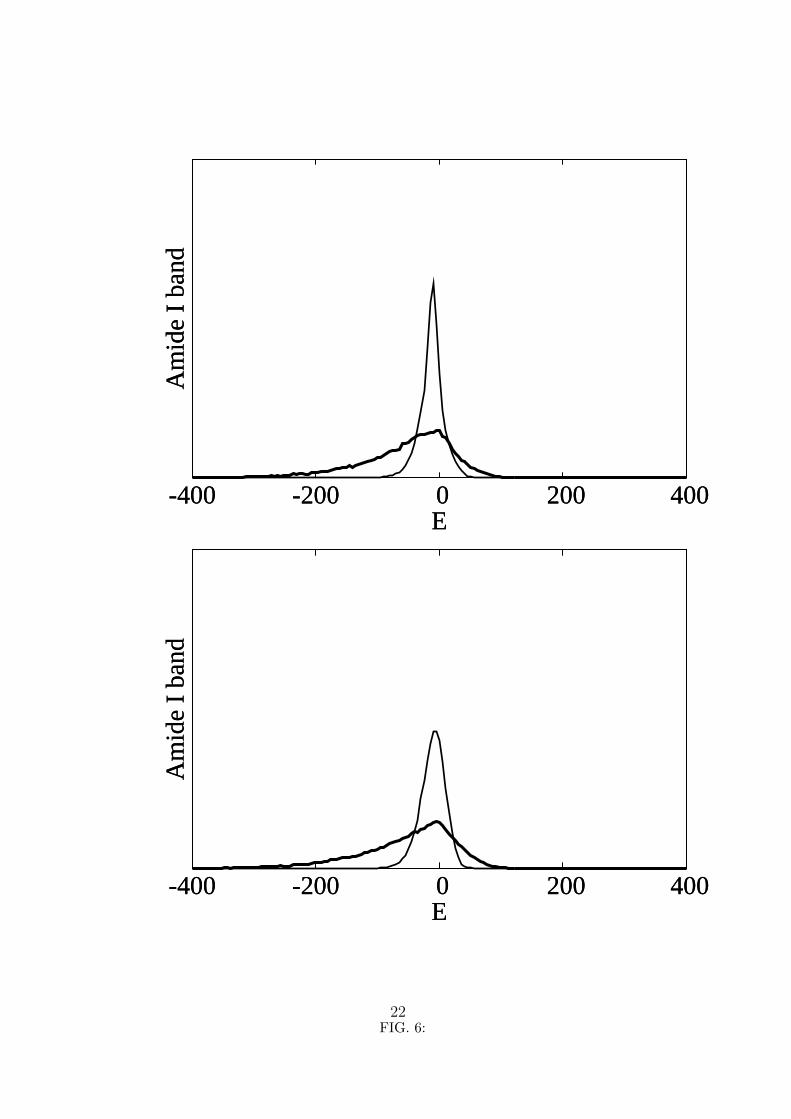
Since negative values of the nonlinearity parameter have also been obtained13 it is of
interest to determine the Amide I absorption band in this case. The corresponding results
are displayed in figure 6. In order to make them easy to compare with the results in
figure 4, the curves in figure 6 have been normalized in the same manner and drawn with
the same scales. We can see that the spectra for χ < 0 is not the simple reversal of the
spectra obtained for χ > 0, which is to be expected as only the diagonal terms in the
matrix illustrated in figure 1 change sign. Curiously, for k = 1 while the band obtained
χ = −62 pN with a FWHM= 111 cm−1 is broader than that obtained for χ = +62 pN, the
reverse happens for the band obtained for |χ| = 15 pN, which has a FWHM= 22 cm−1 for
the negative value of the nonlinearity parameter. Also, instead of being centered around
zero, the latter band is centered around −9 cm−1. Another expected feature is that the
tails, which for χ > 0 are more extended to the high energy side, for χ < 0 they are more
extended to low energy side.
11
IV. DISCUSSION
To this author’s knowledge, this work represents the first time that the Davydov
Hamiltonian is used to simulate vibrational spectra in a full atomic model of an α-helix.
One of the aims of this study is to find out how the Amide I absorption bands depends on
the dielectric constant and on the nonlinearity parameter and let experimentally measured
absorption bands guide the choice of the appropriate values for those parameters. It was
found that, although the nature of the states depends critically on the value of the dielectric
constant, i.e. for k = 10 all states are strongly localized while for k = 1 and for lower values
of χ, the states in the vicinity of ε can be somewhat delocalized, the absorption lineshapes
do not depend very much on the value of k. I.e., absorption lineshapes cannot be used to
distinguish between different values of the dielectric constant and between localized and
delocalized states.
On the other hand, it was found that absorption lineshapes are strongly dependent on
the value of χ and the larger this value, the broader the bands. Experimentally obtained
absorption lineshapes show that the typical FWHM for the Amide I band of α-helices and
β-sheets is approximately 50 cm−13,27, which is smaller than the FWHM 90 − 110 cm−1
for |χ| = 62 pN and larger than the FWHM 20 − 30 cm−1 obtained for |χ| = 15 pN. This
indicates that the nonlinearity parameter χ should have an absolute value intermediate
between those two.
According to a recent study11 the absorption lineshape of the Amide I of myoglobin (a
protein that is predominantly α-helical) has a tail towards the low energies that increases
with temperature, while the high energy side is not temperature dependent. The calculations
here were done at 300 K and we find that the absorption band has a longer tail towards the
low energy side when the nonlinearity parameter χ is negative. A general conclusion is then
that an appropriate value for χ is −30 pN, for which the FWHM is approximately 50 cm−1
(results not shown). A value of χ of −30 pN was also estimated from theory by Kuprievich13.
12
Much of the discussion about the Davydov/Scott model in the literature has centered
on whether there is self-trapping of Amide I vibrational energy in proteins (see2,4–8,12 and
references therein). In the present study, the conformations of the α-helix are obtained from
a classical simulation with the all-atom potential AMBER and the positions of the atoms
in the carbonyl groups of the α-helix are used to calculate the states that the Amide I can
assume in those conformations. This study thus neglects self-trapping because an influence
of the presence of an amide excitation on the local conformation of the α-helix is not allowed.
Such an approximation is justified by previous simulations on a one dimensional chain which
showed that, at biological temperatures, and for a nonlinearity χ = 62 pN, the deviations
in the positions of the atoms induced by the presence of one Amide I excitation are at
least ten times smaller than the deviations caused by thermal agitation5. One conclusion
of the present work is that the nonlinearity parameter should be half the value used in
the previous simulations5, in absolute terms, which indicates that self-trapping of Amide
I excitations, at biological temperatures, is less likely than was predicted by the previous
computer simulations5 so that, in proteins, it can only happen at very low temperatures or
for a higher number of quanta. Self-trapping, however, is not the only cause of localized
states and the results of the present study also show a strong localization of Amide I states
because of diagonal and off-diagonal disorder. From a biological point of view, however, a
question remains open that is more fundamental than that of whether Amide I vibrations
are self-trapped or not, namely, the question of whether proteins store and transport energy
in the form of vibrational states when they perform their functions, something that was
designated above as the VES hypothesis. The assumption of this author is that the answer
to the latter question is yes and the VES hypothesis is true.
Acknowledgments
This work was funded in part by the Foundation for Science and Technology, Portugal
and by POCI 2010 funded by the European Community fund, FEDER.
∗ Electronic address: [email protected]; URL: http://w3.ualg.pt/∼lhansson
1 C.W.F. McClare, Ann. N.Y. Acad. Sci. 227, 74 (1974).
13
2 A.S. Davydov, A.S., Solitons in Molecular Systems. Kluwer Academic Publ., Dordrecht, 2nd
edition (1991).
3 S. Krimm and J. Bandekar, Adv. Protein Chem. 38, 181 (1986).
4 A. Scott, Phys. Rep. 217, 1 (1992).
5 L. Cruzeiro-Hansson and S. Takeno, Phys. Rev. E 56, 894 (1997).
6 G. Careri, U. Buontempo, F. Galluzzi, A.C. Scott, E. Gratton and E. Shyamsunder, Phys. Rev.
B 30, 4689 (1984).
7 J. Edler, P. Hamm and A.C. Scott, Phys. Rev. Lett. 88, 067403, 1 (2002).
8 J. Edler, and P. Hamm, J. Chem. Phys. 117, 2415 (2002).
9 J. Edler and P. Hamm, J. Chem. Phys. 119, 2709 (2003).
10 J. Edler and P. Hamm, Phys. Rev. B 69, 214301, 1 (2004).
11 R.H. Austin, A.H. Xie, L. van der Meer, B. Redlich, P.A. Lindgard, H. Frauenfelder, and D Fu,
Phys. Rev. Lett. 94, 128101 (2005).
12 J. Edler, R. Pfister, V. Pouthier, C. Falvo and P. Hamm, Phys. Rev. Lett. 93, 106405, 1 (2004).
13 V.A. Kuprievich, in Davudov’s Soliton Revisited. Self-trapping of vibrational energy in protein.,
P.L. Christiansen and A.C. Scott, eds. (Plenum, New York, 1990), p.199.
14 B.M. Pierce, in Davudov’s Soliton Revisited. Self-trapping of vibrational energy in protein., P.L.
Christiansen and A.C. Scott, eds. (Plenum, New York, 1990), p.209.
15 N. Ostergøad, Ab initio calculations in biomolecular dynamics, Ph.D. thesis, Lab. Appl. Math.
Phys., Techn. Univ. of Denmark (1991).
16 Yu. N. Chirgadze and N.A. Nevskaya, Biopolymers 15, 607-625 (1976); N.A. Nevskaya and Yu.
N. Chirgadze, Biopolymers 15, 637-648 (1976).
17 P.L. Christiansen, and A.C. Scott, in Davudov’s Soliton Revisited. Self-trapping of vibrational
energy in protein., P.L. Christiansen and A.C. Scott, eds. (Plenum, New York, 1990), p.195.
18 D. Stock, A.G.W. Leslie, and J.E. Walker, Science 286, 1700 (1999).
19 Berman, H.M., Westbrook, J., Feng, Z., Gilliland, G., Bhat, T.N., Weissig, H., Shindyalov, I.N.,
Bourne, P.E., 2000. The Protein Data Bank. Nuc. Acids Res. 28, 235-242.
20 Case, D.A., Pearlman, D.A., Caldwell, J.W., Cheatham, T.E. III, Ross, W.S., Simmerling, C.L.,
Darden, T.A., Merz, K.M., Stanton, R.V., Cheng, A.L., Vincent, J.J., Crowley, M., Tsui, V.,
Radmer, R.J., Duan, Y., Pitera, J., Massova, I., Seibel, G.L., Singh, U.C., Weiner, P.K. and
Kollman, P.A., 1999. AMBER 6, University of California, San Francisco.
14
21 Pearlman, D.A., Case, D.A., Caldwell, J.W., Ross, W.S., Cheatham, III, T.E., DeBolt, S.,
Ferguson, D., Seibel, G. and Kollman, P., 1995. AMBER, a package of computer programs for
applying molecular mechanics, normal mode analysis, molecular dynamics and free energy calcu-
lations to simulate the structural and energetic properties of molecules. Comp. Phys. Commun.
91, 1-41.
22 J.C. Eilbeck, P.S. Lomdahl and A.C. Scott, Phys. Rev. B 30, 4703 (1984).
23 H. Feddersen, Phys. Lett. A 154, 391 (1991).
24 N.A. Nevskaya and Yu. N. Chirgadze, Biopolymers 15, 637 (1976).
25 H. Fidder, J. Knoester and D.A. Wiersma. J. Chem. Phys. 95, 7880 (1991).
26 D.M. Nguyen, R.L. Reynald, A.G. Gittis and E.E. Lattman, J. Mol. Biol. 341, 565 (2004).
27 An infrared database for several proteins can be found at:
http://www.unco.edu/chemist/aichun/irdata.htm.
15
CAPTION LIST
1. Average value of the dipole-dipole interaction Vnm (off-diagonal elements) and of the
on-site energies of the Hamiltonian (1-5) (diagonal elements) in the color scale specified
on top (the unit is cm−1). In this figure χ = 15 pN and the dielectric constant k = 1.
2. Distribution of the on-site energies for two values of the nonlinearity parameter: χ =
62 pN (thick line) and χ = 15 pN (thin line). The energy is in cm−1 and zero means
the energy ε of an isolated Amide I excitation.
3. Distribution of the dipole-dipole interaction energies for two values of the dielectric
constant: k = 10 (thick line) and k = 1 (thin line). The energy is in cm−1.
4. Amide I absorption band for k = 1 (top curves) and for k = 10 (bottom curves). The
nonlinearity parameter χ is 62 pN for the thick line,15 pN for the thin line and 0 for
the very thin line. The energy is in cm−1 and zero means the energy ε of an isolated
Amide I excitation.
5. Average localization for k = 1 (top curves) and k = 10 (bottom curves). The non-
linearity parameter χ is 62 pN for the thick line, 15 pN for the thin line and 0 for
the very thin line. The energy is in cm−1 and zero means the energy ε of an isolated
Amide I excitation.
6. Amide I absorption band for k = 1 (top curves) and k = 10 (bottom curves). The
nonlinearity parameter χ is −62 pN for the thick line and −15 pN for the thin line.
The energy is in cm−1 and zero means the energy ε of an isolated Amide I excitation.
16
-9 -8 -7 -6 -5 -4 -3 -2 -1 0 1 2 3 4 5 6 7 8 9 10
A A A A A A A A A A A A A A A A A A A A A A A A A A A A A A A A A A A L L L L L L L L L L L L L L L L L L L L L L L L L L L L L L L L L L L A A A A A A A A A A A A A A A A A A A A A A A A A A A A A A A A A A A 1 1 1 1 1 1 1 1 1 1 2 2 2 2 2 2 2 2 2 2 3 3 3 3 3 3 1 2 3 4 5 6 7 8 9 0 1 2 3 4 5 6 7 8 9 0 1 2 3 4 5 6 7 8 9 0 1 2 3 4 5
FIG. 1:
17
-400 -200 0 200 400
On-
site
Ene
rgie
s
E -400 -200 0 200 400
On-
site
Ene
rgie
s
E
FIG. 2:
18
-20 -10 0 10 20
Off
-dia
gona
l Ene
rgie
s
E -20 -10 0 10 20
Off
-dia
gona
l Ene
rgie
s
E
FIG. 3:
19
-400 -200 0 200 400
Am
ide
I ba
nd
E -400 -200 0 200 400
Am
ide
I ba
nd
E -400 -200 0 200 400
Am
ide
I ba
nd
E
-400 -200 0 200 400
Am
ide
I ba
nd
E -400 -200 0 200 400
Am
ide
I ba
nd
E -400 -200 0 200 400
Am
ide
I ba
nd
E
FIG. 4:20
0
0.2
0.4
0.6
0.8
1
-400 -200 0 200 400
Loc
aliz
atio
n
E
0
0.2
0.4
0.6
0.8
1
-400 -200 0 200 400
Loc
aliz
atio
n
E
0
0.2
0.4
0.6
0.8
1
-400 -200 0 200 400
Loc
aliz
atio
n
E
0
0.2
0.4
0.6
0.8
1
-400 -200 0 200 400
Loc
aliz
atio
n
E
0
0.2
0.4
0.6
0.8
1
-400 -200 0 200 400
Loc
aliz
atio
n
E
0
0.2
0.4
0.6
0.8
1
-400 -200 0 200 400
Loc
aliz
atio
n
E
FIG. 5:21
-400 -200 0 200 400
Am
ide
I ba
nd
E -400 -200 0 200 400
Am
ide
I ba
nd
E
-400 -200 0 200 400
Am
ide
I ba
nd
E -400 -200 0 200 400
Am
ide
I ba
nd
E
FIG. 6:22