Inhibitory Effects of Toll-Like Receptor 4, NLRP3 ...
30
University of Nebraska - Lincoln DigitalCommons@University of Nebraska - Lincoln Nutrition and Health Sciences -- Faculty Publications Nutrition and Health Sciences, Department of 2018 Inhibitory Effects of Toll-Like Receptor 4, NLRP3 Inflammasome, and Interleukin-1β on White Adipocyte Browning Meshail Okla King Saud University, [email protected] Walid Zaher King Saud University Musaad Alfayez King Saud University Soonkyu Chung University of Nebraska-Lincoln, [email protected] Follow this and additional works at: hp://digitalcommons.unl.edu/nutritionfacpub Part of the Human and Clinical Nutrition Commons , Molecular, Genetic, and Biochemical Nutrition Commons , and the Other Nutrition Commons is Article is brought to you for free and open access by the Nutrition and Health Sciences, Department of at DigitalCommons@University of Nebraska - Lincoln. It has been accepted for inclusion in Nutrition and Health Sciences -- Faculty Publications by an authorized administrator of DigitalCommons@University of Nebraska - Lincoln. Okla, Meshail; Zaher, Walid; Alfayez, Musaad; and Chung, Soonkyu, "Inhibitory Effects of Toll-Like Receptor 4, NLRP3 Inflammasome, and Interleukin-1β on White Adipocyte Browning" (2018). Nutrition and Health Sciences -- Faculty Publications. 146. hp://digitalcommons.unl.edu/nutritionfacpub/146
Transcript of Inhibitory Effects of Toll-Like Receptor 4, NLRP3 ...
University of Nebraska - LincolnDigitalCommons@University of Nebraska - LincolnNutrition and Health Sciences -- FacultyPublications Nutrition and Health Sciences, Department of
2018
Inhibitory Effects of Toll-Like Receptor 4, NLRP3Inflammasome, and Interleukin-1β on WhiteAdipocyte BrowningMeshail OklaKing Saud University, [email protected]
Walid ZaherKing Saud University
Musaad AlfayezKing Saud University
Soonkyu ChungUniversity of Nebraska-Lincoln, [email protected]
Follow this and additional works at: http://digitalcommons.unl.edu/nutritionfacpub
Part of the Human and Clinical Nutrition Commons, Molecular, Genetic, and BiochemicalNutrition Commons, and the Other Nutrition Commons
This Article is brought to you for free and open access by the Nutrition and Health Sciences, Department of at DigitalCommons@University ofNebraska - Lincoln. It has been accepted for inclusion in Nutrition and Health Sciences -- Faculty Publications by an authorized administrator ofDigitalCommons@University of Nebraska - Lincoln.
Okla, Meshail; Zaher, Walid; Alfayez, Musaad; and Chung, Soonkyu, "Inhibitory Effects of Toll-Like Receptor 4, NLRP3Inflammasome, and Interleukin-1β on White Adipocyte Browning" (2018). Nutrition and Health Sciences -- Faculty Publications. 146.http://digitalcommons.unl.edu/nutritionfacpub/146
Inhibitory Effects of Toll-Like Receptor 4, NLRP3 Inflammasome, and Interleukin-1β on White Adipocyte Browning
Meshail OklaiD,1,2,6, Walid Zaher3,4, Musaad Alfayez5, and Soonkyu Chung1
1Department of Nutrition and Health Sciences, University of Nebraska-Lincoln, Lincoln, NE, USA
2Department of Community Health Sciences, College of Applied Medical Sciences, King Saud University, 183T11, P.O. Box 22452, Riyadh, 11495, Saudi Arabia
3College of Medicine Research Center, College of Medicine, King Saud University, Riyadh, Saudi Arabia
4Department of Anatomy, College of Medicine, King Saud University, Riyadh, Saudi Arabia
5Stem Cell Unit, Department of Anatomy, College of Medicine, King Saud University, Riyadh, Saudi Arabia
Abstract
Adipose tissue expansion is accompanied by infiltration and accumulation of pro-inflammatory
macrophages, which links obesity to pathologic conditions such as type 2 diabetes. However, little
is known regarding the role of pro-inflammatory adipose tissue remodeling in the thermogenic
activation of brown/beige fat. Here, we investigated the effect of pattern recognition receptors
(PRR) activation in macrophages, especially the toll-like receptor 4 (TLR4) and Nod-like receptor
3 (NLRP3), on white adipocyte browning. We report that TLR4 activation by lipopolysaccharide
repressed white adipocyte browning in response to β3-adrenergic receptor activation and caused
ROS production and mitochondrial dysfunction, while genetic deletion of TLR4 protected
mitochondrial function and thermogenesis. In addition, activation of NLRP3 inflammasome in
macrophages attenuated UCP1 induction and mitochondrial respiration in cultures of primary
adipocytes, while the absence of NLRP3 protected UCP1 in adipocytes. The effect of NLRP3
inflammasome activation on browning was mediated by IL-1β signaling, as blocking IL-1 receptor
in adipocytes protected thermogenesis. We also report that IL-1β interferes with thermogenesis via
6To whom correspondence should be addressed at Department of Community Health Sciences, College of Applied Medical Sciences, King Saud University, 183T11, P.O. Box 22452, Riyadh, 11495, Saudi Arabia. [email protected] Okla http://orcid.org/0000-0003-4855-243X
Electronic supplementary material The online version of this article (https://doi.org/10.1007/s10753-017-0718-y) contains supplementary material, which is available to authorized users.
Author Contributions M.O. designed and performed experiments, analyzed data, and wrote the manuscript. W.Z. and M.A. critically reviewed the manuscript. S.C. provided scientific guidance, participated in discussions and manuscript preparation, and helped in interpreting the significance of the results.
COMPLIANCE WITH ETHICAL STANDARDSAll protocols and procedures were approved by the Institutional Animal Care and Use Committee (IACUC) at the University of Nebraska-Lincoln in Nebraska, United States, and by the Institutional Review Board (IRB) at King Saud University in Riyadh, Saudi Arabia.
Conflicts of Interest.The authors declare that they have no conflicts of interest.
HHS Public AccessAuthor manuscriptInflammation. Author manuscript; available in PMC 2018 July 30.
Published in final edited form as:Inflammation. 2018 March ; 41(2): 626–642. doi:10.1007/s10753-017-0718-y.
Author M
anuscriptA
uthor Manuscript
Author M
anuscriptA
uthor Manuscript
proyster2
Typewritten Text
© Springer Science+Business Media, LLC. Used by permission.
proyster2
Typewritten Text
oxidative stress stimulation and mitochondrial dysfunction as we observed a statistically
significant increase in ROS production, decrease in SOD enzyme activity, and increase in
mitochondrial depolarization in adipocytes treated with IL-1β. Collectively, we demonstrated that
inflammatory response to obesity, such as TLR4 and NLRP3 inflammasome activation as well as
IL-1β secretion, attenuates β3-adrenoreceptor-induced beige adipocyte formation via oxidative
stress and mitochondrial dysfunction. Our findings provide insights into targeting innate
inflammatory system for enhancement of the adaptive thermogenesis against obesity.
Keywords
TLR4; NLRP3 inflammasome; IL-1β; uncoupling protein 1; beige adipocytes; brown adipocytes; β3-adrenergic receptor
INTRODUCTION
Innate immunity comprises the non-specific arm of the immune system and it is closely
intertwined with the adipose tissue remodeling [1]. The role of innate immune cells, such as
anti-inflammatory M2 macrophages, eosinophils, and type 2 innate lymphoid cells, in the
process of white adipose tissue (WAT) browning was previously studied [1–6]. Cold
exposure promotes alternative activation of adipose tissue macrophages, which produce
catecholamine for local browning stimulation, by mechanisms linked to cold-induced
eosinophils recruitment and type 2 cytokines, interleukin (IL)-4 and IL-13 signaling [1–6].
Previous studies on eosinophil depletion demonstrated impaired beigeing of the
subcutaneous white adipose tissue (sWAT) in response to a cold challenge [3, 6]. The type 2
innate lymphoid cells play a key role in eosinophil maintenance in adipose tissue and thus
are crucial in thermogenesis [6]. Stimulation of type 2 innate lymphoid cells by IL-33 results
in IL-5 production, which in turn stimulates eosinophil secretion of IL-4 to induce
commitment to the beige adipocyte lineage [6]. Several immune cell subpopulations have
been identified in the adipose tissue browning [1–6]; however, more research is needed to
determine how the sympathetic nervous system and immune system interact and to
understand the contribution of other immune cells, such as basophils, neutrophils, natural
killers, and mast cells, in the browning process. Although several studies have pointed to the
role of type 2 immune cells in the browning of WAT, little is known about the role of pro-
inflammatory cells, such as M1 macrophages and pro-inflammatory cytokines in adaptive
thermogenesis [1].
Brown and white adipose tissues play distinct roles in maintaining whole-body energy
homeostasis. Brown fat dissipates large amounts of chemical energy as heat, and its
activation exerts anti-obesity and anti-diabetic effects [2]. Numerous reports demonstrated
an inverse relationship between brown fat activity and adiposity even in adult human [1, 7–
11]. In addition, genetic- [12] and diet-induced models of obese mice [1, 13] showed
suppressed thermogenic markers in the brown/beige fat. Given that inflammation is a
hallmark of obesity [1, 14], obesity may prevent “browning” of the white fat due to pro-
inflammatory type 1 immune system activation. In white adipocytes, pro-inflammatory
cytokines derived from lipopolysaccharide (LPS)- or tumor necrosis factor α (TNF-α)-
Okla et al. Page 2
Inflammation. Author manuscript; available in PMC 2018 July 30.
Author M
anuscriptA
uthor Manuscript
Author M
anuscriptA
uthor Manuscript
activated macrophages suppressed the induction of the uncoupling protein 1 (UCP1)
promoter activity and mRNA expression via extracellular signal-related kinase (ERK)
activation [15]. Furthermore, IL-1β, a typical pro-inflammatory cytokine, suppressed
isoproterenol-induced activation of the UCP1 promoter and cold-induced UCP1 expression
in mouse adipose tissue [16]. These studies indicate that inflammation links obesity and
dysfunctional thermogenesis; however, the nature of the link between obesity-associated
chronic immune response and non-shivering thermogenesis is not fully understood.
Understanding the metabolic effect of inflammatory signaling on brown/beige adipocytes is
crucial as there is a renewed interest in utilizing brown fat therapeutic potential for treating
obesity and its associated metabolic diseases. The present study attempted to address
whether differential inflammatory cues could affect β3-adrenergic receptor (β3-AR)-induced
WAT browning. We tested whether activation of pattern recognition receptors (PRR), Toll-
like receptors (TLR), and nucleotide-oligomerization domain-containing proteins (NOD)-
like receptors (NLR) decreases adaptive thermogenesis and mitochondrial function by using
TLR4 and NLRP3 loss-of-function mutant mice and primary human adipocytes. Using these
approaches, we revealed that inflammation induces oxidative stress and mitochondrial
dysfunction in adipocytes and, thus, represses β3-AR-induced white adipocyte browning.
MATERIALS AND METHODS
Chemicals
Fetal bovine serum (FBS) was purchased from GIBCO. Rosiglitazone (BRL 49653) was
purchased from Cayman Chemical. Lipopolysaccharides (LPS) from Escherichia coli 055:B5 (3 × 10⁶ endotoxin unit (EU)/mg), dibutyryl (Bt2)-cAMP, insulin, and 3-isobutyl-1-
methylxanthine (IBMX) were purchased from Sigma-Aldrich. Recombinant human and
mouse IL-1β proteins were purchased from R&D Systems. IL-1 receptor antagonist
(IL-1RA 407616) was purchased from Merck Millipore. β3-adrenergic receptor agonist (CL
316,243) was purchased from Santa Cruz.
Animals
All protocols and procedures were approved by the Institutional Animal Care and Use
Committee (IACUC) at the University of Nebraska-Lincoln in Nebraska, United States, and
King Saud University in Riyadh, Saudi Arabia. C57BL/6 male mice were purchased at 6
weeks of age from Jackson Laboratory. For LPS-mediated TLR4 activation, C57BL/6 male
mice at 6–8 weeks of age (n = 6–8 per group) were injected intraperitoneally with
Escherichia coli LPS (7.5 µg/mouse, equivalent to 22,500 EU) in saline (0.9% NaCl) every
other day for 2 weeks. Saline was used as a vehicle for the control group. To stimulate
thermogenesis, mice received intraperitoneal (i.p.) injections of CL 316,243 (CL) (1 mg/kg
body weight) for the last 10 days before necropsy. The homozygous knockout for TLR4
expression (TLR4−/−, B6. B10ScN-Tlr4lps-del/JthJ) and NLRP3 (Nlrp3−/−, B6.129S6-
Nlrp3tm1Bhk/J) were purchased from Jackson Laboratory and bred at ambient temperature.
All experiments were conducted on male mice at 6–8 weeks of age (n = 6–8 per group). At
the time of necropsy, inguinal fat was collected, snap frozen in liquid nitrogen, and kept at
− 80 °C until analysis.
Okla et al. Page 3
Inflammation. Author manuscript; available in PMC 2018 July 30.
Author M
anuscriptA
uthor Manuscript
Author M
anuscriptA
uthor Manuscript
Body Surface Temperature
For the detection of thermal release, an infrared (IR) camera (A655sc, FLIR Systems) was
used to acquire images of body surface temperature as we described previously [13]. Mean
surface temperature in Fig. 1b was calculated by following the method of Crane et al. [17].
Hematoxylin and Eosin Staining
Inguinal adipose tissue samples from C57BL/6 and TLR4 KO mice were fixed immediately
in 10% buffered formalin. Paraffin-embedded adipose tissue samples were sectioned into 10
µm thickness for hematoxylin and eosin (H&E) staining.
RNA Isolation, cDNA Synthesis, and Real-time qPCR
Total RNA was extracted using Trizol reagent (Invitrogen) according to the manufacturer’s
instructions and RNA was isolated using chloroform-isopropanol method. To remove
genomic DNA contamination, RNA was purified using DNase (5 PRIME). Two micrograms
of RNA was reverse-transcribed into cDNA in a total volume of 20 µL using iScript cDNA
synthesis kit (Bio-Rad). Gene expression analysis was determined by qPCR (QuantStudio 6,
Applied Biosystems), and relative gene expression was normalized to 36B4. Gene-specific
primers for qPCR were obtained from Integrated DNA Technologies (Chicago, IL, USA)
and the complete gene lists can be found in Supplementary Table 1.
Preparation and Treatment of Cultures of Primary Adipocytes
For cultures of primary human adipocytes, abdominal subcutaneous adipose tissues were
obtained from females with a body mass index of ~ 30 kg/m2 during liposuction or
abdominoplasty surgery. All protocols and procedures were approved by the Institutional
Review Board at the University of Nebraska-Lincoln and King Saud University. Isolation of
human adipose-derived stem cells (hASC) and differentiation of adipocytes were conducted
as we described previously [18]. For cultures of primary mouse adipocytes, subcutaneous
fat-derived stem cells were used and differentiated as we described previously [13]. In some
experiments, ear mesenchymal stem cells (EMSC) were used as described previously [13].
For LPS treatment, adipocytes were incubated with LPS (100 ng/ml) for 48–72 h followed
by Bt2-cAMP (0.5–0.7 mM) for 6–12 h or NE (1 µM) for 12 h.
BMP7 Preparation and Treatment
We infected hASC with BMP7 adenovirus (a generous gift from Tong Chuan He at the
University of Chicago Medical Center) and we collected conditioned medium as we
described previously [18]. Before inducing adipogenic differentiation, hASC were grown
with or without BMP7-conditioned medium containing ~ 100 ng/ml of BMP7. After 3 days
of BMP7 incubation (~ 100 ng/ml), hASC were subjected to adipogenic differentiation
cocktail as described before [18]. During adipocyte culturing, ~ 100 ng/ml of BMP7 was
maintained by adding fresh conditioned medium every 3 days.
Transmission Electron Microscopy
Perfusion fixation was applied on C57BL/6 mice injected with either saline, CL, or LPS
+CL. Small tissue fragments of inguinal fat were fixed in 2% glutaraldehyde and 2%
Okla et al. Page 4
Inflammation. Author manuscript; available in PMC 2018 July 30.
Author M
anuscriptA
uthor Manuscript
Author M
anuscriptA
uthor Manuscript
paraformaldehyde in 0.1 M phosphate buffer. Fixed samples were embedded in epoxy resin
and sectioned for electron microscopy observation.
Mitochondrial PCR Array
The Mouse Mitochondrial RT2 Profiler™ PCR Array (QIAGEN) was used according to the
manufacturer’s protocol by real-time PCR. Pools of equal amounts of total RNA were
obtained from inguinal fat of CL or LPS+CL-injected mice (n = 6). The results were
analyzed using software provided by QIAGEN.
mtDNA Quantification by qPCR
Genomic DNA was isolated using DNAzol (Life Technologies) from homogenized
subcutaneous fat tissues from either wild-type or TLR4 KO mice. Quantitative PCR was
performed for mtDNA analysis as we described previously [13].
Oxygen Consumption Rate by Seahorse
To determine mitochondrial respiration, oxygen consumption rate (OCR) was measured
using an XF24 Extracellular Flux analyzer (Seahorse) as we described previously [19].
Measurements were performed at the basal level and after injection of three compounds
affecting bioenergetics: 1 µM Oligomycin (oligo) (Sigma), 2 µM carbonyl cyanide 4-
trifluoromethoxy phenylhydrazone (FCCP) (Sigma), and 0.5 µM Antimycin A plus
Rotenone (AA+Rot) (Sigma). Upon completion of the Seahorse XF24 Flux analysis, cells
were lysed to measure the protein concentration using BCA assay (Pierce). The results were
normalized with the protein content of corresponding well and the data were presented as a
function of time or as a percentage of baseline respiration.
Mitochondrial Membrane Potential Measurement by Flow Cytometry
Changes in mitochondrial membrane potential (Δψm) were measured by using Muse
MitoPotential Assay kit (Merck Millipore) and Muse Flow Cytometry (Merck Millipore)
following the manufacturer’s protocol. A MitoPotential Dye, a cationic and lipophilic dye,
was used to detect changes in the mitochondrial membrane potential and 7-AAD was used
as an indicator of cell death. The percentage of total depolarized cells is a sum of
depolarized live and depolarized dead cells.
Cellular Reactive Oxygen Species Detection
A commercial kit of DCFDA (2,7-dichloro-dihydrofluorescein diacetate) (Cayman) was
used to measure the intracellular reactive oxygen species (ROS) level as we described
previously [13]. Oxidation of DCFDA to the highly fluorescent 2,7-dichloro-fluorescein
(DCF) is proportionate to ROS generation. Fluorescence intensity was measured by Synergy
H1 (Bio-Rad) at Ex 485 nm and Em 528 nm kinetically every 50 s for 20–60 min.
Superoxide Dismutase Activity Assay
The activity of superoxide dismutase (SOD) was determined by using the commercial kit
Superoxide Dismutase Activity Assay Kit (Abcam) according to the manufacturer’s
protocol. The rate of the reduction with a superoxide anion is linearly related to the xanthine
Okla et al. Page 5
Inflammation. Author manuscript; available in PMC 2018 July 30.
Author M
anuscriptA
uthor Manuscript
Author M
anuscriptA
uthor Manuscript
oxidase activity and is inhibited by SOD. Therefore, inhibition activity of SOD was
determined by colorimetric method and the absorbance at 450 nm was obtained using
SpectraMax M5 microplate reader (Molecular Devices).
Preparation of Macrophages and Stimulation of NLRP3 Inflammasome
Bone marrow-derived macrophages (BMDM) were prepared by isolating bone marrow from
the femurs of 8- to 10-week-old C57BL/6 or Nlrp3 KO mice, followed by incubation for 7–
10 days with L-cell conditioned medium for macrophage differentiation as we described
previously [20]. For NLRP3 inflammasome stimulation, differentiated BMDM were primed
with LPS (100 ng/ml) for 1 h and then incubated with nigericin (6.5 µM) for an additional
hour [20]. Then, IL-1β-containing conditioned medium (mIL-1β-CM) were collected to be
added to adipocytes. In some experiments, peritoneal macrophages were used instead of
BMDM. For human experiments, human peripheral blood mononuclear cells (hPBMC) were
purchased from Zenbio and used for hIL-1β-CM preparation. hPBMC were cultured in
RPMI 1640 medium with 10% heat-inactivated FBS, 1% penicillin streptomycin, and 2 mM
L-glutamine. Adherent monocyte subpopulations were treated for 5 days with 2 ng/ml of
human macrophage colony-stimulating factor (Sigma) for macrophage differentiation. These
macrophages then were primed with LPS for 1 h and then exposed to nigericin for 1 h to
stimulate NLRP3 inflammasome formation and IL-1β secretion.
Statistical Analysis
All data are presented as mean ± standard error of mean. Independent samples were
statistically analyzed using Student’s t test or one-way ANOVA followed by Tukey’s
multiple comparison tests for comparisons between two groups. Two-way ANOVA with
repeated measures was used to analyze OCR and ROS measurements. All statistical analyses
were conducted by Graph Pad Prism 7 (Version 7.03).
RESULTS
TLR4 Activation by LPS Attenuates β3-AR-Induced Thermogenesis
Obesity is associated with high endotoxin level which is a known inducer of TLR4
activation and chronic inflammation. However, inflammation generated by obesity is not as
high in amplitude as those seen in acute infectious settings [21, 22]. We reported previously
that TLR4 activation by either LPS or a high-fat diet attenuates WAT browning in cold-
acclimated mice [13]. Here, we tested whether LPS-induced TLR4 activation could also
attenuate β3-AR-induced thermogenesis by using β3-AR-specific agonist (CL 316,243). We
found that mice received LPS released less heat in response to β3-AR activation (Fig. 1a, b),
induced Tlr4 gene expression in inguinal sWAT (Fig. 1c), and had higher body weight
compared to CL-injected mice (Fig. 1d). LPS-injected group also showed impaired WAT
browning in their inguinal fat as brown-like morphology was diminished (Fig. 1e) and the
expression of brown-specific genes (Ucp1, Pgc1α, and Cidea) was significantly reduced
(Fig. 1f, top), while inflammatory genes (Tnf-α, Il1β, and Mcp1) were elevated (Fig. 1f,
bottom) compared to CL-injected mice. These data indicate that TLR4 activation by LPS
prevents β3-AR-induced thermogenesis by interfering with WAT browning.
Okla et al. Page 6
Inflammation. Author manuscript; available in PMC 2018 July 30.
Author M
anuscriptA
uthor Manuscript
Author M
anuscriptA
uthor Manuscript
LPS Affects BMP7-Induced Beige Adipogenesis and cAMP-Induced Thermogenesis in Human Adipocytes In Vitro
Previously, our group reported that continuous exposure of hASC to BMP7 generates a
useful cell model for human beige adipocytes [18]. Using this model, we first tested whether
LPS interferes with BMP7-mediated beige adipogenesis. We found that exposure of hASC
to LPS along with BMP7 (from the cell expansion before differentiation and throughout
differentiation) attenuated BMP7-induced beige adipogenesis as the gene expression of both
adipogenic and thermogenic markers all decreased significantly (Fig. 1g). We have also
previously reported that exposure of fully differentiated primary human white adipocytes to
LPS decreased their thermogenic gene expression in response to Bt2-cAMP [13]. Here, we
next tested the effect of continuous exposure of hASC during adipogenesis to LPS (100
ng/ml) before their exposure to the thermogenic inducer (Bt2-cAMP).We found that
exposure of hASC to LPS markedly decreased adipogenesis and Bt2-cAMP-induced
thermogenic activation, as the gene expression of adipogenic markers (PPARγ and aP2) and
brown-specific markers (UCP1, PGC1a, CIDEA, DIO2, and GLUT4) reduced significantly
(Fig. 1h). These data verify the negative impact of LPS on thermogenesis in two in vitro models of human beige adipocytes mediated by BMP7 (Fig. 1f) as well as Bt2-cAMP (Fig.
1g).
Absence of TLR4 Protects β3-AR-Induced Thermogenesis from the LPS Negative Effects
TLR4 activation inhibited cold-induced thermogenesis, which was rescued in TLR4-mutant
mice [13]. In this study, we wanted to verify the role of TLR4 in LPS-induced WAT
browning inhibition in response to CL 316,243.We used a genetic model of TLR4-deficient
mice and we found that LPS injections in TLR4 KO mice did not cause an increase in body
weight (Fig. 2a) as in wild-type mice. In these TLR4 KO mice, LPS did not affect CL-
induced WAT browning compared to CL-injected TLR4 KO mice, as both brown-like
morphology (Fig. 2b) and brown-specific genes (Fig. 2c) were protected. As expected, the
gene expression of inflammatory markers (such as Tlr4, Mcp1, and Il1β) was blunted in
these TLR4 KO mice despite LPS administration compared to the wild-type mice (Fig. 2d).
We also found that the absence of TLR4 protected mitochondrial content and respiration
from the negative effect of LPS (Fig. 2e, f, respectively). These data indicate that LPS-
induced inflammation attenuates WAT browning in CL-injected mice via TLR4 activation.
TLR4 Activation by LPS Affects Mitochondrial Integrity
Mitochondria play a central role in the metabolism of adipose tissue and adaptive
thermogenesis. Therefore, it is not surprising that mitochondrial disruption contributes vastly
to impairments in adipose tissue browning [23]. In this study, we tested whether the effect of
TLR4 activation on WAT browning involves mitochondrial changes and therefore, we
checked mitochondrial morphology, content, and function. We found that mitochondria of
inguinal fat cells of LPS+CL-injected mice exhibited atypical morphology, swollen
mitochondria with distorted cristae (Fig. 3a). In addition, mitochondrial PCR array indicated
abnormal changes in mitochondrial related genes in LPS+CL-injected mice compared to CL
group (Fig. 3b). Furthermore, LPS treatment reduced mitochondrial content as determined
by mtDNA content in the inguinal fat of CL-injected mice (Fig. 3c). To assess mitochondrial
Okla et al. Page 7
Inflammation. Author manuscript; available in PMC 2018 July 30.
Author M
anuscriptA
uthor Manuscript
Author M
anuscriptA
uthor Manuscript
function, we measured mitochondrial respiration in mouse adipocytes differentiated from
C3H10T1/2 pluripotent stem cells. Exposing mature adipocytes to LPS (100 ng/ml) for 24 h
reduced mitochondrial respiration significantly (Fig. 3d). To further assess mitochondrial
function, we measured mitochondrial membrane potential (Δψm) using a cationic
fluorescent dye. Adipocytes treated with LPS caused a 60% elevation in the number of
depolarized mitochondria, a reliable indicator of mitochondrial dysfunction (Fig. 3e).
Perturbation of the mitochondrial function relates to redox imbalance [23]. Therefore, we
measured ROS generation using DCF fluorescence and we found a significant elevation in
ROS level in LPS-treated adipocytes (Fig. 3f), which was abrogated upon the antioxidant, n-
acetylcysteine (NAC) (Fig. 3g). Furthermore, there was a significant reduction in the SOD
enzyme activity (Fig. 3h), which serves to counterbalance the effect of oxidants [24].
Collectively, these results indicate that chronic inflammation induced by TLR4 activation
impairs β3-AR-induced browning via mechanisms linked to oxidative stress, a convergence
outcome of dysfunctional mitochondria and defective antioxidant defense system.
NLRP3 Inflammasome Activation Interferes with Adaptive Thermogenesis
NLR receptors can sense pathogen- and danger-associated molecular patterns [25–27]. A
number of obesity-associated danger signals, such as glucose, ceramide, palmitate, and ROS,
contribute to NLRP3 inflammasome activation [21, 27]. Activation of NLRP3
inflammasome, during obesity, directly correlates with the severity of diabetes mellitus;
however, the role and involvement of obesity-associated NLRP3 inflammasome in adaptive
thermogenesis are unknown. Here, we investigated the effect of NLRP3 inflammasome
activation in macrophages on Bt2-cAMP-induced thermogenesis in adipocytes. We
stimulated NLRP3 inflammasome by using LPS and nigericin, and then, we collected IL-1β-
containing conditioned medium (IL-1β-CM). IL-1β gene expression (Fig. 4a, left) induced
in human macrophages and IL-1β protein level in the medium also increased significantly
upon NLRP3 inflammasome stimulation (Fig. 4a, right). Cultures of primary human
adipocytes exposed to hIL-1β-CM manifested attenuation in Bt2-cAMP-induced elevation in
UCP1, PGC1α, CIDEA, and DIO2 (Fig. 4b). In addition, hIL-1β-CM attenuated
mitochondrial respiration and OCR in these adipocytes (Fig. 4c). To further verify the
negative relationship between NLRP3 inflammasome and thermogenesis, we obtained
BMDM from wild-type (WT) mice and Nlrp3-null mice and we exposed both to same
conditions of NLRP3 inflammasome activation. The IL-1β protein content in the obtained
media indicates that Nlrp3-deficient macrophages had lower ability in IL-1β production
compared to WT macrophages (Fig. 4d). Cultures of primary mouse adipocytes incubated
with mIL-1β-CM derived from WT macrophages showed attenuation in Bt2-cAMP-induced
Ucp1 gene expression (Fig. 4e, left), while mIL-1β-CM derived from NLRP3-deficient
macrophages did not affect Ucp1 gene expression (Fig. 4e, right). Furthermore, there was a
dose-dependent effect of mIL-1β-CM obtained from WT macrophages on mitochondrial
respiration and OCR in adipocytes (Fig. 4f). Area under the curve (AUC) analysis of OCR
profile indicates that adipocytes consume more oxygen overall in the absence of mIL-1β-
CM (Fig. 4f). The ratio of OCR to the extracellular acidification rate (ECAR) may indicate
that in the absence of mIL-1β-CM, there is a cellular preference of adipocytes for oxidative
phosphorylation versus glycolysis (Fig. 4f). These data indicate that NLRP3 inflammasome
activation in macrophages plays a crucial role in inhibiting white adipocyte browning, and
Okla et al. Page 8
Inflammation. Author manuscript; available in PMC 2018 July 30.
Author M
anuscriptA
uthor Manuscript
Author M
anuscriptA
uthor Manuscript
that targeting NLRP3 inflammasome may break the link between obesity-associated
inflammation and impaired adaptive thermogenesis.
IL-1β Mediates the Inhibitory Effect of NLRP3 Inflammasome on Adaptive Thermogenesis
Despite that IL-1β levels are often elevated in obesity and associated with deteriorations in
the metabolic functions of multiple organs [6], little is known about the effect of IL-1β on
adaptive thermogenesis. In this study, we tested if IL-1β mediates the negative effect of
NLRP3 inflammasome on WAT browning. When we blocked IL-1β signaling in adipocytes
by using IL-1β receptor antagonist (IL-1RA), UCP1, and other brown-specific markers in
human (Fig. 5a) and mouse (Fig. 5b), adipocytes were protected from IL-1β-CM. In
addition, IL-1RA improved mitochondrial respiration and OCR compared to adipocytes
incubated with IL-1β-CM alone in both human (Fig. 5c) and mouse primary adipocytes (Fig.
5d). Although AUC analysis of OCR profile indicates that IL-1RA improved overall oxygen
consumption in adipocytes treated with mIL-1β-CM, there was no difference in OCR to
ECAR ratio (Fig. 5d). To verify the adverse effects of IL-1β on adaptive thermogenesis, we
treated adipocytes directly with IL-1β recombinant protein. There was a dose-dependent
effect of IL-1β on the gene expression of brown-specific genes in human adipocytes (Fig.
5e) and animal adipocytes (Fig. 5f). In addition, exposure of adipocytes to IL-1β recombinant protein (20 ng/ml for 24 h) decreased OCR in human adipocytes (Fig. 5g) and
animal adipocytes (Fig. 5h). Consistently, the overall oxygen consumption and OCR to
ECAR ratio in adipocytes in the presence of IL-1β decreased significantly (Fig. 5h). We also
tested the effect of continuous exposure of human adipocytes to IL-1β on BMP7- or Bt2-
cAMP-induced thermogenesis. Combined exposure of adipocytes to BMP7 and IL-1β before and during differentiation inhibited BMP7-induced beige adipocyte development
(Supplementary Fig. 1a) and thermogenic genes (Supplementary Fig. 1b). In addition,
continuous exposure of adipocytes to IL-1β (2 ng/ml) attenuated adipogenesis
(Supplementary Fig. 1c) and blunted Bt2-cAMP-induced elevation in brown-specific genes
(Supplementary Fig. 1d). These data indicate that NLRP3 inflammasome activation in
macrophages impose a negative effect on adipocyte browning via IL-1β signaling in
adipocytes. In addition, exposure of adipocytes to IL-1β affects white and beige adipocyte
differentiation and attenuates the gene expression of brown-specific genes.
IL-1β Distresses Mitochondrial Function in Adipocytes
Mitochondrial integrity is crucial for thermogenic program activation [28]. We tested
whether IL-1β causes alterations in mitochondrial function and thus interferes with
thermogenesis. Using cultures of primary murine adipocytes differentiated from EMSC or
sWAT, we found that IL-1β causes a profound increase in ROS production (Fig. 6a). This
effect was in a dose-dependent manner (Fig. 6b). Since mitochondria is the major source of
ROS, we checked mitochondrial membrane potentials of adipocytes in the presence or
absence of IL-1β and we found that IL-1β causes mitochondrial depolarization in a dose-
dependent effect (Fig. 6c). To further understand the changes associated with IL-1β-induced
ROS elevation, we measured SOD activity and we found that IL-1β decreased SOD activity
upon different doses of IL-1β (Fig. 6d). Treating adipocytes with different antioxidants (i.e.,
NAC or Tempol) resulted in a significant reduction in IL-1β-induced ROS productions (Fig.
6e), protected mitochondrial membrane potential (Fig. 6f), and rescued Ucp1 gene
Okla et al. Page 9
Inflammation. Author manuscript; available in PMC 2018 July 30.
Author M
anuscriptA
uthor Manuscript
Author M
anuscriptA
uthor Manuscript
expression (Fig. 6g). This suggests that IL-1β in adipocytes intertwines oxidative stress to
mitochondrial depolarization through changes in antioxidant defense system; thereby, it
inhibits white-to-brown fat conversion.
DISCUSSION
Sustained inflammation exacerbates obesity and metabolic disorders, a state in which non-
shivering thermogenesis is reduced. However, the link between inflammation and non-
shivering thermogenesis still needs better understanding. In this study, we addressed the
question of whether (1) activation of PRR (TLR4 and NLRP3) interferes with β3-AR-
induced thermogenesis, (2) the absence of TLR4 and NLRP3 would protect thermogenesis,
and (3) whether the pro-inflammatory cytokine, IL-1β, mediates the inhibitory effect of
NLRP3 inflammasome on adaptive thermogenesis. Our results demonstrated that LPS-
induced TLR4 activation in mice prevented WAT browning despite β3-AR activation, while
genetic deletion of TLR4 protected β3-AR-induced thermogenesis. In addition, NLRP3
inflammasome activation in macrophages interfered with Bt2-cAMP- or norepinephrine-
induced thermogenic program in adipocytes, while genetic deletion of NLRP3 in
macrophages protected UCP1 gene expression in adipocytes. Furthermore, we found that
NLRP3 inflammasome activation in macrophages interfered with thermogenesis of adjacent
adipocytes via IL-1β paracrine effects, as blocking IL-1 receptor protected adaptive
thermogenesis. Finally, we revealed that alterations caused by innate inflammatory system in
beige adipocytes were associated with changes in oxidative stress and mitochondrial
function. Therefore, our results suggest that anti-inflammatory therapies targeting PRR or
inflammatory cytokines may be beneficial for beige fat development.
Activation of PRR, including NLR, plays crucial roles in innate immune responses and
inflammation associated with obesity. NLRP3 inflammasome formation requires two
signals. The first activating signal involves TLR4 activation to prime the NLRP3
inflammasome leading to induction of pro-caspase-1, pro-IL-1β, and pro-IL-18. The second
activating signal involves NLRP3 inflammasome assembly and activation of caspase-1,
which then promotes the maturation and release of IL-1β and IL-18 [6, 21, 25, 29, 30]. We
found that activation of TLR4 and NLRP3 inflammasome interferes with adaptive
thermogenesis. In consistent with our findings, chronic PRR activation was shown to
suppress brown adipogenesis of multipotent mesodermal stem cells and brown pre-
adipocytes [31]. As activation of NLRP3 inflammasome results in IL-1β production, we
found that IL-1β mediates the abrogation in adaptive thermogenesis caused by NLRP3
inflammasome in our study. Our data are consistent with the previous report in which IL-1β was found to be potent in suppressing isoproterenol-induced UCP-1 mRNA expression in
adipocytes [1, 15].
Mitochondria constitute the primary source of ROS generation. ROS function as
physiological signaling molecules; however, prolonged and excessive ROS could be
damaging to the cells, leading to different pathological changes [24]. We found that low
amplitude of inflammation in adipocytes by TLR4 (Fig. 3f) or IL-1R (Fig. 6a, b) activation
results in high levels of ROS production. In addition, the enzyme activity of SOD, an
important enzymatic scavenger of antioxidant defense [24], is abrogated by LPS (Fig. 3h)
Okla et al. Page 10
Inflammation. Author manuscript; available in PMC 2018 July 30.
Author M
anuscriptA
uthor Manuscript
Author M
anuscriptA
uthor Manuscript
and IL-1β (Fig. 6d). The changes in oxidative stress status in adipocytes were associated
with an elevation in mitochondrial depolarization upon the treatments with LPS (Fig. 3e) or
IL-1β (Fig. 6c), while mitochondrial depolarization was reduced in the presence of
antioxidants (Fig. 6f). This implicates an intertwined relationship between oxidative stress
and mitochondrial function in adipocytes under inflammation. We, therefore, find it
plausible that chronic inflammation in adipocytes shifts the cellular redox balance and that
oxidative stress in combination with mitochondrial damage underlies the impairment in
browning potentials.
Depending on the state of the adipose tissue, lean or obese, the immune cells could be
changed dynamically. Macrophages have the potential to express both anti- and pro-
inflammatory cytokines. Some reports focus on the positive role of anti-inflammatory
cytokines in adipocyte beigeing [4, 32], while others focus on the negative role of pro-
inflammatory cytokines [13, 31, 32]. Modulation of the innate immune system and
inflammation in improving energy dissipation is still not entirely understood and, in humans,
has yet to be demonstrated. Dedicated experiments are especially needed for clarifying the
regulatory role of the complex interplay between anti- and pro-inflammatory system in
adaptive thermogenesis, and whether activation of anti-inflammatory system can override
the inhibitory effect of the pro-inflammatory system.
Some evidence indicates that classical brown adipocytes are less prone to inflammation and
this may be linked to their thermogenic potentials. The reduced inflammation in the
interscapular brown adipose tissue (iBAT) may be a key factor in its thermogenic nature. In
one study, macrophage infiltration and inflammatory cytokines expression in iBAT were
reported to be significantly less than that in WAT in diet-induced obese (DIO) mice and
normal mice [33]. Also, brown adipocytes were reported to have an ability in suppressing
inflammatory genes in macrophages compared to white adipocytes [33]. These experiments
provide another evidence for the inverse relationship between inflammatory cytokines and
non-shivering thermogenesis, emphasizing on the importance of suppressing inflammation
to promote adaptive thermogenesis.
Although we attributed dysfunctional WAT browning to the chronic inflammatory responses
associated with obesity, several other obesity-associated factors might play a key role in
dysfunctional WAT browning. For instance, the transforming growth factor β (TGF β) and
Notch signaling pathways were shown to react as negative regulators of thermogenesis in
obese mice [34]. Furthermore, autophagy was found to dysregulate beige adipogenesis, as
inhibiting autophagy through deletion of Atg7 in adipocytes led to increased beige adipocyte
differentiation in DIO mice [35, 36]. Our group also has observed that autophagy profoundly
contributes to LPS-induced beige fat inhibition [13]. Therefore, revealing the cross-talk
between inflammation and these factors in adaptive thermogenesis will provide
indispensable knowledge for identifying therapeutic targets for promoting energy dissipation
and preventing obesity.
Okla et al. Page 11
Inflammation. Author manuscript; available in PMC 2018 July 30.
Author M
anuscriptA
uthor Manuscript
Author M
anuscriptA
uthor Manuscript
CONCLUSION
The revived interest in targeting BAT in adults to promote energy expenditure with
subsequent decreases in adiposity instigates our needs for better understanding of the
metabolic circuit of immune system in beige adipocyte recruitment to activate non-shivering
thermogenesis. We view obesity as a deregulator of beige adipocyte development due to its
associated chronic immune responses. We found that inflammation interferes with metabolic
adaption to β3-AR-induced WAT browning via mechanisms linked to oxidative stress and
mitochondrial dysfunction. Thus, therapeutic strategies aiming to stimulate non-shivering
thermogenesis to protect against obesity may become efficient if accompanied by those
targeting inflammatory burden or oxidative stress in the fat tissue.
Supplementary Material
Refer to Web version on PubMed Central for supplementary material.
Acknowledgments
The authors wish to acknowledge the College of Medicine Research Center (CMRC) at King Saud University (KSU) and the Stem cell lab in the College of Medicine at KSU for providing access to their facilities to perform mitochondrial depolarization and oxidative stress experiments. Also, the authors wish to thank Rabih Halwani at the College of Medicine in KSU for permitting the use of Muse flow cytometry.
Funding This study was supported by the National Institute of Health (Grant 1P20GM104320, project 5; to S. C.) in the USA, International Scientific Partnership Program (ISPP, no. 0103) at King Saud University (KSU) in Saudi Arabia, and Deanship of Scientific Research (Project No. R6-17-02-36) at King Saud University in Saudi Arabia.
Abbreviations
NLRP3 NOD-like receptor protein 3
TLR4 Toll-like receptor 4
WAT White adipose tissue
PRR pattern recognition receptors
β3-AR beta 3-adrenergic receptor
ROS reactive oxygen species
UCP1 uncoupling protein 1
IL1β interleukin-1 beta
BMP7 bone morphogenetic protein 7
LPS lipopolysaccharide
CL CL 316,243
hASCs human adipose-derived stem cells
EMSC ear mesenchymal stem cells
Okla et al. Page 12
Inflammation. Author manuscript; available in PMC 2018 July 30.
Author M
anuscriptA
uthor Manuscript
Author M
anuscriptA
uthor Manuscript
sWAT subcutaneous white adipose tissue
mtDNA mitochondrial DNA
OCR oxygen consumption rate
SOD superoxide dismutase
hIL1β-CM human interleukin-1 beta-conditioned medium
mIL1β-CM mouse interleukin-1 beta-conditioned medium
NAC n-acetylcysteine
Bt2-cAMP dibutyryl-cAMP
IL1RA IL1 receptor antagonist
MQ macrophages
References
1. Alexaki VI, Chavakis T. The role of innate immunity in the regulation of brown and beige adipogenesis. Reviews in endocrine & metabolic disorders. 2016; 17(1):41–49. [PubMed: 26910560]
2. Reitman ML. How does fat transition from white to beige? Cell metabolism. 2017; 26(1):14–16. [PubMed: 28683281]
3. Qiu Y, Nguyen KD, Odegaard JI, Cui X, Tian X, Locksley RM, et al. Eosinophils and type 2 cytokine signaling in macrophages orchestrate development of functional beige fat. Cell. 2014; 157(6):1292–1308. [PubMed: 24906148]
4. Nguyen KD, Qiu Y, Cui X, Goh YP, Mwangi J, David T, et al. Alternatively activated macrophages produce catecholamines to sustain adaptive thermogenesis. Nature. 2011; 480(7375):104–108. [PubMed: 22101429]
5. Chmelar J, Chung KJ, Chavakis T. The role of innate immune cells in obese adipose tissue inflammation and development of insulin resistance. Thrombosis and haemostasis. 2013; 109(3):399–406. [PubMed: 23364297]
6. Lackey DE, Olefsky JM. Regulation of metabolism by the innate immune system. Nature reviews Endocrinology. 2016; 12(1):15–28.
7. Thyagarajan B, Foster MT. Beiging of white adipose tissue as a therapeutic strategy for weight loss in humans. Hormone molecular biology and clinical investigation. 2017
8. van Marken Lichtenbelt WD, Vanhommerig JW, Smulders NM, Drossaerts JM, Kemerink GJ, Bouvy ND, et al. Cold-activated brown adipose tissue in healthy men. The New England Journal of Medicine. 2009; 360(15):1500–1508. [PubMed: 19357405]
9. Saito M, Okamatsu-Ogura Y, Matsushita M, Watanabe K, Yoneshiro T, Nio-Kobayashi J, et al. High incidence of metabolically active brown adipose tissue in healthy adult humans: effects of cold exposure and adiposity. Diabetes. 2009; 58(7):1526–1531. [PubMed: 19401428]
10. Vijgen GH, Bouvy ND, Teule GJ, Brans B, Schrauwen P, van Marken Lichtenbelt WD. Brown adipose tissue in morbidly obese subjects. PLoS One. 2011; 6(2):e17247. [PubMed: 21390318]
11. Cypess AM, Lehman S, Williams G, Tal I, Rodman D, Goldfine AB, et al. Identification and importance of brown adipose tissue in adult humans. The New England journal of medicine. 2009; 360(15):1509–1517. [PubMed: 19357406]
12. Martins FF, Bargut TCL, Aguila MB, Mandarim-de-Lacerda CA. Thermogenesis, fatty acid synthesis with oxidation, and inflammation in the brown adipose tissue of ob/ob (−/−) mice. Annals of anatomy. Anatomischer Anzeiger : official organ of the Anatomische Gesellschaft. 2017; 210:44–51.
Okla et al. Page 13
Inflammation. Author manuscript; available in PMC 2018 July 30.
Author M
anuscriptA
uthor Manuscript
Author M
anuscriptA
uthor Manuscript
13. Okla M, Wang W, Kang I, Pashaj A, Carr T, Chung S. Activation of Toll-like receptor 4 (TLR4) attenuates adaptive thermogenesis via endoplasmic reticulum stress. The Journal of Biological Chemistry. 2015; 290(44):26476–26490. [PubMed: 26370079]
14. Lumeng CN, Bodzin JL, Saltiel AR. Obesity induces a phenotypic switch in adipose tissue macrophage polarization. The Journal of Clinical Investigation. 2007; 117(1):175–184. [PubMed: 17200717]
15. Sakamoto T, Takahashi N, Sawaragi Y, Naknukool S, Yu R, Goto T, et al. Inflammation induced by RAW macrophages suppresses UCP1 mRNA induction via ERK activation in 10T1/2 adipocytes. American Journal of Physiology Cell Physiology. 2013; 304(8):C729–C738. [PubMed: 23302779]
16. Goto T, Naknukool S, Yoshitake R, Hanafusa Y, Tokiwa S, Li Y, et al. Proinflammatory cytokine interleukin-1beta suppresses cold-induced thermogenesis in adipocytes. Cytokine. 2016; 77:107–114. [PubMed: 26556104]
17. Crane JD, Mottillo EP, Farncombe TH, Morrison KM, Steinberg GR. A standardized infrared imaging technique that specifically detects UCP1-mediated thermogenesis in vivo. Molecular Metabolism. 2014; 3(4):490–494. [PubMed: 24944909]
18. Okla M, Ha JH, Temel RE, Chung S. BMP7 drives human adipogenic stem cells into metabolically active beige adipocytes. Lipids. 2015; 50(2):111–120. [PubMed: 25534037]
19. Kim J, Okla M, Erickson A, Carr T, Natarajan SK, Chung S. Eicosapentaenoic acid potentiates brown thermogenesis through FFAR4-dependent up-regulation of miR-30b and miR-378. The Journal of Biological Chemistry. 2016; 291(39):20551–20562. [PubMed: 27489163]
20. Kim Y, Wang W, Okla M, Kang I, Moreau R, Chung S. Suppression of NLRP3 inflammasome by gamma-tocotrienol ameliorates type 2 diabetes. Journal of Lipid Research. 2016; 57(1):66–76. [PubMed: 26628639]
21. Lumeng CN. Innate immune activation in obesity. Molecular Aspects of Medicine. 2013; 34(1):12–29. [PubMed: 23068074]
22. Hotamisligil GS. Inflammation and metabolic disorders. Nature. 2006; 444(7121):860–867. [PubMed: 17167474]
23. Pelicano H, Lu W, Zhou Y, Zhang W, Chen Z, Hu Y, et al. Mitochondrial dysfunction and reactive oxygen species imbalance promote breast cancer cell motility through a CXCL14-mediated mechanism. Cancer Research. 2009; 69(6):2375–2383. [PubMed: 19276362]
24. Birben E, Sahiner UM, Sackesen C, Erzurum S, Kalayci O. Oxidative stress and antioxidant defense. The World Allergy Organization Journal. 2012; 5(1):9–19. [PubMed: 23268465]
25. Vandanmagsar B, Youm YH, Ravussin A, Galgani JE, Stadler K, Mynatt RL, et al. The NLRP3 inflammasome instigates obesity-induced inflammation and insulin resistance. Nature Medicine. 2011; 17(2):179–188.
26. Tack CJ, Stienstra R, Joosten LA, Netea MG. Inflammation links excess fat to insulin resistance: the role of the interleukin-1 family. Immunological Reviews. 2012; 249(1):239–252. [PubMed: 22889226]
27. Wen H, Gris D, Lei Y, Jha S, Zhang L, Huang MT, et al. Fatty acid-induced NLRP3-ASC inflammasome activation interferes with insulin signaling. Nature Immunology. 2011; 12(5):408–415. [PubMed: 21478880]
28. Cedikova M, Kripnerova M, Dvorakova J, Pitule P, Grundmanova M, Babuska V, et al. Mitochondria in white, brown, and beige adipocytes. Stem cells International. 2016; 2016:6067349. [PubMed: 27073398]
29. Stienstra R, Tack CJ, Kanneganti TD, Joosten LA, Netea MG. The inflammasome puts obesity in the danger zone. Cell Metabolism. 2012; 15(1):10–18. [PubMed: 22225872]
30. Benetti E, Chiazza F, Patel NS, Collino M. The NLRP3 Inflammasome as a novel player of the intercellular crosstalk in metabolic disorders. Mediators of Inflammation. 2013; 2013:678627. [PubMed: 23843683]
31. Bae J, Chen J, Zhao L. Chronic activation of pattern recognition receptors suppresses brown adipogenesis of multipotent mesodermal stem cells and brown pre-adipocytes. Biochemistry and cell biology = Biochimie et biologie cellulaire. 2015; 93(3):251–261. [PubMed: 25741603]
Okla et al. Page 14
Inflammation. Author manuscript; available in PMC 2018 July 30.
Author M
anuscriptA
uthor Manuscript
Author M
anuscriptA
uthor Manuscript
32. Finlin BS, Zhu B, Confides AL, Westgate PM, Harfmann BD, Dupont-Versteegden EE, et al. Mast cells promote seasonal white adipose beiging in humans. Diabetes. 2017; 66(5):1237–1246. [PubMed: 28250021]
33. Dowal L, Parameswaran P, Phat S, Akella S, Majumdar ID, Ranjan J, et al. Intrinsic properties of brown and white adipocytes have differential effects on macrophage inflammatory responses. Mediators of Inflammation. 2017; 2017:9067049. [PubMed: 28458470]
34. Bi P, Shan T, Liu W, Yue F, Yang X, Liang XR, et al. Inhibition of Notch signaling promotes browning of white adipose tissue and ameliorates obesity. Nature Medicine. 2014; 20(8):911–918.
35. Altshuler-Keylin S, Kajimura S. Mitochondrial homeostasis in adipose tissue remodeling. Science signaling. 2017; 10(468)
36. Zhang Y, Goldman S, Baerga R, Zhao Y, Komatsu M, Jin S. Adipose-specific deletion of autophagy-related gene 7 (atg7) in mice reveals a role in adipogenesis. Proceedings of the National Academy of Sciences of the United States of America. 2009; 106(47):19860–19865. [PubMed: 19910529]
Okla et al. Page 15
Inflammation. Author manuscript; available in PMC 2018 July 30.
Author M
anuscriptA
uthor Manuscript
Author M
anuscriptA
uthor Manuscript
Fig. 1. LPS-induced TLR4 activation attenuates β3AR-induced thermogenesis and prevents WAT
browning. a–f C57BL/6 male mice received i.p. injections of either saline (control), CL, or
LPS+CL as described in experimental procedures (n = 6–8). a Representative thermography
captured by IR camera. b Mean surface body temperature recorded by IR camera. c Relative
Tlr4 mRNA level in inguinal sWAT. d Body weight changes over the course of
administering either CL or LPS+CL. e Representative microscopic images of H&E staining
for sWAT (scale bar = 100 µm). f Relative gene expression analysis by qPCR of sWAT. g hASC exposed to BMP7-conditioned medium in the presence or absence of LPS (100 ng/ml
before and during adipocyte differentiation), and followed by Bt2-cAMP (0.5mM)
stimulation for 7 h before harvesting mRNA. g and h Cultures of primary human adipocytes
differentiated from human adipose-derived stem cells (hASC) as explained in experimental
procedures. g (top panel) Phase contrast images for adipocytes 10 days after differentiation
(scale bar = 400 µm). Arrows indicate the time line for LPS and BMP7 addition and
initiation of adipocyte differentiation by adding differentiation medium (DM) and adipocyte
Okla et al. Page 16
Inflammation. Author manuscript; available in PMC 2018 July 30.
Author M
anuscriptA
uthor Manuscript
Author M
anuscriptA
uthor Manuscript
maintenance medium (AM). g (bottom panel) Relative gene expression analysis by qPCR. h hASC exposed to LPS (100 ng/ml) before and during differentiation, and followed by Bt2-
cAMP (0.5 mM) stimulation for 7 h before harvesting mRNA. h (top panel) Phase contrast
images for adipocytes 10 days after differentiation (scale bar = 400 µm). Arrows indicate the
time line for LPS addition and initiation of adipocyte differentiation (DM) and maintenance
(AM). h (bottom panel) Relative gene expression analysis by qPCR. All data are presented
as mean ± SEM. *P < 0.05, **P < 0.01, ***P < 0.001, and ****P < 0.0001 by Student’s t test. Values not sharing a common letter differ significantly (P < 0.05) by one-way ANOVA.
sWAT, subcutaneous white adipose tissue; CL, CL-316,243; LPS, lipopolysaccharides;
BMP7, bone morphogenic protein; UCP1, uncoupling protein 1; PGC1α, peroxisome
proliferator-activated receptor gamma coactivator 1-alpha; CIDEA, cell death-inducing
DFFA-like effector A; TNF-α, tumor necrosis factor-alpha; IL-1β, interleukin-1 beta;
MCP1, monocyte chemoattractant protein-1.
Okla et al. Page 17
Inflammation. Author manuscript; available in PMC 2018 July 30.
Author M
anuscriptA
uthor Manuscript
Author M
anuscriptA
uthor Manuscript
Fig. 2. Absence of TLR4 protects from the influence of LPS on adaptive thermogenesis, WAT
browning, and mitochondrial integrity. a Body weight changes over the course of
administering either CL or LPS+CL to the Tlr4-null male mice (n = 6–8). b Representative
images of H&E staining for sWAT of TLR4 KO mice (scale bar = 100 µm). c and d Relative
gene expression analysis by qPCR of sWAT obtained from TLR4 KO mice received either
CL or LPS+CL. e Relative mtDNA contents in axillary sWAT of LPS and LPS+CL-injected
TLR4 KO mice. f OCR measurements by Seahorse extracellular analyzer for TLR4-
deficient primary mouse adipocytes differentiated from subcutaneous fat-derived stem cell
from TLR-deficient male mice, and treated with either vehicle or LPS. Arrow indicates the
addition of respiratory inhibitors of oligomycin (Oligo), FCCP, and rotenone plus antimycin
A (Rot+AA) (two-way ANOVA, P > 0.05). All data are presented as mean ± SEM. *P <
0.05 and **P < 0.01 by Student’s t test. ns, not significant; nd, not detected.
Okla et al. Page 18
Inflammation. Author manuscript; available in PMC 2018 July 30.
Author M
anuscriptA
uthor Manuscript
Author M
anuscriptA
uthor Manuscript
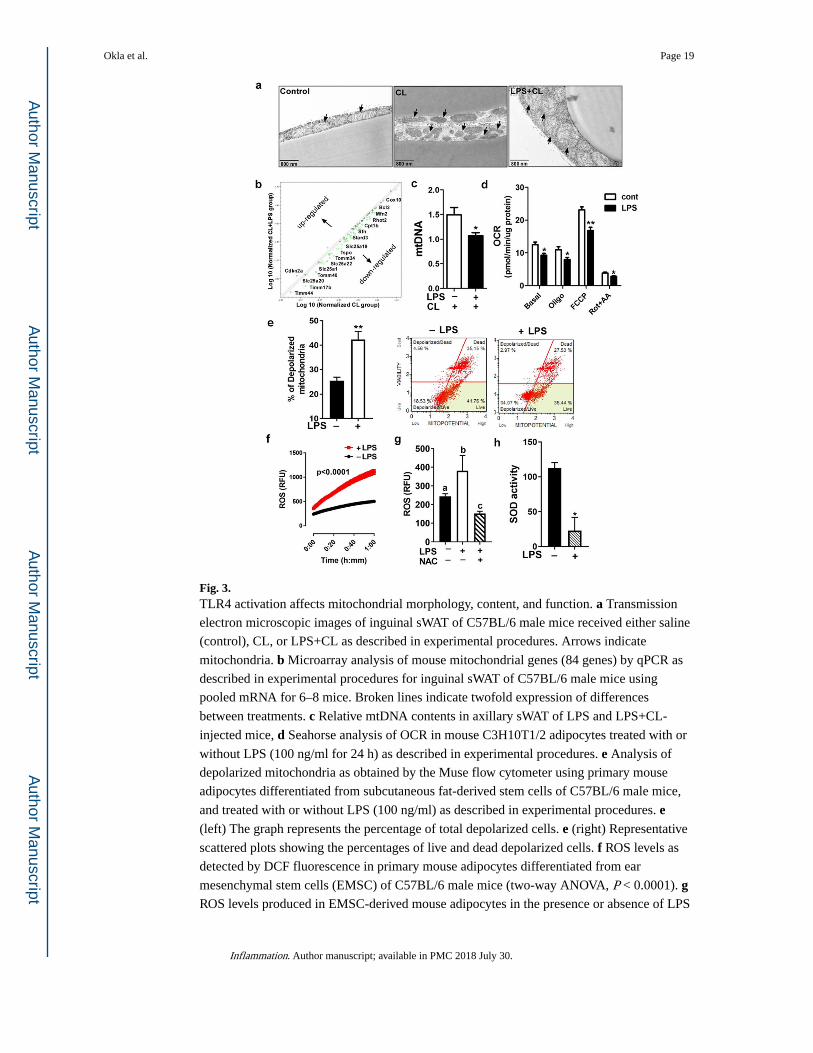
Fig. 3. TLR4 activation affects mitochondrial morphology, content, and function. a Transmission
electron microscopic images of inguinal sWAT of C57BL/6 male mice received either saline
(control), CL, or LPS+CL as described in experimental procedures. Arrows indicate
mitochondria. b Microarray analysis of mouse mitochondrial genes (84 genes) by qPCR as
described in experimental procedures for inguinal sWAT of C57BL/6 male mice using
pooled mRNA for 6–8 mice. Broken lines indicate twofold expression of differences
between treatments. c Relative mtDNA contents in axillary sWAT of LPS and LPS+CL-
injected mice, d Seahorse analysis of OCR in mouse C3H10T1/2 adipocytes treated with or
without LPS (100 ng/ml for 24 h) as described in experimental procedures. e Analysis of
depolarized mitochondria as obtained by the Muse flow cytometer using primary mouse
adipocytes differentiated from subcutaneous fat-derived stem cells of C57BL/6 male mice,
and treated with or without LPS (100 ng/ml) as described in experimental procedures. e (left) The graph represents the percentage of total depolarized cells. e (right) Representative
scattered plots showing the percentages of live and dead depolarized cells. f ROS levels as
detected by DCF fluorescence in primary mouse adipocytes differentiated from ear
mesenchymal stem cells (EMSC) of C57BL/6 male mice (two-way ANOVA, P < 0.0001). g ROS levels produced in EMSC-derived mouse adipocytes in the presence or absence of LPS
Okla et al. Page 19
Inflammation. Author manuscript; available in PMC 2018 July 30.
Author M
anuscriptA
uthor Manuscript
Author M
anuscriptA
uthor Manuscript
and NAC. h SOD enzyme activity in EMSC-derived mouse adipocytes as described in
experimental procedures. All data are presented as mean ± SEM. *P < 0.05 and **P < 0.01
by Student’s t test. Values not sharing a common letter differ significantly (P < 0.05) by one-
way ANOVA. mtDNA, mitochondrial DNA; OCR, oxygen consumption rate; ROS, reactive
oxygen species; NAC, n-acetylcysteine; SOD, superoxide dismutase.
Okla et al. Page 20
Inflammation. Author manuscript; available in PMC 2018 July 30.
Author M
anuscriptA
uthor Manuscript
Author M
anuscriptA
uthor Manuscript
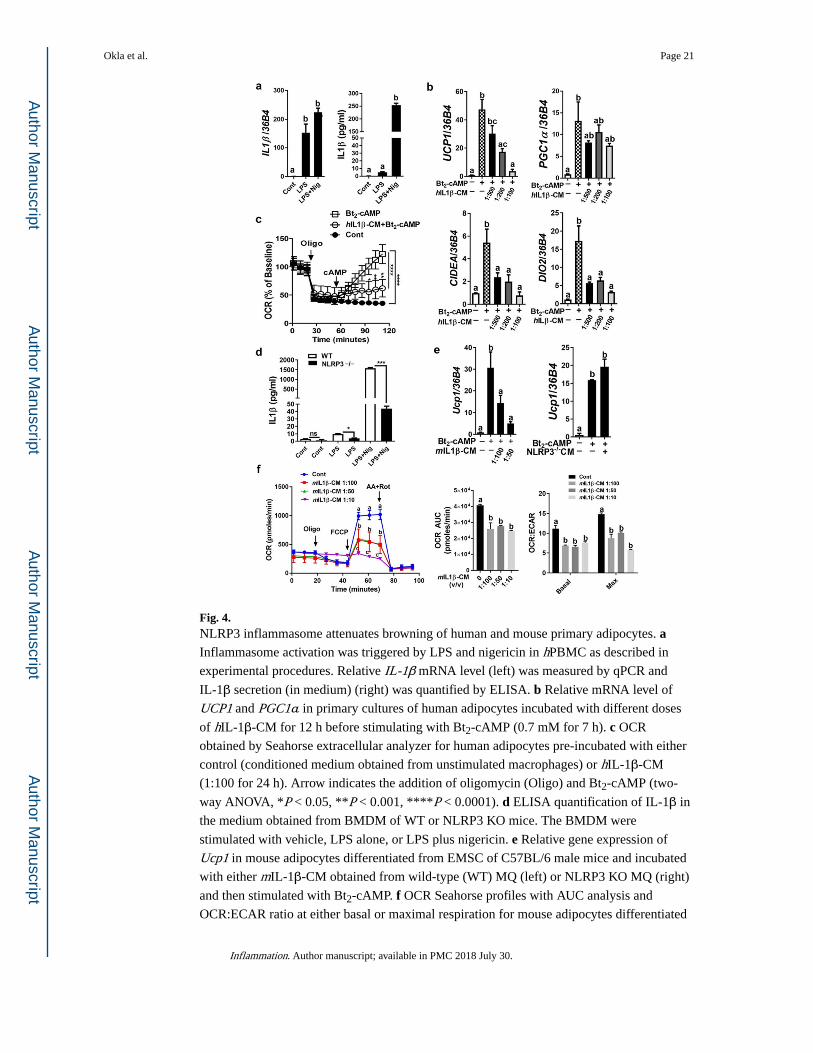
Fig. 4. NLRP3 inflammasome attenuates browning of human and mouse primary adipocytes. a Inflammasome activation was triggered by LPS and nigericin in hPBMC as described in
experimental procedures. Relative IL-1β mRNA level (left) was measured by qPCR and
IL-1β secretion (in medium) (right) was quantified by ELISA. b Relative mRNA level of
UCP1 and PGC1α in primary cultures of human adipocytes incubated with different doses
of hIL-1β-CM for 12 h before stimulating with Bt2-cAMP (0.7 mM for 7 h). c OCR
obtained by Seahorse extracellular analyzer for human adipocytes pre-incubated with either
control (conditioned medium obtained from unstimulated macrophages) or hIL-1β-CM
(1:100 for 24 h). Arrow indicates the addition of oligomycin (Oligo) and Bt2-cAMP (two-
way ANOVA, *P < 0.05, **P < 0.001, ****P < 0.0001). d ELISA quantification of IL-1β in
the medium obtained from BMDM of WT or NLRP3 KO mice. The BMDM were
stimulated with vehicle, LPS alone, or LPS plus nigericin. e Relative gene expression of
Ucp1 in mouse adipocytes differentiated from EMSC of C57BL/6 male mice and incubated
with either mIL-1β-CM obtained from wild-type (WT) MQ (left) or NLRP3 KO MQ (right)
and then stimulated with Bt2-cAMP. f OCR Seahorse profiles with AUC analysis and
OCR:ECAR ratio at either basal or maximal respiration for mouse adipocytes differentiated
Okla et al. Page 21
Inflammation. Author manuscript; available in PMC 2018 July 30.
Author M
anuscriptA
uthor Manuscript
Author M
anuscriptA
uthor Manuscript
from EMSC of WT mice, and treated with different doses of mIL-1β-CM from WT MQ
(two-way ANOVA, values not sharing a common letter differ significantly, P < 0.05). All
data are presented as mean ± SEM. *P < 0.05, **P < 0.01, and ***P < 0.001 by Student’s t test. Values not sharing a common letter differ significantly (P < 0.05) by one-way ANOVA.
AUC, area under the curve; ECAR, extracellular acidification rate.
Okla et al. Page 22
Inflammation. Author manuscript; available in PMC 2018 July 30.
Author M
anuscriptA
uthor Manuscript
Author M
anuscriptA
uthor Manuscript
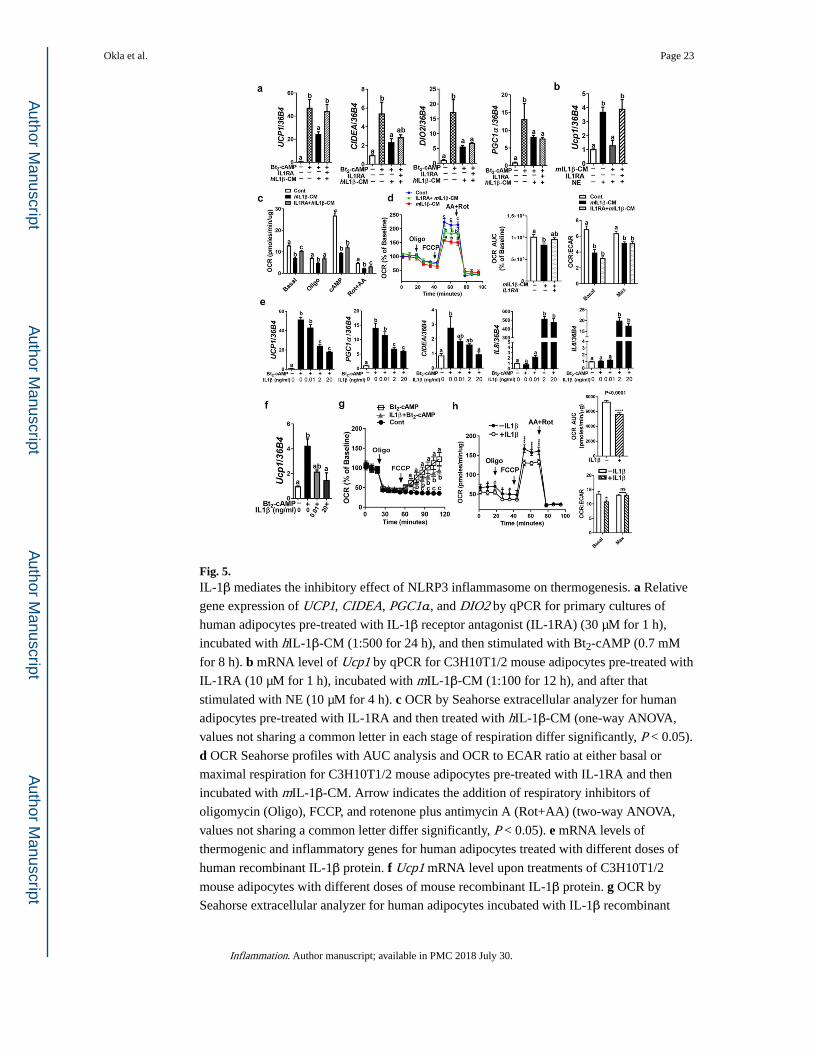
Fig. 5. IL-1β mediates the inhibitory effect of NLRP3 inflammasome on thermogenesis. a Relative
gene expression of UCP1, CIDEA, PGC1α, and DIO2 by qPCR for primary cultures of
human adipocytes pre-treated with IL-1β receptor antagonist (IL-1RA) (30 µM for 1 h),
incubated with hIL-1β-CM (1:500 for 24 h), and then stimulated with Bt2-cAMP (0.7 mM
for 8 h). b mRNA level of Ucp1 by qPCR for C3H10T1/2 mouse adipocytes pre-treated with
IL-1RA (10 µM for 1 h), incubated with mIL-1β-CM (1:100 for 12 h), and after that
stimulated with NE (10 µM for 4 h). c OCR by Seahorse extracellular analyzer for human
adipocytes pre-treated with IL-1RA and then treated with hIL-1β-CM (one-way ANOVA,
values not sharing a common letter in each stage of respiration differ significantly, P < 0.05).
d OCR Seahorse profiles with AUC analysis and OCR to ECAR ratio at either basal or
maximal respiration for C3H10T1/2 mouse adipocytes pre-treated with IL-1RA and then
incubated with mIL-1β-CM. Arrow indicates the addition of respiratory inhibitors of
oligomycin (Oligo), FCCP, and rotenone plus antimycin A (Rot+AA) (two-way ANOVA,
values not sharing a common letter differ significantly, P < 0.05). e mRNA levels of
thermogenic and inflammatory genes for human adipocytes treated with different doses of
human recombinant IL-1β protein. f Ucp1 mRNA level upon treatments of C3H10T1/2
mouse adipocytes with different doses of mouse recombinant IL-1β protein. g OCR by
Seahorse extracellular analyzer for human adipocytes incubated with IL-1β recombinant
Okla et al. Page 23
Inflammation. Author manuscript; available in PMC 2018 July 30.
Author M
anuscriptA
uthor Manuscript
Author M
anuscriptA
uthor Manuscript
protein (20 ng/ml for 24 h) (two-way ANOVA, values not sharing a common letter differ
significantly, P < 0.05). h OCR Seahorse profiles with AUC analysis and OCR to ECAR
ratio at either basal or maximal respiration for C3H10T1/2 mouse adipocytes in the presence
or absence of IL-1β recombinant protein (2 ng/ml for 24 h) (two-way ANOVA, *P < 0.05,
****P < 0.0001). All data are presented as mean ± SEM. *P < 0.05, **P < 0.01, and ***P <
0.001 by Student’s t test. Values not sharing a common letter differ significantly (P < 0.05)
by one-way ANOVA.
Okla et al. Page 24
Inflammation. Author manuscript; available in PMC 2018 July 30.
Author M
anuscriptA
uthor Manuscript
Author M
anuscriptA
uthor Manuscript
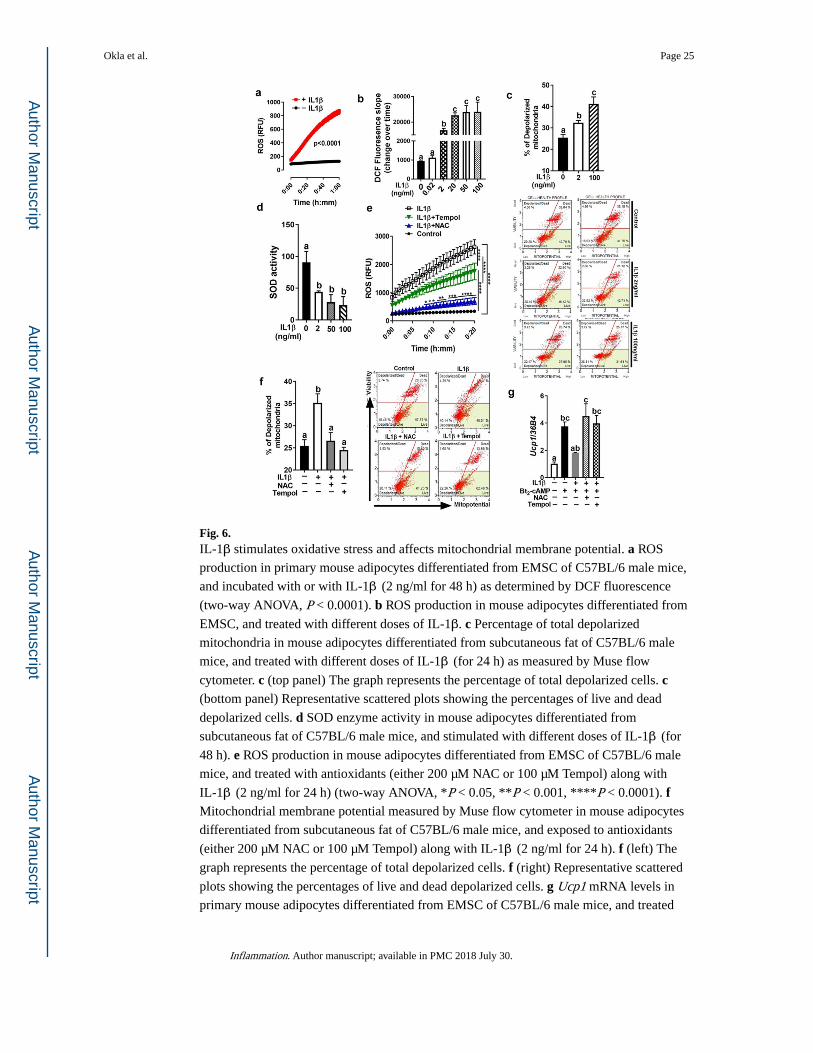
Fig. 6. IL-1β stimulates oxidative stress and affects mitochondrial membrane potential. a ROS
production in primary mouse adipocytes differentiated from EMSC of C57BL/6 male mice,
and incubated with or with IL-1β (2 ng/ml for 48 h) as determined by DCF fluorescence
(two-way ANOVA, P < 0.0001). b ROS production in mouse adipocytes differentiated from
EMSC, and treated with different doses of IL-1β. c Percentage of total depolarized
mitochondria in mouse adipocytes differentiated from subcutaneous fat of C57BL/6 male
mice, and treated with different doses of IL-1β (for 24 h) as measured by Muse flow
cytometer. c (top panel) The graph represents the percentage of total depolarized cells. c (bottom panel) Representative scattered plots showing the percentages of live and dead
depolarized cells. d SOD enzyme activity in mouse adipocytes differentiated from
subcutaneous fat of C57BL/6 male mice, and stimulated with different doses of IL-1β (for
48 h). e ROS production in mouse adipocytes differentiated from EMSC of C57BL/6 male
mice, and treated with antioxidants (either 200 µM NAC or 100 µM Tempol) along with
IL-1β (2 ng/ml for 24 h) (two-way ANOVA, *P < 0.05, **P < 0.001, ****P < 0.0001). f Mitochondrial membrane potential measured by Muse flow cytometer in mouse adipocytes
differentiated from subcutaneous fat of C57BL/6 male mice, and exposed to antioxidants
(either 200 µM NAC or 100 µM Tempol) along with IL-1β (2 ng/ml for 24 h). f (left) The
graph represents the percentage of total depolarized cells. f (right) Representative scattered
plots showing the percentages of live and dead depolarized cells. g Ucp1 mRNA levels in
primary mouse adipocytes differentiated from EMSC of C57BL/6 male mice, and treated
Okla et al. Page 25
Inflammation. Author manuscript; available in PMC 2018 July 30.
Author M
anuscriptA
uthor Manuscript
Author M
anuscriptA
uthor Manuscript
with either NAC (200 µM) or Tempol (200 µM) along with IL-1β (2 ng/ml for 24 h) as
determined by qPCR. All data are presented as mean ± SEM. Values not sharing a common
letter differ significantly (P < 0.05) by one-way ANOVA.
Okla et al. Page 26
Inflammation. Author manuscript; available in PMC 2018 July 30.
Author M
anuscriptA
uthor Manuscript
Author M
anuscriptA
uthor Manuscript
Supplementary Material
Inhibitory effects of Toll-like receptor 4, NLRP3 inflammasome, and interleukin-1β on
white adipocyte browning
Meshail Okla1,2,*, Walid Zaher3,4, Musaad Alfayez5, Soonkyu Chung1
1 Department of Nutrition and Health Sciences, University of Nebraska-Lincoln, Lincoln, NE, United States
2 Department of Community Health Sciences, College of Applied Medical Sciences, King Saud University,
Riyadh, Saudi Arabia
3 College of Medicine Research Center, College of Medicine, King Saud University, Riyadh, Saudi Arabia
4 Department of Anatomy, College of Medicine, King Saud University, Riyadh, Saudi Arabia
5 Stem Cell Unit, Department of Anatomy, College of Medicine, King Saud University, Riyadh, Saudi Arabia
*To whom correspondence should be addressed: Meshail Okla, Ph.D., Department of Community Health Sciences,
College of Applied Medical Sciences, King Saud University, 183T11, P.O. Box 22452, Riyadh, Saudi Arabia,
11495, Tel: +966 11 80 58 401, E-mail address: [email protected]
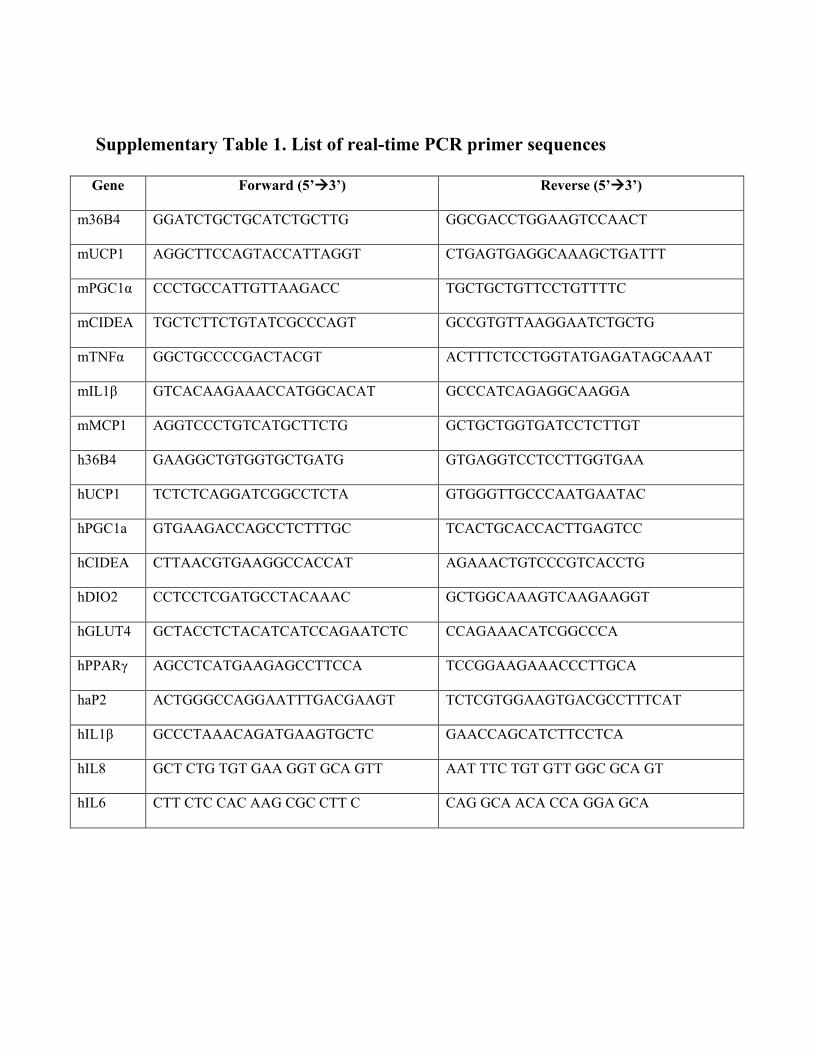
Supplementary Table 1. List of real-time PCR primer sequences
Gene Forward (5’3’) Reverse (5’3’)
m36B4 GGATCTGCTGCATCTGCTTG GGCGACCTGGAAGTCCAACT
mUCP1 AGGCTTCCAGTACCATTAGGT CTGAGTGAGGCAAAGCTGATTT
mPGC1α CCCTGCCATTGTTAAGACC TGCTGCTGTTCCTGTTTTC
mCIDEA TGCTCTTCTGTATCGCCCAGT GCCGTGTTAAGGAATCTGCTG
mTNFα GGCTGCCCCGACTACGT ACTTTCTCCTGGTATGAGATAGCAAAT
mIL1β GTCACAAGAAACCATGGCACAT GCCCATCAGAGGCAAGGA
mMCP1 AGGTCCCTGTCATGCTTCTG GCTGCTGGTGATCCTCTTGT
h36B4 GAAGGCTGTGGTGCTGATG GTGAGGTCCTCCTTGGTGAA
hUCP1 TCTCTCAGGATCGGCCTCTA GTGGGTTGCCCAATGAATAC
hPGC1a GTGAAGACCAGCCTCTTTGC TCACTGCACCACTTGAGTCC
hCIDEA CTTAACGTGAAGGCCACCAT AGAAACTGTCCCGTCACCTG
hDIO2 CCTCCTCGATGCCTACAAAC GCTGGCAAAGTCAAGAAGGT
hGLUT4 GCTACCTCTACATCATCCAGAATCTC CCAGAAACATCGGCCCA
hPPARγ AGCCTCATGAAGAGCCTTCCA TCCGGAAGAAACCCTTGCA
haP2 ACTGGGCCAGGAATTTGACGAAGT TCTCGTGGAAGTGACGCCTTTCAT
hIL1β GCCCTAAACAGATGAAGTGCTC GAACCAGCATCTTCCTCA
hIL8 GCT CTG TGT GAA GGT GCA GTT AAT TTC TGT GTT GGC GCA GT
hIL6 CTT CTC CAC AAG CGC CTT C CAG GCA ACA CCA GGA GCA
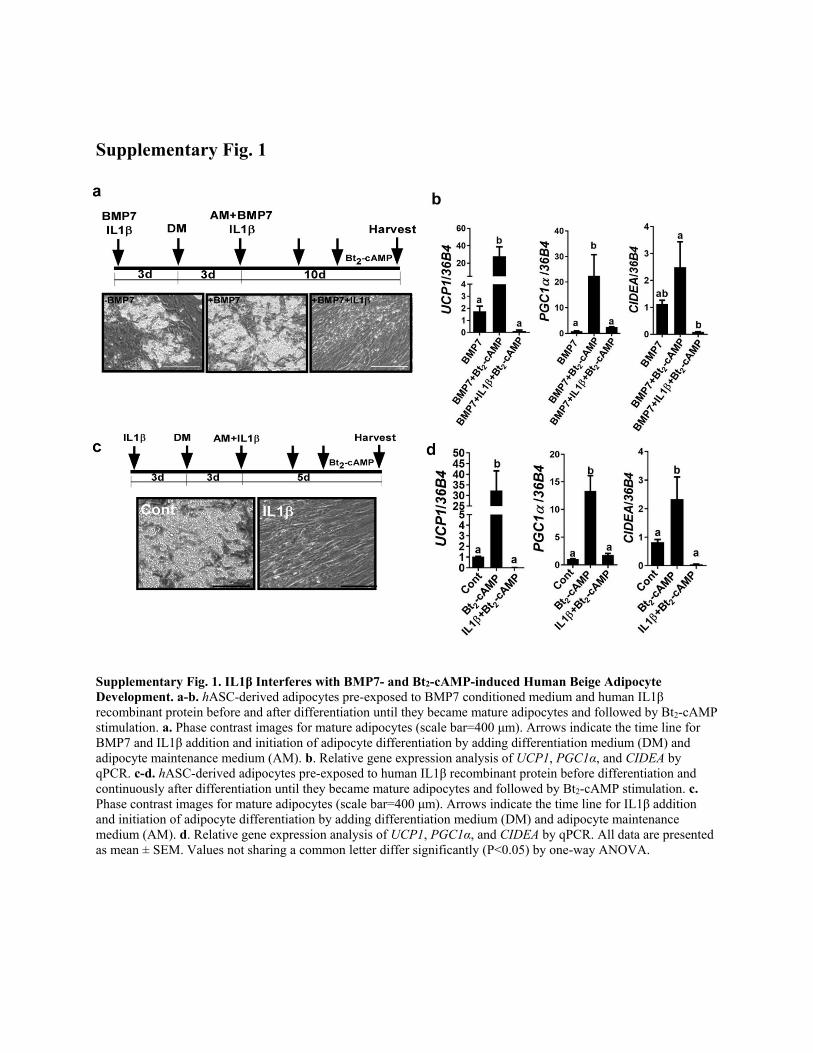
Supplementary Fig. 1
Supplementary Fig. 1. IL1β Interferes with BMP7- and Bt2-cAMP-induced Human Beige Adipocyte
Development. a-b. hASC-derived adipocytes pre-exposed to BMP7 conditioned medium and human IL1β
recombinant protein before and after differentiation until they became mature adipocytes and followed by Bt2-cAMP
stimulation. a. Phase contrast images for mature adipocytes (scale bar=400 μm). Arrows indicate the time line for
BMP7 and IL1β addition and initiation of adipocyte differentiation by adding differentiation medium (DM) and
adipocyte maintenance medium (AM). b. Relative gene expression analysis of UCP1, PGC1α, and CIDEA by
qPCR. c-d. hASC-derived adipocytes pre-exposed to human IL1β recombinant protein before differentiation and
continuously after differentiation until they became mature adipocytes and followed by Bt2-cAMP stimulation. c.
Phase contrast images for mature adipocytes (scale bar=400 μm). Arrows indicate the time line for IL1β addition
and initiation of adipocyte differentiation by adding differentiation medium (DM) and adipocyte maintenance
medium (AM). d. Relative gene expression analysis of UCP1, PGC1α, and CIDEA by qPCR. All data are presented
as mean ± SEM. Values not sharing a common letter differ significantly (P<0.05) by one-way ANOVA.