INERTIA FRICTION WELDING OF NICKEL BASE · PDF fileINERTIA FRICTION WELDING OF NICKEL BASE...
28
1 INERTIA FRICTION WELDING OF NICKEL BASE SUPERALLOYS FOR AEROSPACE APPLICATIONS G.J. Baxter 1 , M. Preuss 2 and P.J. Withers 2 1 Manchester Materials Science Centre, UMIST/University of Manchester, Grosvenor St., Manchester M1 7HS, UK 2 Rolls-Royce plc, Derby DE24 8BJ, UK INTRODUCTION A new generation of nickel-base superalloys having a significantly higher volume fraction of γ′ then conventional superalloys has been developed in order to meet the demand for better high temperature properties. These alloys are typically very difficult to weld and are prone to micro-cracking as solidification takes place during welding [1, 2]. Therefore inertia friction welding is a very attractive joining process since it does not involve any melting, provided optimum welding parameters are chosen. Furthermore, it is more suitable for production than electron beam welding since it does not require a vacuum environment [3]. Inertia friction welding also enables one to weld dissimilar alloys, which can be difficult by other means. Rolls-Royce is employing inertia friction welding to join high pressure compressor drums, turbine discs and shafts on the recently installed 2000 ton force inertia welder near Nottingham, UK (Fig. 1). During inertia friction welding, one of the work pieces is connected to a flywheel and the other is restrained from rotating. The flywheel is accelerated to a predetermined rotational speed then disengaged and the work pieces are forced together by applying axial pressure. This first stage of inertia friction welding ends when the nominal pressure has been achieved and can be characterized by an initial torque peak (Fig. 2). At this point, the parts have not lost any axial length (loss in length, U = 0). During the second or conditioning stage, kinetic
Transcript of INERTIA FRICTION WELDING OF NICKEL BASE · PDF fileINERTIA FRICTION WELDING OF NICKEL BASE...

1
INERTIA FRICTION WELDING OF NICKEL BASE SUPERALLOYS
FOR AEROSPACE APPLICATIONS
G.J. Baxter1, M. Preuss2 and P.J. Withers2
1 Manchester Materials Science Centre, UMIST/University of Manchester, Grosvenor St.,
Manchester M1 7HS, UK
2 Rolls-Royce plc, Derby DE24 8BJ, UK
INTRODUCTION
A new generation of nickel-base superalloys having a significantly higher volume fraction of
γ′ then conventional superalloys has been developed in order to meet the demand for better
high temperature properties. These alloys are typically very difficult to weld and are prone to
micro-cracking as solidification takes place during welding [1, 2]. Therefore inertia friction
welding is a very attractive joining process since it does not involve any melting, provided
optimum welding parameters are chosen. Furthermore, it is more suitable for production than
electron beam welding since it does not require a vacuum environment [3]. Inertia friction
welding also enables one to weld dissimilar alloys, which can be difficult by other means.
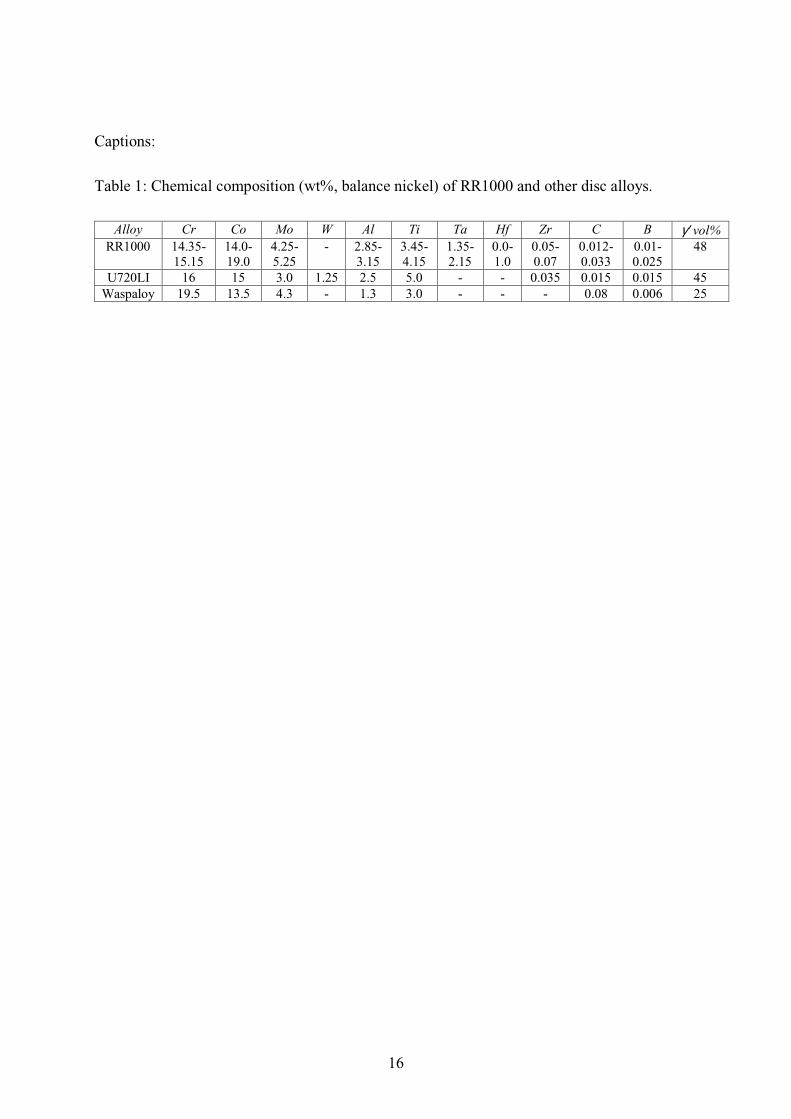
Rolls-Royce is employing inertia friction welding to join high pressure compressor drums,
turbine discs and shafts on the recently installed 2000 ton force inertia welder near
Nottingham, UK (Fig. 1).
During inertia friction welding, one of the work pieces is connected to a flywheel and the
other is restrained from rotating. The flywheel is accelerated to a predetermined rotational
speed then disengaged and the work pieces are forced together by applying axial pressure.
This first stage of inertia friction welding ends when the nominal pressure has been achieved
and can be characterized by an initial torque peak (Fig. 2). At this point, the parts have not
lost any axial length (loss in length, U = 0). During the second or conditioning stage, kinetic
2
energy stored in the rotating flywheel is dissipated as heat through friction at the weld
interface. This takes place over a short time span with a reasonably flat torque curve. This
means that the material reaches forging temperature at the interface within 2 to 10 seconds,
depending on the material and welding parameters. As a result of the axial pressure and the
continued high energy input to the weld interface, material is squeezed out at the interface
resulting in weld flash and loss in length from both parts (stage 3). In the final or forging
stage the flywheel slows to zero speed and material in the weld interface region is lost in the
flash. This stage is characterized by a second sharp torque peak, because the temperature of
the material at the weld line has started to decrease. The pressure is maintained after all
kinetic energy has been imparted to ensure a sound metallurgical joint. In order to generate
joints with a correct loss in length and optimum metallurgy a detailed understanding of the
inertia friction welding parameters is essential.
One alloy, which at the present time can only be welded by inertia friction welding is
RR1000, a recently developed powder-processed, high strength nickel-based superalloy. It
comprises a high volume fraction of primary γ ′ (1-3 µm), secondary γ ′ (50-500 nm) and
tertiary γ ′ (5-30 nm). In the parent alloy, particles of γ ′ , which remain undissolved during
the solution heat treatment stage (primary γ ′ ), delineate γ-grain boundaries while
intragranular γ ′ precipitates upon cooling with a bimodal distribution (secondary and tertiary
γ ′ ). Whereas particles of secondary γ ′ nucleate at an early stage during cooling from the
solution temperature, tertiary γ ′ nucleates at a lower temperature, when diffusion rates are
slow and secondary γ ′ cannot grow sufficiently quickly during cooling [4].
This paper presents results from investigations of residual stresses, metallurgy and mechanical
properties of inertia friction welded RR1000 joints.
3
EXPERIMENTAL
Materials and Specimens
The chemical composition of RR1000 [5] is listed in Table 1 alongside those for UDIMET
720LI & Waspaloy [6] for comparison. This shows that RR1000 has a much larger wt% of
Al and Ti than Waspaloy and consequently a significantly higher volume fraction of γ′ (γ′ is
(Ni, Co)3 (Al, Ti) [7]). This is expected to affect markedly the development of microstructure
and residual stress during inertia friction welding. The RR1000 material used for this
investigation came from an isothermal pancake forging, fully heat-treated and annealed.
Rings were machined from the pancake and subsequently inertia welded at MTI, South Bend,
Indiana, USA. All studies were carried out on three welds made with the same welding
parameters. Weld 1 was examined in the as-welded condition and weld 2 was post weld heat
treated (PWHT’d) using an conventional post weld heat treatment. After the initial round of
residual stress measurements, weld 1 was given a modified PWHT that was 50°C above the
established one. Weld 3 was sectioned to study the microstructure and mechanical properties
of the three different conditions.
Neutron diffraction measurements
All measurements were carried out on the ENGIN diffractometer at the ISIS neutron
spallation source, Rutherford Appleton Laboratory, UK. At pulsed neutron sources, neutrons
of all wavelengths emerge over a short time pulse from the source. With detectors placed at a
given angle the whole diffraction profile can be recorded as a function of time of flight (TOF)
[8]. The sampling gauge volume is defined by the intersection of the incident and diffracted
beams. The lattice parameter, a, of the lattice planes with plane normal besecting the incident
and diffracted beams, averaged over the correctly oriented grains within the sampling volume,
was determined by Rietveld refinement of the spectra [9]. A more detailed description of the
application of neutron diffraction for engineering strain scanning can be found elsewhere [10,

4
11]. The variation in the lattice spacing was mapped out over a cross-sectional plane at a
specific hoop location for all three specimens over a region extending from the weld line up to
8 mm away from it. A previous experiment [12] had indicated that the residual stresses in a
similar weld were essentially symmetric about the weld line (z = 0). Consequently,
measurements were only made on one half of the coordinate system (z > 0). The sample
coordinate system as defined for the experiment is shown in Fig. 3.
The strains were calculated at all points using:
)(
)(),(),(
0
0
za
zazrazr
−=ε (1)
where a0 is the stress-free lattice parameter.
It was shown in [13] that the stress-free lattice spacing varies only as a function of z. As a
consequence, it can be determined by forcing the axial stresses to be balanced across the wall
section. Note that for a tubular structure moment need not balance across a single tube wall.
The corresponding axial, radial and hoop residual stress fields for the three welds were
calculated using:
)]()1[()21)(1( hoopradialaxialaxial
E εενεννν
σ ++−−+
= , etc (2)
where E is the bulk Young’s modulus, and ν the Poisson’s ratio. Use of the bulk value of E
was justified because the Rietveld refinement included 7 diffraction peaks. Even though all
stress directions were calculated, this paper only presents the results of the hoop stress fields
as they are of the largest magnitude and therefore of most interest.
Hole drilling
Without compensation, neutron diffraction strain measurements made very near to the surface
are vulnerable to serious errors, when the gauge volume is not fully immersed in the bulk

5
material [14]. The recorded diffraction peak is a statistical distribution of the contributions
from all the diffracting crystals in the gauge volume. When the gauge volume is only half
immersed in the material, the statistical distribution of the diffraction peak is changed and
results in a so-called geometrical pseudostrain [15]. Therefore, hole-drilling is a more
appropriate technique for near surface residual stress measurements. Residual stresses have
been determined from strain measurements using the target strain gauge / center hole drilling
method to a maximum depth of 0.64 mm from the surface (gauge length: 0.79 mm, drill
diameter: 0.9 mm). Three sets of gauges have been installed in 120° angular locations to each
other at the inner and outer surface of the weld line. The integral method, which is based on a
linear elastic model, was used to calculate the hoop and axial residual stresses from the strain
changes during hole-drilling [16].
Hardness testing
Hardness testing was carried out under a load of 1kg using a calibrated Vickers hardness
indentation machine. For each sample, measurements were carried out on a weld cross
section on a grid of 5 lines parallel to the axial direction and spaced greater than 4
indentations apart. Measurements were taken from the weld line to a distance 9 mm away
from it, with smaller increments close to the weld line. The accuracy of the axial position of
the indentation marks was estimated to be within 20 µm. The results presented are the
average of the 5 measurements per axial position.
Spatially resolved strain measurements during tensile straining
Locally resolved strain measurements were carried out during tensile testing using the
electronic speckle pattern interferometry (ESPI) technique. ESPI is a technique that exploits
the properties of expanded lasers when they are directed at an optically rough surface [17].
When a defocused laser is directed at a diffusely reflecting surface it is scattered in many
directions. These reflected wavelets then interfere constructively or destructively, depending

6
on the observation plane. Interference with an additional reference laser renders the speckle
pattern sensitive to in-plane displacements. The interference between the live and the
previous image (reference image) results in a pattern of correlation fringes, when the
reference image is subtracted from the live image. The spacing of these fringes is related to
the sample displacement. This effect only occurs if coherency is maintained. As a result,
large displacements must be recorded by combining the data from many consecutive laser
speckle measurements. For this experiment, tensile testing was carried out on an Instron
tensile rig equipped with a 50kN load cell and a commercial ‘3D’ ESPI system, produced by
Ettemeyer, Germany. The displacement rate of the head section was 0.01 mm/s, which
corresponds to an initial strain rate of 5 x 10⁻⁴ 1/s with tensile samples having a gauge length
of 20 mm. The tensile samples were cut such that the weld line was normal to the tensile axis
with the weld carefully positioned along the gauge length. During loading, speckle pattern
images were taken every 1.7 seconds resulting in a sufficient number of speckle patterns to
accurately describe the elastic and plastic deformation of the tensile sample as a function of
applied stress. The consecutive speckle patterns were analyzed to produce a series of two
dimensional displacement maps. Since the strain was independent of R, the strains were
averaged at each z value over all R. Given that the strain varies only as a function of z, which
is also the tensile axis, it is fair to assume the stress is the same everywhere. On this basis, it
was possible to infer the stress-strain response as a function of z with a spatial resolution of 30
µm. These stress/strain curves were then used to determine the 0.2 % yield stress as a
function of axial position.
Synchrotron X-ray measurements:
Diffraction profile measurements can be used to assess the fraction of γ′ across the welded
region on the basis of the intensity of the superlattice reflections. To this end, high resolution
synchrotron X-ray diffraction profile measurements were carried out on the ID11 beam line at
7
the European Synchrotron Radiation Facility (ESRF) in Grenoble, France using a scanned
serial detector. The high intensity of the synchrotron beam allowed accurate measurements of
the (100) superlattice reflection, arising from the ordered γ′ phase (LI2 structure). Since the
(100) refection is systematically absent for the disordered γ matrix phase, by normalizing the
integrated intensity of the superlattice reflection with the integrated intensity of the (200)
reflection, any influence of texture variations on the measurement could be eliminated and the
obtained value related to the volume fraction of γ′ [18, 19, 20]. Because large peak
broadening of the (200) reflection was observed around 1 mm from the weld line, the (200)
reflection of the as-welded sample was studied across the weld line in a second synchrotron
experiment on ID31, ESRF, Grenoble. By scanning the (200) reflection with a high level of
accuracy, it was possible to deconvolute the (200) γ and (200) γ′ reflection in the region close
to the weld line. The strain (coherency strain) between the two phases was then calculated
using equation 2.
Electron microscopy and image analysis
The particle size and volume fraction of γ′ as a function of axial position were studied by
using a Philips XL30 FEGSEM in the secondary electron mode at 8 kV at a working distance
of 10 mm. The high resolutions of the FEGSEM allowed the analysis of primary, secondary,
and in the case of the modified post weld heat-treated samples, tertiary γ′. Image analysis of
secondary and tertiary γ′ was carried out using the Kontron KS 400 software package. Five
images at each axial position were taken within γ grains, avoiding primary γ′. Consequently
the determined volume fractions of secondary and tertiary γ′ should be regarded as values in
the centre of γ grains and not a true overall value.
Automated electron backscatter diffraction mapping was employed to study γ grain size
variations across the weld line. During EBSD mapping the beam was scanned over the
8
polished sample, which was tilted 70° to the backscatter detector of a Philips XL30 FEGSEM.
EBSD patterns were detected by a CCD camera with the background subtracted using an
image processor. Seven area maps were acquired across the weld line using a scanning step
size between 0.27 and 0.35 µm. The EBSD data were analyzed using VMAP, an in-house
software development by F.J. Humphreys et al. [21] and the Channel software package [22].
RESULTS AND DISCUSSION
Residual stresses
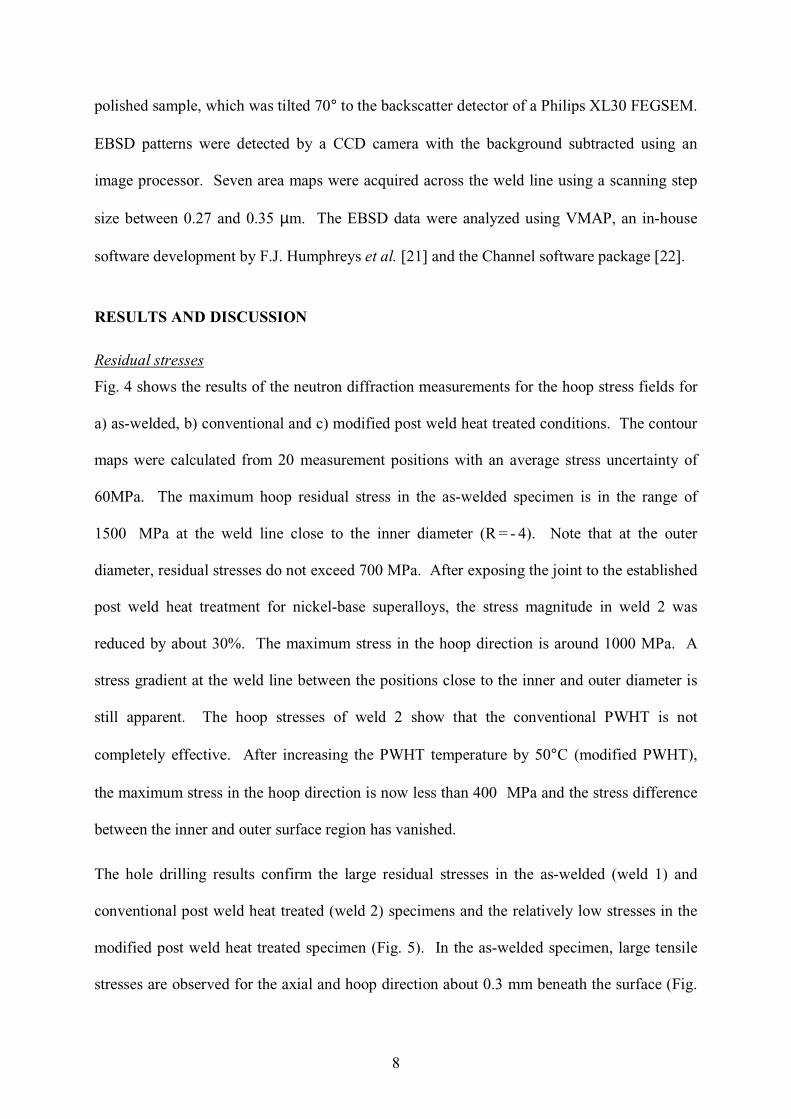
Fig. 4 shows the results of the neutron diffraction measurements for the hoop stress fields for
a) as-welded, b) conventional and c) modified post weld heat treated conditions. The contour
maps were calculated from 20 measurement positions with an average stress uncertainty of
60MPa. The maximum hoop residual stress in the as-welded specimen is in the range of
1500 MPa at the weld line close to the inner diameter (R = - 4). Note that at the outer
diameter, residual stresses do not exceed 700 MPa. After exposing the joint to the established
post weld heat treatment for nickel-base superalloys, the stress magnitude in weld 2 was
reduced by about 30%. The maximum stress in the hoop direction is around 1000 MPa. A
stress gradient at the weld line between the positions close to the inner and outer diameter is
still apparent. The hoop stresses of weld 2 show that the conventional PWHT is not
completely effective. After increasing the PWHT temperature by 50°C (modified PWHT),
the maximum stress in the hoop direction is now less than 400 MPa and the stress difference
between the inner and outer surface region has vanished.
The hole drilling results confirm the large residual stresses in the as-welded (weld 1) and
conventional post weld heat treated (weld 2) specimens and the relatively low stresses in the
modified post weld heat treated specimen (Fig. 5). In the as-welded specimen, large tensile
stresses are observed for the axial and hoop direction about 0.3 mm beneath the surface (Fig.
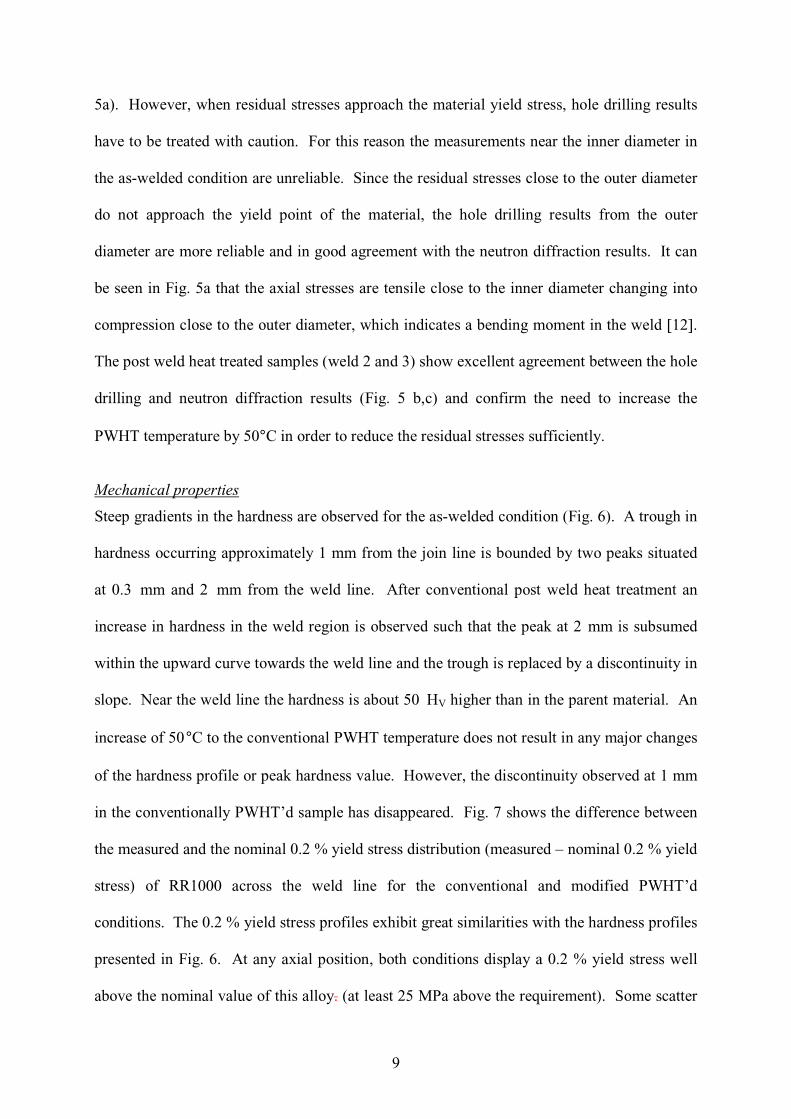
9
5a). However, when residual stresses approach the material yield stress, hole drilling results
have to be treated with caution. For this reason the measurements near the inner diameter in
the as-welded condition are unreliable. Since the residual stresses close to the outer diameter
do not approach the yield point of the material, the hole drilling results from the outer
diameter are more reliable and in good agreement with the neutron diffraction results. It can
be seen in Fig. 5a that the axial stresses are tensile close to the inner diameter changing into
compression close to the outer diameter, which indicates a bending moment in the weld [12].
The post weld heat treated samples (weld 2 and 3) show excellent agreement between the hole
drilling and neutron diffraction results (Fig. 5 b,c) and confirm the need to increase the
PWHT temperature by 50°C in order to reduce the residual stresses sufficiently.
Mechanical properties
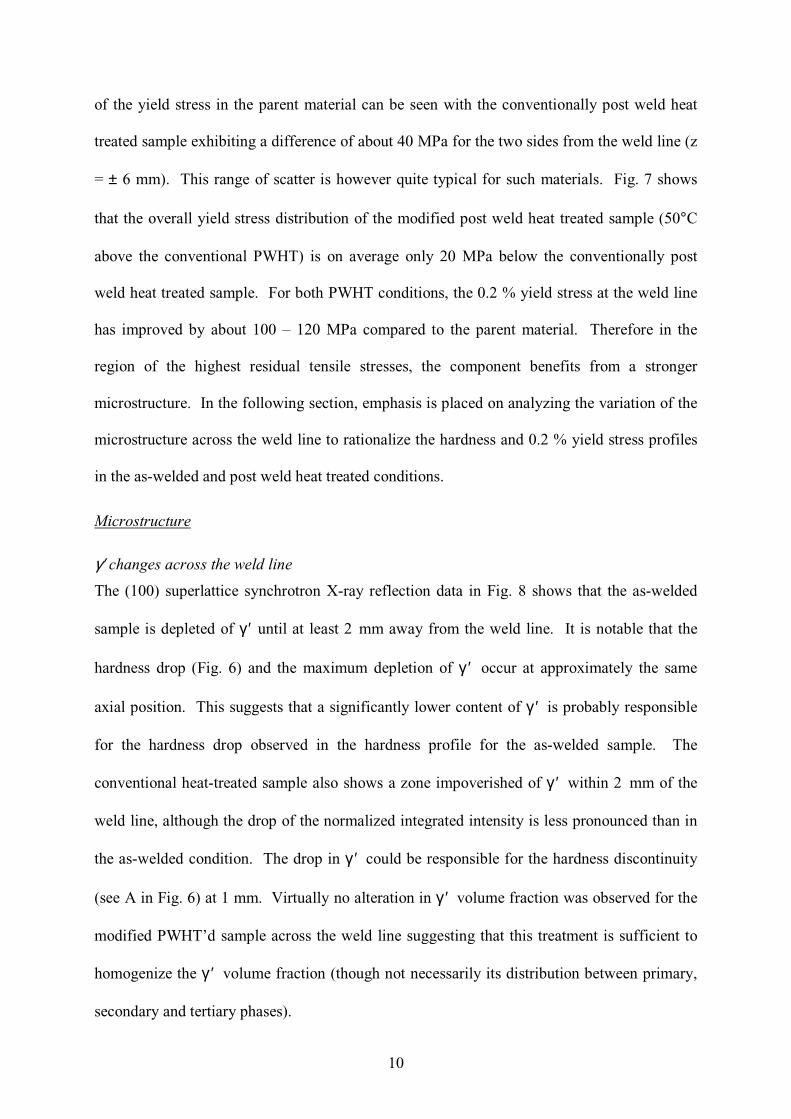
Steep gradients in the hardness are observed for the as-welded condition (Fig. 6). A trough in
hardness occurring approximately 1 mm from the join line is bounded by two peaks situated
at 0.3 mm and 2 mm from the weld line. After conventional post weld heat treatment an
increase in hardness in the weld region is observed such that the peak at 2 mm is subsumed
within the upward curve towards the weld line and the trough is replaced by a discontinuity in
slope. Near the weld line the hardness is about 50 HV higher than in the parent material. An
increase of 50°C to the conventional PWHT temperature does not result in any major changes
of the hardness profile or peak hardness value. However, the discontinuity observed at 1 mm
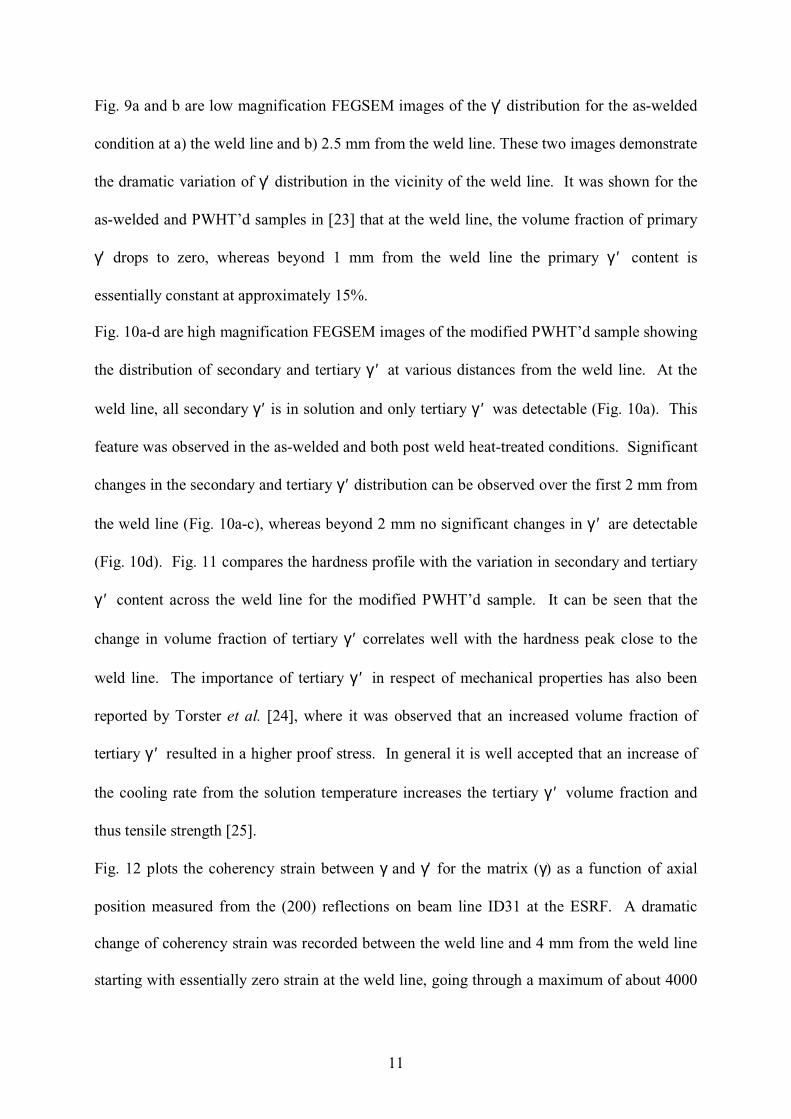
in the conventionally PWHT’d sample has disappeared. Fig. 7 shows the difference between
the measured and the nominal 0.2 % yield stress distribution (measured – nominal 0.2 % yield
stress) of RR1000 across the weld line for the conventional and modified PWHT’d
conditions. The 0.2 % yield stress profiles exhibit great similarities with the hardness profiles
presented in Fig. 6. At any axial position, both conditions display a 0.2 % yield stress well
above the nominal value of this alloy. (at least 25 MPa above the requirement). Some scatter
10
of the yield stress in the parent material can be seen with the conventionally post weld heat
treated sample exhibiting a difference of about 40 MPa for the two sides from the weld line (z
= ± 6 mm). This range of scatter is however quite typical for such materials. Fig. 7 shows
that the overall yield stress distribution of the modified post weld heat treated sample (50°C
above the conventional PWHT) is on average only 20 MPa below the conventionally post
weld heat treated sample. For both PWHT conditions, the 0.2 % yield stress at the weld line
has improved by about 100 – 120 MPa compared to the parent material. Therefore in the
region of the highest residual tensile stresses, the component benefits from a stronger
microstructure. In the following section, emphasis is placed on analyzing the variation of the
microstructure across the weld line to rationalize the hardness and 0.2 % yield stress profiles
in the as-welded and post weld heat treated conditions.
Microstructure
γ′ changes across the weld line
The (100) superlattice synchrotron X-ray reflection data in Fig. 8 shows that the as-welded
sample is depleted of γ ′ until at least 2 mm away from the weld line. It is notable that the
hardness drop (Fig. 6) and the maximum depletion of γ ′ occur at approximately the same
axial position. This suggests that a significantly lower content of γ ′ is probably responsible
for the hardness drop observed in the hardness profile for the as-welded sample. The
conventional heat-treated sample also shows a zone impoverished of γ ′ within 2 mm of the
weld line, although the drop of the normalized integrated intensity is less pronounced than in
the as-welded condition. The drop in γ ′ could be responsible for the hardness discontinuity
(see A in Fig. 6) at 1 mm. Virtually no alteration in γ ′ volume fraction was observed for the
modified PWHT’d sample across the weld line suggesting that this treatment is sufficient to
homogenize the γ ′ volume fraction (though not necessarily its distribution between primary,
secondary and tertiary phases).
11
Fig. 9a and b are low magnification FEGSEM images of the γ′ distribution for the as-welded
condition at a) the weld line and b) 2.5 mm from the weld line. These two images demonstrate
the dramatic variation of γ′ distribution in the vicinity of the weld line. It was shown for the
as-welded and PWHT’d samples in [23] that at the weld line, the volume fraction of primary
γ′ drops to zero, whereas beyond 1 mm from the weld line the primary γ ′ content is
essentially constant at approximately 15%.
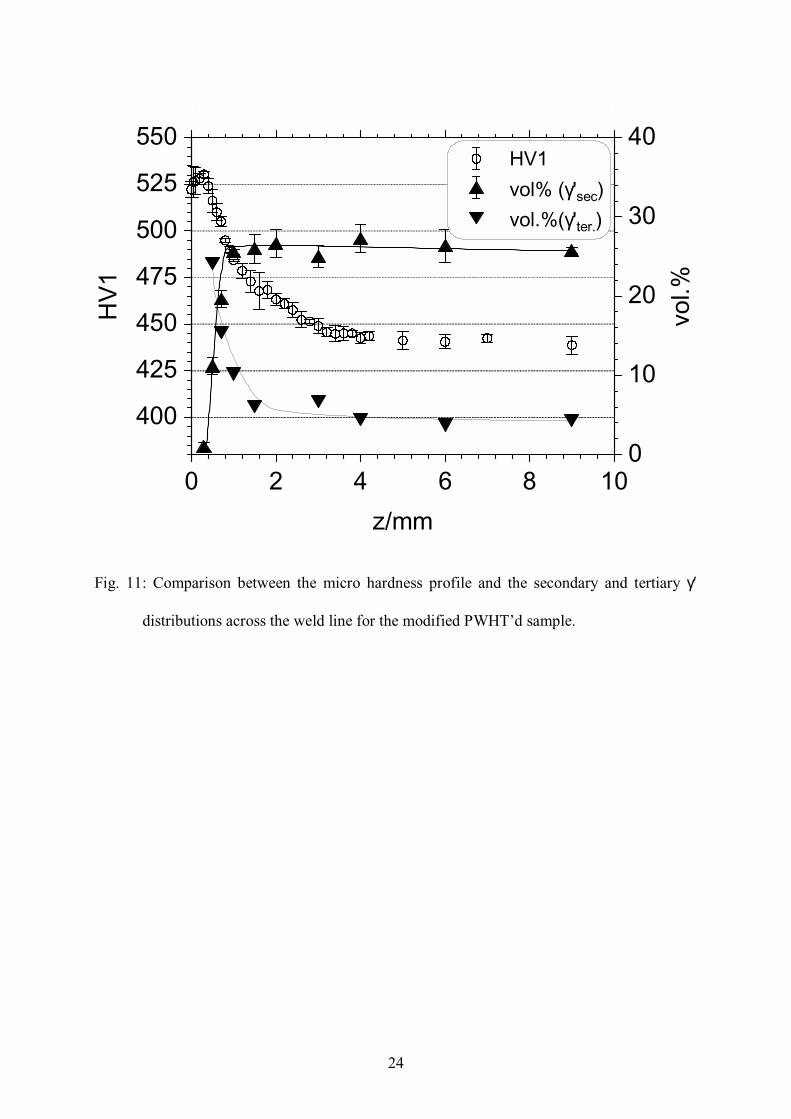
Fig. 10a-d are high magnification FEGSEM images of the modified PWHT’d sample showing
the distribution of secondary and tertiary γ ′ at various distances from the weld line. At the
weld line, all secondary γ ′ is in solution and only tertiary γ ′ was detectable (Fig. 10a). This
feature was observed in the as-welded and both post weld heat-treated conditions. Significant
changes in the secondary and tertiary γ ′ distribution can be observed over the first 2 mm from
the weld line (Fig. 10a-c), whereas beyond 2 mm no significant changes in γ ′ are detectable
(Fig. 10d). Fig. 11 compares the hardness profile with the variation in secondary and tertiary
γ ′ content across the weld line for the modified PWHT’d sample. It can be seen that the
change in volume fraction of tertiary γ ′ correlates well with the hardness peak close to the
weld line. The importance of tertiary γ ′ in respect of mechanical properties has also been
reported by Torster et al. [24], where it was observed that an increased volume fraction of
tertiary γ ′ resulted in a higher proof stress. In general it is well accepted that an increase of
the cooling rate from the solution temperature increases the tertiary γ ′ volume fraction and
thus tensile strength [25].
Fig. 12 plots the coherency strain between γ and γ′ for the matrix (γ) as a function of axial
position measured from the (200) reflections on beam line ID31 at the ESRF. A dramatic
change of coherency strain was recorded between the weld line and 4 mm from the weld line
starting with essentially zero strain at the weld line, going through a maximum of about 4000

12
microstrain (0.4% strain) between 1 and 2 mm from the weld line, before it dropped back to
zero at about 4 mm from the weld line. The variation of coherency strain can be explained in
terms of γ′ exposed to different temperatures during welding. Because cooling rates are
severe after the heat input during joining is completed, it can be expected that the chemical
composition of γ′ is frozen at its maximum temperature during welding. Assuming that the
chemical composition of γ and γ′ at high temperatures results in high coherency strain at room
temperature, one would expect the highest coherency strain at the weld line tailing off to zero
within the HAZ. This can be partly seen in Fig. 12 with a declining coherency strain between
2 and 4 mm from the weld line. Between 2 mm from the weld line and the weld line, an
increasing volume fraction of γ′ gets dissolved during welding with all γ′ dissolved at the weld
line. As it was shown in [23], very fine reprecipitated γ′ was found at the weld line, indicating
that the driving force for precipitation of the alloying elements in RR1000 is large enough to
partly reprecipitate γ′ even under severe cooling rates. The post-weld formed γ′ however must
have precipitated at a fairly low temperature due to undercooling effects. Therefore the
chemical composition of post-weld γ′ can be expected to vary significantly from γ′, which was
exposed to high temperatures during welding. Hence, the maximum coherency strain is not
found at the weld line but between 1 and 2 mm from it. The essentially zero coherency strain
at the weld line could be one factor for the slight drop of hardness towards the weld line as
observed in Fig. 6. The increase of micro hardness (Fig. 6) and 0.2% yield stress (Fig. 7)
starting at 4 mm from the weld line can be explained by the raise in coherency strain between
γ and γ′.
High angle grain boundaries
Representative Euler maps for the as welded sample are shown in Fig. 13a-e. Due to the
similar chemical composition and structure of γ and γ′, the maps can not distinguish between γ
grains and primary γ′ particles. The maps show a dramatic change in microstructure between

13
the weld line and 1 mm from the weld line. Beyond 1 mm from the weld line no discernable
change in microstructure was observed. At the weld line (Fig. 13a) the high temperature
reached has resulted in a fully recrystallized microstructure with a mean grain size (D) of 4.2
µm and an even grain size distribution. The sharp drop in D between the weld line and 0.25
mm is partly due to the fact that at the weld line D is only determined by γ whereas at 0.25
mm the mean grain size is a combination of γ and γ′. 0.5 mm away from the weld line (Fig.
13c) the microstructure exhibits large areas with very small grains where the microstructure
has started to recrystallize under a combination of heavy plastic deformation and high
temperature. In addition, large grains are visible, which have not yet started to recrystallize.
The variation in grain size is presented as D-0.5 across the weld line in Fig. 14. In a narrow
region around 0.5 mm away from the weld line the grain size is reduced by almost 50%.
Correlating Fig. 14 with Fig. 6 would suggest that the grain size does have an impact on the
hardness peak very close to the weld line. It is noteworthy that, in the parent material (greater
than 5 mm from the weld line) 27% of the HAGB were identified as twin boundaries, whereas
at the weld line only 3.5% of the HAGB are twins. This is a consequence of recrystallization
at the weld line. In [23] these EBSD maps were also analyzed in terms of misorientation
between EBSD measurement points within one grain, which could be used to calculate the
stored energy. It was found that at 0.5 mm from the weld line, in the region where
recrystallization starts to occur, the stored energy displayed a sharp maximum.
SUMMARY AND CONCLUSIONS
This paper demonstrates the importance of managing the microstructural aspects and
mechanical properties together with residual stress issues in inertia friction welded nickel-
base Superalloys. It was found that for inertia friction welded RR1000 large tensile hoop
stresses can be detected after welding. Only after increasing the temperature by 50°C above
the conventional PWHT were the hoop stresses relieved to an acceptable level (below 400
14
MPa). Results of neutron diffraction strain mapping experiments were supported by depth
profiling measurements made by hole drilling carried out at the inner and outer diameter of
the weld line. The results however also demonstrate the limitation of hole drilling, when the
residual stresses are close to the yield point. The recording of micro hardness and 0.2 % yield
stress profiles, using an electronic speckle pattern interferometry technique showed that both
post weld heat treated conditions have similar strength distributions across the weld line. No
significant loss of 0.2 % yield stress could be observed after increasing the PWHT
temperature by 50°C, which suggest that this modified PWHT is appropriate for inertia
friction welded RR1000. In the region of largest residual tensile stresses, at the weld line, the
0.2 % yield stress of RR1000 was about 100-120 MPa higher than in the parent material. The
microstructure has been studied by means of high-energy synchrotron X-rays, electron
microscopy and EBSD. No single microstructural parameter determines the complete
response. Instead, the variations in tertiary γ ′ , coherency strain between γ and γ′, grain
boundary strengthening and work hardening are the most important microstructural features
determining the hardness profiles across the joint line.
ACKNOWLEDGEMENTS
The authors would like to thank Dr. A. Terry and Dr. G. Vaughan (ID11) and Dr. François
Fauth (ID31) for their experimental support at the ESRF. Synchrotron beam time was made
available through a long term development project (me103, P. Webster, P.J. Withers and A.
Kosansky) for using synchrotron radiation for engineering strain scanning. We would also
like to thank Dr. M.R. Daymond (ISIS, ENGIN) and Ian Brough (MMSC) for experimental
assistance and Colin Small, Peter Wilson and Kevin Bass (Rolls-Royce plc.) for advice.
These experiments are performed under the EPSRC project GR/M68704 and are financially

15
supported by EPSRC and Rolls-Royce plc. P.J. Withers acknowledges a Royal Society
Wolfson Research Merit Award.
16
Captions:
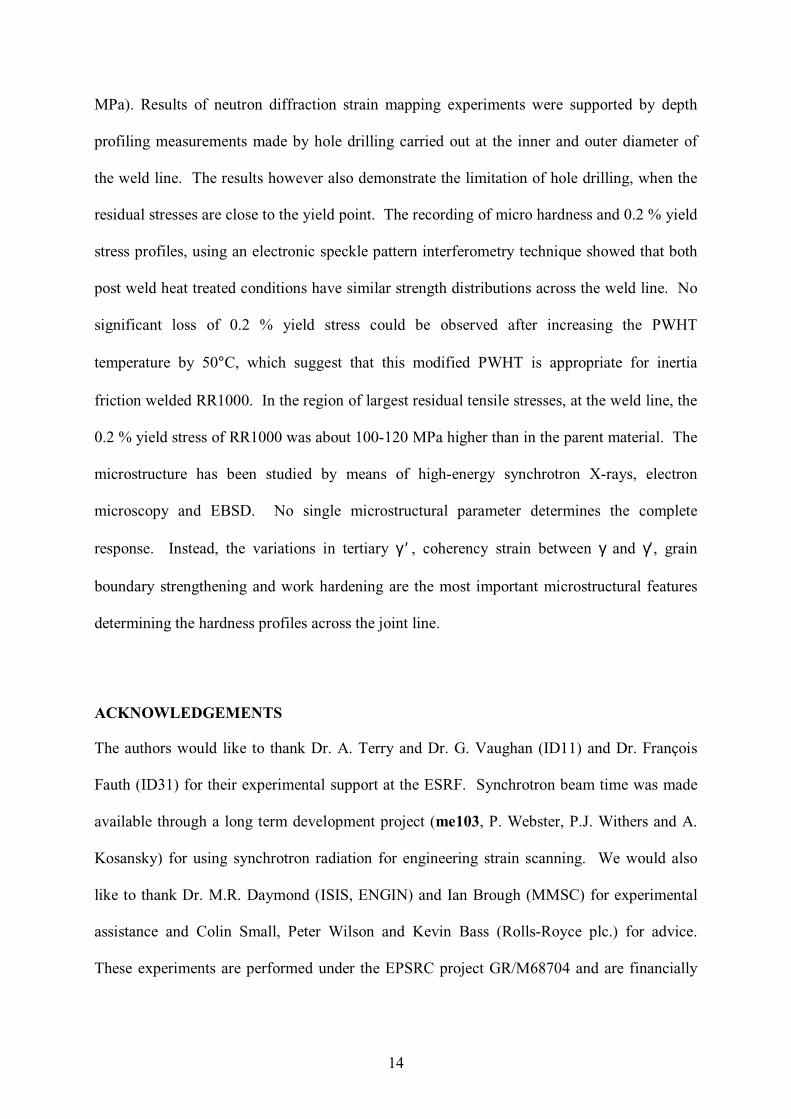
Table 1: Chemical composition (wt%, balance nickel) of RR1000 and other disc alloys.
Alloy Cr Co Mo W Al Ti Ta Hf Zr C B γ′ vol% RR1000 14.35-
15.15 14.0-19.0
4.25-5.25
- 2.85-3.15
3.45-4.15
1.35-2.15
0.0-1.0
0.05-0.07
0.012-0.033
0.01-0.025
48
U720LI 16 15 3.0 1.25 2.5 5.0 - - 0.035 0.015 0.015 45 Waspaloy 19.5 13.5 4.3 - 1.3 3.0 - - - 0.08 0.006 25
17
Fig. 1: 2000 ton-force inertia welding machine installed at Rolls-Royce plc near Nottingham,
UK.
Time
For
ce /
rpm
/ T
orqu
e / U
pset
Upset
Axial Force
rpm
Torque
I II III IV
Time
For
ce /
rpm
/ T
orqu
e / U
pset
Upset
Axial Force
rpm
Torque
I II III IV
Fig. 2: Schematic graph of the four different stages during inertia friction welding

18
+R -R
+z
-z
HOOP
RADIAL
AXIAL
(0,0)
Fig. 3: The coordinate system of the measured cross section. The shaded region highlights
the areas where the measurements were made.
a) b) c)
Fig. 4: Contour plots of the hoop stresses in RR1000 for the a) as-welded, b) conventional
PWHT and c) modified PWHT condition.
400
600
600
800
800
1000
1000
1200
2
1
0
-1
-2
2
1
0
-1
-2
R/m
m
0 1 2 3 4 5
0 1 2 3 4 5
z/mm
0
200
400
600
800
1000
1200
1400
20030
0300
300
400
400 400
2
1
0
-1
-2
2
1
0
-1
-2
R/m
m
0 1 2 3 4 5
0 1 2 3 4 5
z/mm
400
500
600
600
600
700
700
800
800
2
1
0
-1
-2
2
1
0
-1
-2
R/m
m
0 1 2 3 4 5
0 1 2 3 4 5
z/mm

19
-1000
-500
0
500
1000
1500
resi
dual
stre
ss/M
Pa
-4 -2 0 2 4
-1000
-500
0
500
1000
resi
dual
stre
ss/M
Pa
-4 -2 0 2 4
-1500
-1000
-500
0
500
1000
resi
dual
stre
ss/M
Pa
-4 -3 -2 -1 0 1 2 3 4
R/mm
as-welded
mod. PWHT
conv. PWHT
a)
c)
b)
neutron diffraction resultshole
drill
ing
hole
drill
ing
HOOPAXIAL
Fig. 5: Hole drilling and neutron diffraction results from the weld line for the axial and hoop
stresses as a function of radial position. Results are plotted for the as-welded (top),
conventional PWHT (middle) and modified PWHT (bottom).

20
420
440
460
480
500
520
540
HV1
0 1 2 3 4 5 6 7 8 9 10
z/mm
as-welded
conv. PWHT
mod. PWHTA
Fig. 6: Vickers hardness profiles of the as-welded, conventional PWHT’d and modified
PWHT’d RR1000 samples as a function of axial distance from the weld line (z=0)
measured at the mid-wall thickness.

21
0
25
50
75
100
125
150
175
200m
easu
red
-no
min
al0.
2%
yiel
dst
ress
/MP
a
-6 -4 -2 0 2 4 6
z/mm
conv. PWHT
mod. PWHT
Fig. 7: 0.2 % yield stress profiles (measured – nominal 0.2 % yield stress) of the conventional
and modified PWHT’d RR1000 samples as a function of axial distance from the weld
line (z=0). The tensile tests were performed with an initial strain rate of 5 x 10⁻⁴ 1/s .
22
0.005
0.010
0.015
0.020
0.025I(
100)
/I(20
0)
0 2 4 6 8 10
z/mm
as weldedconv. PWHT
mod. PWHT
Fig. 8: The normalized (I(100)/I(200)) integrated intensity of the γ ′ superlattice reflection
measured on ID11 at the ESRF plotted against the axial distance from the weld line.
2.5 µm2.5 µm 2.5 µm2.5 µm2.5 µm2.5 µm2.5 µm2.5 µm2.5 µm2.5 µm
Fig. 9: Representative low magnification FEGSEM images of γ′ in the as-welded condition a)
at the weld line, b) 2.5 mm from the weld line.

23
b)
250 nm
b)
250 nm250 nm250 nm
c)
250 nm
c)c)
250 nm250 nm250 nm
d)
250 nm
d)
250 nm250 nm250 nm
250 nm
a)
250 nm250 nm250 nm
a)
Fig. 10: Representative high magnification FEGSEM images of secondary and tertiary γ′ of
the modified PWHT’d sample a) at the weld line, b) 0.5 mm, c) 2 mm and d) 9 mm
from the weld line.
24
400
425
450
475
500
525
550H
V1
0
10
20
30
40
vol.%
0 2 4 6 8 10
z/mm
0 2 4 6 8 10
HV1
vol% ( ' )γsec
vol.%( ' )γ ter.
Fig. 11: Comparison between the micro hardness profile and the secondary and tertiary γ′
distributions across the weld line for the modified PWHT’d sample.

25
-1000
0
1000
2000
3000
4000
5000st
rain
betw
een
and
'/mic
rost
rain
γγ
0 1 2 3 4
z/mm
Fig. 12: Coherency strain between the γ matrix and γ′ for the matrix measured on the as-
welded sample from the (200) reflection on beam line ID31, ESRF.
Fig. 13: Euler maps recorded by EBSD showing the γ grain and primary γ′ distribution of the
as-welded sample a) at the weld line, and b) 0.25 mm, c) 0.5 mm, d) 1 mm and e) 5
mm away from it. These views are representative of larger maps containing >1500
grains for which the average % twin boundaries were 3.5, 5, 11, 18 and 27.

26
0.45
0.50
0.55
0.60
0.65
0.70
0.75D
/m
-0.5
-0.5
µ
0 1 2 3 4 5 6
z/mm
Fig. 14: The grain size in form of D-0.5 across the weld line for the as-welded sample as
recorded by EBSD mapping.
[1]: J.K. Tien and T. Caulfield (eds): Superalloys, Supercomposites and Superceramics,
Academic Press INC (London) LTD, 1989, pp. 142-143.
[2]: C.T. Sims and W.C. Hagel (eds.): The Superalloys, John Wiley, New York, 1972, pp.
509-532.
[3]:R. Spinat and Y. Honnorat: High temperature alloys for gas turbines and other
applications, W. Betz et al. eds., Dordrecht D. Reidel (1986), pp. 151-157.
[4]: M.P. Jackson and R.C. Reed: Mater. Sci. Eng. A, vol. 259, 1999, pp. 85-97.
[5 ]: S.J. Hessell et al., Nickel Alloy for turbine engine components, United States Patent
Number 5897718 (27 April 1999).
27
[6]: C.T. Sims, N.S. Stoloff and W.C. Hagel (eds.): Superalloys II, High Temperature
Materials for Aerospace & Industrial Power, New York, NY: John Wiley & Sons inc.,
1987, pp. 221-226.
[7]: C.T. Sims and W.C. Hagel (eds.), The Superalloys, John Wiley, New York, 1972, pp. 44.
[8] : M. W. Johnson, L. Edwards, and P. J. Withers: Physica B, vol. 234, pp. 1141-1143, 1997
[9]:R.A.Young: Rietveld method, Oxford University press (Oxford), 1993.
[10] : M. W. Johnson, L. Edwards, and P. J. Withers: Physica B, vol. 234, pp. 1141-1143,
1997
[11]: I.C. Noyan and J. B. Cohen, Residual Stress, Springer Verlag, NYC, 1987, 111-116.
[12]:J.W.L. Pang, M. Preuss, P.J. Withers, G.J. Baxter and C. Small, accepted for publication
in Mat. Sci. Eng. A Nov. 2001.
[13]: M. Preuss, J.W.L. Pang, P.J. Withers and G.J. Baxter: Metallurgical and Materials
Transactions A, Volume 33A, Oct. 2002, 3127-3234.
[14]: P.J. Webster, G. Mills, X.D Wang, W.P. Kang, T.M. Holden, J. Neutron Res. 3 (1996)
223-240.
[15]: D. Wang, I.B. Harris, P.J. Withers, L. Edwards: in S. Denis et al., ECRS4, S. Denis, J.-
L. Lebrun, B. Bourniquel, M. Marral, J.-F. Flavenot (Eds..), Cluny en Bourgogne,
France, 1996, pp. 69-78.
[16]: Determining Residual Stresses by the Hole-Drilling Strain-Gauge Method, ASTM
Standard E837, ASTM, Philadelphia, USA, 1989.
[17]: P.K. Rastogi, Principles of holographic interferometry and speckle metrology, in:
Photomechanics, P.K. Rastogi (Ed.), Springer-Verlag, Heidelberg, 1999, pp. 103-145.
[18]: A. Royer, P. Bastie and M. Véron: Scr. Mater., Vol 37, pp. 1199-1205.
[19]:A. Royer, P. Bastie and M. Véron: Scr. Mater., Vol 40, pp. 955-961.
[20]: A. Royer, P. Bastie and M. Véron: Acta Mater., vol. 46, 1998, pp. 5357-5368.
28
[21]: Software and user manual at:
http://www.umist.ac.uk/material/research/aluminum/frame.html.
[22] Channel 4.2: HKL Technology ApS, Blaakildevej 17k, Hobro, DK-9500, Denmark.
[23]: M. Preuss, J.W.L. Pang, P.J. Withers and G.J. Baxter, Metallurgical and Materials
Transactions A, Volume 33A, Oct. 2002, 3115-3225.
[24]:F. Torster, G. Baumeister, J. Albrecht, G. Luetjering, D. Helm and M.A. Daeubler:
Mater. Sci. Eng. A, vol. A234, 1997, pp. 189-192.
[25]:J.J. Schirra and S.H. Goetschius: Superalloys 1992, S.D. Antolovich, R.W. Stusrud, R.A.
Mackay, D.L. Anton, T. Khan, R.D. Kissinger, D.L. Klarstrom (eds.): The Mineral,
Metals & Materials Society, 1992, pp. 437 – 446.