FORMULATION, DESIGN AND DEVELOPMENT OF …e-jst.teiath.gr/issues/issue_51/Bhattacharya_51.pdf ·...
22
e-Περιοδικό Επιστήμης & Τεχνολογίας e-Journal of Science & Technology (e-JST) http://e-jst.teiath.gr 55 FORMULATION, DESIGN AND DEVELOPMENT OF CIPROFLOXACIN HYDROCHLORIDE FLOATING BIOADHESIVE TABLETS Sankha Bhattacharya 1 *, Bhupendra G. Prajapati 2 1. Assistant Professor, department of pharmaceutics B. Pharmacy college-Rampura, Godhra, Gujarat-389001, India. 2. Associate Professor, Dept. of Pharmaceutical Technology, Ganpat University, Kherva, Mehsana, Gujarat-384012, India *Corresponding author: Mr. Sankha Bhattacharya ([email protected]) mobile: +91 7698067381 Abstract Ciprofloxacin hydrochloride is a second generation antibiotic and a BCS class II drug. It was taken as a model drug to prepare floating bioadhesive tablet. This drug has maximum therapeutic window in the upper stomach, so controlled drug release with the optimum retentive formulation in the upper stomach would be an ideal formulation. Applying Placket and Burman design we tried to prepare floating bioadhesive tablets using three principal polymers, such as HPMCK15M (08%, 12% & 16%), carbopol 934P (06%, 09% & 12%) and CMC (03%, 06% & 09%). Total 13 formulations were designed (CF1 to CF13) and various evaluation parameters were studied. After a comprehensive analysis, it was confirmed that CF13 formulation was emerging out to be an optimum formulation. The various evaluation parameters of CF13 such as weight variation (500±0.35mg), average thickness (3.24mm), average diameter (12.53mm), %friability (0.94%), hardness (9.5kg/cm 2 ), wetting time (21seconds), drug content (97.36%), swelling index (2.801 after 12 th hour), floating lag time (345second), total bouncy lag time (10 hour), bioadhesive strength (2.34gm), force of adhesion (0.229N), cumulative percentage drug release at 12 th hour (92.45%), desirability factor (D=0. 920) shows satisfactory results. The CF13 formulations were further studied for kinetic behavior. It was found that CF13 maintained zero order kinetics (R 2 =0.9886). The optimized formulation was then studied for similarity (F2=57.083) and difference factor (F1=11.970) against Ciftran-OD tablet (Ranbaxy India Limited), which was within the specific limits. Further, the CF13 formulations were introduced into 6month stability studies as per ICH QIA (R2) guideline. The results were promising except dissolution (108.90% at the 12 th hour), drug content (87.22%) after 6 months in a stability chamber. Finally, it can be concluded that CF13 formulation can be considered for industrial scaled up. Key words: Placket and Burman design, ciprofloxacin hydrochloride, floating tablets, bioadhesive strength, carbopol 934P, desirability factor. Introduction Desire therapeutic activity with minimizing dosing interval and minor adverse drug reaction is the ideal pre-request for making any controlled release formulation. Conventional dosage form has some critical problems like uncontrollable release pattern of drugs, sub or supratherapeutic drug concentration, forming deleterious effects, and limited delivery for short biological half-life containing drugs (t1/2). To circumvent all associated problems a
-
Upload
phungthuan -
Category
Documents
-
view
214 -
download
0
Transcript of FORMULATION, DESIGN AND DEVELOPMENT OF …e-jst.teiath.gr/issues/issue_51/Bhattacharya_51.pdf ·...
e-Περιοδικό Επιστήμης & Τεχνολογίας e-Journal of Science & Technology (e-JST)
http://e-jst.teiath.gr 55
FORMULATION, DESIGN AND DEVELOPMENT OF CIPROFLOXACIN
HYDROCHLORIDE FLOATING BIOADHESIVE TABLETS
Sankha Bhattacharya1*, Bhupendra G. Prajapati
2
1. Assistant Professor, department of pharmaceutics B. Pharmacy college-Rampura, Godhra,
Gujarat-389001, India.
2. Associate Professor, Dept. of Pharmaceutical Technology, Ganpat University,
Kherva, Mehsana, Gujarat-384012, India
*Corresponding author: Mr. Sankha Bhattacharya ([email protected]) mobile:
+91 7698067381
Abstract
Ciprofloxacin hydrochloride is a second generation antibiotic and a BCS class II drug. It
was taken as a model drug to prepare floating bioadhesive tablet. This drug has maximum
therapeutic window in the upper stomach, so controlled drug release with the optimum
retentive formulation in the upper stomach would be an ideal formulation. Applying Placket
and Burman design we tried to prepare floating bioadhesive tablets using three principal
polymers, such as HPMCK15M (08%, 12% & 16%), carbopol 934P (06%, 09% & 12%)
and CMC (03%, 06% & 09%). Total 13 formulations were designed (CF1 to CF13) and
various evaluation parameters were studied. After a comprehensive analysis, it was
confirmed that CF13 formulation was emerging out to be an optimum formulation. The
various evaluation parameters of CF13 such as weight variation (500±0.35mg), average
thickness (3.24mm), average diameter (12.53mm), %friability (0.94%), hardness
(9.5kg/cm2), wetting time (21seconds), drug content (97.36%), swelling index (2.801 after
12th
hour), floating lag time (345second), total bouncy lag time (10 hour), bioadhesive
strength (2.34gm), force of adhesion (0.229N), cumulative percentage drug release at 12th
hour (92.45%), desirability factor (D=0. 920) shows satisfactory results. The CF13
formulations were further studied for kinetic behavior. It was found that CF13 maintained
zero order kinetics (R2=0.9886). The optimized formulation was then studied for similarity
(F2=57.083) and difference factor (F1=11.970) against Ciftran-OD tablet (Ranbaxy India
Limited), which was within the specific limits. Further, the CF13 formulations were
introduced into 6month stability studies as per ICH QIA (R2) guideline. The results were
promising except dissolution (108.90% at the 12th
hour), drug content (87.22%) after 6
months in a stability chamber. Finally, it can be concluded that CF13 formulation can be
considered for industrial scaled up.
Key words: Placket and Burman design, ciprofloxacin hydrochloride, floating
tablets, bioadhesive strength, carbopol 934P, desirability factor.
Introduction
Desire therapeutic activity with minimizing dosing interval and minor adverse drug reaction
is the ideal pre-request for making any controlled release formulation. Conventional dosage
form has some critical problems like uncontrollable release pattern of drugs, sub or
supratherapeutic drug concentration, forming deleterious effects, and limited delivery for
short biological half-life containing drugs (t1/2). To circumvent all associated problems a
e-Περιοδικό Επιστήμης & Τεχνολογίας e-Journal of Science & Technology (e-JST)
12 (3), 2017 56
proper designing of oral controlled drug delivery is incepted which can increase the
bioavailability of drugs and challenges all physicochemical problems (variability, emptying,
mobility etc) of drug released in Gastro Intestinal Track (GIT). In modern era increasing
Gastric Resilience Timings (GRT) of formulations is a promising approach ie: Gastro
Retentive Dosage Form (GRDF) [1]
. The maximum absorption windows were present in
upper to lower parts of the stomach, which makes it as a potential target site. Poorly soluble
and sprightly soluble drugs has a paramount issue on dissolution as gastrointestinal transit
time (2hours) can limit the drug absorption. To scrap all problems cohort with drug release,
most eradicable Gastro Retentive Dosage Form (GRDF) was developed which increases
drug concentration in GIT mucosa and also improve pharmacotherapy of stomach by local
drug release.
The various concepts which have been used to increase the retention of dosage in the
stomach are floating system, muco or bioadhesive system, osmotic regulatory system.
Floating Drug Delivery System[2]
is a promising approach where gastric juice density
maintained higher than the formulation, due to which the formulation bayonet in the upper
stomach for a longer period of time. This approach helps to decay fluctuation in plasma drug
concentration and transition of released drug. Floating Drug Delivery System (FDDS)
classified as an effervescent and non-effervescent system. On the other hand bioadhesive
system releases the drug in site-specific manner. Polymer such as sodium carboxymethyl
cellulose, acrylic acid copolymer (carbopol and polycarbophil), hydroxypropyl methyl
cellulose, a copolymer of vinylpyrrolidone and vinyl acetate etc are used in formulating
bioadhesive drug delivery system [3]
. It was also observed that polymers containing
carboxylic groups, such as carboxymethyl cellulose and polyacrylic polymers, shown a
higher level of bio-adhesion [4]
. Our target was to design a Floating-Bioadhesive tablet
using ciprofloxacin hydrochloride as a model drug, which could bayonet for certain period
of time in the upper stomach and further adhere in the fundus of the stomach. This approach
is specifically designed to avoid Mio Electric Complex (MEC) which sweeps undigested
food particles from the stomach in every 1.5 to 2 hours and to increase the residence time
of the formulation in the upper stoma. From the literature review, it was confirmed that
(Mukhopadhyay.S.et al 2010) HPMC & CMC can be used for controlled release dosage
form [5]
. It was also observed that carboxymethylcellulose & polyacrylic polymers, (e.g.
Carbopol 940p) has good bioadhesive property, hence in the present investigation it was
aimed to test, the bio adhesiveness [6]
of the formulation taking Carbopol 940p as a principle
polymer as well as optimised the floating nature of the formulation by changing the ratio of
HPMC & CMC, by using PVP K-30 as a Binder
Material and method
The model drug ciprofloxacin hydrochloride were gift sample from Bharat Coats;
Chennai. HPMC-HV-145MPAS (LR), carbopol-940 was purchased from S.D fine
chemicals; Vadodara. CMC, PVP-K-30, sodium bicarbonate, citric acid monohydride
was purchased from Sisco-Research Laboratory; Mumbai. Microcrystalline cellulose,
magnesium stearate, talc, was purchased from Loba chemical privet limited; Mumbai.
Cifran-OD (ciprofloxacin floating tablets-manufactured by Ranbaxy, India limited)
purchased from local medical store.
e-Περιοδικό Επιστήμης & Τεχνολογίας e-Journal of Science & Technology (e-JST)
http://e-jst.teiath.gr 57
The method of preparation
Floating tablet containing ciprofloxacin hydrochloride as a model drug was prepared by
direct compression method. As per 32 factorial design, 13 batches were introduced (CF1
to CF13).Initially, drug (250mg) was mixed in a steel bowl with required quantities of
microcrystalline cellulose (MCC). The varying concentrations of polymers[5]
such as
HPMC K15M (8%, 12% & 16%) carbopol 934P (6%, 9% & 12%), CMC (3%, 6% &
9%) combined with drug-MCC mixture, citric acid, sodium bicarbonate was mix
together. The entire mixture was then pass through sieve number 40. All the ingredients
except magnesium stearate and talc were blended in a polyethylene bag for five minutes.
After sufficient blending remaining quantities of magnesium stearate and talc
(previously sieved through mesh number 60) was admixture and again blended for 2-
3minutes. The blended materials were punched by using 12 station punching machine
(CEMACH: R&D-12MT, 6D/6B) in a die 13 mm diameter at 75 kg/cm2 pressure for 2
minutes to obtain floating tablets containing individual 500mg of total tablet weight.
The various weight of the tablets was checked periodically while performing the
punching process (Table: 3).
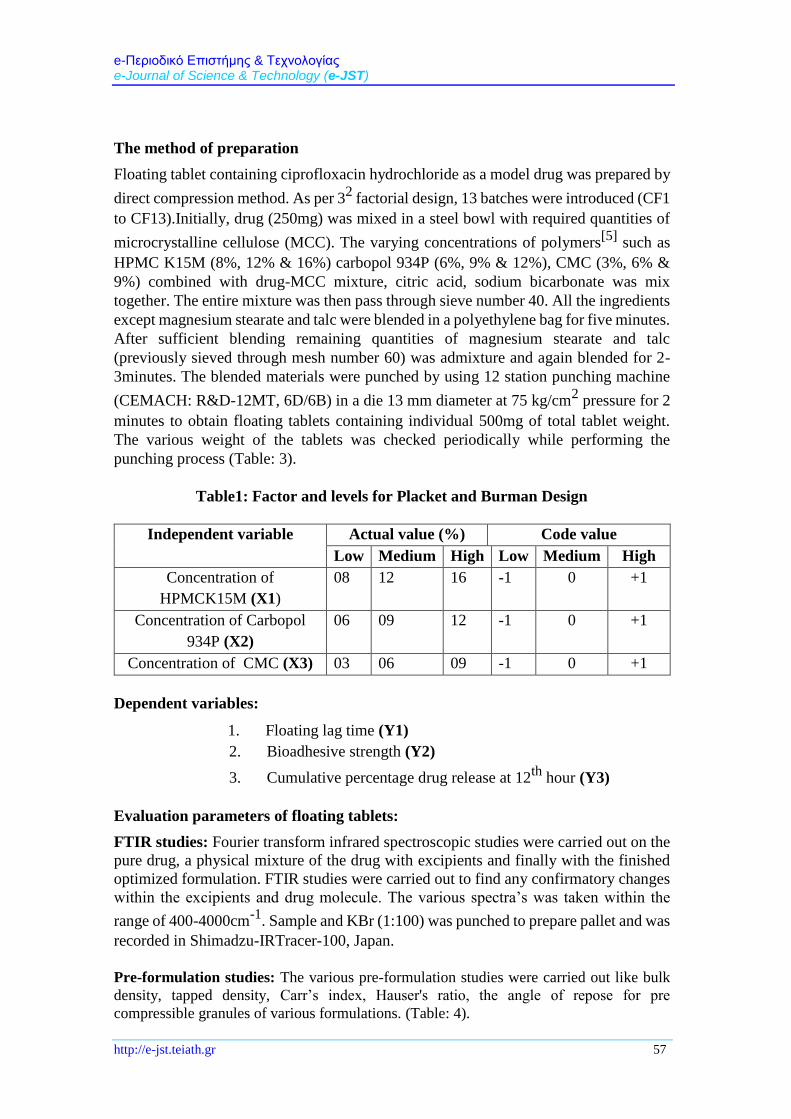
Table1: Factor and levels for Placket and Burman Design
Independent variable Actual value (%) Code value
Low Medium High Low Medium High
Concentration of
HPMCK15M (X1)
08 12 16 -1 0 +1
Concentration of Carbopol
934P (X2)
06 09 12 -1 0 +1
Concentration of CMC (X3) 03 06 09 -1 0 +1
Dependent variables:
1. Floating lag time (Y1) 2. Bioadhesive strength (Y2)
3. Cumulative percentage drug release at 12th
hour (Y3)
Evaluation parameters of floating tablets:
FTIR studies: Fourier transform infrared spectroscopic studies were carried out on the
pure drug, a physical mixture of the drug with excipients and finally with the finished
optimized formulation. FTIR studies were carried out to find any confirmatory changes
within the excipients and drug molecule. The various spectra’s was taken within the
range of 400-4000cm-1
. Sample and KBr (1:100) was punched to prepare pallet and was
recorded in Shimadzu-IRTracer-100, Japan.
Pre-formulation studies: The various pre-formulation studies were carried out like bulk
density, tapped density, Carr’s index, Hauser's ratio, the angle of repose for pre
compressible granules of various formulations. (Table: 4).
e-Περιοδικό Επιστήμης & Τεχνολογίας e-Journal of Science & Technology (e-JST)
12 (3), 2017 58
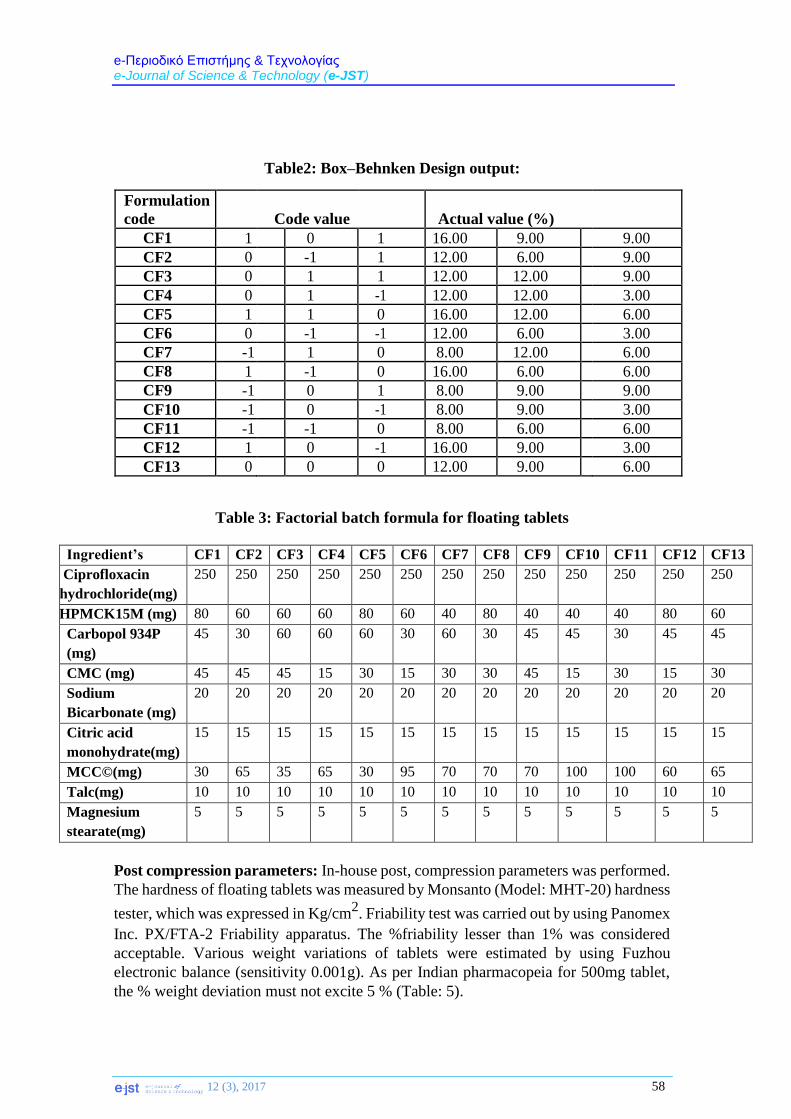
Table2: Box–Behnken Design output:
Formulation
code Code value Actual value (%)
CF1 1 0 1 16.00 9.00 9.00
CF2 0 -1 1 12.00 6.00 9.00
CF3 0 1 1 12.00 12.00 9.00
CF4 0 1 -1 12.00 12.00 3.00
CF5 1 1 0 16.00 12.00 6.00
CF6 0 -1 -1 12.00 6.00 3.00
CF7 -1 1 0 8.00 12.00 6.00
CF8 1 -1 0 16.00 6.00 6.00
CF9 -1 0 1 8.00 9.00 9.00
CF10 -1 0 -1 8.00 9.00 3.00
CF11 -1 -1 0 8.00 6.00 6.00
CF12 1 0 -1 16.00 9.00 3.00
CF13 0 0 0 12.00 9.00 6.00
Table 3: Factorial batch formula for floating tablets
Ingredient’s CF1 CF2 CF3 CF4 CF5 CF6 CF7 CF8 CF9 CF10 CF11 CF12 CF13
Ciprofloxacin
hydrochloride(mg)
250 250 250 250 250 250 250 250 250 250 250 250 250
HPMCK15M (mg) 80 60 60 60 80 60 40 80 40 40 40 80 60
Carbopol 934P
(mg)
45 30 60 60 60 30 60 30 45 45 30 45 45
CMC (mg) 45 45 45 15 30 15 30 30 45 15 30 15 30
Sodium
Bicarbonate (mg)
20 20 20 20 20 20 20 20 20 20 20 20 20
Citric acid
monohydrate(mg)
15 15 15 15 15 15 15 15 15 15 15 15 15
MCC©(mg) 30 65 35 65 30 95 70 70 70 100 100 60 65
Talc(mg) 10 10 10 10 10 10 10 10 10 10 10 10 10
Magnesium
stearate(mg)
5 5 5 5 5 5 5 5 5 5 5 5 5
Post compression parameters: In-house post, compression parameters was performed.
The hardness of floating tablets was measured by Monsanto (Model: MHT-20) hardness
tester, which was expressed in Kg/cm2. Friability test was carried out by using Panomex
Inc. PX/FTA-2 Friability apparatus. The %friability lesser than 1% was considered
acceptable. Various weight variations of tablets were estimated by using Fuzhou
electronic balance (sensitivity 0.001g). As per Indian pharmacopeia for 500mg tablet,
the % weight deviation must not excite 5 % (Table: 5).
e-Περιοδικό Επιστήμης & Τεχνολογίας e-Journal of Science & Technology (e-JST)
http://e-jst.teiath.gr 59
Floating studies: Ex vivo Floating studies were carried out on CF1 to CF13
formulations (Figure: 4 & Table:7). One tablet each was taken from all the 13
formulations and individually kept in a 100ml glass beaker assimilating in simulated
gastric fluid, maintaining 1-2 pH, as per united states pharmacopeia. The Floating Lag
(FLT) time or bouncy lag time was calculated by measuring the time taken by tablets to
rise above the surface of the medium. The total duration of time in which the tablets
remain buoyant was considered as Total Floating Time (TFT) (Leena, Jagat S at el.,
2011) [7]
.
Determination of drug content in tablet:
Weigh accurately 20 tablets of different formulations. Crush them all using glass motor
and pastel. 0.25gm was taken and diluted to 100ml of sufficient 0.1N HCL. Further, the
contents were sonicated for 20 minutes and filtered using 0.45µ membrane filter. From
that filtrate again 1ml was withdrawn and diluted up to 100ml using 0.1 N HCL in a
volumetric flask. The absorbance of the resultant solutions was estimated using
SHIMADZU-1880UV-VIS Spectrophotometer at 278 nm where the A1%1cm value
was considered as 878.
Swelling index studies:
Swelling of hydrophilic polymers such as HPMC, Carbopl, and CMC depends on
contents of the stomach and osmolality of the medium. This provides outline about
release pattern of drug and the residence time. The swelling index can be determined by
placing the tablets in dissolution bowl containing 200ml of pH6.8 phosphate buffer
maintaining 37±0.5̊ C. Each two hours interval (2-12hours) the swelled tablets were
withdrawn and blotted with whatman filter paper to remove excess water (Figure: 3 and
Table: 6). Further individual swelled tablet weight was estimated in Fuzhou electronic
balance (Railkar, Anirudh et al., 2001) [8]
.The swelling index can be determined by
following formula:
Swelling index (S.I) = {(Wt- WO)/WO} ×100
Where, S.I= swelling index Wt=weight of tablet at time t Wo= weight of tablet before immersion.
Bioadhesive strength:
For measurement of the bioadhesive strength of the prepared formulations, everted pieces of fundus
tissues of the goat was mandated. While transportation goat skin from the local slaughter house, it
was stored in Krebs buffer solution (sodium chloride 6.9 mg/L, D-Glucose 2gm/L, monobasic
potassium phosphate 0.16gm/L, magnesium sulfate 0.141 mg/L, potassium chloride 0.35
mg/L).While mounting in modified physical balance (Deshmukh, Jadhar and Sakarkar 2009) fundus
skin was cleaned thrice with 0.1N HCL solution. The modified physical balance assembled with one
upper vial (b) which was reversely connected with the balance (a) in one end (figure1). The vial (b)
was prefilled with 0.1N HCL and its opening was fused with everted skin by using a rubber band.
Another vial was prepared with the same method. The second vial was fused with everted skin (e)
and prepared formulation (d) was fixed within using cello tape. The first vial (b) was reversely
attached with formulation (d) along with skin (e) of the second vial for 2 minutes. After fusion of the
e-Περιοδικό Επιστήμης & Τεχνολογίας e-Journal of Science & Technology (e-JST)
12 (3), 2017 60
tablet was completed with skin (c) due to the viability of the fundus mucosa with tablet polymers,
then gradually increase the weight
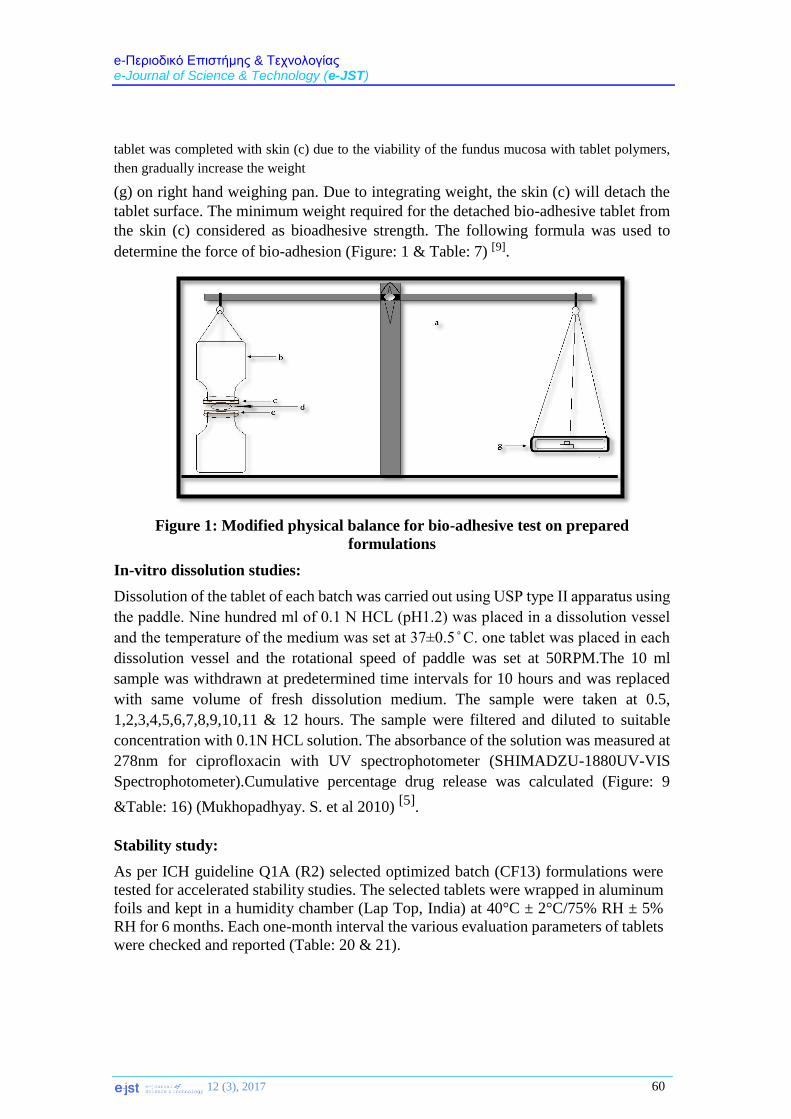
(g) on right hand weighing pan. Due to integrating weight, the skin (c) will detach the
tablet surface. The minimum weight required for the detached bio-adhesive tablet from
the skin (c) considered as bioadhesive strength. The following formula was used to
determine the force of bio-adhesion (Figure: 1 & Table: 7) [9].
Figure 1: Modified physical balance for bio-adhesive test on prepared
formulations
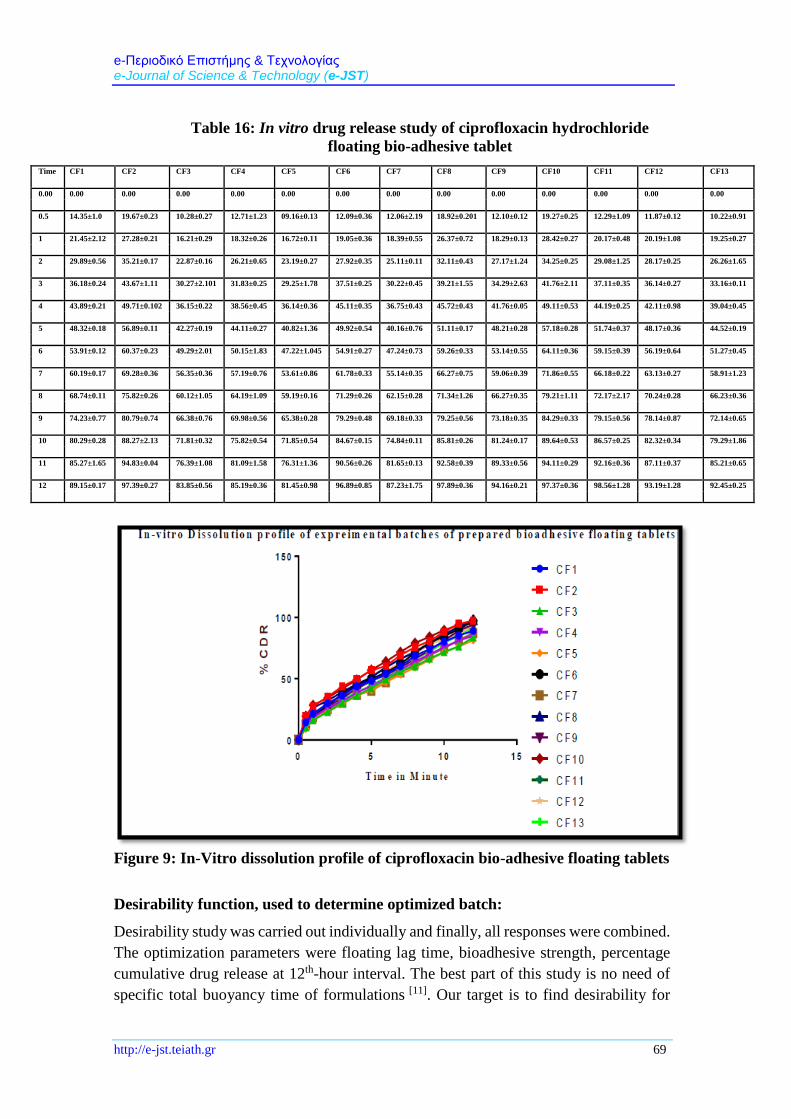
In-vitro dissolution studies:
Dissolution of the tablet of each batch was carried out using USP type II apparatus using
the paddle. Nine hundred ml of 0.1 N HCL (pH1.2) was placed in a dissolution vessel
and the temperature of the medium was set at 37±0.5 ̊ C. one tablet was placed in each
dissolution vessel and the rotational speed of paddle was set at 50RPM.The 10 ml
sample was withdrawn at predetermined time intervals for 10 hours and was replaced
with same volume of fresh dissolution medium. The sample were taken at 0.5,
1,2,3,4,5,6,7,8,9,10,11 & 12 hours. The sample were filtered and diluted to suitable
concentration with 0.1N HCL solution. The absorbance of the solution was measured at
278nm for ciprofloxacin with UV spectrophotometer (SHIMADZU-1880UV-VIS
Spectrophotometer).Cumulative percentage drug release was calculated (Figure: 9
&Table: 16) (Mukhopadhyay. S. et al 2010) [5]
.
Stability study:
As per ICH guideline Q1A (R2) selected optimized batch (CF13) formulations were
tested for accelerated stability studies. The selected tablets were wrapped in aluminum
foils and kept in a humidity chamber (Lap Top, India) at 40°C ± 2°C/75% RH ± 5%
RH for 6 months. Each one-month interval the various evaluation parameters of tablets
were checked and reported (Table: 20 & 21).
e-Περιοδικό Επιστήμης & Τεχνολογίας e-Journal of Science & Technology (e-JST)
http://e-jst.teiath.gr 61
Pre-formulation studies output:
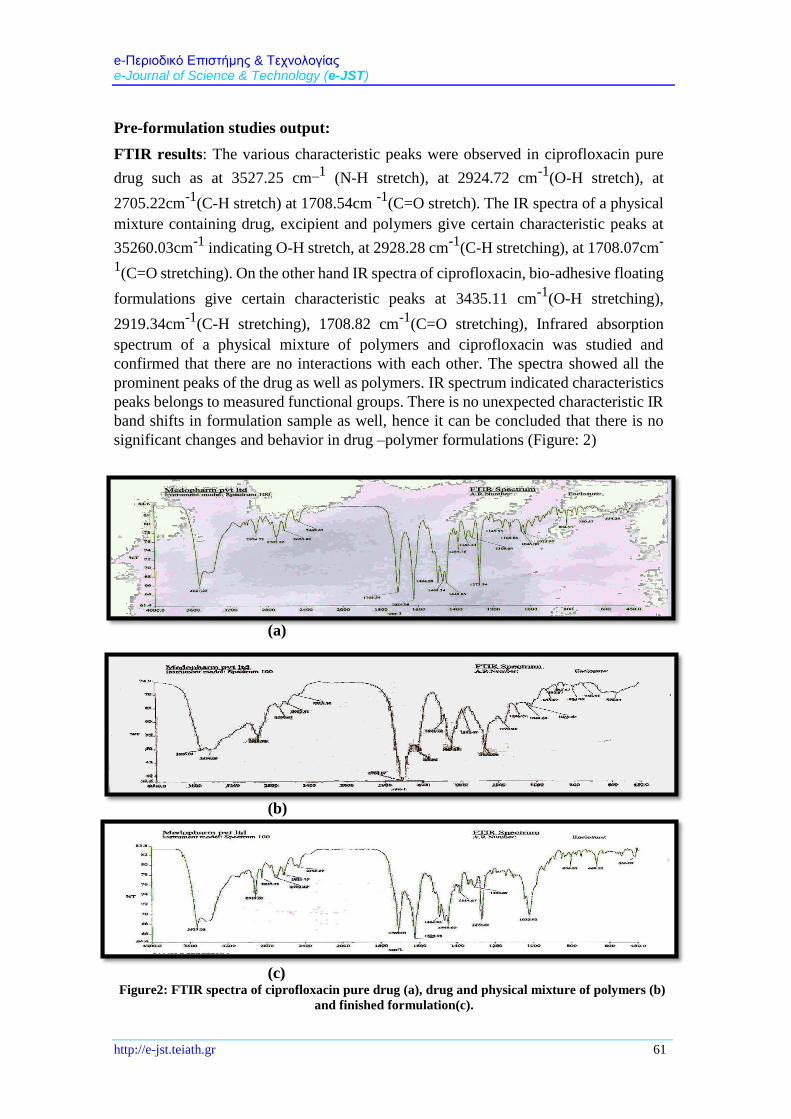
FTIR results: The various characteristic peaks were observed in ciprofloxacin pure
drug such as at 3527.25 cm_1
(N-H stretch), at 2924.72 cm-1
(O-H stretch), at
2705.22cm-1
(C-H stretch) at 1708.54cm -1
(C=O stretch). The IR spectra of a physical
mixture containing drug, excipient and polymers give certain characteristic peaks at
35260.03cm-1
indicating O-H stretch, at 2928.28 cm-1
(C-H stretching), at 1708.07cm-
1(C=O stretching). On the other hand IR spectra of ciprofloxacin, bio-adhesive floating
formulations give certain characteristic peaks at 3435.11 cm-1
(O-H stretching),
2919.34cm-1
(C-H stretching), 1708.82 cm-1
(C=O stretching), Infrared absorption
spectrum of a physical mixture of polymers and ciprofloxacin was studied and
confirmed that there are no interactions with each other. The spectra showed all the
prominent peaks of the drug as well as polymers. IR spectrum indicated characteristics
peaks belongs to measured functional groups. There is no unexpected characteristic IR
band shifts in formulation sample as well, hence it can be concluded that there is no
significant changes and behavior in drug –polymer formulations (Figure: 2)
(a)
(b)
(c) Figure2: FTIR spectra of ciprofloxacin pure drug (a), drug and physical mixture of polymers (b)
and finished formulation(c).
e-Περιοδικό Επιστήμης & Τεχνολογίας e-Journal of Science & Technology (e-JST)
12 (3), 2017 62
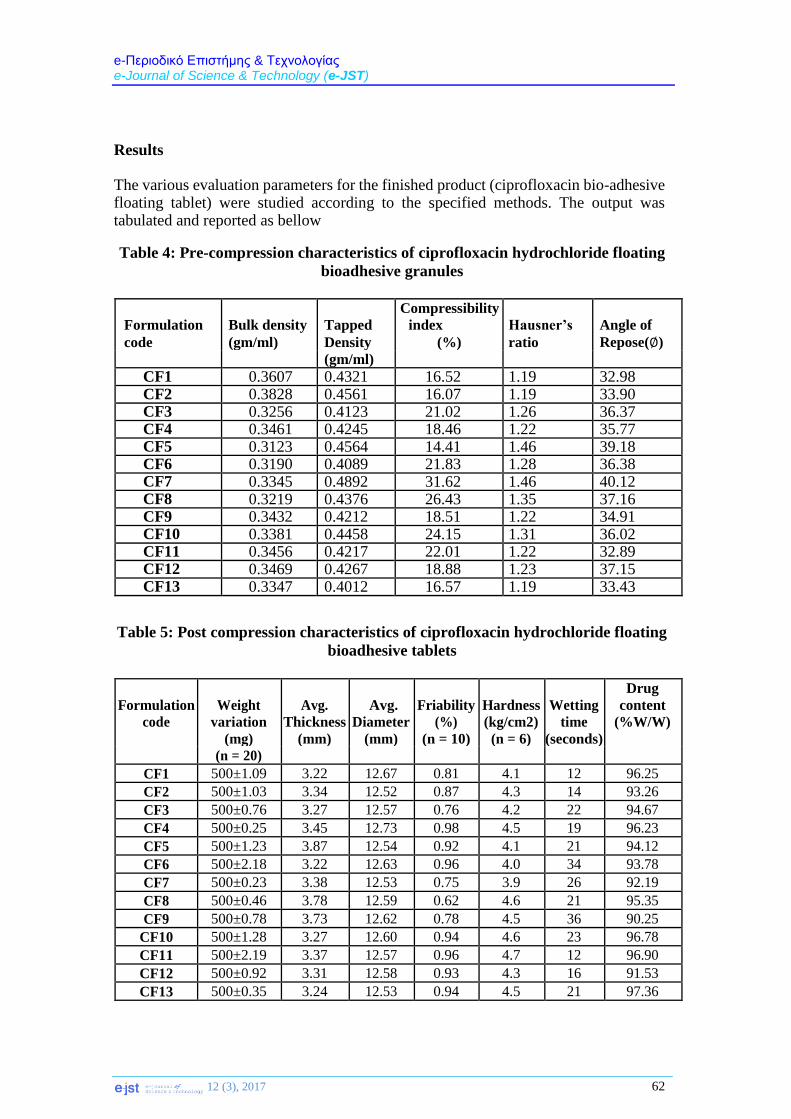
Results The various evaluation parameters for the finished product (ciprofloxacin bio-adhesive floating tablet) were studied according to the specified methods. The output was tabulated and reported as bellow
Table 4: Pre-compression characteristics of ciprofloxacin hydrochloride floating
bioadhesive granules
Formulation Bulk density Tapped
Compressibility
index Hausner’s Angle of
code (gm/ml) Density (%) ratio Repose(∅)
(gm/ml)
CF1 0.3607 0.4321 16.52 1.19 32.98 CF2 0.3828 0.4561 16.07 1.19 33.90 CF3 0.3256 0.4123 21.02 1.26 36.37 CF4 0.3461 0.4245 18.46 1.22 35.77 CF5 0.3123 0.4564 14.41 1.46 39.18 CF6 0.3190 0.4089 21.83 1.28 36.38 CF7 0.3345 0.4892 31.62 1.46 40.12 CF8 0.3219 0.4376 26.43 1.35 37.16 CF9 0.3432 0.4212 18.51 1.22 34.91 CF10 0.3381 0.4458 24.15 1.31 36.02 CF11 0.3456 0.4217 22.01 1.22 32.89 CF12 0.3469 0.4267 18.88 1.23 37.15 CF13 0.3347 0.4012 16.57 1.19 33.43
Table 5: Post compression characteristics of ciprofloxacin hydrochloride floating
bioadhesive tablets
Formulation Weight Avg. Avg. Friability Hardness Wetting
Drug
content
code variation Thickness Diameter (%) (kg/cm2) time (%W/W) (mg) (mm) (mm) (n = 10) (n = 6) (seconds)
(n = 20)
CF1 500±1.09 3.22 12.67 0.81 4.1 12 96.25
CF2 500±1.03 3.34 12.52 0.87 4.3 14 93.26
CF3 500±0.76 3.27 12.57 0.76 4.2 22 94.67
CF4 500±0.25 3.45 12.73 0.98 4.5 19 96.23
CF5 500±1.23 3.87 12.54 0.92 4.1 21 94.12
CF6 500±2.18 3.22 12.63 0.96 4.0 34 93.78
CF7 500±0.23 3.38 12.53 0.75 3.9 26 92.19
CF8 500±0.46 3.78 12.59 0.62 4.6 21 95.35
CF9 500±0.78 3.73 12.62 0.78 4.5 36 90.25
CF10 500±1.28 3.27 12.60 0.94 4.6 23 96.78
CF11 500±2.19 3.37 12.57 0.96 4.7 12 96.90
CF12 500±0.92 3.31 12.58 0.93 4.3 16 91.53
CF13 500±0.35 3.24 12.53 0.94 4.5 21 97.36
e-Περιοδικό Επιστήμης & Τεχνολογίας e-Journal of Science & Technology (e-JST)
http://e-jst.teiath.gr 63
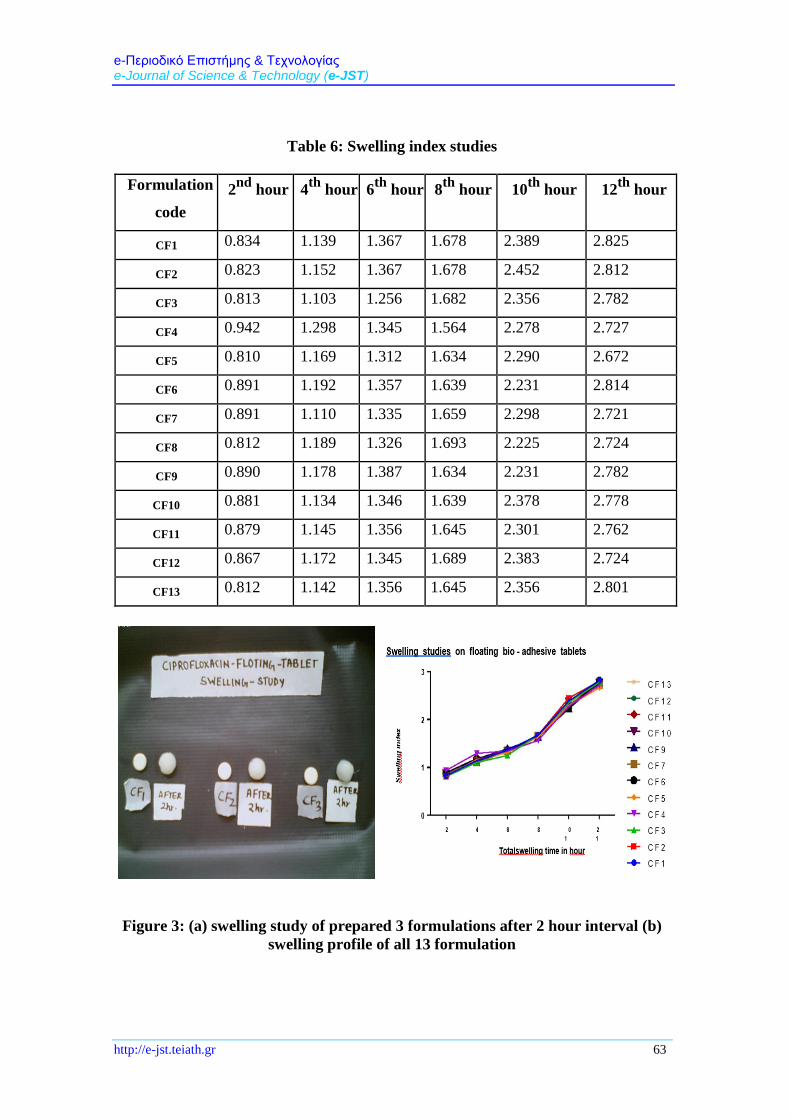
Table 6: Swelling index studies
Formulation
code
2nd
hour 4th
hour 6th
hour 8th
hour 10th
hour 12th
hour
CF1 0.834 1.139 1.367 1.678 2.389 2.825
CF2 0.823 1.152 1.367 1.678 2.452 2.812
CF3 0.813 1.103 1.256 1.682 2.356 2.782
CF4 0.942 1.298 1.345 1.564 2.278 2.727
CF5 0.810 1.169 1.312 1.634 2.290 2.672
CF6 0.891 1.192 1.357 1.639 2.231 2.814
CF7 0.891 1.110 1.335 1.659 2.298 2.721
CF8 0.812 1.189 1.326 1.693 2.225 2.724
CF9 0.890 1.178 1.387 1.634 2.231 2.782
CF10 0.881 1.134 1.346 1.639 2.378 2.778
CF11 0.879 1.145 1.356 1.645 2.301 2.762
CF12 0.867 1.172 1.345 1.689 2.383 2.724
CF13 0.812 1.142 1.356 1.645 2.356 2.801
Figure 3: (a) swelling study of prepared 3 formulations after 2 hour interval (b)
swelling profile of all 13 formulation
e-Περιοδικό Επιστήμης & Τεχνολογίας e-Journal of Science & Technology (e-JST)
12 (3), 2017 64
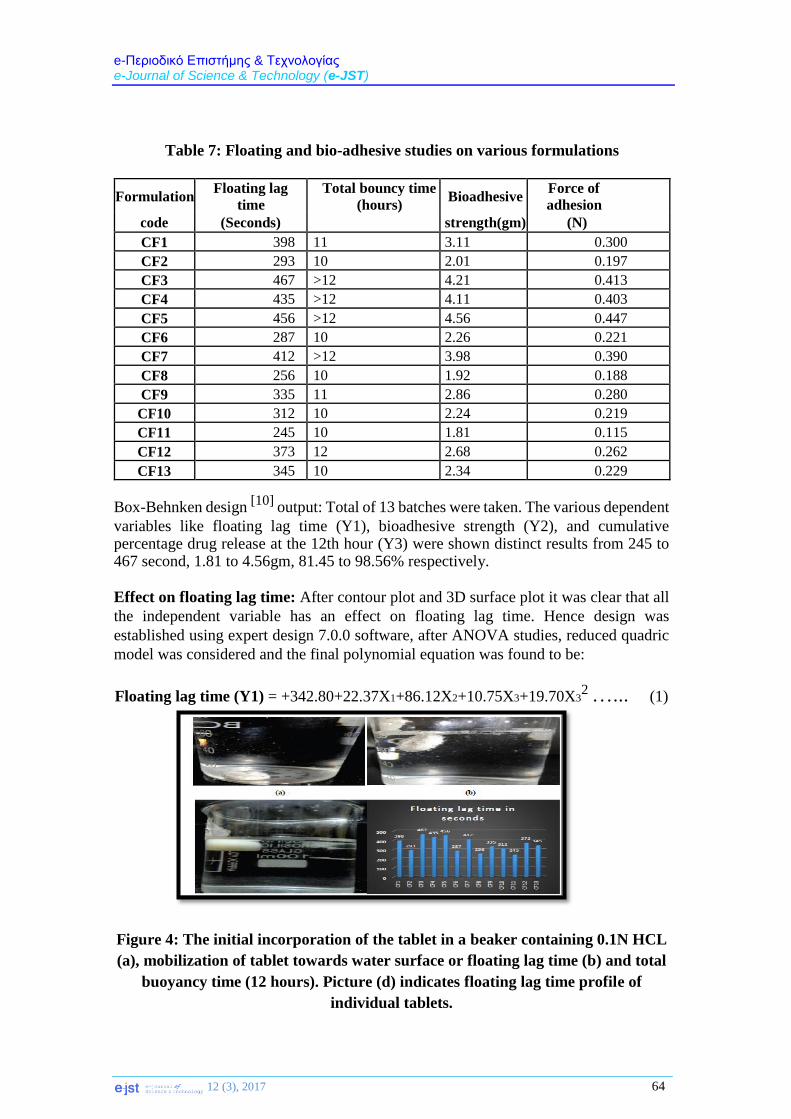
Table 7: Floating and bio-adhesive studies on various formulations
Formulation Floating lag
time
Total bouncy time
(hours) Bioadhesive
Force of
adhesion
code (Seconds) strength(gm) (N)
CF1 398 11 3.11 0.300
CF2 293 10 2.01 0.197
CF3 467 >12 4.21 0.413
CF4 435 >12 4.11 0.403
CF5 456 >12 4.56 0.447
CF6 287 10 2.26 0.221
CF7 412 >12 3.98 0.390
CF8 256 10 1.92 0.188
CF9 335 11 2.86 0.280
CF10 312 10 2.24 0.219
CF11 245 10 1.81 0.115
CF12 373 12 2.68 0.262
CF13 345 10 2.34 0.229
Box-Behnken design [10]
output: Total of 13 batches were taken. The various dependent
variables like floating lag time (Y1), bioadhesive strength (Y2), and cumulative percentage drug release at the 12th hour (Y3) were shown distinct results from 245 to 467 second, 1.81 to 4.56gm, 81.45 to 98.56% respectively.
Effect on floating lag time: After contour plot and 3D surface plot it was clear that all
the independent variable has an effect on floating lag time. Hence design was
established using expert design 7.0.0 software, after ANOVA studies, reduced quadric
model was considered and the final polynomial equation was found to be:
Floating lag time (Y1) = +342.80+22.37X1+86.12X2+10.75X3+19.70X32 …... (1)
Figure 4: The initial incorporation of the tablet in a beaker containing 0.1N HCL
(a), mobilization of tablet towards water surface or floating lag time (b) and total
buoyancy time (12 hours). Picture (d) indicates floating lag time profile of
individual tablets.
e-Περιοδικό Επιστήμης & Τεχνολογίας e-Journal of Science & Technology (e-JST)
http://e-jst.teiath.gr 65
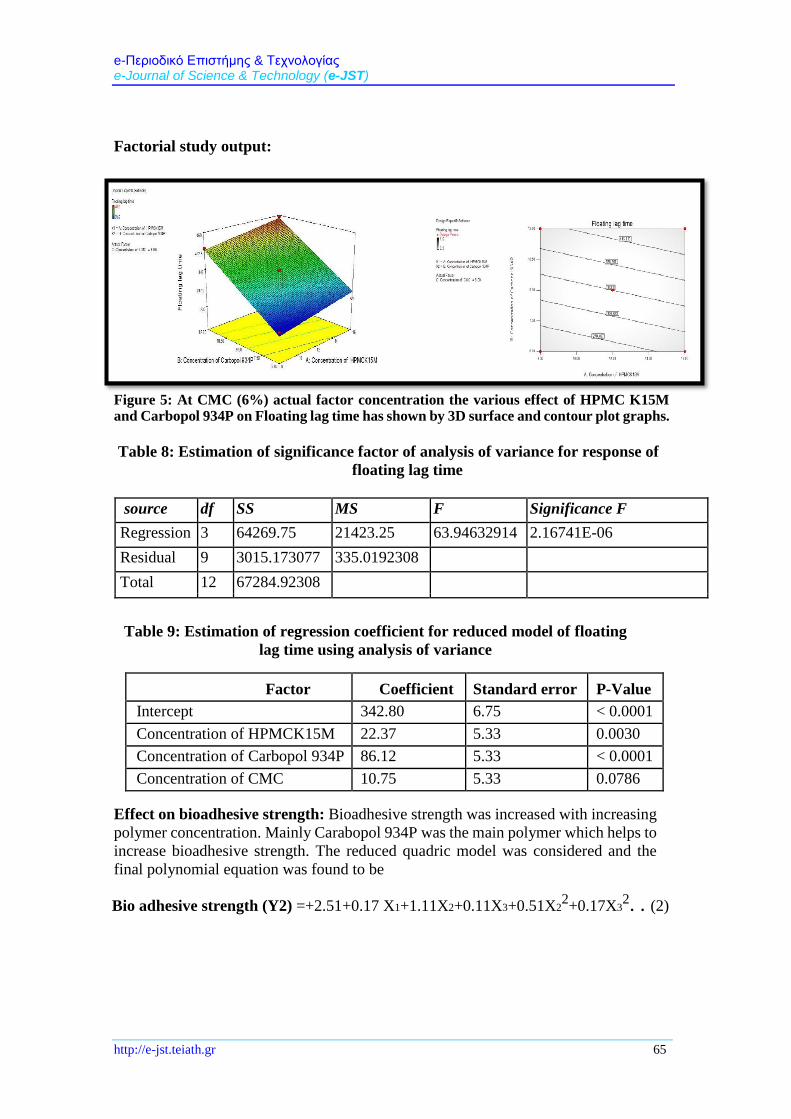
Factorial study output:
Figure 5: At CMC (6%) actual factor concentration the various effect of HPMC K15M and Carbopol 934P on Floating lag time has shown by 3D surface and contour plot graphs.
Table 8: Estimation of significance factor of analysis of variance for response of
floating lag time
source df SS MS F Significance F
Regression 3 64269.75 21423.25 63.94632914 2.16741E-06
Residual 9 3015.173077 335.0192308
Total 12 67284.92308
Table 9: Estimation of regression coefficient for reduced model of floating
lag time using analysis of variance
Factor Coefficient Standard error P-Value
Intercept 342.80 6.75 < 0.0001
Concentration of HPMCK15M 22.37 5.33 0.0030
Concentration of Carbopol 934P 86.12 5.33 < 0.0001
Concentration of CMC 10.75 5.33 0.0786
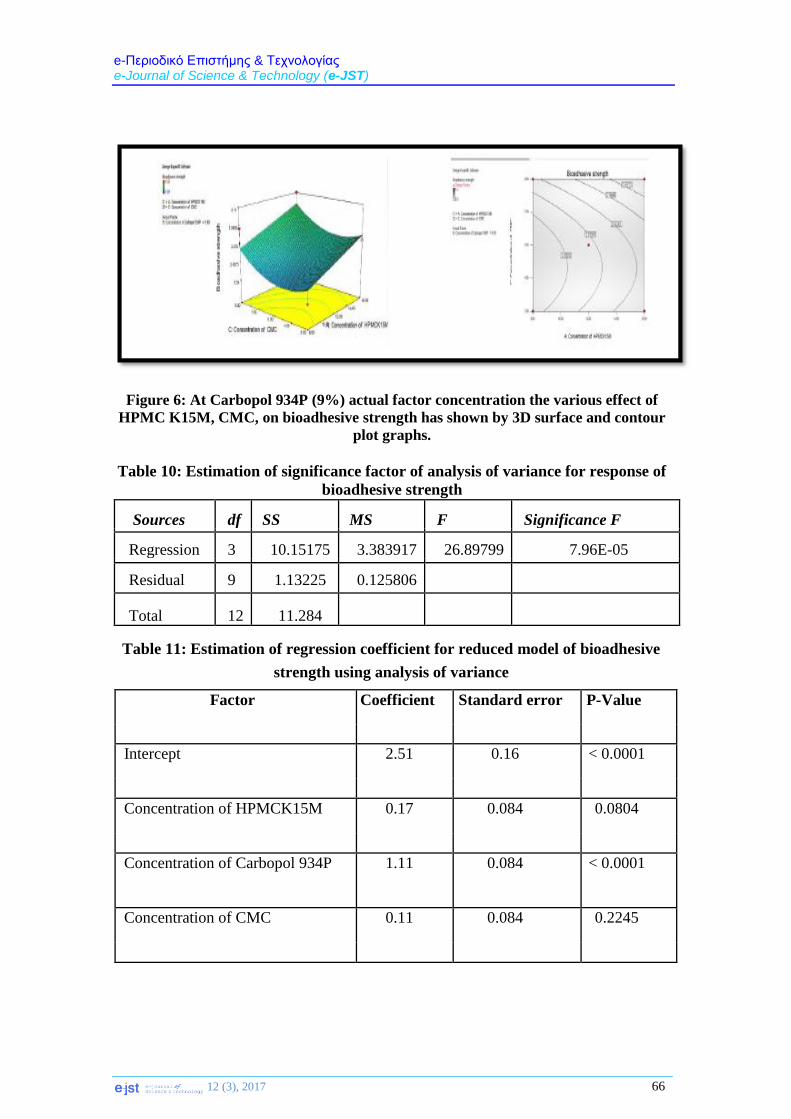
Effect on bioadhesive strength: Bioadhesive strength was increased with increasing
polymer concentration. Mainly Carabopol 934P was the main polymer which helps to
increase bioadhesive strength. The reduced quadric model was considered and the
final polynomial equation was found to be
Bio adhesive strength (Y2) =+2.51+0.17 X1+1.11X2+0.11X3+0.51X22+0.17X3
2. . (2)
e-Περιοδικό Επιστήμης & Τεχνολογίας e-Journal of Science & Technology (e-JST)
12 (3), 2017 66
Figure 6: At Carbopol 934P (9%) actual factor concentration the various effect of
HPMC K15M, CMC, on bioadhesive strength has shown by 3D surface and contour
plot graphs.
Table 10: Estimation of significance factor of analysis of variance for response of
bioadhesive strength
Table 11: Estimation of regression coefficient for reduced model of bioadhesive
strength using analysis of variance
Factor Coefficient Standard error P-Value
Intercept 2.51 0.16 < 0.0001
Concentration of HPMCK15M 0.17 0.084 0.0804
Concentration of Carbopol 934P 1.11 0.084 < 0.0001
Concentration of CMC 0.11 0.084 0.2245
Sources df SS MS F Significance F
Regression 3 10.15175 3.383917 26.89799 7.96E-05
Residual 9 1.13225 0.125806
Total 12 11.284
e-Περιοδικό Επιστήμης & Τεχνολογίας e-Journal of Science & Technology (e-JST)
http://e-jst.teiath.gr 67
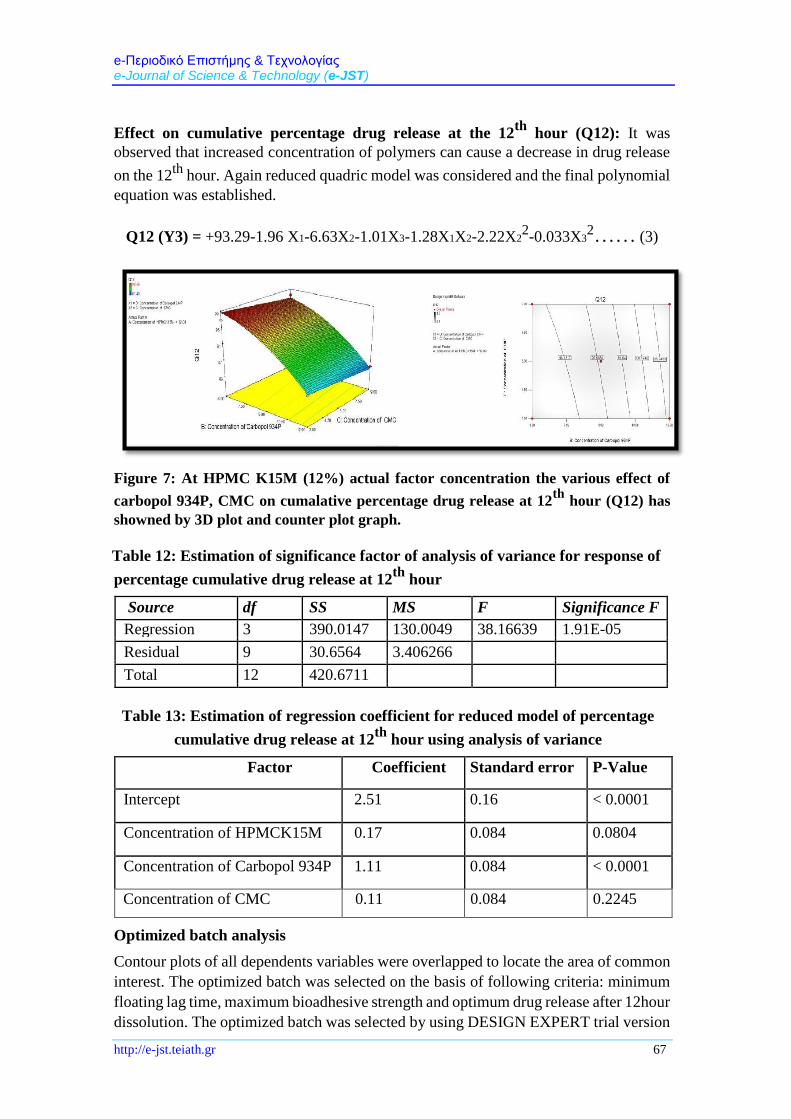
Effect on cumulative percentage drug release at the 12th
hour (Q12): It was
observed that increased concentration of polymers can cause a decrease in drug release
on the 12th
hour. Again reduced quadric model was considered and the final polynomial
equation was established.
Q12 (Y3) = +93.29-1.96 X1-6.63X2-1.01X3-1.28X1X2-2.22X22-0.033X3
2…… (3)
Figure 7: At HPMC K15M (12%) actual factor concentration the various effect of
carbopol 934P, CMC on cumalative percentage drug release at 12th
hour (Q12) has
showned by 3D plot and counter plot graph.
Table 12: Estimation of significance factor of analysis of variance for response of
percentage cumulative drug release at 12th
hour
Source df SS MS F Significance F
Regression 3 390.0147 130.0049 38.16639 1.91E-05
Residual 9 30.6564 3.406266
Total 12 420.6711
Table 13: Estimation of regression coefficient for reduced model of percentage
cumulative drug release at 12th
hour using analysis of variance
Factor Coefficient Standard error P-Value
Intercept 2.51 0.16 < 0.0001
Concentration of HPMCK15M 0.17 0.084 0.0804
Concentration of Carbopol 934P 1.11 0.084 < 0.0001
Concentration of CMC 0.11 0.084 0.2245
Optimized batch analysis
Contour plots of all dependents variables were overlapped to locate the area of common
interest. The optimized batch was selected on the basis of following criteria: minimum
floating lag time, maximum bioadhesive strength and optimum drug release after 12hour
dissolution. The optimized batch was selected by using DESIGN EXPERT trial version
e-Περιοδικό Επιστήμης & Τεχνολογίας e-Journal of Science & Technology (e-JST)
12 (3), 2017 68
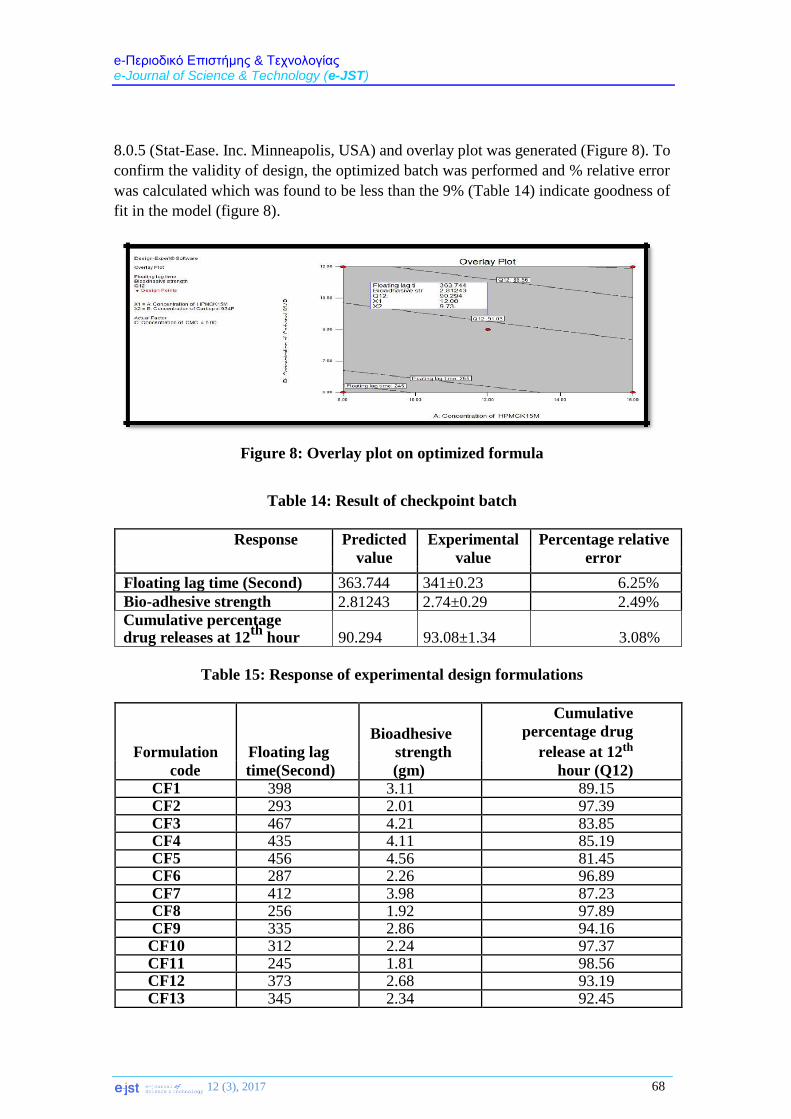
8.0.5 (Stat-Ease. Inc. Minneapolis, USA) and overlay plot was generated (Figure 8). To
confirm the validity of design, the optimized batch was performed and % relative error
was calculated which was found to be less than the 9% (Table 14) indicate goodness of
fit in the model (figure 8).
Figure 8: Overlay plot on optimized formula
Table 14: Result of checkpoint batch
Response Predicted Experimental Percentage relative value value error
Floating lag time (Second) 363.744 341±0.23 6.25%
Bio-adhesive strength 2.81243 2.74±0.29 2.49% Cumulative percentage drug releases at 12
th hour 90.294 93.08±1.34 3.08%
Table 15: Response of experimental design formulations
Formulation Floating lag
Bioadhesive
strength
Cumulative
percentage drug
release at 12th
code time(Second) (gm) hour (Q12) CF1 398 3.11 89.15 CF2 293 2.01 97.39 CF3 467 4.21 83.85 CF4 435 4.11 85.19 CF5 456 4.56 81.45 CF6 287 2.26 96.89 CF7 412 3.98 87.23 CF8 256 1.92 97.89 CF9 335 2.86 94.16
CF10 312 2.24 97.37 CF11 245 1.81 98.56 CF12 373 2.68 93.19 CF13 345 2.34 92.45
e-Περιοδικό Επιστήμης & Τεχνολογίας e-Journal of Science & Technology (e-JST)
http://e-jst.teiath.gr 69
Table 16: In vitro drug release study of ciprofloxacin hydrochloride
floating bio-adhesive tablet
Figure 9: In-Vitro dissolution profile of ciprofloxacin bio-adhesive floating tablets
Desirability function, used to determine optimized batch:
Desirability study was carried out individually and finally, all responses were combined.
The optimization parameters were floating lag time, bioadhesive strength, percentage
cumulative drug release at 12th-hour interval. The best part of this study is no need of
specific total buoyancy time of formulations [11]. Our target is to find desirability for
Time CF1 CF2 CF3 CF4 CF5 CF6 CF7 CF8 CF9 CF10 CF11 CF12 CF13
0.00 0.00 0.00 0.00 0.00 0.00 0.00 0.00 0.00 0.00 0.00 0.00 0.00 0.00
0.5 14.35±1.0 19.67±0.23 10.28±0.27 12.71±1.23 09.16±0.13 12.09±0.36 12.06±2.19 18.92±0.201 12.10±0.12 19.27±0.25 12.29±1.09 11.87±0.12 10.22±0.91
1 21.45±2.12 27.28±0.21 16.21±0.29 18.32±0.26 16.72±0.11 19.05±0.36 18.39±0.55 26.37±0.72 18.29±0.13 28.42±0.27 20.17±0.48 20.19±1.08 19.25±0.27
2 29.89±0.56 35.21±0.17 22.87±0.16 26.21±0.65 23.19±0.27 27.92±0.35 25.11±0.11 32.11±0.43 27.17±1.24 34.25±0.25 29.08±1.25 28.17±0.25 26.26±1.65
3 36.18±0.24 43.67±1.11 30.27±2.101 31.83±0.25 29.25±1.78 37.51±0.25 30.22±0.45 39.21±1.55 34.29±2.63 41.76±2.11 37.11±0.35 36.14±0.27 33.16±0.11
4 43.89±0.21 49.71±0.102 36.15±0.22 38.56±0.45 36.14±0.36 45.11±0.35 36.75±0.43 45.72±0.43 41.76±0.05 49.11±0.53 44.19±0.25 42.11±0.98 39.04±0.45
5 48.32±0.18 56.89±0.11 42.27±0.19 44.11±0.27 40.82±1.36 49.92±0.54 40.16±0.76 51.11±0.17 48.21±0.28 57.18±0.28 51.74±0.37 48.17±0.36 44.52±0.19
6 53.91±0.12 60.37±0.23 49.29±2.01 50.15±1.83 47.22±1.045 54.91±0.27 47.24±0.73 59.26±0.33 53.14±0.55 64.11±0.36 59.15±0.39 56.19±0.64 51.27±0.45
7 60.19±0.17 69.28±0.36 56.35±0.36 57.19±0.76 53.61±0.86 61.78±0.33 55.14±0.35 66.27±0.75 59.06±0.39 71.86±0.55 66.18±0.22 63.13±0.27 58.91±1.23
8 68.74±0.11 75.82±0.26 60.12±1.05 64.19±1.09 59.19±0.16 71.29±0.26 62.15±0.28 71.34±1.26 66.27±0.35 79.21±1.11 72.17±2.17 70.24±0.28 66.23±0.36
9 74.23±0.77 80.79±0.74 66.38±0.76 69.98±0.56 65.38±0.28 79.29±0.48 69.18±0.33 79.25±0.56 73.18±0.35 84.29±0.33 79.15±0.56 78.14±0.87 72.14±0.65
10 80.29±0.28 88.27±2.13 71.81±0.32 75.82±0.54 71.85±0.54 84.67±0.15 74.84±0.11 85.81±0.26 81.24±0.17 89.64±0.53 86.57±0.25 82.32±0.34 79.29±1.86
11 85.27±1.65 94.83±0.04 76.39±1.08 81.09±1.58 76.31±1.36 90.56±0.26 81.65±0.13 92.58±0.39 89.33±0.56 94.11±0.29 92.16±0.36 87.11±0.37 85.21±0.65
12 89.15±0.17 97.39±0.27 83.85±0.56 85.19±0.36 81.45±0.98 96.89±0.85 87.23±1.75 97.89±0.36 94.16±0.21 97.37±0.36 98.56±1.28 93.19±1.28 92.45±0.25
e-Περιοδικό Επιστήμης & Τεχνολογίας e-Journal of Science & Technology (e-JST)
12 (3), 2017 70
minimum floating lag time hence following equations to be followed:
d1= {(U-y) / (U-T)}…… (4)
Where U = Upper limit of all formulation floating leg time 467 second) y= Individual
floating lag time T= Targeted floating lag time, as per counter plot chart (363.744
seconds). When y<T, T≤ y ≤U, y>U
Our next target was to find desirability factor for maximum bioadhesive strength (d2)
and maximum dissolution profile at 12th hour (d3), hence following equations has to be
followed:
Desirability factor for d2 & d3 = {(y-L)/ (T-L)}…… (5)
When, y<L, L≤ y ≤T, y>T
L= Lower limit for bioadhesive strength and cumulative percentage drug release at 12th
hour respectably (1.81 gm and 81.45%)
y= Individual bioadhesive strength and percentage cumulative drug release at the 12th
hour
T= Targeted bioadhesive strength (as per counter plot, 2.81 gm) and targeted cumulative
percentage drug release at the 12th hour (as per counter plot, 90.294%).
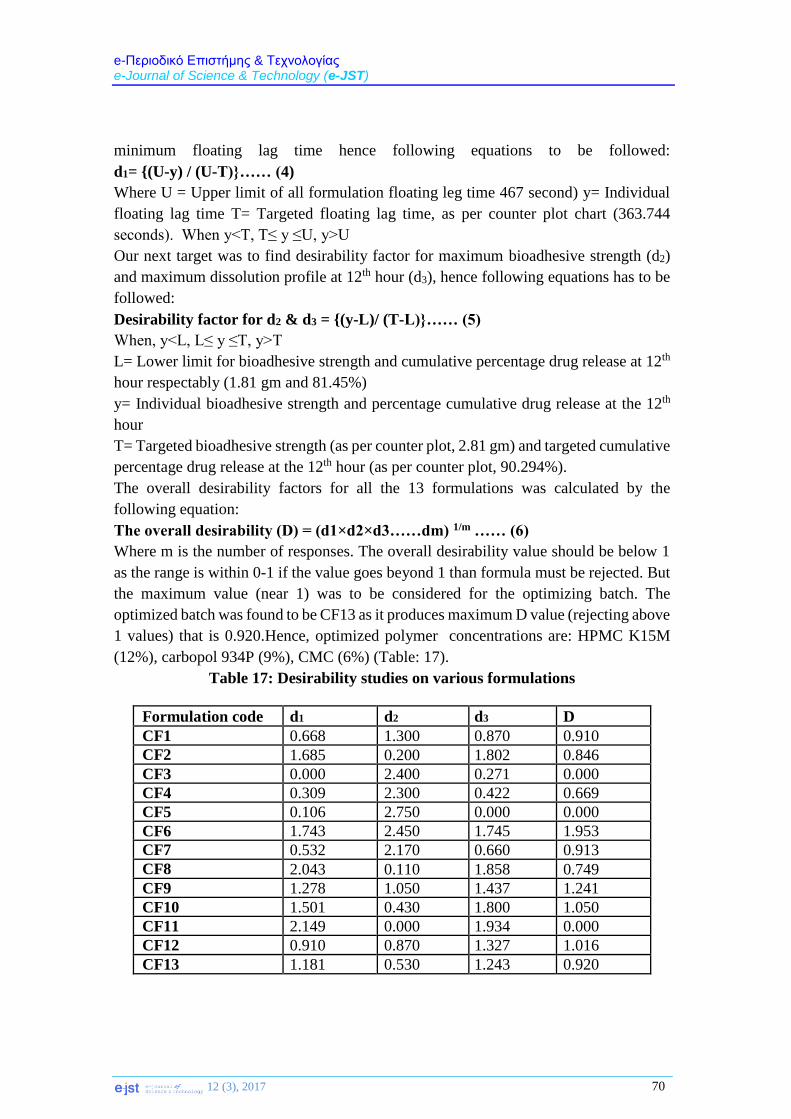
The overall desirability factors for all the 13 formulations was calculated by the
following equation:
The overall desirability (D) = (d1×d2×d3……dm) 1/m …… (6)
Where m is the number of responses. The overall desirability value should be below 1
as the range is within 0-1 if the value goes beyond 1 than formula must be rejected. But
the maximum value (near 1) was to be considered for the optimizing batch. The
optimized batch was found to be CF13 as it produces maximum D value (rejecting above
1 values) that is 0.920.Hence, optimized polymer concentrations are: HPMC K15M
(12%), carbopol 934P (9%), CMC (6%) (Table: 17).
Table 17: Desirability studies on various formulations
Formulation code d1 d2 d3 D
CF1 0.668 1.300 0.870 0.910
CF2 1.685 0.200 1.802 0.846
CF3 0.000 2.400 0.271 0.000
CF4 0.309 2.300 0.422 0.669
CF5 0.106 2.750 0.000 0.000
CF6 1.743 2.450 1.745 1.953
CF7 0.532 2.170 0.660 0.913
CF8 2.043 0.110 1.858 0.749
CF9 1.278 1.050 1.437 1.241
CF10 1.501 0.430 1.800 1.050
CF11 2.149 0.000 1.934 0.000
CF12 0.910 0.870 1.327 1.016
CF13 1.181 0.530 1.243 0.920
e-Περιοδικό Επιστήμης & Τεχνολογίας e-Journal of Science & Technology (e-JST)
http://e-jst.teiath.gr 71
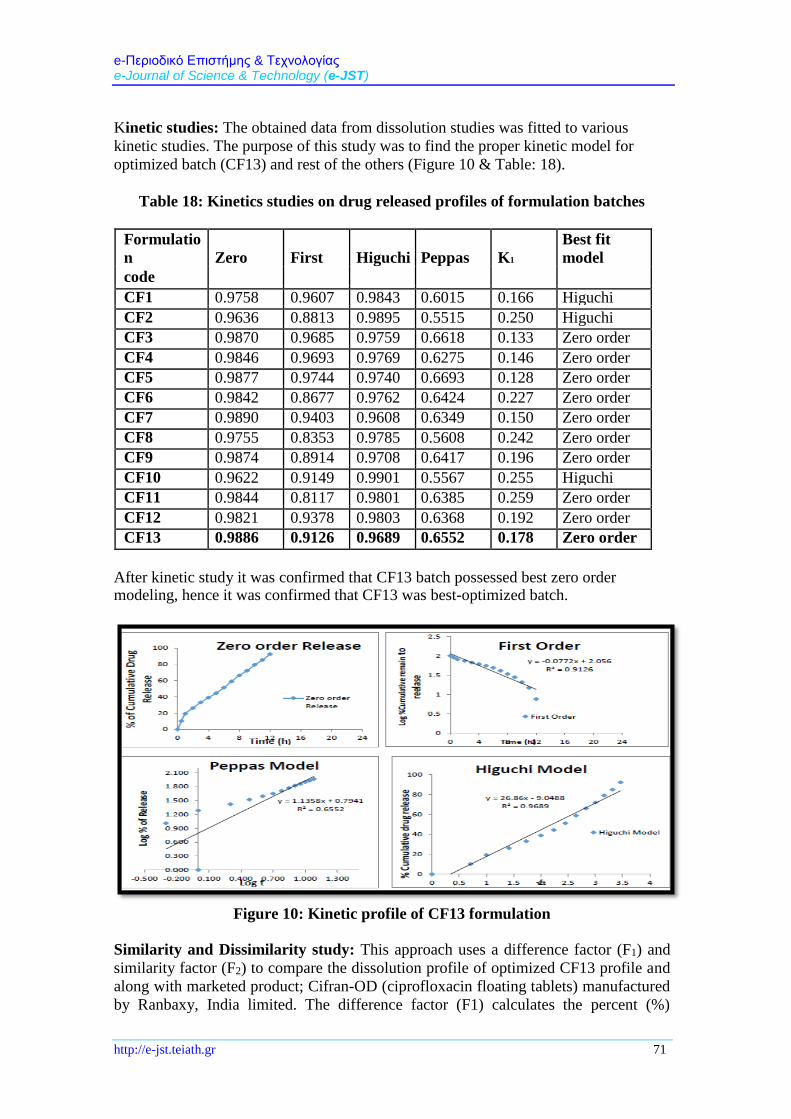
Kinetic studies: The obtained data from dissolution studies was fitted to various
kinetic studies. The purpose of this study was to find the proper kinetic model for
optimized batch (CF13) and rest of the others (Figure 10 & Table: 18).
Table 18: Kinetics studies on drug released profiles of formulation batches
Formulatio
n Zero First Higuchi Peppas K1
Best fit
model
code
CF1 0.9758 0.9607 0.9843 0.6015 0.166 Higuchi
CF2 0.9636 0.8813 0.9895 0.5515 0.250 Higuchi
CF3 0.9870 0.9685 0.9759 0.6618 0.133 Zero order
CF4 0.9846 0.9693 0.9769 0.6275 0.146 Zero order
CF5 0.9877 0.9744 0.9740 0.6693 0.128 Zero order
CF6 0.9842 0.8677 0.9762 0.6424 0.227 Zero order
CF7 0.9890 0.9403 0.9608 0.6349 0.150 Zero order
CF8 0.9755 0.8353 0.9785 0.5608 0.242 Zero order
CF9 0.9874 0.8914 0.9708 0.6417 0.196 Zero order
CF10 0.9622 0.9149 0.9901 0.5567 0.255 Higuchi
CF11 0.9844 0.8117 0.9801 0.6385 0.259 Zero order
CF12 0.9821 0.9378 0.9803 0.6368 0.192 Zero order
CF13 0.9886 0.9126 0.9689 0.6552 0.178 Zero order
After kinetic study it was confirmed that CF13 batch possessed best zero order modeling, hence it was confirmed that CF13 was best-optimized batch.
Figure 10: Kinetic profile of CF13 formulation
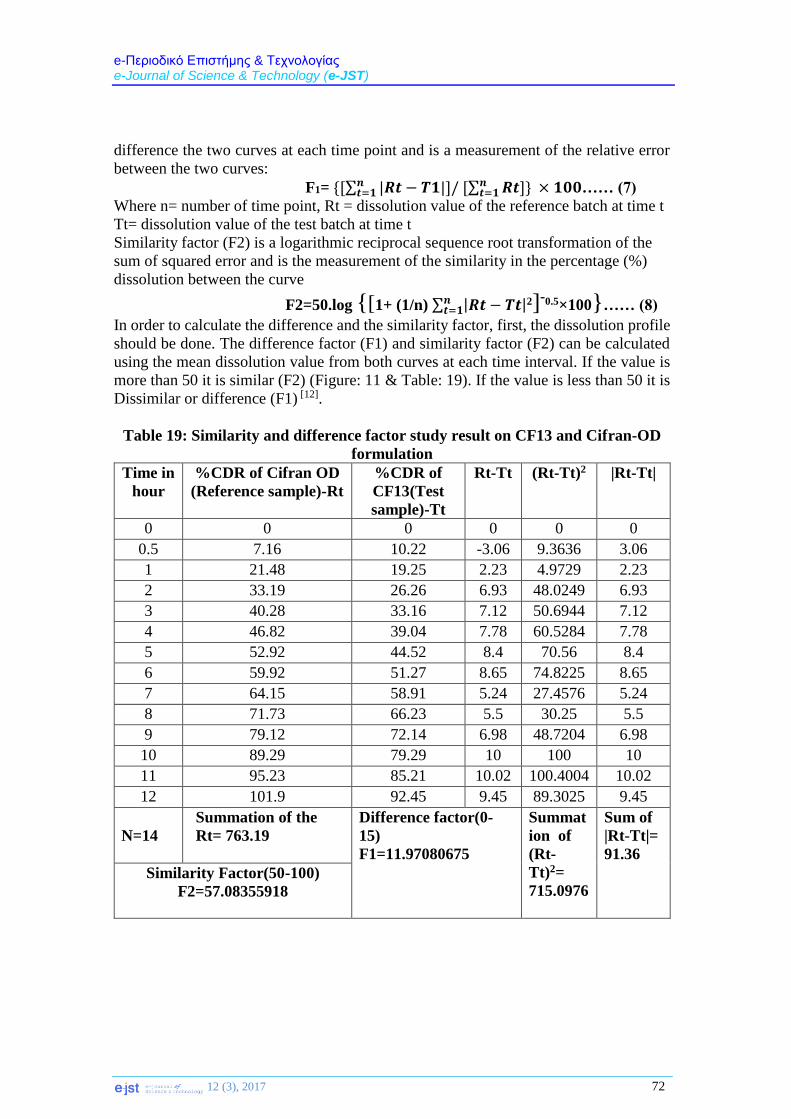
Similarity and Dissimilarity study: This approach uses a difference factor (F1) and
similarity factor (F2) to compare the dissolution profile of optimized CF13 profile and
along with marketed product; Cifran-OD (ciprofloxacin floating tablets) manufactured
by Ranbaxy, India limited. The difference factor (F1) calculates the percent (%)
e-Περιοδικό Επιστήμης & Τεχνολογίας e-Journal of Science & Technology (e-JST)
12 (3), 2017 72
difference the two curves at each time point and is a measurement of the relative error
between the two curves:
F1= {[∑ |𝑹𝒕 − 𝑻𝟏|]/ [∑ 𝑹𝒕]} × 𝟏𝟎𝟎𝒏𝒕=𝟏
𝒏𝒕=𝟏 …… (7)
Where n= number of time point, Rt = dissolution value of the reference batch at time t
Tt= dissolution value of the test batch at time t
Similarity factor (F2) is a logarithmic reciprocal sequence root transformation of the
sum of squared error and is the measurement of the similarity in the percentage (%)
dissolution between the curve
F2=50.log {[1+ (1/n) ∑ |𝑹𝒕 − 𝑻𝒕|𝒏𝒕=𝟏
2]-0.5×100}…… (8)
In order to calculate the difference and the similarity factor, first, the dissolution profile
should be done. The difference factor (F1) and similarity factor (F2) can be calculated
using the mean dissolution value from both curves at each time interval. If the value is
more than 50 it is similar (F2) (Figure: 11 & Table: 19). If the value is less than 50 it is
Dissimilar or difference (F1) [12].
Table 19: Similarity and difference factor study result on CF13 and Cifran-OD
formulation
Time in
hour
%CDR of Cifran OD
(Reference sample)-Rt
%CDR of
CF13(Test
sample)-Tt
Rt-Tt (Rt-Tt)2 |Rt-Tt|
0 0 0 0 0 0
0.5 7.16 10.22 -3.06 9.3636 3.06
1 21.48 19.25 2.23 4.9729 2.23
2 33.19 26.26 6.93 48.0249 6.93
3 40.28 33.16 7.12 50.6944 7.12
4 46.82 39.04 7.78 60.5284 7.78
5 52.92 44.52 8.4 70.56 8.4
6 59.92 51.27 8.65 74.8225 8.65
7 64.15 58.91 5.24 27.4576 5.24
8 71.73 66.23 5.5 30.25 5.5
9 79.12 72.14 6.98 48.7204 6.98
10 89.29 79.29 10 100 10
11 95.23 85.21 10.02 100.4004 10.02
12 101.9 92.45 9.45 89.3025 9.45
N=14
Summation of the
Rt= 763.19
Difference factor(0-
15)
F1=11.97080675
Summat
ion of
(Rt-
Tt)2=
715.0976
Sum of
|Rt-Tt|=
91.36
Similarity Factor(50-100)
F2=57.08355918
e-Περιοδικό Επιστήμης & Τεχνολογίας e-Journal of Science & Technology (e-JST)
http://e-jst.teiath.gr 73
Figure 11: Dissolution profile of CF13 and Cifran-OD tablets
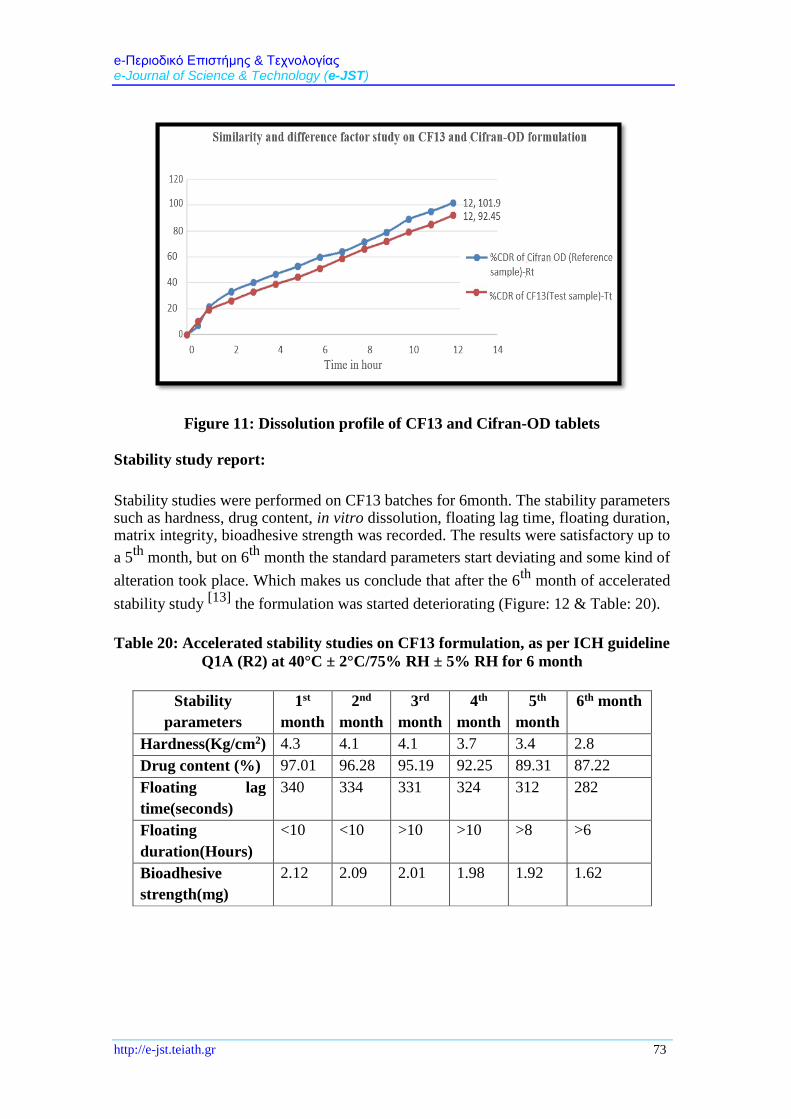
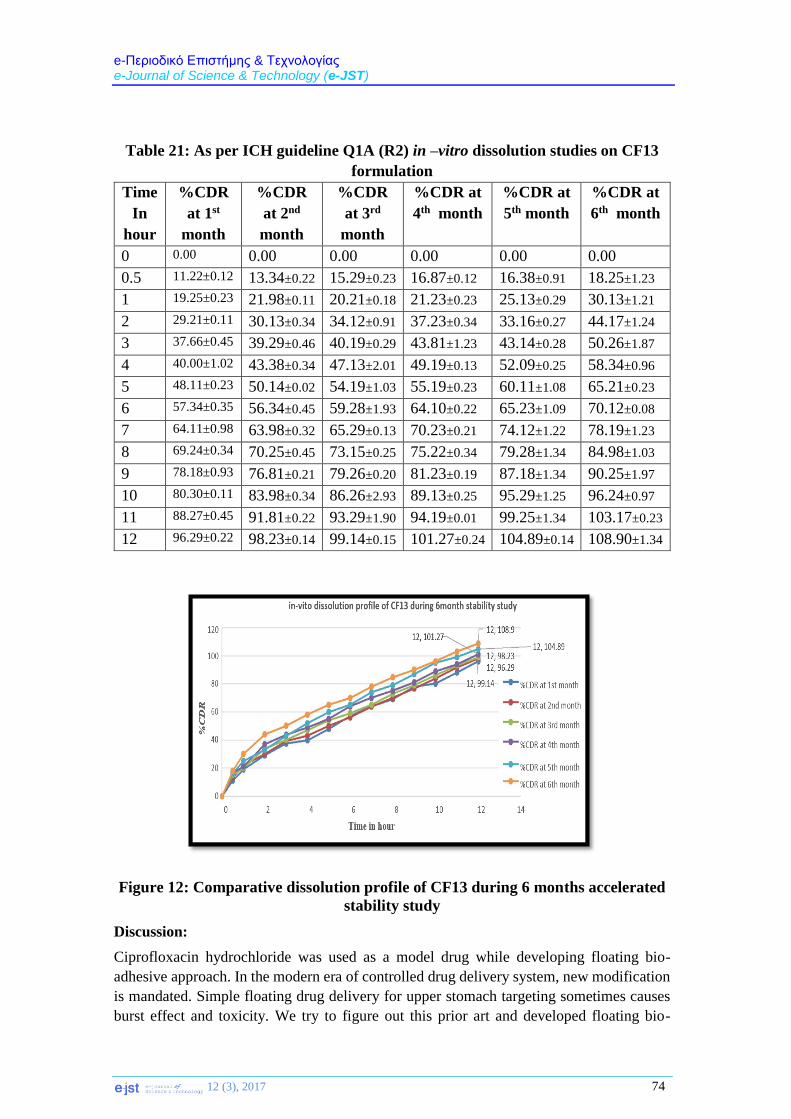
Stability study report:
Stability studies were performed on CF13 batches for 6month. The stability parameters such as hardness, drug content, in vitro dissolution, floating lag time, floating duration, matrix integrity, bioadhesive strength was recorded. The results were satisfactory up to
a 5th
month, but on 6th
month the standard parameters start deviating and some kind of
alteration took place. Which makes us conclude that after the 6th
month of accelerated
stability study [13]
the formulation was started deteriorating (Figure: 12 & Table: 20).
Table 20: Accelerated stability studies on CF13 formulation, as per ICH guideline
Q1A (R2) at 40°C ± 2°C/75% RH ± 5% RH for 6 month
Stability
parameters
1st
month
2nd
month
3rd
month
4th
month
5th
month
6th month
Hardness(Kg/cm2) 4.3 4.1 4.1 3.7 3.4 2.8
Drug content (%) 97.01 96.28 95.19 92.25 89.31 87.22
Floating lag
time(seconds)
340 334 331 324 312 282
Floating
duration(Hours)
<10 <10 >10 >10 >8 >6
Bioadhesive
strength(mg)
2.12 2.09 2.01 1.98 1.92 1.62
e-Περιοδικό Επιστήμης & Τεχνολογίας e-Journal of Science & Technology (e-JST)
12 (3), 2017 74
Table 21: As per ICH guideline Q1A (R2) in –vitro dissolution studies on CF13
formulation
Time
In
hour
%CDR
at 1st
month
%CDR
at 2nd
month
%CDR
at 3rd
month
%CDR at
4th month
%CDR at
5th month
%CDR at
6th month
0 0.00 0.00 0.00 0.00 0.00 0.00
0.5 11.22±0.12 13.34±0.22 15.29±0.23 16.87±0.12 16.38±0.91 18.25±1.23
1 19.25±0.23 21.98±0.11 20.21±0.18 21.23±0.23 25.13±0.29 30.13±1.21
2 29.21±0.11 30.13±0.34 34.12±0.91 37.23±0.34 33.16±0.27 44.17±1.24
3 37.66±0.45 39.29±0.46 40.19±0.29 43.81±1.23 43.14±0.28 50.26±1.87
4 40.00±1.02 43.38±0.34 47.13±2.01 49.19±0.13 52.09±0.25 58.34±0.96
5 48.11±0.23 50.14±0.02 54.19±1.03 55.19±0.23 60.11±1.08 65.21±0.23
6 57.34±0.35 56.34±0.45 59.28±1.93 64.10±0.22 65.23±1.09 70.12±0.08
7 64.11±0.98 63.98±0.32 65.29±0.13 70.23±0.21 74.12±1.22 78.19±1.23
8 69.24±0.34 70.25±0.45 73.15±0.25 75.22±0.34 79.28±1.34 84.98±1.03
9 78.18±0.93 76.81±0.21 79.26±0.20 81.23±0.19 87.18±1.34 90.25±1.97
10 80.30±0.11 83.98±0.34 86.26±2.93 89.13±0.25 95.29±1.25 96.24±0.97
11 88.27±0.45 91.81±0.22 93.29±1.90 94.19±0.01 99.25±1.34 103.17±0.23
12 96.29±0.22 98.23±0.14 99.14±0.15 101.27±0.24 104.89±0.14 108.90±1.34
Figure 12: Comparative dissolution profile of CF13 during 6 months accelerated
stability study
Discussion:
Ciprofloxacin hydrochloride was used as a model drug while developing floating bio-
adhesive approach. In the modern era of controlled drug delivery system, new modification
is mandated. Simple floating drug delivery for upper stomach targeting sometimes causes
burst effect and toxicity. We try to figure out this prior art and developed floating bio-
e-Περιοδικό Επιστήμης & Τεχνολογίας e-Journal of Science & Technology (e-JST)
http://e-jst.teiath.gr 75
adhesive tablet with an advanced approach to make it adhere after floating on the surface of
the upper stomach. Based on Placket and Burman Design model we optimized 3 different
polymers (independent variables) such as HPMC K15M (0-16%), carbopol 934P (06-12%),
CMC (03-09%) used. The resulting output was monitored and optimization was done by
taking dependent variables like floating lag time (245- 267seconds), bioadhesive strength
(1.81-4.56gm), cumulative percentage drug release at the 12th
hour (81.45 -98.56%). Using
design expert software (version 7.0.0) statistical regression analysis was done using a
reduced model equation. 3D surface modeling and counter graphs were plotted against
optimum concentrations of polymers and various dependent variables. ANOVA studies
revealed that the F value of all the 3 dependent variables; floating lag time (F=63. 9463),
bioadhesive strength (F= 26.897), cumulative percentage drug release at 12th
hour (F=38.
166) were much higher than the significant F value, respectively, hence it can be concluded
that null hypothesis can be rejected and alternative hypothesis or design model for all 3
dependable variables can be selected. All the 3 polymers have significance at the floating
lag time, bioadhesive strength, and cumulative drug release at the 12th
hour because all 3
intercept P value were < 0.0001.Finally by using overlay model predicted responses were
recorded. The result of checkpoint batches shown <9% standard error which indicates well-
optimized formulation. Further desirability studies were performed and it was assumed that
CF13 possess a significant amount of desirability (D=0. 920), further to prove its desirability
kinetic modeling studies were inspected. Again CF13 turns out to be the best formulation
as it has zero order kinetics with an R2 value of 0.9886. CF13 formulation was considered
as optimized one and further studies were carried. For difference (F1) and similarity (F2)
factor studies Cifran-OD tablets were taken as a reference and CF13 formulation was taken
as a standard. F1and F2 value was found to be 11.9780 and 57.083 respectively, which
indicates good dissolution profile against Cifran-OD tablet. As per ICH Q1A (R2), guideline
accelerated stability studies were done. It was found that CF13 batch starts deteriorating
after the 6th
month.
Conclusion:
Ciprofloxacin, a BCS classic III drug was used as a model while designing this
approach. Ciprofloxacin basically a quinolone antibiotic, which has versatile uses.
Ciprofloxacin has a maximum therapeutic window which is available in the upper
stomach (fundus part). But commercial oral dosage form cannot target the desired site,
hence floating bio-adhesive approach has incited. Since it is a BCS III drug, it has its
own limitation on permeability. To tackle all this kind of obstacles, constant zero order
release was targeted. By designing formulations using design expert (7.0.0) software, it
was concluded that CF13 possess a good profile of drug release and stability. Hence
present formulation can be considered for scaled up.
e-Περιοδικό Επιστήμης & Τεχνολογίας e-Journal of Science & Technology (e-JST)
12 (3), 2017 76
Reference:
1. Streubel A, Siepmann J, Bodmeier R. Gastroretentive drug delivery system. Expert
Opin Drug Deliv.3 (2), 2006: 217-33.
2. Shweta Arora, Javed Ali, Alka Ahuja, Roop K. Khar, Sanjula Baboota. Floating
drug delivery system: A review. AAPS PharmSciTech.6 (3) 2005 Sep: E372–E390.
3. Abubakr O. Nur, Jun S. Zhang. Captopril floating and/or bioadhesive tablets:
design and release Kinetics. Drug Dev. Ind. Pharm. 26, 2000: 965-969.
4. Ponchel G, Irache JM. Specific and non-specific bioadhesive particulate system for
oral delivery to the gastrointestinal tract. Adv Drug Del Rev.34, 1998:191–219.
5. Mukhopadhyay S, Goswami L, Satheesh Madhav NV, Upadhyaya K. Formulation
and evaluation of floating bio adhesive tablets of Ciprofloxacin hydrochloride by
direct compression technique. Int J Pharma Pharm Sci.2 (3), 2010:113-115.
6. Afroz A, Asaduzzaman Md, Rezowanur Rahman Md, Ashraful Islam SM.
Development and evaluation of muco-adhesive ciprofloxacin bi-layer tablet for
extended drug release. Asian J. Pharm.1(3), 2011 : 64-68.
7. Jagtap Leena S, Swami Seema P, Mali Prabha R, Tripathi Pallavi S, Deshmukh
Kishor R. Formulation and evaluation of floating matrix tablet of famotidine using
natural polymers. IRJP. 2(6), 2011: 110-115.
8. Aniruddha M. Railkar & Joseph B. Schwartz. Use of a Moist Granulation
Technique (MGT) to Develop Controlled-Release Dosage Forms of
Acetaminophen. Journal Drug Development and Industrial Pharmacy.27 (4),
2001:337-343.
9. Uddhav Bagul, Kishore Gujar, Shalaka Dhat, Sanjeevani Aphale, Miken Bhavsar.
In vitro study of mucoadhesive strength of polymers for mucoadhesive drug
delivery systems. International journal of current pharmaceutical research. 1(1),
2009: 42-46.
10. Ghada E. Yassin & Afaf A. Ramadan. Box-Behnken Experimental Design in
Development of Glimepiride Floating Matrix Tablets. Journal of American
Science.8 (8), 2012: 418-426.
11. R. R. Jivani, C. N. Patel and N. P. Jivani. Statistical design of experiments on
fabrication of bilayer tablet of narrow absorption window drug: Development and
In vitro characterisation. Indian J Pharm Sci.74 (4): 2012:302-311.
12. Ali Seyed Shirkhorshidi, Saeed Aghabozorgi, and Teh Ying Wah. A Comparison
Study on Similarity and Dissimilarity Measures in Clustering Continuous Data.
PLoS One.10 (12), 2015: e0144059.
13. Paulo Renato Oliveira, Cassiana Mendes, Lilian Klein, Maximiliano da Silva
Sangoi Larissa Sakis Bernardi, Marcos Antônio Segatto Silva. Formulation
Development and Stability Studies of Norfloxacin Extended-Release Matrix Tablets.
Biomed Res Int. 2013: 716736.