ΣΤΕΓΑΝΩΤΙΚΟ ΕΛΑΣΤΟΜΕΡΕΣ ΧΡΩΜΑ ΓΙΑ ΤΟΙΧΟΥΣ Hydrostop elastic D 80
Journal of Nuclear Materials 433 (2013) 143–151
Contents lists available at SciVerse ScienceDirect
Journal of Nuclear Materials
journal homepage: www.elsevier .com/ locate / jnucmat
First principles calculations of the structure and elastic constants of a, band c uranium
Benjamin Beeler a,⇑, Chaitanya Deo a, Michael Baskes b,c, Maria Okuniewski d
a Nuclear and Radiological Engineering Program, George W. Woodruff School of Mechanical Engineering, Georgia Institute of Technology, 770 State Street, Atlanta, GA 30332, USAb University of California, San Diego, 9500 Gilman Drive, La Jolla, CA 92093, USAc Los Alamos National Laboratory, PO Box 1663, Los Alamos, NM 87545, USAd Idaho National Laboratory, PO Box 1625, Idaho Falls, ID 83415, USA
a r t i c l e i n f o
Article history:Received 2 February 2012Accepted 12 September 2012Available online 23 September 2012
0022-3115/$ - see front matter � 2012 Elsevier B.V. Ahttp://dx.doi.org/10.1016/j.jnucmat.2012.09.019
⇑ Corresponding author.E-mail address: [email protected] (B. Beeler).
a b s t r a c t
This study analyzes structural and elastic properties of five uranium crystal structures: the face centeredorthorhombic A20 (a phase), the tetragonal D8b (b phase), body centered tetragonal (bct), body centeredcubic (c phase) and face centered cubic structures. Calculations are performed within the densityfunctional theory framework employing the Projector Augmented Wave method and the Perdew–Burke–Ernzerhof generalized gradient approximation (PBE–GGA) of the exchange correlation. The elasticconstants are used to compute polycrystalline elastic moduli, Poisson’s ratio and the Debye temperaturefor all five structures. The a and c phase properties are compared with theoretical and experimentalresults. The complex tetragonal 30 atom beta phase is examined in detail. Representation of the b phaseby a bct structure is examined; we find that the structure of the b phase is significantly different from thebct phase but exhibits similar elastic properties. This is the first comprehensive investigation into theelastic constants of uranium utilizing the PBE–GGA.
� 2012 Elsevier B.V. All rights reserved.
1. Introduction
The metal uranium exists in three solid phases: a (face-centered orthorhombic), b (tetragonal) and c (body-centered cu-bic). At elevated temperatures, uranium transforms from a to b[1] at approximately 935 K and b transforms to c at approximately1045 K [2]. The electronic structure of uranium is dominated by 5felectron states that form narrow bands that tend to bond theatoms in complex and distorted ways [3–5]. Electronic structurecalculations have had varied success in describing these complexstructures. Söderlind [4] calculated the structural and elastic prop-erties of orthorhombic a-uranium using the full-potential linearmuffin tin orbital technique. While the calculated lattice constantshad an accuracy of approximately 1% compared to the experimen-tal values (determined at 50 K) [6], the elastic constants weremuch more difficult to model and compare with experiment, par-tially because no internal relaxation was allowed during the finitedistortion technique and also because uranium undergoes signifi-cant phonon softening as a function of temperature. The qualita-tive trends between the elastic constants were, however, in goodagreement with the experimental values. The root-mean-squaredeviation of the elastic moduli, c11 through c66, was 118 GPa [7].Söderlind also calculated the equilibrium lattice constant of
ll rights reserved.
body-centered cubic (bcc) c uranium. These calculated valuesoverestimate the experimental lattice constants at 0 K.
Although the full-potential calculations are able to capture thephysics of the atomic and electronic interactions that dictate manyof the properties of the orthorhombic uranium crystal, they are notyet of sufficient computational efficiency to allow the simulation ofmore complex systems (i.e., larger supercells containing crystaldefects, such as vacancies, and/or impurity atoms). Also, the bphase of uranium has a complicated 30 atom unit cell. Usingfull-potential calculations to analyze such a large and complex unitcell can become untenable.
However, an earlier study by Crocombette et al. [8] using anorm-conserving pseudopotential, in which the core electronsare replaced by an effective electron–electron interaction potentialallowing for the investigation of more complex systems, was not soaccurate. For a uranium, the lattice constant for the b vector of theorthorhombic crystal was significantly shorter than experiment by7% and the bulk modulus overestimated experiment by 58%. Calcu-lations on the atomic electronic structure (i.e., isolated atoms andmolecules, not a solid) were also performed and the results werevery sensitive to the level of correlation included in the calculation.Crocombette et al. also under predicted the experimental latticeconstant [9] of bcc uranium by approximately 3%.
Taylor [7] investigated pure systems of uranium using aprojector augmented-wave (PAW) pseudopotential utilizingthe Perdew–Wang 91 [10] (PW91) Generalized Gradient
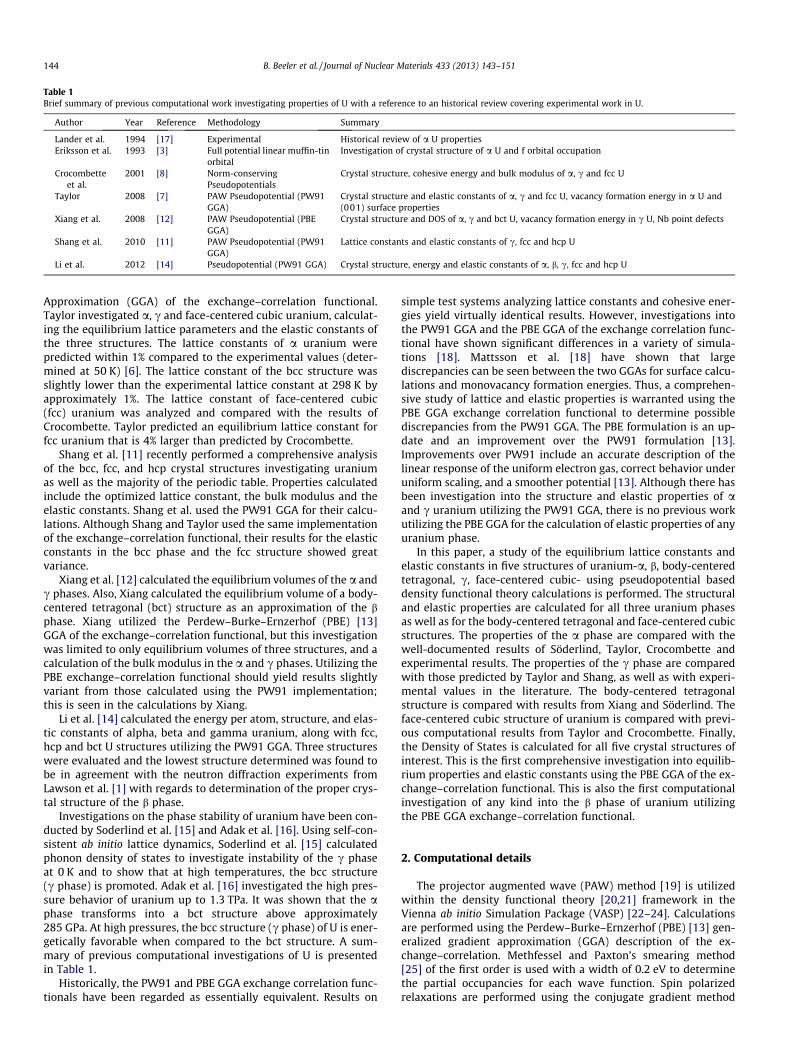
Table 1Brief summary of previous computational work investigating properties of U with a reference to an historical review covering experimental work in U.
Author Year Reference Methodology Summary
Lander et al. 1994 [17] Experimental Historical review of a U propertiesEriksson et al. 1993 [3] Full potential linear muffin-tin
orbitalInvestigation of crystal structure of a U and f orbital occupation
Crocombetteet al.
2001 [8] Norm-conservingPseudopotentials
Crystal structure, cohesive energy and bulk modulus of a, c and fcc U
Taylor 2008 [7] PAW Pseudopotential (PW91GGA)
Crystal structure and elastic constants of a, c and fcc U, vacancy formation energy in a U and(001) surface properties
Xiang et al. 2008 [12] PAW Pseudopotential (PBEGGA)
Crystal structure and DOS of a, c and bct U, vacancy formation energy in c U, Nb point defects
Shang et al. 2010 [11] PAW Pseudopotential (PW91GGA)
Lattice constants and elastic constants of c, fcc and hcp U
Li et al. 2012 [14] Pseudopotential (PW91 GGA) Crystal structure, energy and elastic constants of a, b, c, fcc and hcp U
144 B. Beeler et al. / Journal of Nuclear Materials 433 (2013) 143–151
Approximation (GGA) of the exchange–correlation functional.Taylor investigated a, c and face-centered cubic uranium, calculat-ing the equilibrium lattice parameters and the elastic constants ofthe three structures. The lattice constants of a uranium werepredicted within 1% compared to the experimental values (deter-mined at 50 K) [6]. The lattice constant of the bcc structure wasslightly lower than the experimental lattice constant at 298 K byapproximately 1%. The lattice constant of face-centered cubic(fcc) uranium was analyzed and compared with the results ofCrocombette. Taylor predicted an equilibrium lattice constant forfcc uranium that is 4% larger than predicted by Crocombette.
Shang et al. [11] recently performed a comprehensive analysisof the bcc, fcc, and hcp crystal structures investigating uraniumas well as the majority of the periodic table. Properties calculatedinclude the optimized lattice constant, the bulk modulus and theelastic constants. Shang et al. used the PW91 GGA for their calcu-lations. Although Shang and Taylor used the same implementationof the exchange–correlation functional, their results for the elasticconstants in the bcc phase and the fcc structure showed greatvariance.
Xiang et al. [12] calculated the equilibrium volumes of the a andc phases. Also, Xiang calculated the equilibrium volume of a body-centered tetragonal (bct) structure as an approximation of the bphase. Xiang utilized the Perdew–Burke–Ernzerhof (PBE) [13]GGA of the exchange–correlation functional, but this investigationwas limited to only equilibrium volumes of three structures, and acalculation of the bulk modulus in the a and c phases. Utilizing thePBE exchange–correlation functional should yield results slightlyvariant from those calculated using the PW91 implementation;this is seen in the calculations by Xiang.
Li et al. [14] calculated the energy per atom, structure, and elas-tic constants of alpha, beta and gamma uranium, along with fcc,hcp and bct U structures utilizing the PW91 GGA. Three structureswere evaluated and the lowest structure determined was found tobe in agreement with the neutron diffraction experiments fromLawson et al. [1] with regards to determination of the proper crys-tal structure of the b phase.
Investigations on the phase stability of uranium have been con-ducted by Soderlind et al. [15] and Adak et al. [16]. Using self-con-sistent ab initio lattice dynamics, Soderlind et al. [15] calculatedphonon density of states to investigate instability of the c phaseat 0 K and to show that at high temperatures, the bcc structure(c phase) is promoted. Adak et al. [16] investigated the high pres-sure behavior of uranium up to 1.3 TPa. It was shown that the aphase transforms into a bct structure above approximately285 GPa. At high pressures, the bcc structure (c phase) of U is ener-getically favorable when compared to the bct structure. A sum-mary of previous computational investigations of U is presentedin Table 1.
Historically, the PW91 and PBE GGA exchange correlation func-tionals have been regarded as essentially equivalent. Results on
simple test systems analyzing lattice constants and cohesive ener-gies yield virtually identical results. However, investigations intothe PW91 GGA and the PBE GGA of the exchange correlation func-tional have shown significant differences in a variety of simula-tions [18]. Mattsson et al. [18] have shown that largediscrepancies can be seen between the two GGAs for surface calcu-lations and monovacancy formation energies. Thus, a comprehen-sive study of lattice and elastic properties is warranted using thePBE GGA exchange correlation functional to determine possiblediscrepancies from the PW91 GGA. The PBE formulation is an up-date and an improvement over the PW91 formulation [13].Improvements over PW91 include an accurate description of thelinear response of the uniform electron gas, correct behavior underuniform scaling, and a smoother potential [13]. Although there hasbeen investigation into the structure and elastic properties of aand c uranium utilizing the PW91 GGA, there is no previous workutilizing the PBE GGA for the calculation of elastic properties of anyuranium phase.
In this paper, a study of the equilibrium lattice constants andelastic constants in five structures of uranium-a, b, body-centeredtetragonal, c, face-centered cubic- using pseudopotential baseddensity functional theory calculations is performed. The structuraland elastic properties are calculated for all three uranium phasesas well as for the body-centered tetragonal and face-centered cubicstructures. The properties of the a phase are compared with thewell-documented results of Söderlind, Taylor, Crocombette andexperimental results. The properties of the c phase are comparedwith those predicted by Taylor and Shang, as well as with experi-mental values in the literature. The body-centered tetragonalstructure is compared with results from Xiang and Söderlind. Theface-centered cubic structure of uranium is compared with previ-ous computational results from Taylor and Crocombette. Finally,the Density of States is calculated for all five crystal structures ofinterest. This is the first comprehensive investigation into equilib-rium properties and elastic constants using the PBE GGA of the ex-change–correlation functional. This is also the first computationalinvestigation of any kind into the b phase of uranium utilizingthe PBE GGA exchange–correlation functional.
2. Computational details
The projector augmented wave (PAW) method [19] is utilizedwithin the density functional theory [20,21] framework in theVienna ab initio Simulation Package (VASP) [22–24]. Calculationsare performed using the Perdew–Burke–Ernzerhof (PBE) [13] gen-eralized gradient approximation (GGA) description of the ex-change–correlation. Methfessel and Paxton’s smearing method[25] of the first order is used with a width of 0.2 eV to determinethe partial occupancies for each wave function. Spin polarizedrelaxations are performed using the conjugate gradient method
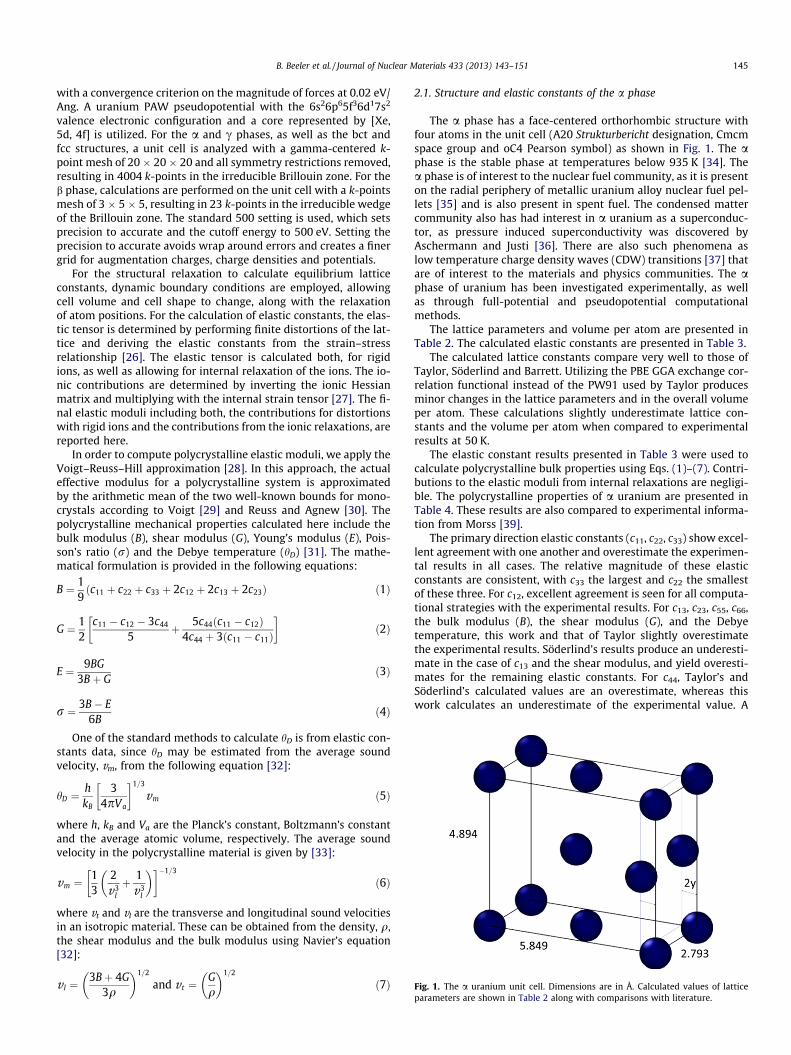
Fig. 1. The a uranium unit cell. Dimensions are in Å. Calculated values of latticeparameters are shown in Table 2 along with comparisons with literature.
B. Beeler et al. / Journal of Nuclear Materials 433 (2013) 143–151 145
with a convergence criterion on the magnitude of forces at 0.02 eV/Ang. A uranium PAW pseudopotential with the 6s26p65f36d17s2
valence electronic configuration and a core represented by [Xe,5d, 4f] is utilized. For the a and c phases, as well as the bct andfcc structures, a unit cell is analyzed with a gamma-centered k-point mesh of 20 � 20 � 20 and all symmetry restrictions removed,resulting in 4004 k-points in the irreducible Brillouin zone. For theb phase, calculations are performed on the unit cell with a k-pointsmesh of 3 � 5 � 5, resulting in 23 k-points in the irreducible wedgeof the Brillouin zone. The standard 500 setting is used, which setsprecision to accurate and the cutoff energy to 500 eV. Setting theprecision to accurate avoids wrap around errors and creates a finergrid for augmentation charges, charge densities and potentials.
For the structural relaxation to calculate equilibrium latticeconstants, dynamic boundary conditions are employed, allowingcell volume and cell shape to change, along with the relaxationof atom positions. For the calculation of elastic constants, the elas-tic tensor is determined by performing finite distortions of the lat-tice and deriving the elastic constants from the strain–stressrelationship [26]. The elastic tensor is calculated both, for rigidions, as well as allowing for internal relaxation of the ions. The io-nic contributions are determined by inverting the ionic Hessianmatrix and multiplying with the internal strain tensor [27]. The fi-nal elastic moduli including both, the contributions for distortionswith rigid ions and the contributions from the ionic relaxations, arereported here.
In order to compute polycrystalline elastic moduli, we apply theVoigt–Reuss–Hill approximation [28]. In this approach, the actualeffective modulus for a polycrystalline system is approximatedby the arithmetic mean of the two well-known bounds for mono-crystals according to Voigt [29] and Reuss and Agnew [30]. Thepolycrystalline mechanical properties calculated here include thebulk modulus (B), shear modulus (G), Young’s modulus (E), Pois-son’s ratio (r) and the Debye temperature (hD) [31]. The mathe-matical formulation is provided in the following equations:
B ¼ 19ðc11 þ c22 þ c33 þ 2c12 þ 2c13 þ 2c23Þ ð1Þ
G ¼ 12
c11 � c12 � 3c44
5þ 5c44ðc11 � c12Þ
4c44 þ 3ðc11 � c11Þ
� �ð2Þ
E ¼ 9BG3Bþ G
ð3Þ
r ¼ 3B� E6B
ð4Þ
One of the standard methods to calculate hD is from elastic con-stants data, since hD may be estimated from the average soundvelocity, vm, from the following equation [32]:
hD ¼hkB
34pVa
� �1=3
vm ð5Þ
where h, kB and Va are the Planck’s constant, Boltzmann’s constantand the average atomic volume, respectively. The average soundvelocity in the polycrystalline material is given by [33]:
vm ¼13
2v3
l
þ 1v3
l
� �� ��1=3
ð6Þ
where vt and vl are the transverse and longitudinal sound velocitiesin an isotropic material. These can be obtained from the density, q,the shear modulus and the bulk modulus using Navier’s equation[32]:
v l ¼3Bþ 4G
3q
� �1=2
and v t ¼Gq
� �1=2
ð7Þ
2.1. Structure and elastic constants of the a phase
The a phase has a face-centered orthorhombic structure withfour atoms in the unit cell (A20 Strukturbericht designation, Cmcmspace group and oC4 Pearson symbol) as shown in Fig. 1. The aphase is the stable phase at temperatures below 935 K [34]. Thea phase is of interest to the nuclear fuel community, as it is presenton the radial periphery of metallic uranium alloy nuclear fuel pel-lets [35] and is also present in spent fuel. The condensed mattercommunity also has had interest in a uranium as a superconduc-tor, as pressure induced superconductivity was discovered byAschermann and Justi [36]. There are also such phenomena aslow temperature charge density waves (CDW) transitions [37] thatare of interest to the materials and physics communities. The aphase of uranium has been investigated experimentally, as wellas through full-potential and pseudopotential computationalmethods.
The lattice parameters and volume per atom are presented inTable 2. The calculated elastic constants are presented in Table 3.
The calculated lattice constants compare very well to those ofTaylor, Söderlind and Barrett. Utilizing the PBE GGA exchange cor-relation functional instead of the PW91 used by Taylor producesminor changes in the lattice parameters and in the overall volumeper atom. These calculations slightly underestimate lattice con-stants and the volume per atom when compared to experimentalresults at 50 K.
The elastic constant results presented in Table 3 were used tocalculate polycrystalline bulk properties using Eqs. (1)–(7). Contri-butions to the elastic moduli from internal relaxations are negligi-ble. The polycrystalline properties of a uranium are presented inTable 4. These results are also compared to experimental informa-tion from Morss [39].
The primary direction elastic constants (c11, c22, c33) show excel-lent agreement with one another and overestimate the experimen-tal results in all cases. The relative magnitude of these elasticconstants are consistent, with c33 the largest and c22 the smallestof these three. For c12, excellent agreement is seen for all computa-tional strategies with the experimental results. For c13, c23, c55, c66,the bulk modulus (B), the shear modulus (G), and the Debyetemperature, this work and that of Taylor slightly overestimatethe experimental results. Söderlind’s results produce an underesti-mate in the case of c13 and the shear modulus, and yield overesti-mates for the remaining elastic constants. For c44, Taylor’s andSöderlind’s calculated values are an overestimate, whereas thiswork calculates an underestimate of the experimental value. A
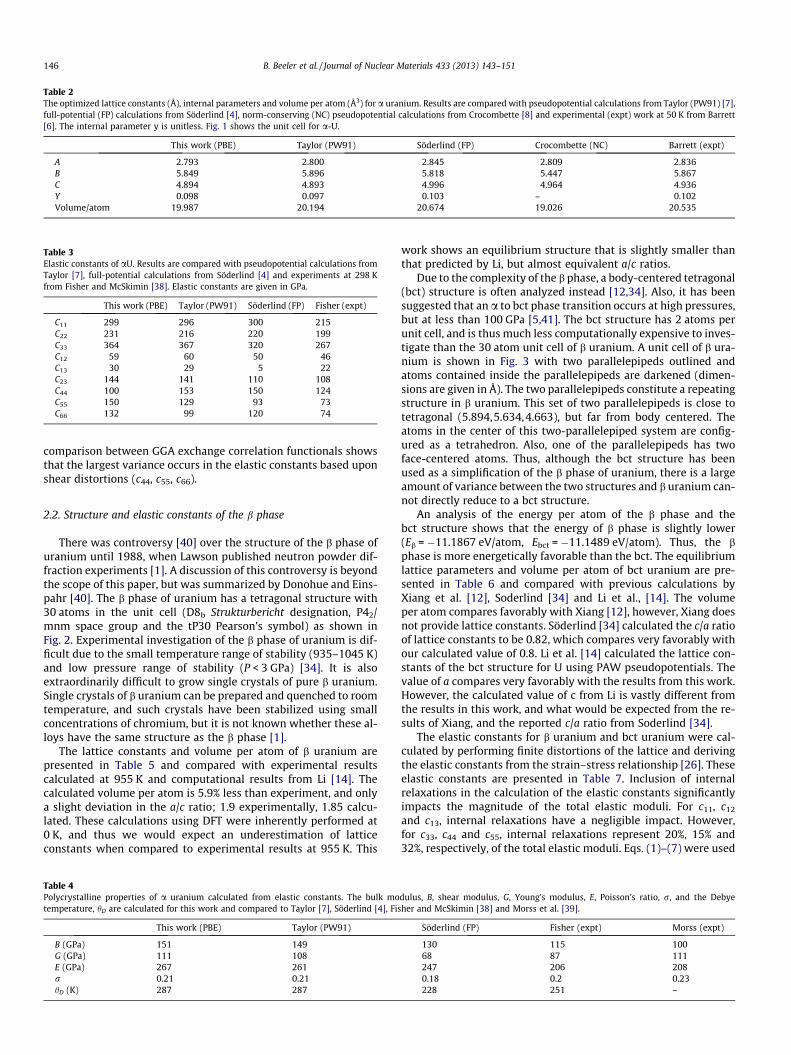
Table 2The optimized lattice constants (Å), internal parameters and volume per atom (Å3) for a uranium. Results are compared with pseudopotential calculations from Taylor (PW91) [7],full-potential (FP) calculations from Söderlind [4], norm-conserving (NC) pseudopotential calculations from Crocombette [8] and experimental (expt) work at 50 K from Barrett[6]. The internal parameter y is unitless. Fig. 1 shows the unit cell for a-U.
This work (PBE) Taylor (PW91) Söderlind (FP) Crocombette (NC) Barrett (expt)
A 2.793 2.800 2.845 2.809 2.836B 5.849 5.896 5.818 5.447 5.867C 4.894 4.893 4.996 4.964 4.936Y 0.098 0.097 0.103 – 0.102Volume/atom 19.987 20.194 20.674 19.026 20.535
Table 3Elastic constants of aU. Results are compared with pseudopotential calculations fromTaylor [7], full-potential calculations from Söderlind [4] and experiments at 298 Kfrom Fisher and McSkimin [38]. Elastic constants are given in GPa.
This work (PBE) Taylor (PW91) Söderlind (FP) Fisher (expt)
C11 299 296 300 215C22 231 216 220 199C33 364 367 320 267C12 59 60 50 46C13 30 29 5 22C23 144 141 110 108C44 100 153 150 124C55 150 129 93 73C66 132 99 120 74
146 B. Beeler et al. / Journal of Nuclear Materials 433 (2013) 143–151
comparison between GGA exchange correlation functionals showsthat the largest variance occurs in the elastic constants based uponshear distortions (c44, c55, c66).
2.2. Structure and elastic constants of the b phase
There was controversy [40] over the structure of the b phase ofuranium until 1988, when Lawson published neutron powder dif-fraction experiments [1]. A discussion of this controversy is beyondthe scope of this paper, but was summarized by Donohue and Eins-pahr [40]. The b phase of uranium has a tetragonal structure with30 atoms in the unit cell (D8b Strukturbericht designation, P42/mnm space group and the tP30 Pearson’s symbol) as shown inFig. 2. Experimental investigation of the b phase of uranium is dif-ficult due to the small temperature range of stability (935–1045 K)and low pressure range of stability (P < 3 GPa) [34]. It is alsoextraordinarily difficult to grow single crystals of pure b uranium.Single crystals of b uranium can be prepared and quenched to roomtemperature, and such crystals have been stabilized using smallconcentrations of chromium, but it is not known whether these al-loys have the same structure as the b phase [1].
The lattice constants and volume per atom of b uranium arepresented in Table 5 and compared with experimental resultscalculated at 955 K and computational results from Li [14]. Thecalculated volume per atom is 5.9% less than experiment, and onlya slight deviation in the a/c ratio; 1.9 experimentally, 1.85 calcu-lated. These calculations using DFT were inherently performed at0 K, and thus we would expect an underestimation of latticeconstants when compared to experimental results at 955 K. This
Table 4Polycrystalline properties of a uranium calculated from elastic constants. The bulk motemperature, hD are calculated for this work and compared to Taylor [7], Söderlind [4], Fis
This work (PBE) Taylor (PW91)
B (GPa) 151 149G (GPa) 111 108E (GPa) 267 261r 0.21 0.21hD (K) 287 287
work shows an equilibrium structure that is slightly smaller thanthat predicted by Li, but almost equivalent a/c ratios.
Due to the complexity of the b phase, a body-centered tetragonal(bct) structure is often analyzed instead [12,34]. Also, it has beensuggested that an a to bct phase transition occurs at high pressures,but at less than 100 GPa [5,41]. The bct structure has 2 atoms perunit cell, and is thus much less computationally expensive to inves-tigate than the 30 atom unit cell of b uranium. A unit cell of b ura-nium is shown in Fig. 3 with two parallelepipeds outlined andatoms contained inside the parallelepipeds are darkened (dimen-sions are given in Å). The two parallelepipeds constitute a repeatingstructure in b uranium. This set of two parallelepipeds is close totetragonal (5.894,5.634,4.663), but far from body centered. Theatoms in the center of this two-parallelepiped system are config-ured as a tetrahedron. Also, one of the parallelepipeds has twoface-centered atoms. Thus, although the bct structure has beenused as a simplification of the b phase of uranium, there is a largeamount of variance between the two structures and b uranium can-not directly reduce to a bct structure.
An analysis of the energy per atom of the b phase and thebct structure shows that the energy of b phase is slightly lower(Eb = �11.1867 eV/atom, Ebct = �11.1489 eV/atom). Thus, the bphase is more energetically favorable than the bct. The equilibriumlattice parameters and volume per atom of bct uranium are pre-sented in Table 6 and compared with previous calculations byXiang et al. [12], Soderlind [34] and Li et al., [14]. The volumeper atom compares favorably with Xiang [12], however, Xiang doesnot provide lattice constants. Söderlind [34] calculated the c/a ratioof lattice constants to be 0.82, which compares very favorably withour calculated value of 0.8. Li et al. [14] calculated the lattice con-stants of the bct structure for U using PAW pseudopotentials. Thevalue of a compares very favorably with the results from this work.However, the calculated value of c from Li is vastly different fromthe results in this work, and what would be expected from the re-sults of Xiang, and the reported c/a ratio from Soderlind [34].
The elastic constants for b uranium and bct uranium were cal-culated by performing finite distortions of the lattice and derivingthe elastic constants from the strain–stress relationship [26]. Theseelastic constants are presented in Table 7. Inclusion of internalrelaxations in the calculation of the elastic constants significantlyimpacts the magnitude of the total elastic moduli. For c11, c12
and c13, internal relaxations have a negligible impact. However,for c33, c44 and c55, internal relaxations represent 20%, 15% and32%, respectively, of the total elastic moduli. Eqs. (1)–(7) were used
dulus, B, shear modulus, G, Young’s modulus, E, Poisson’s ratio, r, and the Debyeher and McSkimin [38] and Morss et al. [39].
Söderlind (FP) Fisher (expt) Morss (expt)
130 115 10068 87 111247 206 2080.18 0.2 0.23228 251 –

Fig. 2. The b uranium unit cell.
Table 5The optimized lattice constants (Å) and volume per atom (Å3) for b uranium. Resultsare compared with computational work from Li et al. [14] and experimental workfrom Lawson et al. [1].
This work Li Expt. (955 K)
a 10.454 10.520 10.759c 5.634 5.707 5.653Volume/atom 20.524 21.053 21.812
Table 6Optimized lattice constants (Å) and volume per atom (Å3) of body-centered tetragonaluranium. The calculated volume per atom is compared to the result of Xiang et al.[12], Soderlind [34] and Li et al. [14].
This work Xiang Soderlind Li
a 3.695 – – 3.72c/a 0.8 – 0.82 1.24Volume/atom 20.268 20.5 – 31.896
B. Beeler et al. / Journal of Nuclear Materials 433 (2013) 143–151 147
to calculated bulk polycrystalline properties. In comparison withwork by Li et al. [14], the elastic constants of b U utilizing the
Fig. 3. The b phase of uranium, with an attempted approximation to a body-centered tetragonal crystal structure. The two parallelepipeds outlined in the unitcell constitute a repeating structure in b uranium, but are not bct. The dimensions ofthe parallelepiped are given in Å.
PBE GGA compare very favorably to results using the PW91 GGA.However, there is a large discrepancy for the C55 elastic constant.For the bct U structure, the C11 and C33 elastic constants are signif-icantly larger than those calculated by Li. Also, substantial varianceis shown for the C44 and C55 elastic constants. Thus, for the b phaseor U and the bct structure of U, the PBE and PW91 GGA exchange–correlation functionals show a general agreement, but significant
Table 7Elastic properties of the b phase of uranium and the body-centered tetragonalstructure of uranium. The Debye temperature is given in units of degrees K, thePoisson’s ratio is unitless and the elastic constants and polycrystalline elastic moduliare given in GPa. Results from this worked are compared with the of Li.
b-U b (Li) bct U bct (Li)
C11 220 218 264 230C33 201 214 254 204C12 107 99 55 61C13 79 80 68 61C44 65 60 56 79C55 36 61 56 39B 130 130 129 114G 85 – 102 –E 210 – 242 –r 0.23 – 0.19 –hD 253 – 275 –

Table 8The optimized lattice constant (Å) and volume per atom (Å3) of c uranium. Results are compared with PAW pseudopotential calculations of Taylor [7], norm-conservingpseudopotential calculations of Crocombette et al. [8], full-potential calculations of Söderlind [4] and an experiment from Wilson at 298 K [9].
This work (PBE) Taylor (PW91) Söderlind (FP) Crocombette (NC) Wilson (expt)
a 3.427 3.43 3.46 3.37 3.47Volume/atom 20.124 20.18 20.71 19.14 20.89
Table 10Polycrystalline properties of c uranium calculated from elastic constants in Table 9.The bulk modulus (B), shear modulus (G), Young’s modulus (E), Poisson’s ratio (r) andthe Debye temperature (hD) are calculated for this work and compared to Taylor [7],Shang et al. [11] and with an experimental bulk modulus from Yoo et al. [43].
This work (PBE) Taylor (PW91) Shang (PW91) Yoo (expt)
B (GPa) 132 176 133 113G (GPa) 113 – 102 –E (GPa) 265 – 243 –r 0.17 – 0.20 –hD (K) 289 – 274 –
148 B. Beeler et al. / Journal of Nuclear Materials 433 (2013) 143–151
discrepancies occur in the calculation of elastic constants. In com-paring with a uranium, the polycrystalline properties are generallyslightly less in b uranium, than in a uranium. For B, G, E, and hD,there is a decrease from a to b from as little as 12% (hD) up to23% (G). The Poisson’s ratio is approximately equal, but slightly lar-ger in b uranium than in a uranium. For bct uranium, the calcu-lated bulk modulus and Debye temperature are also very similarto that of a and c uranium. In comparing elastic constants of bcturanium to b uranium, there is relatively good agreement. Thec11 and c33 elastic constants are slightly overestimated, whereasthe c12 and c13 elastic constants are slightly underestimated. Theresult for the bulk modulus is nearly identical. These calculationsshow that c12 is less than c11, leading to a positive shear constant;c0 = (c11 � c12)/2 and (c11 + c33)/2 > c13, implying stability of boththe b phase and the bct structure at 0 K. Thus, even though bct ura-nium is not a good crystallographic approximation of the b phaseof uranium, it can serve as a reasonable approximation for someelastic properties.
Table 11Optimized lattice constant (Å) and volume per atom (Å3) of face-centered cubicuranium. Results are compared with previous PAW pseudopotential work from Taylor[7] and norm-conserving pseudopotential work from Crocombette et al. [8].
This work (PBE) Taylor (PW91) Crocombette (NC)
a 4.433 4.48 4.30Volume/atom 21.774 22.48 19.88
Table 12Elastic constants of face-centered cubic U. Results are compared with PAWpseudopotential calculations of Taylor [7] and Shang et al. [11]. Units are GPa.
This work (PBE) Taylor (PW91) Shang (PW91)
C11 46 184 14C12 144 267 166C44 40 28 20
Table 13
2.3. Structure and elastic constants of the c phase
The c phase has a body-centered cubic structure with twoatoms in the unit cell (A2 Strukturbericht designation). The c phaseis the stable phase at temperatures from 1045 K to the meltingpoint of 1406 K [34]. The c phase of uranium is of primary interestto the nuclear fuels community. Uranium is often alloyed with Zror Nb to stabilize the c phase to lower temperatures. This enablesthe operation of nuclear fuel in a cubic phase, yielding isotropicpolycrystalline properties. Experimental investigation of the cphase of uranium is quite difficult due to the low temperaturemechanical instability of the crystal structure. This behavior is sim-ilar to other metals with a high temperature bcc phase and aground state face-centered/hexagonal type structure, such as Ti,Zr, and Hf [42]. Quenching the c phase of uranium to low temper-atures often results in the c phase decomposing into the a phase.Thus, experiments need to be performed at high temperatures,and this requirement has limited the experimental investigationinto the c phase. The lattice parameters and volume per atomare presented in Table 8 and the elastic constants are presentedin Table 9. Contributions to the elastic moduli from internal relax-ations are negligible.
Using Eqs. (1)–(7), the polycrystalline properties of c uraniumare calculated and are presented in Table 10. These results are alsocompared to an experimental result from Yoo et al. [43]. Using Tay-lor’s [7] elastic constants, the value for the shear modulus (G) isnegative, leading to unrealistic values for the polycrystalline prop-erties. Thus, the values for the remaining polycrystalline propertiesare not shown.
Table 9Elastic constants of c uranium. The elastic constants have been calculated and arecompared with pseudopotential calculations from Taylor [7] and Shang et al., [11].Units are GPa.
This work (PBE) Taylor (PW91) Shang (PW91)
C11 86 161 84C12 155 184 159C44 37 56 38
The elastic constants are compared with pseudopotential calcu-lations from Taylor and Shang who utilized the PW91 GGA ex-change–correlation functional. This work compares veryfavorably to that of Shang but varies quite strongly from Taylor.However, all three calculations show that c12 is larger than c11,leading to a negative shear constant; c0 = (c11 � c12)/2. A negativevalue for the shear constant predicts mechanical instability at thesimulation temperature of 0 K. This is in agreement with previouscalculations [34]. The Debye temperature in c uranium is approx-imately the same as the calculated Debye temperature in a ura-nium. The only experimental value for comparison is the bulkmodulus, determined by Yoo through the fitting of a temperatureindependent equation of state [43]. This work slightly overesti-mates the value of the bulk modulus calculated experimentallyby Yoo et al. [43].
Polycrystalline properties of face-centered cubic uranium. The bulk modulus (B),shear modulus (G), Young’s modulus €, Poisson’s ratio (r) and the Debye temperature(hD) are calculated for this work and compared to Taylor [7] and Shang et al. [11].
This work (PBE) Taylor (PW91) Shang (PW91)
B (GPa) 111 239 114G (GPa) 76 43 11E (GPa) 185 120 32r 0.22 0.42 0.45hD (K) 241 187 95
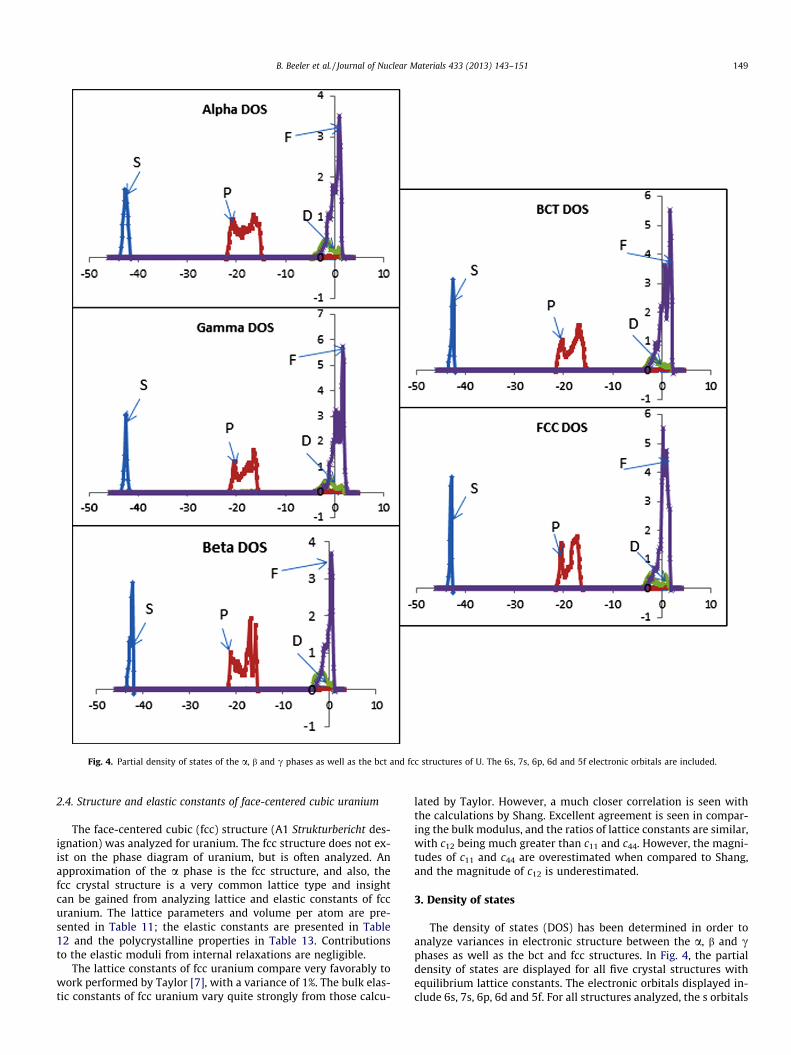
Fig. 4. Partial density of states of the a, b and c phases as well as the bct and fcc structures of U. The 6s, 7s, 6p, 6d and 5f electronic orbitals are included.
B. Beeler et al. / Journal of Nuclear Materials 433 (2013) 143–151 149
2.4. Structure and elastic constants of face-centered cubic uranium
The face-centered cubic (fcc) structure (A1 Strukturbericht des-ignation) was analyzed for uranium. The fcc structure does not ex-ist on the phase diagram of uranium, but is often analyzed. Anapproximation of the a phase is the fcc structure, and also, thefcc crystal structure is a very common lattice type and insightcan be gained from analyzing lattice and elastic constants of fccuranium. The lattice parameters and volume per atom are pre-sented in Table 11; the elastic constants are presented in Table12 and the polycrystalline properties in Table 13. Contributionsto the elastic moduli from internal relaxations are negligible.
The lattice constants of fcc uranium compare very favorably towork performed by Taylor [7], with a variance of 1%. The bulk elas-tic constants of fcc uranium vary quite strongly from those calcu-
lated by Taylor. However, a much closer correlation is seen withthe calculations by Shang. Excellent agreement is seen in compar-ing the bulk modulus, and the ratios of lattice constants are similar,with c12 being much greater than c11 and c44. However, the magni-tudes of c11 and c44 are overestimated when compared to Shang,and the magnitude of c12 is underestimated.
3. Density of states
The density of states (DOS) has been determined in order toanalyze variances in electronic structure between the a, b and cphases as well as the bct and fcc structures. In Fig. 4, the partialdensity of states are displayed for all five crystal structures withequilibrium lattice constants. The electronic orbitals displayed in-clude 6s, 7s, 6p, 6d and 5f. For all structures analyzed, the s orbitals
Fig. 5. Partial density of states of the a, b and c phases as well as the bct and fcc structures of U near the Fermi level. The 6d and 5f electronic orbitals are included.
150 B. Beeler et al. / Journal of Nuclear Materials 433 (2013) 143–151
and p orbitals are relatively deep in the core. Near the Fermi level,the f orbital dominates electronic interactions. Although generaltrends are observed over all structures, minor changes are seenin the core p states. Thus, under high pressure conditions wherep orbital electrons can potentially be involved in electronic interac-tions, vastly different bonding behavior is to be expected betweenthe five different structures.
Under equilibrium conditions, typically only electrons at or nearthe Fermi level will participate in bonding. The partial density ofstates near the Fermi level for all five structures is displayed inFig. 5. It can be seen that f occupation displays significant varianceas a function of crystal structure. Similar behavior is shown for forbital occupation for the a, b and c phases as well as the bct struc-ture, in that there is gradual increase in f occupation as a functionof energy around the Fermi level. The fcc partial density of states
shows a dramatic increase in f occupation directly at the Fermi en-ergy. It is interesting to note that the transition from the a phase tothe b phase results in a decrease in the f electrons above the Fermilevel. However, transitioning from the b phase to the c phaseshows marked increase in the density of f electrons above the Fer-mi level. For the similar crystal structures of bcc (c phase) and bctU, minimal changes in the partial density of states are shown. Forall crystal structures displayed in Fig. 7, 6d electrons exhibit verylow densities above the Fermi level, and thus would not be ex-pected to play a major role in bonding.
4. Discussion and conclusions
The metallic alloys of uranium are of interest from the perspec-tive of use in a nuclear reactor, especially a fast reactor. Here the c

B. Beeler et al. / Journal of Nuclear Materials 433 (2013) 143–151 151
phase is preferred for its cubic polycrystalline properties. Yet, inthe reactor, fission, radiation damage and thermal gradients mayprecipitate the formation of the b and a phases as well [35,44].Our calculations show that at 0 K the volume per atom from thea phase to the b phase varies by 2.7% and from the b phase tothe c phase by 1.9%. Also, elastic constants of the a and b phasesare anisotropic compared to the isotropic c phase. Thus, suchphase changes would be accompanied by significant lattice strainsacross phase interfaces. Further investigation needs to be accom-panied by experimental observation of phase boundaries andinterfaces.
This study analyzed structural and elastic properties of five ura-nium crystal structures: the face centered orthorhombic A20 struc-ture (a phase), the tetragonal D8b structure (b phase), bodycentered tetragonal, body centered cubic (c phase) and face cen-tered cubic structures. Calculations were performed within thedensity functional theory framework employing Projector Aug-mented Wave method and the PBE–GGA exchange correlation. Thiswas the first comprehensive study of elastic properties of uraniumutilizing the PBE–GGA exchange correlation functional. It wasfound that using the updated PBE–GGA, significant differenceswere seen in the shear elastic constants for a uranium when com-pared to results using the PW91-GGA. For c uranium, nearly iden-tical results were produced from this work utilizing the PBE andfrom Shang utilizing the PW91. For fcc uranium, the ratios of theelastic constants were similar for both GGA implementations, butthe magnitudes of the individual elastic constants varied greatly.Thus, implementation of the PBE–GGA formulation is critical inthe analysis of elastic properties of uranium, particularly in com-plex structures such as a uranium. The elastic constants were usedto compute polycrystalline elastic moduli, Poisson’s ratio and De-bye temperature for all five structures. Inclusion of internal relax-ation into the calculation of elastic constants was negligible for thea and c phases, as well as for the bct and fcc structures. However,internal relaxation contributions were significant in the calculationof elastic constants in the b phase of uranium.
For a uranium, the calculations of the primary direction elasticconstants (c11,c22,c33) showed excellent agreement with previouscomputational studies and overestimated the experimental resultsin all cases. The relative magnitude of these elastic constants wereconsistent, with c33 the largest and c22 the smallest of these three.A comparison between GGA exchange correlation functionalsshowed that the largest variance occurred in the elastic constantsbased upon shear distortions (c44,c55,c66), with the largest varianceof 53% for c44. This was the first theoretical study of the complextetragonal 30 atom structure of the b phase. In comparing with auranium, the polycrystalline properties were generally slightly lessin b uranium, than in a uranium. In comparing elastic constants ofbct uranium to b uranium, there was relatively good agreement.The c11 and c33 elastic constants were slightly overestimated,whereas the c12 and c13 elastic constants were slightly underesti-mated. The bct structure is crystallographically significantly differ-ent from the b phase, but exhibits similar elastic properties. For curanium, the elastic constants were compared with pseudopoten-tial calculations from Taylor and Shang who utilized the PW91GGA exchange–correlation functional. This work compared veryfavorably to that of Shang but varied quite strongly from Taylor.However, Taylor, Shang and this work all predict mechanical insta-bility at the simulation temperature of 0 K. The Debye temperaturein c uranium was approximately the same as the calculated Debyetemperature in a uranium. The only experimental value for com-parison is the bulk modulus, determined by Yoo through the fittingof a temperature independent equation of state [43]. This workslightly overestimated the value of the bulk modulus calculatedexperimentally. For fcc uranium, the bulk elastic constants varied
quite strongly from those calculated by Taylor. However, a muchcloser correlation was seen with the calculations by Shang. Excel-lent agreement was seen in comparing the bulk modulus, andthe ratios of lattice constants are similar, with c12 being muchgreater than c11 and c44. However, the magnitudes of c11 and c44
were overestimated when compared to Shang, and the magnitudeof c12 is underestimated. Finally, the density of states was analyzedfor the a, b and c phases of U, as well as the bct and fcc crystalstructures. The f orbital electrons are the primary contributors tobonding. The electronic structure around the Fermi energy variesfor each crystal structure analyzed. The c phase is the equilibriumphase with the highest density of f electrons above the Fermi en-ergy. The b phase has the smallest density of f electrons abovethe Fermi energy.
Acknowledgements
We acknowledge support from INL subcontract DE-AC07-05ID14517, NRC Faculty Development Grant NRC-38-08-938 andacknowledge computing resources provided by Idaho NationalLaboratory.
References
[1] A. Lawson, C. Olsen, J. Richardson, M. Mueller, G. Lander, Acta Cryst. 44B (1988)89.
[2] J. Akella, S. Weir, J.M. Wills, P. Soderlind, J. Phys.-Condens. Matter 9 (1997)L549–L555.
[3] O. Eriksson, P. Soderlind, J. Willis, A. Boring, Phys. B 190 (1993) 5.[4] P. Soderlind, Phys. Rev. B 66 (2002) 085113.[5] P. Soderlind, O. Eriksson, J. Willis, A. Boring, Nature 374 (1995) 524.[6] C. Barrett, M. Mueller, R. Hitterman, Phys. Rev. B 129 (1963) 625.[7] C. Taylor, Phys. Rev. B 77 (2008) 094119.[8] J. Crocombette, F. Jollet, L. Nga, T. Petit, Phys. Rev. B 64 (2001) 104107.[9] A. Wilson, R. Rundle, Acta Cryst. 2 (1949) 126.
[10] J. Perdew, Y. Wang, Phys. Rev. B 45 (1992) 13244.[11] S. Shang, A. Saengdeejing, Z. Mei, D. Kim, H. Zhang, S. Ganeshan, Y. Wang, Z.
Liu, Comp. Mater. Sci. 48 (2010) 813.[12] S. Xiang, H. Huang, L. Hsiung, J. Nucl. Mater. 375 (2008) 113.[13] J. Perdew, K. Burke, M. Ernzerhof, Phys. Rev. Lett. 77 (1996) 3865.[14] J.H. Li, Q.B. Ren, C.H. Lu, L. Lu, Y. Dai, B.X. Liu, J. Alloys Comp. 516 (2012) 139.[15] P. Soderlind, B. Grabowski, L. Yang, A. Landa, Phys. Rev. B 85 (2012) 060301.[16] S. Adak, H. Nakotte, P. de Chatel, B. Kiefer, Phys. B 406 (2011) 3342.[17] G.H. Lander, E.S. Fisher, S.D. Bader, Adv. Phys. 43 (1994) 1–111.[18] A. Mattsson, R. Armiento, P. Schultz, T. Mattsson, Phys. Rev. B 73 (2006)
195123.[19] P. Blochl, O. Jepsen, O. Anderson, Phys. Rev. B 49 (1994) 16223.[20] P. Hohenberg, W. Kohn, Phys. Rev. 136 (1964) B864.[21] W. Kohn, L. Sham, Phys. Rev. 140 (1965) A1133.[22] G. Kresse, J. Furthmuller, Phys. Rev. B 54 (1996) 11169.[23] G. Kresse, D. Joubert, Phys. Rev. B 59 (1999) 1758.[24] P. Blochl, Phys. Rev. B 50 (1994) 17953.[25] M. Methfessel, A. Paxton, Phys. Rev. B 40 (1989) 3616.[26] Y. Le Page, P. Saxe, Phys. Rev. B 65 (2002) 104104.[27] X. Wu, D. Vanderbilt, D. Hamann, Phys. Rev. B 72 (2005) 035105.[28] R. Hill, Proc. Phys. Soc. 65 (1952) 349.[29] W. Voigt, Lehrbuch der Kristallphysik, Teubner, Leipzig, 1928.[30] A. Reuss, A. Agnew, Math. Mech. 9 (1929) 49.[31] M. Ghebouli, B. Ghebouli, M. Fatmi, Phys. B 406 (2011) 1837.[32] O. Anderson, J. Phys. Chem. Solids 24 (1963) 909.[33] E. Schreiber, O. Anderson, N. Soga, Elastic Constants and Their Measurements,
McGraw-Hill, New York, 1973.[34] P. Soderlind, Adv. Phys. 47 (1998) 959–998.[35] G. Hofman, S. Hayes, M. Petri, J. Nucl. Mater. 227 (1996) 277.[36] G. Aschermann, E. Justi, Phys. Z 43 (1942) 207.[37] L. Fast, O. Eriksson, B. Johansson, J. Wills, G. Straub, H. Roeder, L. Nordstrom,
Phys. Rev. Lett. 81 (1998) 2978.[38] E. Fisher, H. McSkimin, J. Appl. Phys. 29 (1958) 1473.[39] L. Morss, N. Edelstein, J. Fuger, The Chemistry of the Actinide and Transactinide
Elements, third ed., Springer, Netherlands, 2006.[40] J. Donohue, H. Einspahr, Acta Crystallographica Section B-Structural
Crystallography and Crystal Chemistry B 27 (1971) 1740.[41] O. Eriksson, J. Willis, P. Soderlind, J. Melsen, R. Ahuja, A. Boring, B. Johansson, J.
Alloys Comp. 213 (214) (1994) 268.[42] J. Sanchez, D. de Fontaine, Phys. Rev. Lett. 35 (1975) 227.[43] C.S. Yoo, H. Cynn, P. Soderlind, Phys. Rev. B 57 (1998) 10359–10362.[44] G. Hofman, L. Walter, T. Bauer, Energy 31 (1997) 83.