Figure Legends to Supplemental Figures A B C-E C D E F A B
31
1 Figure Legends to Supplemental Figures Supplemental Figure 1. Purity of rat neonatal cardiac fibroblast cell culture. (A, B) Immunofluorescence staining of primary rat neonatal cardiac fibroblasts. Cardiac fibroblasts were fixed with 4% PFA and stained with (A, B) prolyl 4-Hydroxylase (rFB marker) and either, (A) α-smooth muscle actin (smooth muscle marker) or, (B) Troponin-I (cardiomyocyte marker) and DAPI (nucleus). (n=3 experiments). (C-E) Protein expression of (C) fibroblast marker S100A4 and (D) DDR2 in neonatal rat cardiac fibroblast lysates and (E) protein expression of cardiomyocyte marker Troponin-I in neonatal rat cardiac fibroblast lysates and cardiomyocyte lysate. (F) mRNA expression of α-MHC and FSP-1 in neonatal rat cardiac fibroblasts. Data are shown as mean ± SEM. ***P<0.005. (n=3). Scale bar is 50 μm. Supplemental Figure 2. (A) nSmase 2 regulates in part the secretion of miRNAs in cardiac fibroblasts. Cardiac fibroblasts were treated with an inhibitor of nSmase 2 for 48 h and miRNA expression of fibroblast-derived exosomes was measured. miRNA expression is shown as fold change (FC) of control. Control cells were treated with DMSO. miRNA expression was normalized to U1. (B) Angiotensin II treatment stimulated the secretion of specific miRNAs. Cardiac fibroblasts were stimulated with angiotensin II (1nM) and IL-1β (4 ng/ml) for 24 h and miRNA expression of fibroblast-derived exosomes was measured. miRNA expression is shown as fold change of control. Control cells were treated with PBS and water/0.1% BSA. miRNA expression was normalized to U1. Data are shown as mean ± SEM. * P<0.05; **P<0.01, (n=3). Supplemental Figure 3. Depletion of exosomes in cardiac fibroblast conditioned media abolishes cardiomyocyte hypertrophy. Cardiomyocytes were incubated with DMEM + 1% FBS (indicated as control, cardiac fibroblast media), cardiac fibroblast conditioned media containing exosomes (indicated as +exo) or cardiac fibroblast conditioned media depleted of exosomes (indicated as -exo) (ratio 1:3; cardiomyocyte media: cardiac fibroblast conditioned media) for 72 h. Cells were fixed and stained with α-actinin for cell size measurements. Data are shown as mean ± SEM. * P<0.05; **P<0.01. Scale bar is 50 μm.
Transcript of Figure Legends to Supplemental Figures A B C-E C D E F A B
1
Figure Legends to Supplemental Figures
Supplemental Figure 1. Purity of rat neonatal cardiac fibroblast cell culture. (A, B)
Immunofluorescence staining of primary rat neonatal cardiac fibroblasts. Cardiac fibroblasts
were fixed with 4% PFA and stained with (A, B) prolyl 4-Hydroxylase (rFB marker) and
either, (A) α-smooth muscle actin (smooth muscle marker) or, (B) Troponin-I (cardiomyocyte
marker) and DAPI (nucleus). (n=3 experiments). (C-E) Protein expression of (C) fibroblast
marker S100A4 and (D) DDR2 in neonatal rat cardiac fibroblast lysates and (E) protein
expression of cardiomyocyte marker Troponin-I in neonatal rat cardiac fibroblast lysates and
cardiomyocyte lysate. (F) mRNA expression of α-MHC and FSP-1 in neonatal rat cardiac
fibroblasts. Data are shown as mean ± SEM. ***P<0.005. (n=3). Scale bar is 50 µm.
Supplemental Figure 2. (A) nSmase 2 regulates in part the secretion of miRNAs in cardiac
fibroblasts. Cardiac fibroblasts were treated with an inhibitor of nSmase 2 for 48 h and
miRNA expression of fibroblast-derived exosomes was measured. miRNA expression is
shown as fold change (FC) of control. Control cells were treated with DMSO. miRNA
expression was normalized to U1. (B) Angiotensin II treatment stimulated the secretion of
specific miRNAs. Cardiac fibroblasts were stimulated with angiotensin II (1nM) and IL-1β (4
ng/ml) for 24 h and miRNA expression of fibroblast-derived exosomes was measured.
miRNA expression is shown as fold change of control. Control cells were treated with PBS
and water/0.1% BSA. miRNA expression was normalized to U1. Data are shown as mean ±
SEM. * P<0.05; **P<0.01, (n=3).
Supplemental Figure 3. Depletion of exosomes in cardiac fibroblast conditioned media
abolishes cardiomyocyte hypertrophy. Cardiomyocytes were incubated with DMEM + 1%
FBS (indicated as control, cardiac fibroblast media), cardiac fibroblast conditioned media
containing exosomes (indicated as +exo) or cardiac fibroblast conditioned media depleted of
exosomes (indicated as -exo) (ratio 1:3; cardiomyocyte media: cardiac fibroblast conditioned
media) for 72 h. Cells were fixed and stained with α-actinin for cell size measurements. Data
are shown as mean ± SEM. * P<0.05; **P<0.01. Scale bar is 50 µm.
2
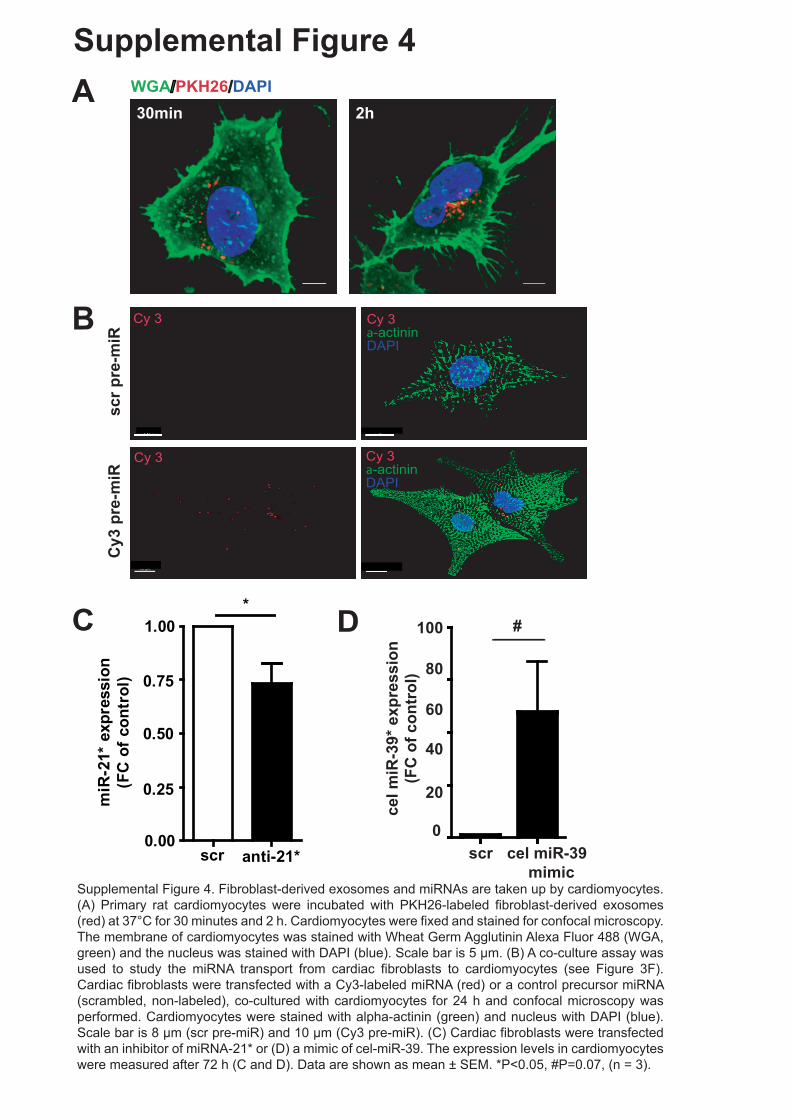
Supplemental Figure 4. Fibroblast-derived exosomes and miRNAs are taken up by
cardiomyocytes. (A) Primary rat cardiomyocytes were incubated with PKH26-labeled
fibroblast-derived exosomes (red) at 37°C for 30 minutes and 2 h. Cardiomyocytes were
fixed and stained for confocal microscopy. The membrane of cardiomyocytes was stained
with Wheat Germ Agglutinin Alexa Fluor 488 (WGA, green) and the nucleus was stained with
DAPI (blue). Scale bar is 5 µm. (B) A co-culture assay was used to study the miRNA
transport from cardiac fibroblasts to cardiomyocytes (see Figure 3F). Cardiac fibroblasts
were transfected with a Cy3-labeled miRNA (red) or a control precursor miRNA (scrambled,
non-labeled), co-cultured with cardiomyocytes for 24 h and confocal microscopy was
performed. Cardiomyocytes were stained with alpha-actinin (green) and nucleus with DAPI
(blue). Scale bar is 8 µm (scr pre-miR) and 10 µm (Cy3 pre-miR). (C) Cardiac fibroblasts
were transfected with an inhibitor of miRNA-21* or (D) a mimic of cel-miR-39. The expression
levels in cardiomyocytes were measured after 72 h (C and D). Data are shown as mean ±
SEM. * P<0.05, (n = 3).
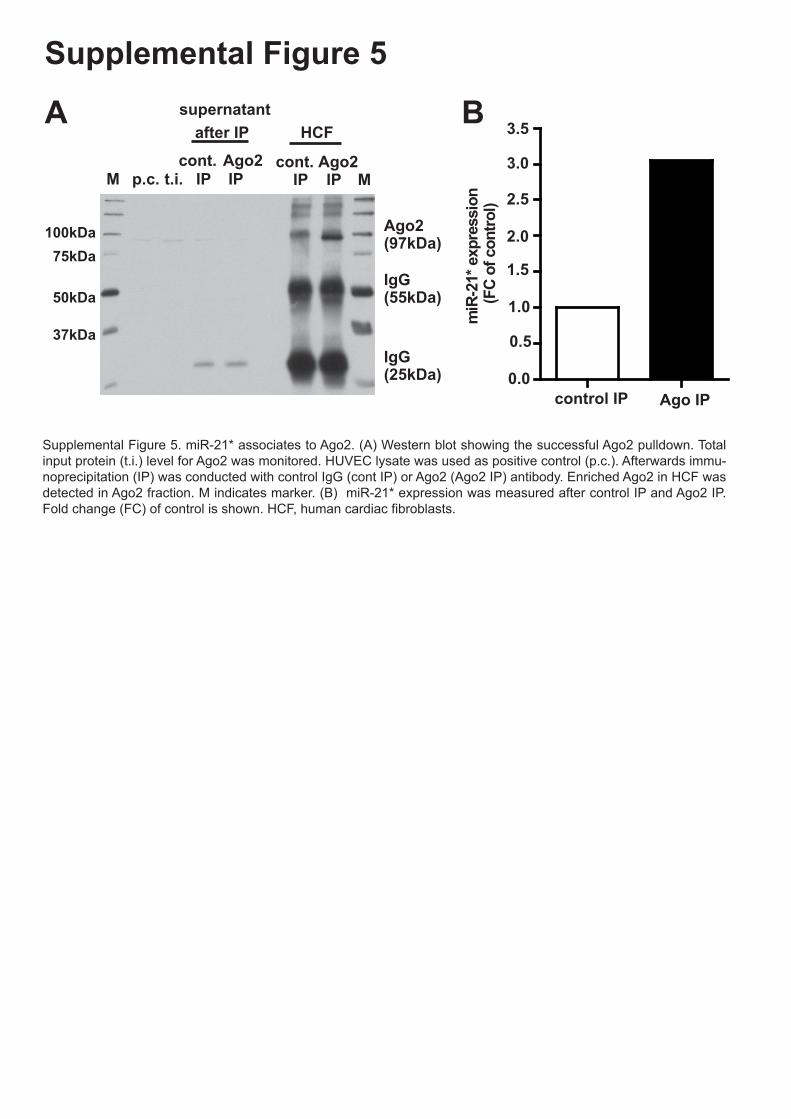
Supplemental Figure 5. miR-21* associates to Ago2. (A) Western blot showing the
successful Ago2 pulldown. Total input protein (t.i.) level for Ago2 was monitored. HUVEC
lysate was used as positive control (p.c.). Afterwards immunoprecipitation (IP) was
conducted with control IgG (cont IP) or Ago2 (Ago2 IP) antibody. Enriched Ago2 in HCF was
detected in Ago2 fraction. M indicates marker. (B) miR-21* expression was measured after
control IP and Ago2 IP. Fold change (FC) to control is shown.
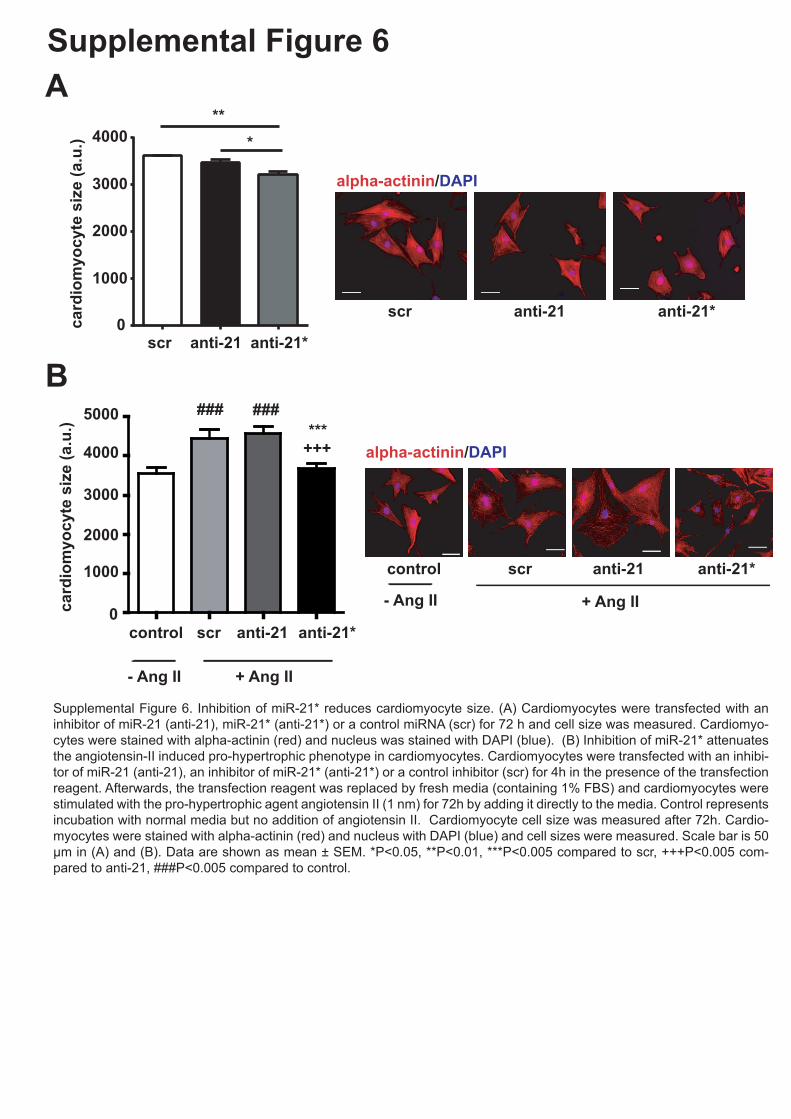
Supplemental Figure 6. Inhibition of miR-21* reduces cardiomyocyte size. (A)
Cardiomyocytes were transfected with an inhibitor of miR-21 (anti-21), miR-21* (anti-21*) or
a control miRNA (scr) for 72 h and cell size was measured. Cardiomyocytes were stained
with α-actinin (red) and nucleus was stained with DAPI (blue). Data are shown as mean ±
SEM. **P<0.01. (B) Inhibition of miR-21* attenuates the angiotensin-II induced pro-
hypertrophic phenotype in cardiomyocytes. Cardiomyocytes were transfected with an
inhibitor of miR-21 (anti-21), an inhibitor of miR-21* (anti-21*) or a control inhibitor (scr) and
stimulated with the pro-hypertrophic agent angiotensin II. Control is the incubation with
3
conditioned media and no angiotensin II. Cardiomyocyte cell size was measured after 72 h.
Cardiomyocytes were stained with alpha-actinin (red) and nucleus with DAPI (blue). Scale
bar is 50 µm in (A) and (B). Data are shown as mean ± SEM. *P<0.05 compared to scr,
++P<0.01 compared to anti-21, ###P<0.005 compared to control.
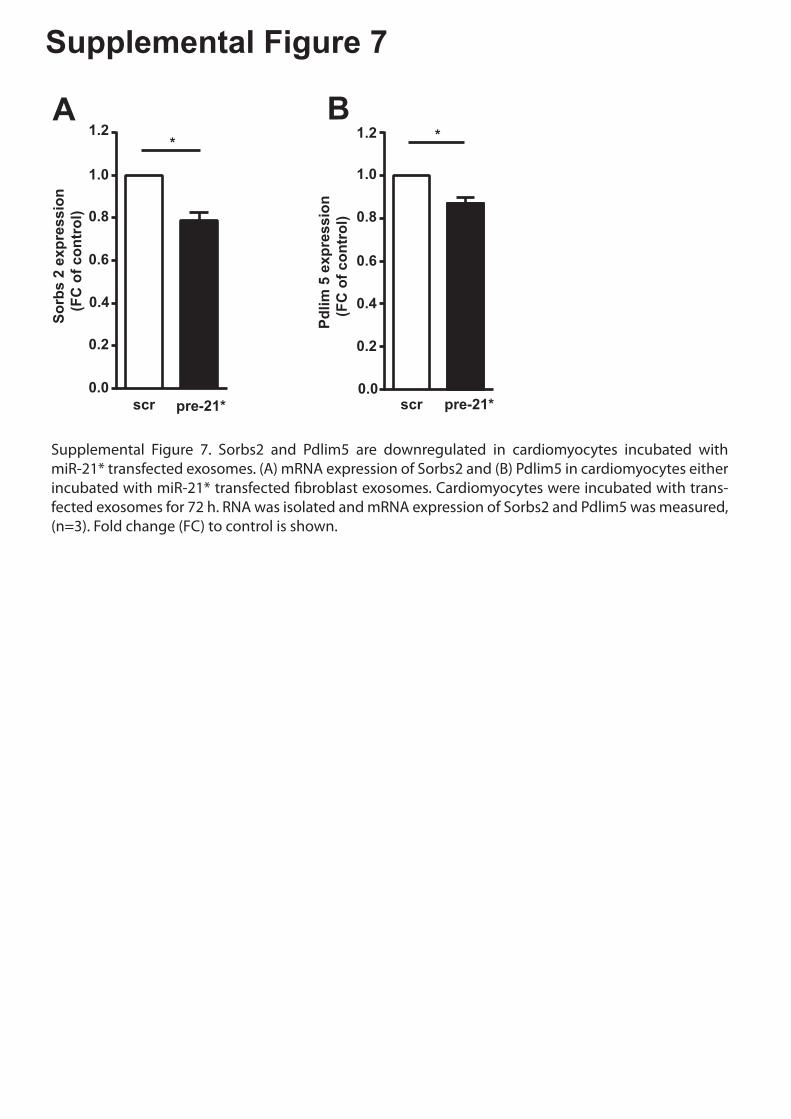
Supplemental Figure 7. Sorbs2 and Pdlim5 are downregulated in cardiomyocytes incubated
with miR-21* transfected exosomes. (A) mRNA expression of Sorbs2 and (B) Pdlim5 in
cardiomyocytes either incubated with miR-21* transfected fibroblast exosomes.
Cardiomyocytes were incubated with transfected exosomes for 72 h. RNA was isolated and
mRNA expression of Sorbs2 and Pdlim5 was measured, (n=3). Fold change (FC) to control
is shown.
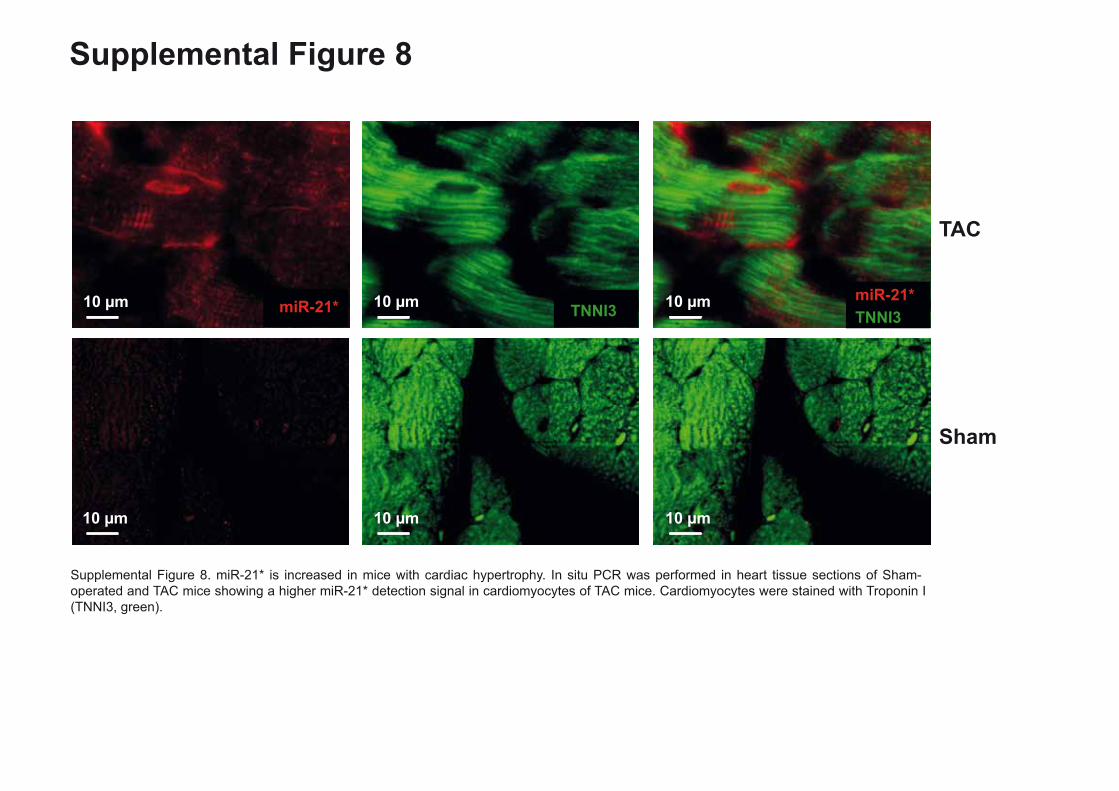
Supplemental Figure 8. miR-21* is increased in mice with cardiac hypertrophy. In situ PCR
was performed in heart tissue sections of Sham-operated and TAC mice showing a higher
miR-21* detection signal in cardiomyocytes of TAC mice.
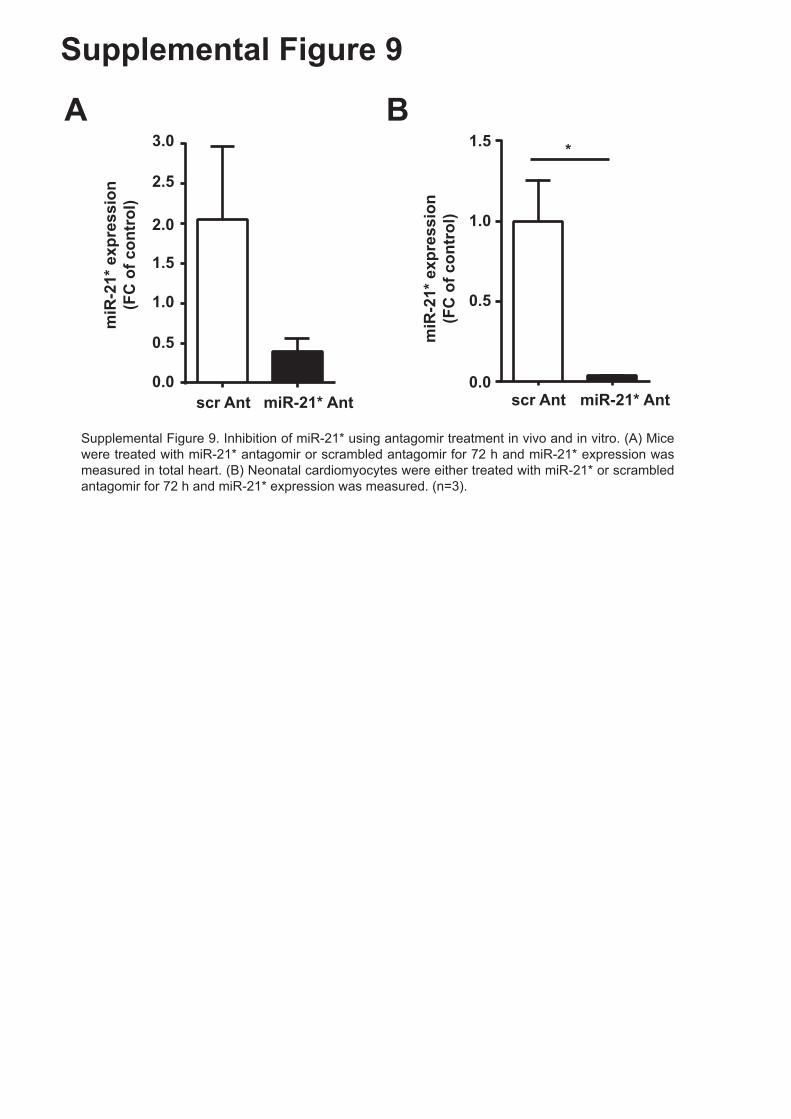
Supplemental Figure 9. Inhibition of miR-21* using antagomir treatment in vivo and in vitro.
(A) Mice were treated with miR-21* antagomir or scrambled antagomir for 72 h and miR-21*
expression was measured in total heart. (B) Neonatal cardiomyocytes were either treated
with miR-21* or scrambled antagomir for 72 h and miR-21* expression was measured. (n=3).
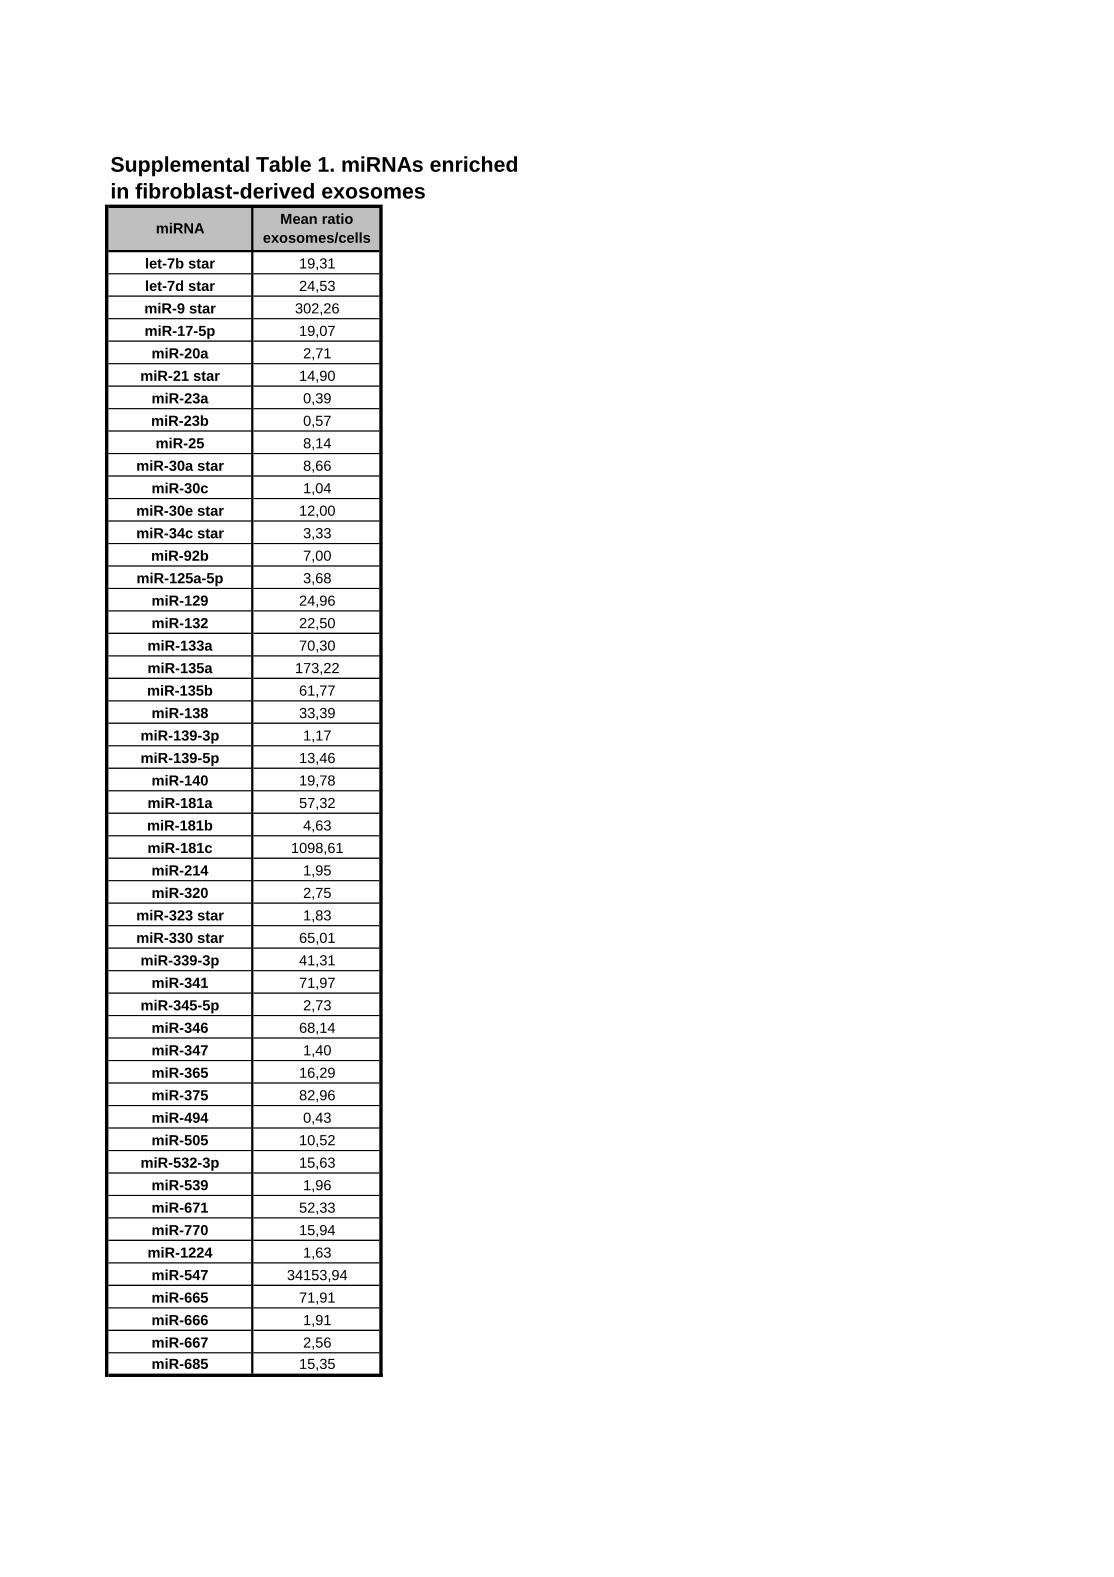
Supplemental Table 1. miRNAs are enriched in fibroblast-derived exosomes. A miRNA-
transcriptome profiling assay (388 rat miRNAs) was performed to identify miRNA content in
fibroblast-derived exosomes. The mean ratio of exosomes and cells was compared showing
50 miRNAs to be enriched in fibroblast-derived exosomes. Only miRNAs which were
detected in all samples and showed a CT<35 are shown.
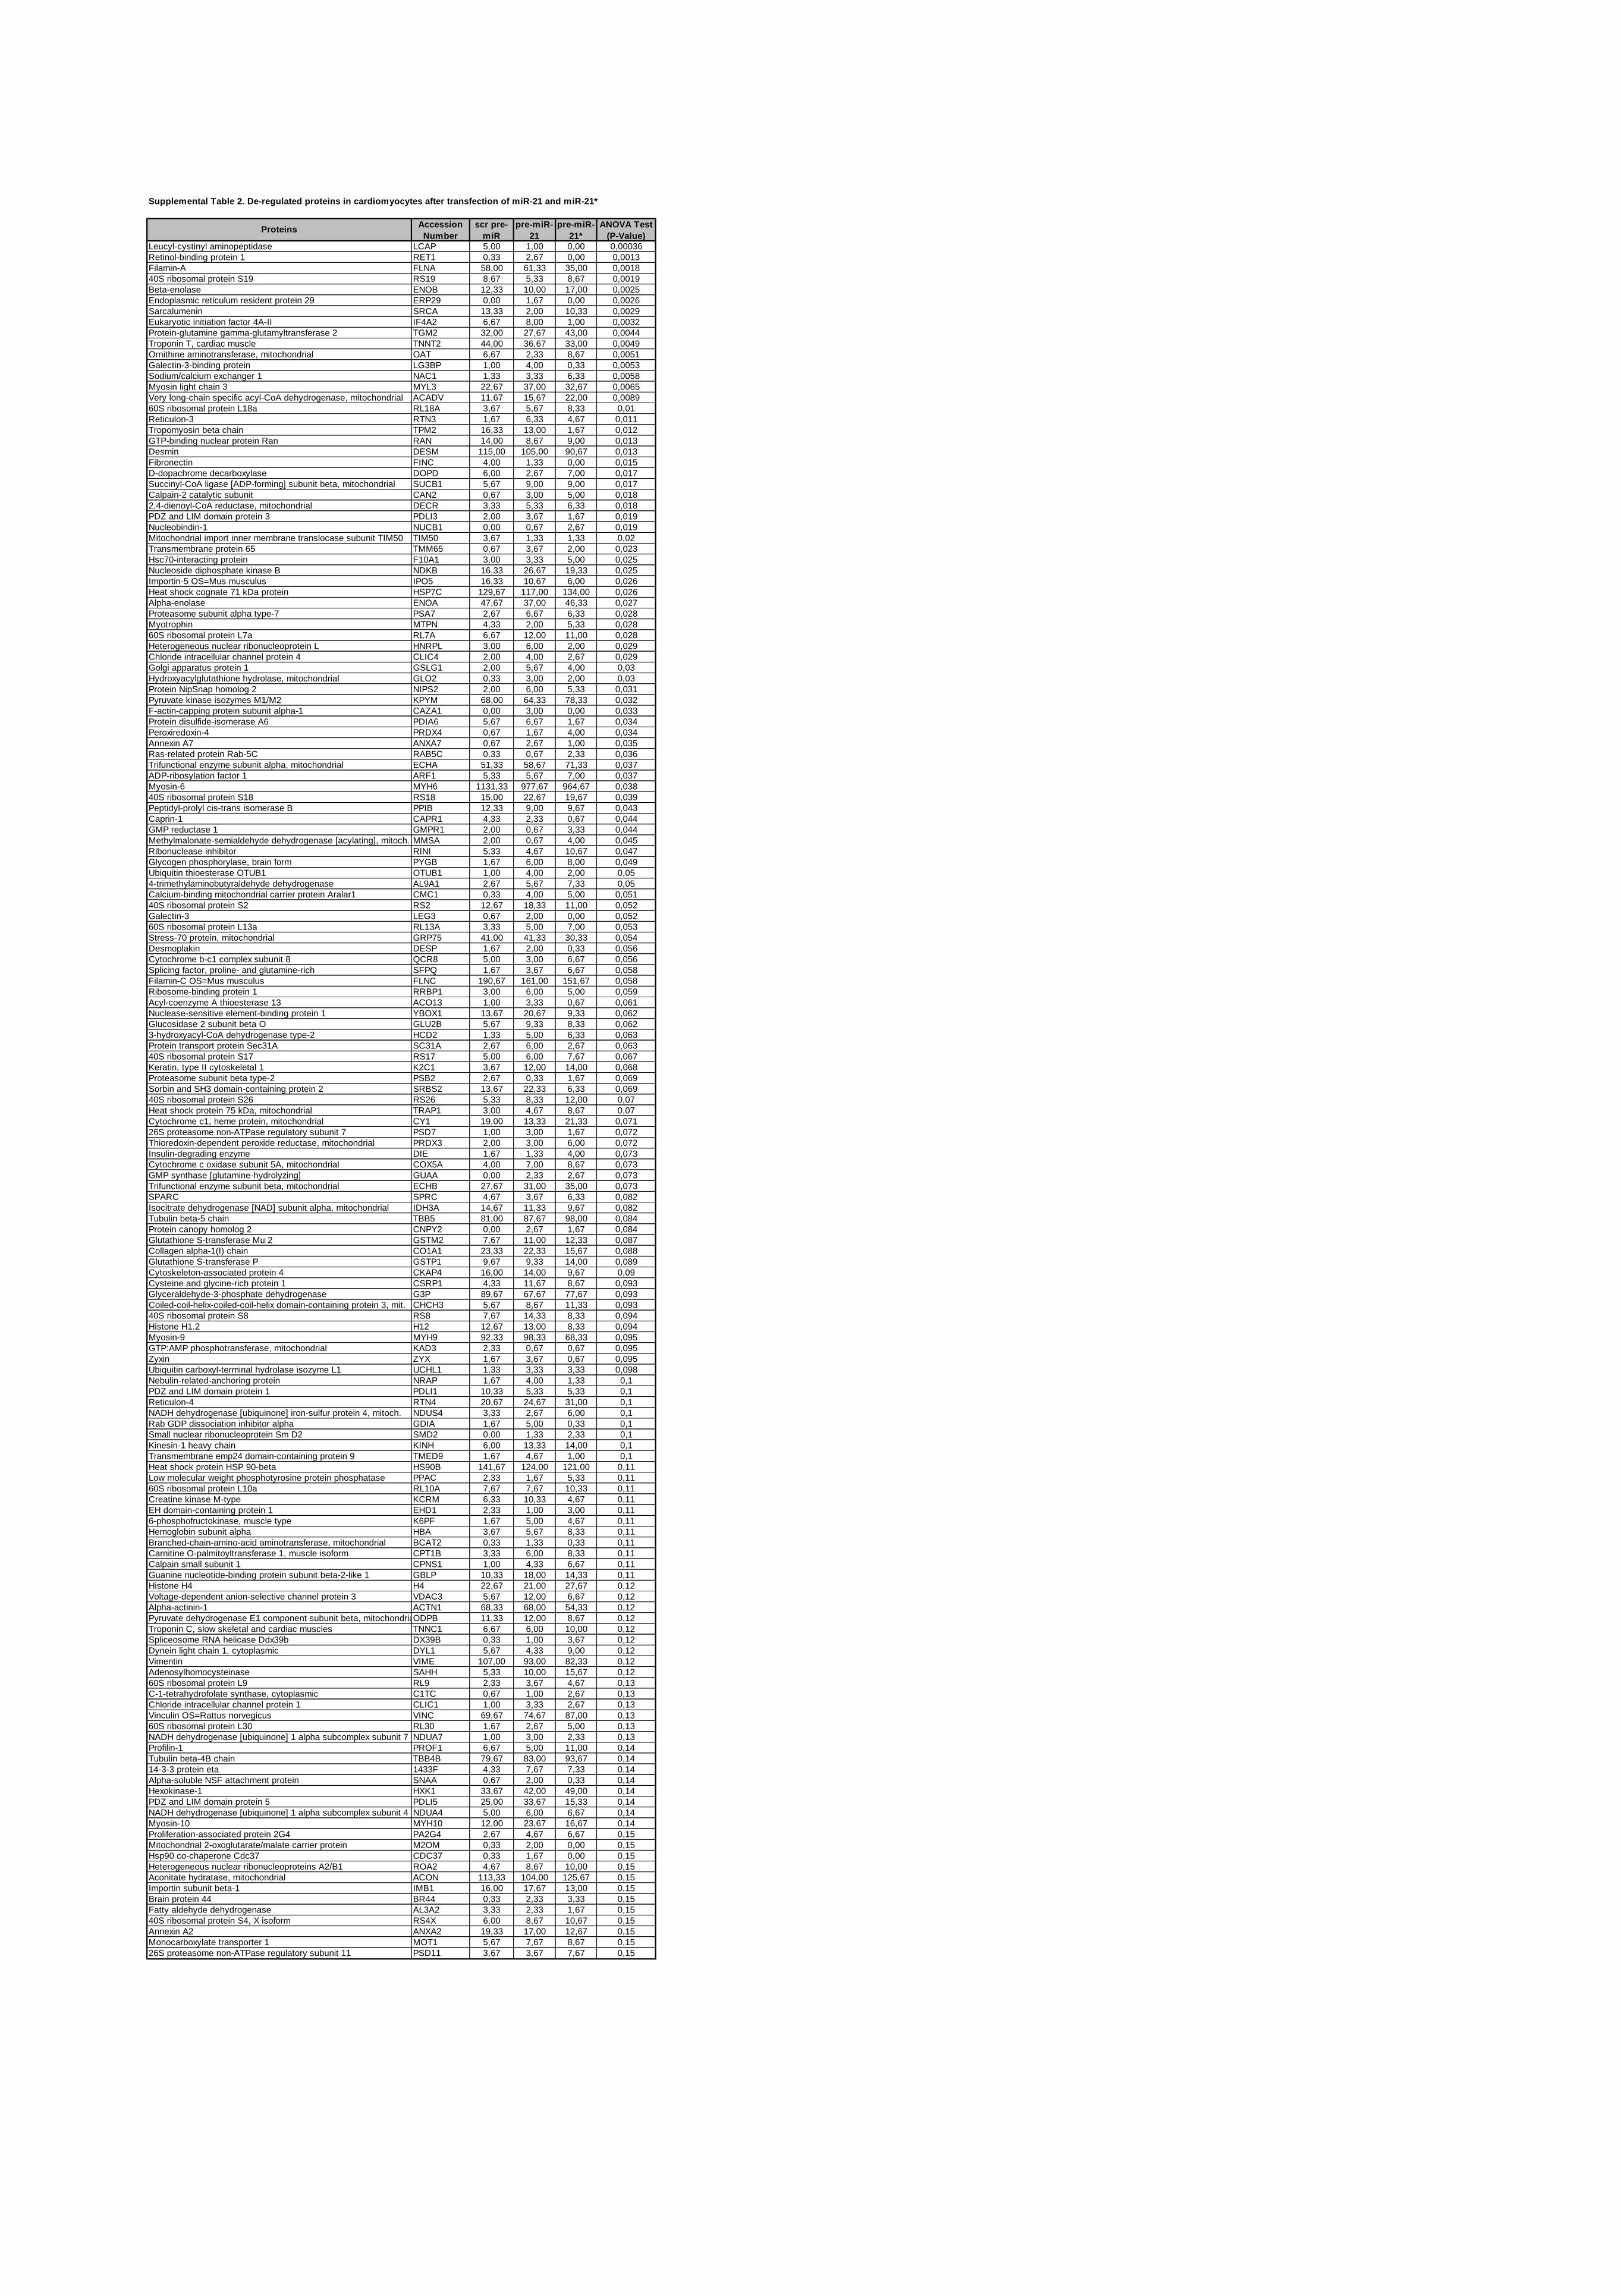
Supplemental Table 2. De-regulated proteins in cardiomyocytes after transfection of
miR-21 and miR-21*. Neonatal cardiomyocytes were transfected with a control precursor
miRNA (scr pre-miR), a precursor of miR-21 (pre-miR-21) or a precursor of miR-21* for 72 h.
Cardiomyocyte lysates were used for proteome profiling. (n=3 per group). Data are shown as
mean.
4
Supplemental Table 3. Hemodynamic analysis of Sham-operated (Sham) and Angiotensin
II (Ang II) minipumps implanted mice treated either with control (scr Ant) or miR-21*
antagomir (miR-21* Ant) using pressure-volume catheter system. Data are shown as mean ±
SEM. n=5 Sham scr Ant; n=6 Ang II scr Ant; n=5 Ang II miR-21* Ant.
Supplemental Movie 1. Fibroblast-derived exosomes are taken up by cardiomyocytes.
Neonatal rat cardiomyocytes were incubated with PKH26-labeled exosomes for 2 h. Cells
were fixed, stained and confocal analysis was performed. Cardiomyocyte cell membrane is
stained with Wheat Germ Agglutinin Alexa Fluor 488 (green), fibroblast-derived exosomes
with PKH26 (red) and nucleus with DAPI (blue). Scale bar as indicated.
P r o l y l 4 - H y d r o x y l a s e
P r o l y l 4 - H y d r o x y l a s e
α − s m o o t h m u s c l e a c t i n DAPI/merge
T r o p o n i n I
C M C
0 . 0 0
0 . 0 5
0 . 1 0 1 . 5
2 . 0
2 . 5
3 . 0
α -MHC FSP-1
A
B
C
D
E
F
Supplemental Figure 1
DAPI/merge
S100A4 (12kDa) GAPDH (34kDa)
DDR2 (116kDa) GAPDH (34kDa)
Troponin I (30kDa) GAPDH (34kDa)
mR
NA
expr
essi
on/G
APD
H
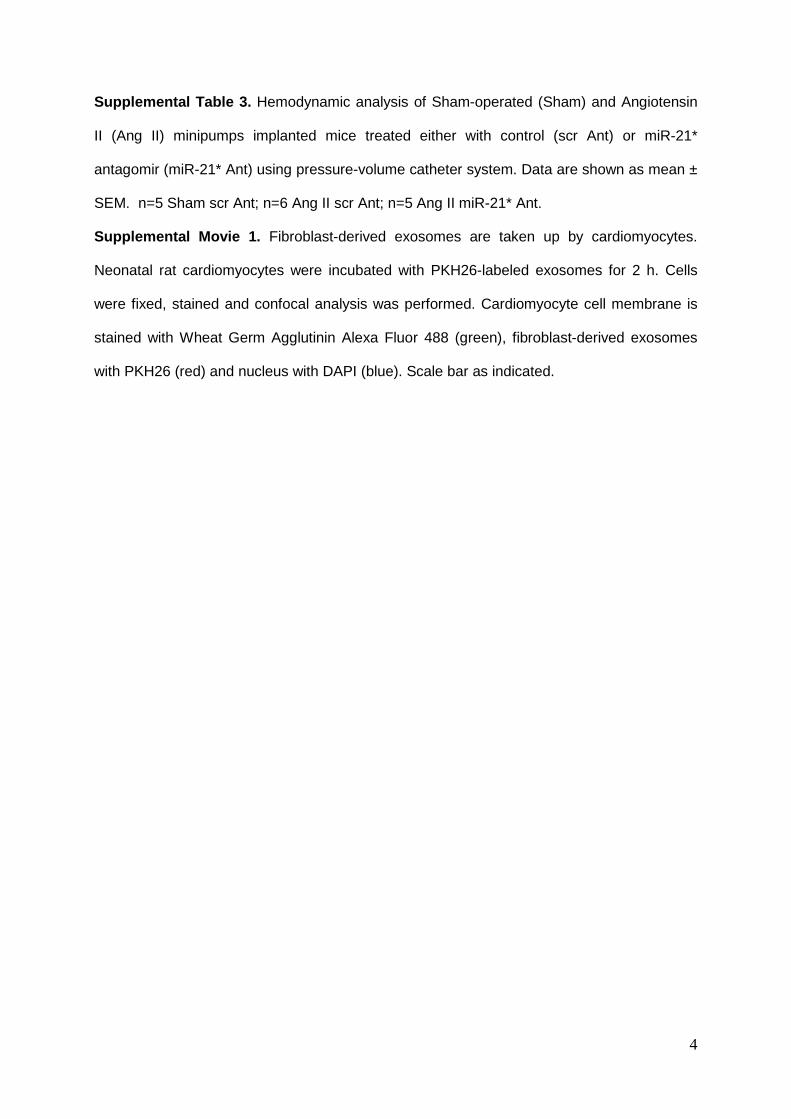
Supplemental Figure 1. Purity of rat neonatal cardiac fibroblast cell culture. (A, B) Immunofluorescence staining of primary rat neonatal cardiac fibroblasts. Cardiac fibroblasts were fixed with 4% PFA and stained with (A, B) prolyl 4-Hydroxylase (rFB marker) and either, (A) alpha-smooth muscle actin (smooth muscle marker) or, (B) Troponin I (cardiomyocyte marker) and DAPI (nucleus). (n=3 experiments). (C-E) Protein expression of (C) fibro-blast marker S100A4 and (D) DDR2 in neonatal rat cardiac fibroblast lysates and (E) protein expression of cardiomyocyte marker Troponin I in neonatal rat cardiac fibroblast lysates and cardiomyocyte lysate (CMC). (F) mRNA expression of alpha-MHC and FSP-1 in neonatal rat cardiac fibroblasts. Data are shown as mean ± SEM. ***P<0.005. (n=3). Scale bar is 50 µm.
fibroblasts
fibroblasts
fibroblasts
***
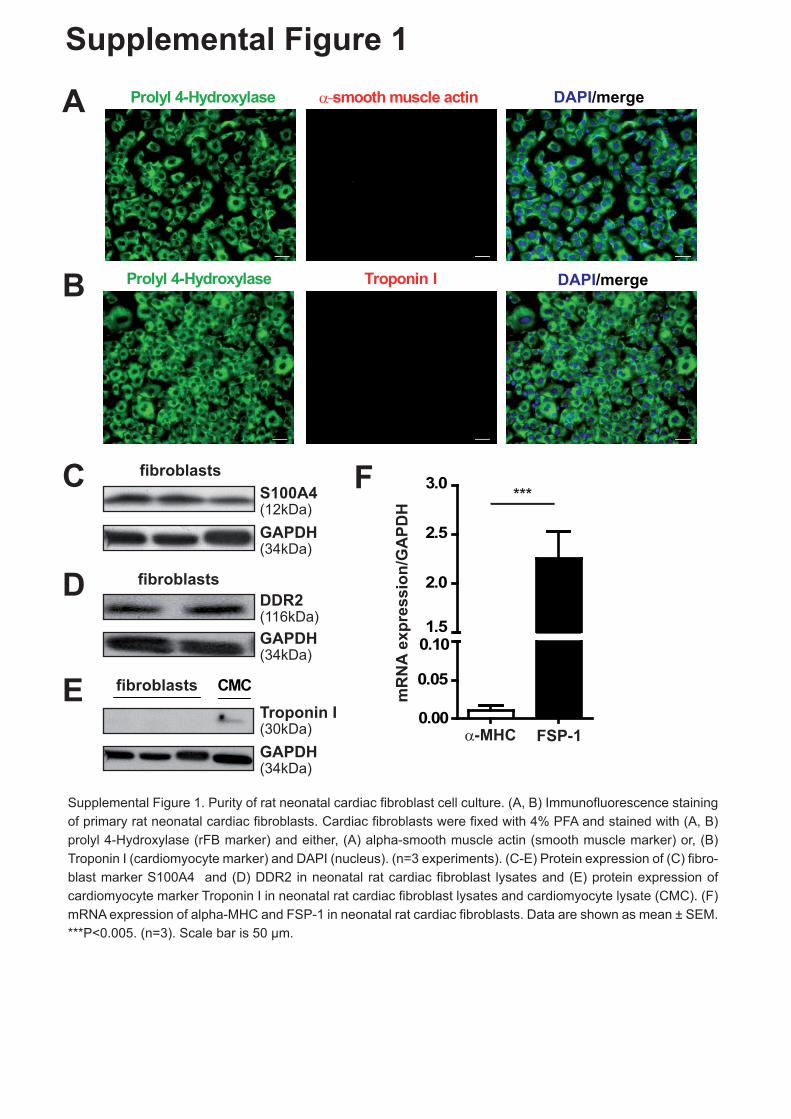
Supplemental Figure 2. (A) nSmase 2 regulates in part the concentration of miRNAs inthe supernatant of cardiac fibroblasts. Cardiac fibroblasts were treated with an inhibitor of nSmase 2 for 48 h and miRNA expression of fibroblast-derived exosomes was measured. miRNA expression is shown as fold change (FC) of control. Control cells were treated with DMSO. miRNA expression was normalized to U1. (B) Angiotensin II treatment stimulated the secre-tion of specific miRNAs. Cardiac fibroblasts were stimulated with angiotensin II (1nM) and IL-1β (4 ng/ml) for 24 h and miRNA expression of fibroblast-derived exosomes was measured. miRNA expression is shown as fold change of control. Control cells were treated with PBS and water/0.1% BSA. miRNA expression was normalized to U1. Data are shown as mean ± SEM. *P<0.05, **P<0.01, (n=3).
Supplemental Figure 2
A
B
contro
l
miR-17-5p
miR-23a
miR-132
miR135a
miR-135b
miR-138
miR-181a
miR-181b
miR-181c
miR-341
miR-375
miR-539
0
1
2
3
4
5
1015202530
miR
NA e
xpre
ssio
n(F
C of
con
trol)
control
miR-17-5p
miR-23a
miR-132
miR135a
miR-135b
miR-138
miR-181a
miR-181b
miR-181c
miR-341
miR-375
miR-539
0
1
2
3
4
5
miR
NA
exp
ress
ion
(FC
of c
ontr
ol)
** * * **
control rFb supernatant + exosomes
rFb supernatant - exosomes
Supplemental Figure 3 ***
**
*
6000
+ exo control - exo
4000
2000
0
alpha-actinin/DAPI
card
iom
yocy
te s
ize
(a.u
.)
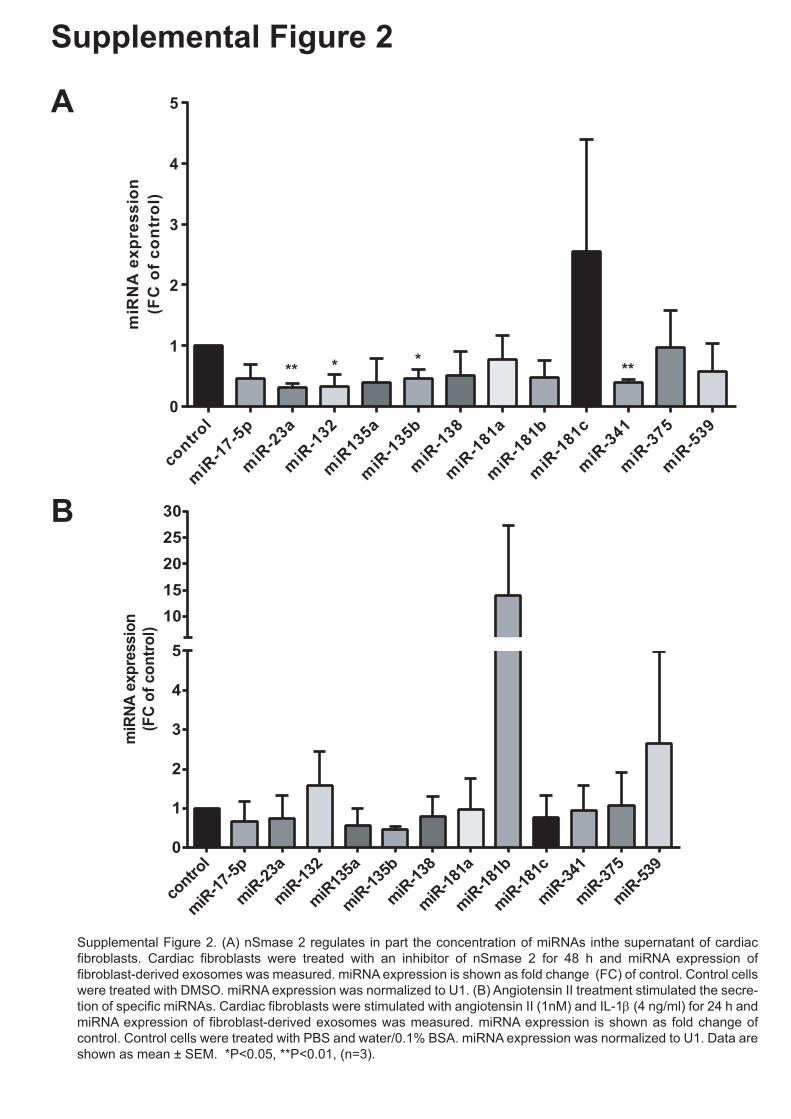
Supplemental Figure 3. Depletion of exosomes in cardiac fibroblast conditioned media abolishes cardiomyo-cyte hypertrophy. Cardiomyocytes were incubated with DMEM + 1% FBS (indicated as control, cardiac fibro-blast media), cardiac fibroblast conditioned media containing exosomes (indicated as +exo) or cardiac fibro-blast conditioned media depleted of exosomes (indicated as -exo) (ratio 1:3; cardiomyocyte media: cardiac fibroblast conditioned media) for 72 h. Cells were fixed and stained with alpha-actinin for cell size measure-ments. Data are shown as mean ± SEM. * P<0.05; **P<0.01; ***P<0.005. rFb= rat fibroblast; Scale bar is 50 µm.
30min 2h
Supplemental Figure 4 WGA/PKH26/DAPIA
B
C D
scr p
re-m
iR
Cy3
pre
-miR
Cy 3
Cy 3a-actininDAPI
Cy 3a-actininDAPI
Cy 3
cel m
iR-3
9* e
xpre
ssio
n(F
C o
f con
trol
)
scr cel miR-39 mimic
0
20
40
60
80
100 #
Supplemental Figure 4. Fibroblast-derived exosomes and miRNAs are taken up by cardiomyocytes. (A) Primary rat cardiomyocytes were incubated with PKH26-labeled fibroblast-derived exosomes (red) at 37°C for 30 minutes and 2 h. Cardiomyocytes were fixed and stained for confocal microscopy. The membrane of cardiomyocytes was stained with Wheat Germ Agglutinin Alexa Fluor 488 (WGA, green) and the nucleus was stained with DAPI (blue). Scale bar is 5 µm. (B) A co-culture assay was used to study the miRNA transport from cardiac fibroblasts to cardiomyocytes (see Figure 3F). Cardiac fibroblasts were transfected with a Cy3-labeled miRNA (red) or a control precursor miRNA (scrambled, non-labeled), co-cultured with cardiomyocytes for 24 h and confocal microscopy was performed. Cardiomyocytes were stained with alpha-actinin (green) and nucleus with DAPI (blue). Scale bar is 8 µm (scr pre-miR) and 10 µm (Cy3 pre-miR). (C) Cardiac fibroblasts were transfected with an inhibitor of miRNA-21* or (D) a mimic of cel-miR-39. The expression levels in cardiomyocytes were measured after 72 h (C and D). Data are shown as mean ± SEM. *P<0.05, #P=0.07, (n = 3).
scr anti-21*0.00
0.25
0.50
0.75
1.00*
miR
-21*
exp
ress
ion
(FC
of c
ontr
ol)
Supplemental Figure 5
HCF
cont. IP
Ago2 IP
supernatant after IP
cont. IP
Ago2 IP t.i. p.c.
Ago2 (97kDa)
IgG (55kDa)
IgG (25kDa)
M M
50kDa
37kDa
75kDa 100kDa
0.0
1.0
2.0
3.0
0.5
1.5
2.5
3.5
n o i s s e r p x e * 1 2 - R
i m
) l o r t n o c f o C
F (
control IP Ago IP
A B
Supplemental Figure 5. miR-21* associates to Ago2. (A) Western blot showing the successful Ago2 pulldown. Total input protein (t.i.) level for Ago2 was monitored. HUVEC lysate was used as positive control (p.c.). Afterwards immu-noprecipitation (IP) was conducted with control IgG (cont IP) or Ago2 (Ago2 IP) antibody. Enriched Ago2 in HCF was detected in Ago2 fraction. M indicates marker. (B) miR-21* expression was measured after control IP and Ago2 IP. Fold change (FC) of control is shown. HCF, human cardiac fibroblasts.
Supplemental Figure 6 A
B scr anti-21 anti-21*
4000
3000
2000
1000
0
** *
card
iom
yocy
te s
ize
(a.u
.)
scr anti-21 anti-21*
alpha-actinin/DAPI
scr anti-21 anti-21*
4000
3000
2000
1000
0 card
iom
yocy
te s
ize
(a.u
.)
5000
control
- Ang II + Ang II
### ###
+++ ***
alpha-actinin/DAPI
scr anti-21 anti-21* control
- Ang II + Ang II
Supplemental Figure 6. Inhibition of miR-21* reduces cardiomyocyte size. (A) Cardiomyocytes were transfected with an inhibitor of miR-21 (anti-21), miR-21* (anti-21*) or a control miRNA (scr) for 72 h and cell size was measured. Cardiomyo-cytes were stained with alpha-actinin (red) and nucleus was stained with DAPI (blue). (B) Inhibition of miR-21* attenuates the angiotensin-II induced pro-hypertrophic phenotype in cardiomyocytes. Cardiomyocytes were transfected with an inhibi-tor of miR-21 (anti-21), an inhibitor of miR-21* (anti-21*) or a control inhibitor (scr) for 4h in the presence of the transfection reagent. Afterwards, the transfection reagent was replaced by fresh media (containing 1% FBS) and cardiomyocytes were stimulated with the pro-hypertrophic agent angiotensin II (1 nm) for 72h by adding it directly to the media. Control represents incubation with normal media but no addition of angiotensin II. Cardiomyocyte cell size was measured after 72h. Cardio-myocytes were stained with alpha-actinin (red) and nucleus with DAPI (blue) and cell sizes were measured. Scale bar is 50 µm in (A) and (B). Data are shown as mean ± SEM. *P<0.05, **P<0.01, ***P<0.005 compared to scr, +++P<0.005 com-pared to anti-21, ###P<0.005 compared to control.
A
scr pre-21*0.0
0.2
0.4
0.6
0.8
1.0
1.2*
Sorb
s 2
expr
essi
on
(F
C o
f con
trol
)
scr pre-21*0.0
0.2
0.4
0.6
0.8
1.0
1.2 *
Pdlim
5 e
xpre
ssio
n
(FC
of c
ontr
ol)
B
Supplemental Figure 7
Supplemental Figure 7. Sorbs2 and Pdlim5 are downregulated in cardiomyocytes incubated with miR-21* transfected exosomes. (A) mRNA expression of Sorbs2 and (B) Pdlim5 in cardiomyocytes either incubated with miR-21* transfected �broblast exosomes. Cardiomyocytes were incubated with trans-fected exosomes for 72 h. RNA was isolated and mRNA expression of Sorbs2 and Pdlim5 was measured, (n=3). Fold change (FC) to control is shown.
10 µm
10 µm 10 µm 10 µm
10 µm 10 µm
Supplemental Figure 8
TAC
Sham
miR-21* miR-21* TNNI3 TNNI3
Supplemental Figure 8. miR-21* is increased in mice with cardiac hypertrophy. In situ PCR was performed in heart tissue sections of Sham-operated and TAC mice showing a higher miR-21* detection signal in cardiomyocytes of TAC mice. Cardiomyocytes were stained with Troponin I (TNNI3, green).
Supplemental Figure 9
A B 1.5
1.0
0.5
0.0
miR
-21*
exp
ress
ion
(FC
of c
ontr
ol)
*
miR
-21*
exp
ress
ion
(FC
of c
ontr
ol)
0.0
0.5
1.0
1.5
2.0
2.5
3.0
scr Ant scr Ant miR-21* Ant miR-21* Ant
Supplemental Figure 9. Inhibition of miR-21* using antagomir treatment in vivo and in vitro. (A) Mice were treated with miR-21* antagomir or scrambled antagomir for 72 h and miR-21* expression was measured in total heart. (B) Neonatal cardiomyocytes were either treated with miR-21* or scrambled antagomir for 72 h and miR-21* expression was measured. (n=3).
Supplemental Table 1. miRNAs enriched
in fibroblast-derived exosomes
let-7b star 19,31
let-7d star 24,53
miR-9 star 302,26
miR-17-5p 19,07
miR-20a 2,71
miR-21 star 14,90
miR-23a 0,39
miR-23b 0,57
miR-25 8,14
miR-30a star 8,66
miR-30c 1,04
miR-30e star 12,00
miR-34c star 3,33
miR-92b 7,00
miR-125a-5p 3,68
miR-129 24,96
miR-132 22,50
miR-133a 70,30
miR-135a 173,22
miR-135b 61,77
miR-138 33,39
miR-139-3p 1,17
miR-139-5p 13,46
miR-140 19,78
miR-181a 57,32
miR-181b 4,63
miR-181c 1098,61
miR-214 1,95
miR-320 2,75
miR-323 star 1,83
miR-330 star 65,01
miR-339-3p 41,31
miR-341 71,97
miR-345-5p 2,73
miR-346 68,14
miR-347 1,40
miR-365 16,29
miR-375 82,96
miR-494 0,43
miR-505 10,52
miR-532-3p 15,63
miR-539 1,96
miR-671 52,33
miR-770 15,94
miR-1224 1,63
miR-547 34153,94
miR-665 71,91
miR-666 1,91
miR-667 2,56
miR-685 15,35
miRNAMean ratio
exosomes/cells
Supplemental Table 2. De-regulated proteins in cardiomyocytes after transfection of miR-21 and miR-21*
Leucyl-cystinyl aminopeptidase LCAP 5,00 1,00 0,00 0,00036
Retinol-binding protein 1 RET1 0,33 2,67 0,00 0,0013
Filamin-A FLNA 58,00 61,33 35,00 0,0018
40S ribosomal protein S19 RS19 8,67 5,33 8,67 0,0019
Beta-enolase ENOB 12,33 10,00 17,00 0,0025
Endoplasmic reticulum resident protein 29 ERP29 0,00 1,67 0,00 0,0026
Sarcalumenin SRCA 13,33 2,00 10,33 0,0029
Eukaryotic initiation factor 4A-II IF4A2 6,67 8,00 1,00 0,0032
Protein-glutamine gamma-glutamyltransferase 2 TGM2 32,00 27,67 43,00 0,0044
Troponin T, cardiac muscle TNNT2 44,00 36,67 33,00 0,0049
Ornithine aminotransferase, mitochondrial OAT 6,67 2,33 8,67 0,0051
Galectin-3-binding protein LG3BP 1,00 4,00 0,33 0,0053
Sodium/calcium exchanger 1 NAC1 1,33 3,33 6,33 0,0058
Myosin light chain 3 MYL3 22,67 37,00 32,67 0,0065
Very long-chain specific acyl-CoA dehydrogenase, mitochondrial ACADV 11,67 15,67 22,00 0,0089
60S ribosomal protein L18a RL18A 3,67 5,67 8,33 0,01
Reticulon-3 RTN3 1,67 6,33 4,67 0,011
Tropomyosin beta chain TPM2 16,33 13,00 1,67 0,012
GTP-binding nuclear protein Ran RAN 14,00 8,67 9,00 0,013
Desmin DESM 115,00 105,00 90,67 0,013
Fibronectin FINC 4,00 1,33 0,00 0,015
D-dopachrome decarboxylase DOPD 6,00 2,67 7,00 0,017
Succinyl-CoA ligase [ADP-forming] subunit beta, mitochondrial SUCB1 5,67 9,00 9,00 0,017
Calpain-2 catalytic subunit CAN2 0,67 3,00 5,00 0,018
2,4-dienoyl-CoA reductase, mitochondrial DECR 3,33 5,33 6,33 0,018
PDZ and LIM domain protein 3 PDLI3 2,00 3,67 1,67 0,019
Nucleobindin-1 NUCB1 0,00 0,67 2,67 0,019
Mitochondrial import inner membrane translocase subunit TIM50 TIM50 3,67 1,33 1,33 0,02
Transmembrane protein 65 TMM65 0,67 3,67 2,00 0,023
Hsc70-interacting protein F10A1 3,00 3,33 5,00 0,025
Nucleoside diphosphate kinase B NDKB 16,33 26,67 19,33 0,025
Importin-5 OS=Mus musculus IPO5 16,33 10,67 6,00 0,026
Heat shock cognate 71 kDa protein HSP7C 129,67 117,00 134,00 0,026
Alpha-enolase ENOA 47,67 37,00 46,33 0,027
Proteasome subunit alpha type-7 PSA7 2,67 6,67 6,33 0,028
Myotrophin MTPN 4,33 2,00 5,33 0,028
60S ribosomal protein L7a RL7A 6,67 12,00 11,00 0,028
Heterogeneous nuclear ribonucleoprotein L HNRPL 3,00 6,00 2,00 0,029
Chloride intracellular channel protein 4 CLIC4 2,00 4,00 2,67 0,029
Golgi apparatus protein 1 GSLG1 2,00 5,67 4,00 0,03
Hydroxyacylglutathione hydrolase, mitochondrial GLO2 0,33 3,00 2,00 0,03
Protein NipSnap homolog 2 NIPS2 2,00 6,00 5,33 0,031
Pyruvate kinase isozymes M1/M2 KPYM 68,00 64,33 78,33 0,032
F-actin-capping protein subunit alpha-1 CAZA1 0,00 3,00 0,00 0,033
Protein disulfide-isomerase A6 PDIA6 5,67 6,67 1,67 0,034
Peroxiredoxin-4 PRDX4 0,67 1,67 4,00 0,034
Annexin A7 ANXA7 0,67 2,67 1,00 0,035
Ras-related protein Rab-5C RAB5C 0,33 0,67 2,33 0,036
Trifunctional enzyme subunit alpha, mitochondrial ECHA 51,33 58,67 71,33 0,037
ADP-ribosylation factor 1 ARF1 5,33 5,67 7,00 0,037
Myosin-6 MYH6 1131,33 977,67 964,67 0,038
40S ribosomal protein S18 RS18 15,00 22,67 19,67 0,039
Peptidyl-prolyl cis-trans isomerase B PPIB 12,33 9,00 9,67 0,043
Caprin-1 CAPR1 4,33 2,33 0,67 0,044
GMP reductase 1 GMPR1 2,00 0,67 3,33 0,044
Methylmalonate-semialdehyde dehydrogenase [acylating], mitoch. MMSA 2,00 0,67 4,00 0,045
Ribonuclease inhibitor RINI 5,33 4,67 10,67 0,047
Glycogen phosphorylase, brain form PYGB 1,67 6,00 8,00 0,049
Ubiquitin thioesterase OTUB1 OTUB1 1,00 4,00 2,00 0,05
4-trimethylaminobutyraldehyde dehydrogenase AL9A1 2,67 5,67 7,33 0,05
Calcium-binding mitochondrial carrier protein Aralar1 CMC1 0,33 4,00 5,00 0,051
40S ribosomal protein S2 RS2 12,67 18,33 11,00 0,052
Galectin-3 LEG3 0,67 2,00 0,00 0,052
60S ribosomal protein L13a RL13A 3,33 5,00 7,00 0,053
Stress-70 protein, mitochondrial GRP75 41,00 41,33 30,33 0,054
Desmoplakin DESP 1,67 2,00 0,33 0,056
Cytochrome b-c1 complex subunit 8 QCR8 5,00 3,00 6,67 0,056
Splicing factor, proline- and glutamine-rich SFPQ 1,67 3,67 6,67 0,058
Filamin-C OS=Mus musculus FLNC 190,67 161,00 151,67 0,058
Ribosome-binding protein 1 RRBP1 3,00 6,00 5,00 0,059
Acyl-coenzyme A thioesterase 13 ACO13 1,00 3,33 0,67 0,061
Nuclease-sensitive element-binding protein 1 YBOX1 13,67 20,67 9,33 0,062
Glucosidase 2 subunit beta O GLU2B 5,67 9,33 8,33 0,062
3-hydroxyacyl-CoA dehydrogenase type-2 HCD2 1,33 5,00 6,33 0,063
Protein transport protein Sec31A SC31A 2,67 6,00 2,67 0,063
40S ribosomal protein S17 RS17 5,00 6,00 7,67 0,067
Keratin, type II cytoskeletal 1 K2C1 3,67 12,00 14,00 0,068
Proteasome subunit beta type-2 PSB2 2,67 0,33 1,67 0,069
Sorbin and SH3 domain-containing protein 2 SRBS2 13,67 22,33 6,33 0,069
40S ribosomal protein S26 RS26 5,33 8,33 12,00 0,07
Heat shock protein 75 kDa, mitochondrial TRAP1 3,00 4,67 8,67 0,07
Cytochrome c1, heme protein, mitochondrial CY1 19,00 13,33 21,33 0,071
26S proteasome non-ATPase regulatory subunit 7 PSD7 1,00 3,00 1,67 0,072
Thioredoxin-dependent peroxide reductase, mitochondrial PRDX3 2,00 3,00 6,00 0,072
Insulin-degrading enzyme DIE 1,67 1,33 4,00 0,073
Cytochrome c oxidase subunit 5A, mitochondrial COX5A 4,00 7,00 8,67 0,073
GMP synthase [glutamine-hydrolyzing] GUAA 0,00 2,33 2,67 0,073
Trifunctional enzyme subunit beta, mitochondrial ECHB 27,67 31,00 35,00 0,073
SPARC SPRC 4,67 3,67 6,33 0,082
Isocitrate dehydrogenase [NAD] subunit alpha, mitochondrial IDH3A 14,67 11,33 9,67 0,082
Tubulin beta-5 chain TBB5 81,00 87,67 98,00 0,084
Protein canopy homolog 2 CNPY2 0,00 2,67 1,67 0,084
Glutathione S-transferase Mu 2 GSTM2 7,67 11,00 12,33 0,087
Collagen alpha-1(I) chain CO1A1 23,33 22,33 15,67 0,088
Glutathione S-transferase P GSTP1 9,67 9,33 14,00 0,089
Cytoskeleton-associated protein 4 CKAP4 16,00 14,00 9,67 0,09
Cysteine and glycine-rich protein 1 CSRP1 4,33 11,67 8,67 0,093
Glyceraldehyde-3-phosphate dehydrogenase G3P 89,67 67,67 77,67 0,093
Coiled-coil-helix-coiled-coil-helix domain-containing protein 3, mit. CHCH3 5,67 8,67 11,33 0,093
40S ribosomal protein S8 RS8 7,67 14,33 8,33 0,094
Histone H1.2 H12 12,67 13,00 8,33 0,094
Myosin-9 MYH9 92,33 98,33 68,33 0,095
GTP:AMP phosphotransferase, mitochondrial KAD3 2,33 0,67 0,67 0,095
Zyxin ZYX 1,67 3,67 0,67 0,095
Ubiquitin carboxyl-terminal hydrolase isozyme L1 UCHL1 1,33 3,33 3,33 0,098
Nebulin-related-anchoring protein NRAP 1,67 4,00 1,33 0,1
PDZ and LIM domain protein 1 PDLI1 10,33 5,33 5,33 0,1
Reticulon-4 RTN4 20,67 24,67 31,00 0,1
NADH dehydrogenase [ubiquinone] iron-sulfur protein 4, mitoch. NDUS4 3,33 2,67 6,00 0,1
Rab GDP dissociation inhibitor alpha GDIA 1,67 5,00 0,33 0,1
Small nuclear ribonucleoprotein Sm D2 SMD2 0,00 1,33 2,33 0,1
Kinesin-1 heavy chain KINH 6,00 13,33 14,00 0,1
Transmembrane emp24 domain-containing protein 9 TMED9 1,67 4,67 1,00 0,1
Heat shock protein HSP 90-beta HS90B 141,67 124,00 121,00 0,11
Low molecular weight phosphotyrosine protein phosphatase PPAC 2,33 1,67 5,33 0,11
60S ribosomal protein L10a RL10A 7,67 7,67 10,33 0,11
Creatine kinase M-type KCRM 6,33 10,33 4,67 0,11
EH domain-containing protein 1 EHD1 2,33 1,00 3,00 0,11
6-phosphofructokinase, muscle type K6PF 1,67 5,00 4,67 0,11
Hemoglobin subunit alpha HBA 3,67 5,67 8,33 0,11
Branched-chain-amino-acid aminotransferase, mitochondrial BCAT2 0,33 1,33 0,33 0,11
Carnitine O-palmitoyltransferase 1, muscle isoform CPT1B 3,33 6,00 8,33 0,11
Calpain small subunit 1 CPNS1 1,00 4,33 6,67 0,11
Guanine nucleotide-binding protein subunit beta-2-like 1 GBLP 10,33 18,00 14,33 0,11
Histone H4 H4 22,67 21,00 27,67 0,12
Voltage-dependent anion-selective channel protein 3 VDAC3 5,67 12,00 6,67 0,12
Alpha-actinin-1 ACTN1 68,33 68,00 54,33 0,12
Pyruvate dehydrogenase E1 component subunit beta, mitochondrial ODPB 11,33 12,00 8,67 0,12
Troponin C, slow skeletal and cardiac muscles TNNC1 6,67 6,00 10,00 0,12
Spliceosome RNA helicase Ddx39b DX39B 0,33 1,00 3,67 0,12
Dynein light chain 1, cytoplasmic DYL1 5,67 4,33 9,00 0,12
Vimentin VIME 107,00 93,00 82,33 0,12
Adenosylhomocysteinase SAHH 5,33 10,00 15,67 0,12
60S ribosomal protein L9 RL9 2,33 3,67 4,67 0,13
C-1-tetrahydrofolate synthase, cytoplasmic C1TC 0,67 1,00 2,67 0,13
Chloride intracellular channel protein 1 CLIC1 1,00 3,33 2,67 0,13
Vinculin OS=Rattus norvegicus VINC 69,67 74,67 87,00 0,13
60S ribosomal protein L30 RL30 1,67 2,67 5,00 0,13
NADH dehydrogenase [ubiquinone] 1 alpha subcomplex subunit 7 NDUA7 1,00 3,00 2,33 0,13
Profilin-1 PROF1 6,67 5,00 11,00 0,14
Tubulin beta-4B chain TBB4B 79,67 83,00 93,67 0,14
14-3-3 protein eta 1433F 4,33 7,67 7,33 0,14
Alpha-soluble NSF attachment protein SNAA 0,67 2,00 0,33 0,14
Hexokinase-1 HXK1 33,67 42,00 49,00 0,14
PDZ and LIM domain protein 5 PDLI5 25,00 33,67 15,33 0,14
NADH dehydrogenase [ubiquinone] 1 alpha subcomplex subunit 4 NDUA4 5,00 6,00 6,67 0,14
Myosin-10 MYH10 12,00 23,67 16,67 0,14
Proliferation-associated protein 2G4 PA2G4 2,67 4,67 6,67 0,15
Mitochondrial 2-oxoglutarate/malate carrier protein M2OM 0,33 2,00 0,00 0,15
Hsp90 co-chaperone Cdc37 CDC37 0,33 1,67 0,00 0,15
Heterogeneous nuclear ribonucleoproteins A2/B1 ROA2 4,67 8,67 10,00 0,15
Aconitate hydratase, mitochondrial ACON 113,33 104,00 125,67 0,15
Importin subunit beta-1 IMB1 16,00 17,67 13,00 0,15
Brain protein 44 BR44 0,33 2,33 3,33 0,15
Fatty aldehyde dehydrogenase AL3A2 3,33 2,33 1,67 0,15
40S ribosomal protein S4, X isoform RS4X 6,00 8,67 10,67 0,15
Annexin A2 ANXA2 19,33 17,00 12,67 0,15
Monocarboxylate transporter 1 MOT1 5,67 7,67 8,67 0,15
26S proteasome non-ATPase regulatory subunit 11 PSD11 3,67 3,67 7,67 0,15
pre-miR-
21*
ANOVA Test
(P-Value)Proteins
Accession
Number
scr pre-
miR
pre-miR-
21
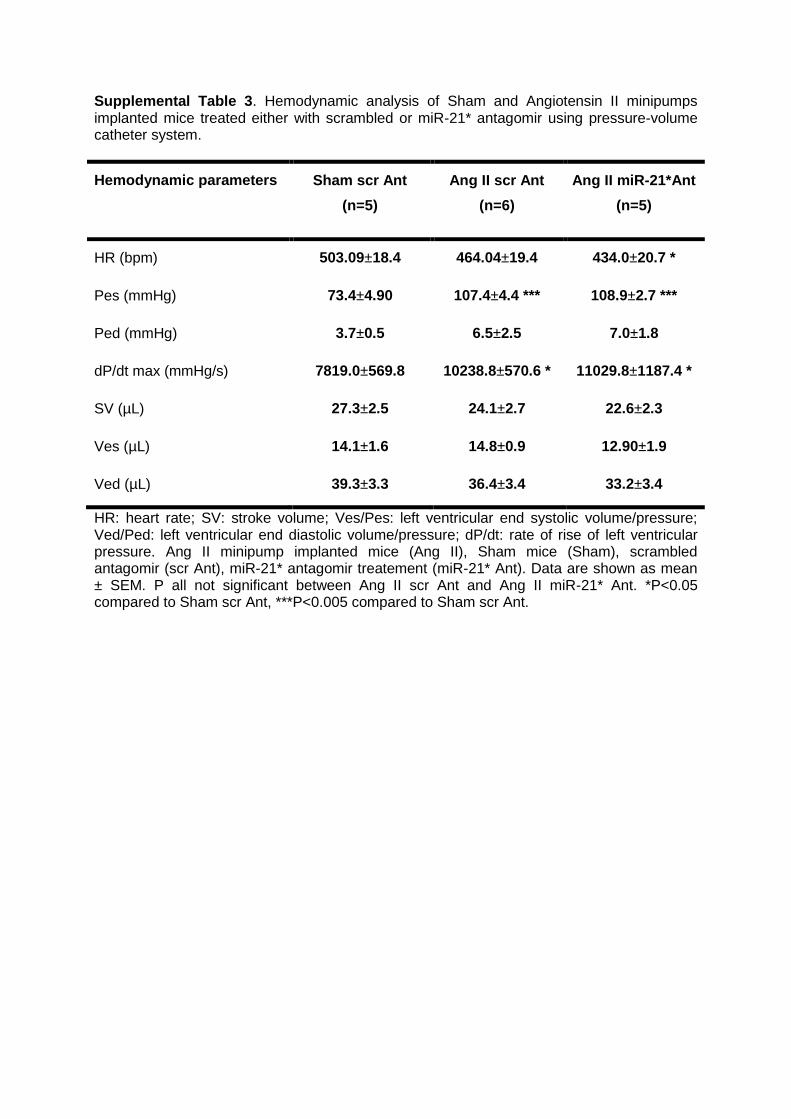
Supplemental Table 3. Hemodynamic analysis of Sham and Angiotensin II minipumps implanted mice treated either with scrambled or miR-21* antagomir using pressure-volume catheter system.
Hemodynamic parameters Sham scr Ant
(n=5)
Ang II scr Ant
(n=6)
Ang II miR-21*Ant
(n=5)
HR (bpm) 503.09±18.4 464.04±19.4 434.0±20.7 *
Pes (mmHg) 73.4±4.90 107.4±4.4 *** 108.9±2.7 ***
Ped (mmHg) 3.7±0.5 6.5±2.5 7.0±1.8
dP/dt max (mmHg/s) 7819.0±569.8 10238.8±570.6 * 11029.8±1187.4 *
SV (µL) 27.3±2.5 24.1±2.7 22.6±2.3
Ves (µL) 14.1±1.6 14.8±0.9 12.90±1.9
Ved (µL) 39.3±3.3 36.4±3.4 33.2±3.4
HR: heart rate; SV: stroke volume; Ves/Pes: left ventricular end systolic volume/pressure; Ved/Ped: left ventricular end diastolic volume/pressure; dP/dt: rate of rise of left ventricular pressure. Ang II minipump implanted mice (Ang II), Sham mice (Sham), scrambled antagomir (scr Ant), miR-21* antagomir treatement (miR-21* Ant). Data are shown as mean ± SEM. P all not significant between Ang II scr Ant and Ang II miR-21* Ant. *P<0.05 compared to Sham scr Ant, ***P<0.005 compared to Sham scr Ant.
5
Supplemental Methods
Cardiomyocyte preparation
Neonatal rat cardiac fibroblasts and rat cardiomyocytes were isolated from newborn rats as
described (1). Briefly, hearts were removed from newborn rats (day 0), put into calcium- and
bicarbonate-free HEPES buffered Hanks’ medium, cut into pieces and digested with trypsin
(BD Biosciences) and DNAse I (Roche) under constant stirring. Several digestion steps were
performed before the collected primary cells were centrifuged at 700xg for 10 min, passed
through a cell strainer (40 mm), seeded onto uncoated plastic dishes and incubated for 90
min at 37°C. The supernatant (containing the cardiomyocytes) was collected and plated in
MEM (minimal essential medium; Animed) containing vitamin B12, NaHCO3, L-glutamine,
BrdU, Penicillin/Streptomycin and 5% Fetal Bovine Serum (FBS; Invitrogen). The attached
primary rat cardiac fibroblasts were cultured in Dulbecco’s modified Eagle’s medium (DMEM;
PAA) supplemented with 10% FBS and 1% Penicillin/Streptomycin at 37°C in 5% CO2.
Immunohistology and protein expression analyses assured highest purity of cell cultures.
Transfection of cells
Cells were transfected with small inhibitory RNAs (siRNAs) or specific miRNAs by a
liposomal-based method (Lipofectamine™2000, Invitrogen) according to the manufacturers'
instructions. Briefly, specific miRNA or siRNA was mixed separately and incubated for 5 min
with Opti-MEM I media (Invitrogen) (complex 1). In a parallel step Lipofectamine™2000 was
mixed and incubated for 5 min with Opti-MEM I media (complex 2). Complex 1 and complex
2 were mixed and incubated for 20 min. Cells were incubated for 4 h with the transfection
complex before it was discarded and replaced by fresh media. If not otherwise stated protein
lysates were prepared or RNA was isolated after 72 h. Details about the used miRNAs are
found in Supplemental Table 4; details about the used siRNAs are shown in Supplemental
Table 5.
Cells were transfected either with pre-miR™ miRNA Precursor Molecules or anti-miR miRNA
Inhibitors from Ambion. Detailed information about the design and chemical modification of
6
the pre-miRNA and anti-miRNA molecules are provided on the Life Technology website. Pre-
miR™ miRNA precursor molecules are small, chemically modified (2'OMe) double-stranded
RNA molecules designed to mimic endogenous mature miRNAs. Pre-miR miRNA Precursor
Molecules are designed and modified to ensure that the correct strand, representing the
desired mature miRNA, is taken up into the RNA-induced silencing-like complex responsible
for miRNA activity whereas the other strand is inactivated and is degraded. Pre-miR miRNA
Precursors are not hairpin constructs and should not be confused with pre-miRNAs.
Ambion® Anti-miR™ miRNA Inhibitors are chemically modified (2'OMe), single stranded
nucleic acids designed to specifically bind to and inhibit endogenous microRNA (miRNA)
molecules.
For rescue assays, cardiomyocytes were either transfected with scrambled anti-miRNA, anti-
miRNA-21 or anti-miR-21* as described above. Cells were incubated for 4 h with the
transfection complex before it was discarded and replaced by fresh media (containing
1%FBS). Cardiomyocytes were stimulated with the pro-hypertrophic agent angiotensin II (1
nm) for 72 h by adding it directly to the media. Control represents incubation with normal
media but no addition of angiotensin II. Cardiomyocytes were stained with alpha-actinin and
cell size was measured. Cell surface area was analyzed from digitally recorded images using
the AxioVision (Zeiss) software packages.
RNA isolation
Total RNA from cells, exosomes and pericardial fluid was isolated using TriFast (Peqlab)
according to the manufacturer’s protocol with minor modifications. For RNA isolation of
exosomes and from pericardial fluid a mixture of “spike in” RNAs from C. elegans (5fmol)
was added before the chloroform step. Further, 1-2 µl glycogen (Roche) was added to the
isopropanol precipitation step to increase the RNA yield. Before RNA isolation, exosomes
were pre-treated with 0.4 µg/µl RNaseA (Roth) for 30 min at 37°C to eliminate intact
exosomes and to assure that isolated small RNAs are derived from inside of the exosomes.
The concentration and quality of the isolated RNA was analyzed in a Synergy HT (Biotek).
7
The Agilent 2100 Analyzer (Agilent) was used to detect the RNA profiles of small and total
RNAs in exosomes and cells.
Quantitative Real Time-PCR (qRT-PCR)
To analyze the expression of specific miRNAs in exosomes the QuantiMir™ RT Kit from
System Biosciences (SBI) was used. All small, non-coding RNAs were converted into cDNA
starting from total RNA samples. A poly-A tail was added to the 3‘ end of small non-coding
RNAs. In the presence of poly-A polymerase and by using an oligo-dT adaptor primer the
reverse transcription into cDNA was initiated. The ready-to-use cDNA serves as a template
for quantitative real time-PCR (qRT-PCR) with a 3’ universal reverse primer, 2x SYBR Green
and a specific miRNA assay primer. Two 384-well qRT-PCR primer plates containing 388 rat
individual microRNA primers and 3 endogenous reference RNA controls (rno-U6, RNU43 &
U1) are included on each plate.
Quantification of mature miRNAs was performed by qRT-PCR using specific TaqMan miRNA
assays according to the manufacturer’s protocol (Applied Biosystems). Reverse transcription
of RNA was performed using TaqMan MicroRNA Reverse Transcription Kit (Applied
Biosystems). For qRT-PCR analysis the samples were pre-diluted 1:3 with nuclease-free
water and for each miRNA a standard curve was generated (1:1, 1:5, 1:25, 1:125) using 2µl
cDNA as template for qRT-PCR. The small RNA molecule sno202 (for mouse) or sno (for rat)
was used as endogenous control in cells. The expression of miRNAs in exosomes and
pericardial fluid was normalized to the expression of a “spike in” RNA from C. elegans.
Details about the specific miRNA assays used for TaqMan qRT-PCR are to be found in
Supplemental Table 6.
Western Blotting
Total proteins were extracted as described by Buitrago et al. (2) Western Blot was
performed with 7-15 µg of total protein. Protein was separated on polyacrylamide gels,
before blotting onto polyvinylidene fluoride membranes over night at 4°C. The membrane
8
was blocked with 5% milk powder in TBS-Tween for 1h and incubated with primary
antibodies at 4°C over night (Specific primary antibodies used for Western blotting are to be
found in Supplemental Table 7). The membrane was washed 3x 5 min in TBS-Tween and
incubated with a secondary antibody conjugated to horseradish peroxidase for 1 h and
subjected to enhanced chemiluminescence.
Stimulation of primary rat cardiac fibroblasts with angiotensin II
Primary rat cardiac fibroblasts were grown to a confluence of 80%. The cells were starved for
24 h in DMEM containing 0.1% pre-depleted FBS before they were stimulated with 1nM
angiotensin II and 4ng/ml IL-1β in DMEM + 0.1% pre-depleted FBS for 24 h. The conditioned
media of rat cardiac fibroblasts were collected and used for exosome purification by
differential ultracentrifugation. As control, cells were cultured in DMEM + 0.1% pre-depleted
FBS adding PBS and 0.1% BSA/water. miRNA expression levels of fibroblast-derived
exosomes were analyzed using the QuantiMir™ RT Kit from System Biosciences (SBI).
Treatment of rat cardiac fibroblasts with nSmase 2 inhibitor (GW4869)
Primary rat cardiac fibroblasts were treated with 10 µM nSmase 2 inhibitor (GW4869, Sigma)
in DMEM containing 10% FCS for 24 h. Thereafter medium was changed to DMEM
containing 0.1% pre-exosome-depleted FBS + 10 µM nSmase 2 inhibitor. Conditioned media
of control and treated fibroblasts were collected for 24 h and exosomes were purified by
differential ultracentrifugation. As control, cells were treated with DMSO in the same
concentration as the inhibitor. miRNA expression levels of fibroblast-derived exosomes were
analyzed using the QuantiMir™ RT Kit from System Biosciences (SBI). Further, rat cardiac
fibroblasts treated with the nSmase 2 inhibitor or a control were fixed in 4% PFA for
immunofluorescence staining.
9
Immunofluorescence staining
Primary rat cardiac fibroblasts or cardiomyocytes were grown/seeded on 24-well plates to a
confluence of 70%. Cells were washed twice with PBS, fixed with 4% paraformaldehyde
(PFA) for 15 min, washed twice with PBS and permeabilized with 0.1% Triton X-100 for 10
min. Thereafter, cells were washed with PBS and blocked with donkey serum for 30 min,
washed again and incubated with a primary antibody in PBS + 5% donkey serum over night.
The second day, cells were washed with PBS and incubated with Alexa-conjugated
secondary antibodies (1:500) and DAPI (1:1000) for 30 min in PBS + 5% donkey serum.
Cells were washed twice with PBS and embedded with Prolong Antifade (Invitrogen). Cell
membranes of cells were stained using Wheat germ Agglutinin Alexa Fluor 488 (Invitrogen).
Phalloidin-TRITC (Sigma) was used to stain F-actin structures in the cytoplasm of cells.
Fluorescence confocal microscopy
For immunofluorescence confocal microscopy, cardiomyocytes were grown on glass
coverslips coated with 0.1% gelatine and cultured in supplemented medium. The labeled
exosomes (7.5 µg) were added to cardiomyocytes (100.000 cells) and incubated for the
appropriated time points at 37°C. To study the influence of temperature, labeled exosomes
were cultured with cardiomyocytes for 2 h at 4°C. To investigate if the cytoskeleton is
involved in exosome uptake, cardiomyocytes were treated with an inhibitor of actin
polymerization (0.5 µM Cytochalasin D) for 30 min following incubation of labeled exosomes
for 2 h. For immunofluorescence staining, cells were fixed in 4% PFA and stained with
respective antibodies as described above. The uptake of labeled exosomes by
cardiomyocytes was visualized by confocal microscopy. Confocal imaging was prepared with
a Zeiss LSM 780 using a Plan-Apochromat 63x/1.40 Oil immersion objective. In all cases z-
stacks were taken covering the entire cell volume. Further technical details in brief: lasers:
405 nm / 30mW diode laser @ 1%, 488 nm Ar+-Laser 25 mW @ 6%, 561nm DPSS laser,
50mW @ 1%, Main beam splitters: MBS405 & MBS488/561, 16bit mode, detector gain 600 –
650, Pinhole 1AU, voxel distances according to Nyquist criteria, acquisition protocol: online
10
fingerprinting mode and lambda mode. For fluorescence signal unmixing single color stains
were acquired under identical conditions like in the multicolor stain experiments.
Internalization of labeled exosomes by cardiomyocytes was quantified based on their
fluorescence intensity using Imaris Software (version 6.0).
Co-culture assay
Co-cultivation of rat cardiac fibroblasts and cardiomyocytes was investigated in 24-well plate
Boyden chambers. Cardiac fibroblasts were seeded onto the 0.4 µm inserts which allow
transport of exosomes but no cell compartments. In parallel, cardiomyocytes were seeded in
the lower well of the 24-well Boyden plate and cultured in MEM media +5% FBS 24 h before
the co-culture experiment. Cardiac fibroblasts were transfected separately with specific
miRNA or control miRNA as described. The transfection media was removed after 4 h and
fresh media was added to the fibroblasts. The inserts were placed onto the 24-well Boyden
plate with cardiomyocytes in the lower chamber. After 72 h the inserts were removed and
cardiomyocytes were washed and lysed with Trifast for RNA isolation. The miRNA
expression in cardiomyocytes was measured as mentioned in qRT-PCR.
To visualize the transport of miRNAs from cardiac fibroblasts to cardiomyocytes, cells were
transfected with a Cy3-labeled miRNA or a respective control miRNA. After 24 h of co-
culturing the inserts were removed and cardiomyocytes were fixed with 4% PFA.
Cardiomyocytes were stained with alpha-actinin and confocal microscopy analysis was
performed.
Electron microscopy
Cell suspension of rat cardiac fibroblasts was spun down by 10000 rpm and fixed by
immersion in fixation solution composed of 1.5% glutaraldehyde (Agar Scientific Limited.,
Essex, UK) and 1.5% formaldehyde freshly prepared from depolymerized paraformaldehyde
(PFA) (Merck Chemicals, Darmstadt, Germany) in 0.15 M HEPES buffer (Sigma-Aldrich,
Hamburg, Germany, total osmolarity of 800 mosmol/l and a vehicle osmolality of 300
11
mosm/kg at pH 7.35) for at least 3 h. During each of the following steps of processing, the
suspensions were centrifuged at 10000 rpm for 5 min. After repeated rinsing in 0.15M
HEPES buffer and in 0.1 mmol/l cacodylate buffer (Plano, Wetzlar, Germany), the
suspensions were postfixed in 1% osmium tetroxide (Plano, Wetzlar, Germany) in 0.1 M
cacodylate buffer. After a rinsing in 0.1 M cacodylate buffer (2 x 5 min) and twice rinsing in
distilled water, specimens were stained and blocked overnight (12-18 h) with a mixture of
equal portions of uranyl-acetate and water (half-saturated aqueous uranyl acetate solution
(1:1)) (Agar Scientific LTD., Stansted, Essex, UK) at 4-8°C. Cell suspensions were then
dehydrated in an ascending series of acetone (J. T. Baker, Deventer, Netherlands) (70%,
90%, 100%) and embedded in epon (SERVA Feinbiochemica GmbH & Co). Ultra-thin
sections (70 nm) were cut by an ultra microtome (Reichert Ultracut S, München Germany),
collected on nickel grids (Plano, Wetzlar, Germany) and stained with lead citrate (Merck,
Darmstadt, Germany) and uranyl acetate.
Exosome pellets purified from neonatal rat cardiac fibroblasts were used for electron
microscopic analysis as described previously (3). Briefly, exosome pellets purified by
ultracentrifugation were resuspended in 2% PFA and loaded onto formvar carbon-coated
grids and dried for 20 min at 40°C. The exosome-loaded grids were washed in PBS and
post-fixed in 1% glutaraldehyde (Agar Scientific Limited., Essex, UK) and subsequently
rinsed in distilled water several times. The grids were transferred to 4% uranyl-oxalate
solution and stained for 5 min and finally embedded in a mixture of uranyl acetate (4%) and
methyl cellulose (2%) on ice. To remove excess fluid the grids were deposited on filter paper
and dried for 10 minutes before they were stored in a grid storage box.
Ultra-thin sections of cardiac fibroblasts and whole mounted exosomes were examined with
an electron microscope (Morgagni 268, FEI, Eindhoven, NL). Micrographs of representative
areas were taken by a digital camera (Veleta TEM camera, Olympus Europa Holding
GMBH).
12
Flow cytometry of exosomes
Fibroblast-derived exosomes were coupled to 4 µm diameter latex aldehyde/sulfate beads
(Invitrogen) because their diameter is too small for the detection range of the flow cytometer
(3). The latex beads (8µl) were incubated with purified exosomes (10µg) overnight at 4°C on
a rotator wheel. The next day, the bead-exosome complex was mixed with 1M glycine to
block remaining free binding sites on the beads and was washed several times in 0.5%
BSA/PBS. To detect CD63, 100 µl of the bead-exosome complex was incubated with mouse
anti-rat CD63 antibody (1 µg; BD Biosciences) for 30 min at 4°C following incubation with
200 µl biotin rat anti-mouse IgG1 (0.5 µg; BD Biosciences) and fluorescein-isothiocyanate
(FITC)-conjugated Streptavidin (1 µg; BD Biosciences) diluted in 0.5% BSA/PBS for 30 min
at 4°C. The samples were analyzed by FACS (Millipore, guava easycyte™ Flow Cytometer)
and quantified using FlowJo Software.
Incubation of cardiomyocytes with transfected fibroblast-derived exosomes or
fibroblast supernatant
Fibroblast-derived exosomes were purified from the conditioned media of rat cardiac
fibroblasts transfected with a control precursor miRNA (scr) or miR-21* precursor (pre-21*).
The transfected exosomes were cultured with cardiomyocytes for 72 h and cell size was
measured or Sorbs2 and Pdlim5 mRNA expression was determined.
Further, cardiomyocytes were incubated with rat fibroblast (rFb) conditioned medium
containing exosomes (+exo) (in a ratio 1:3 cardiomyocyte media + rFb supernatant) or with
rFb conditioned medium depleted of exosomes (-exo) by ultracentrifugation. As control,
cardiomyocytes were treated with rFb medium (DMEM + 1% FBS). For cell size
measurements, cardiomyocytes were fixed in 4% PFA and stained with alpha-actinin.
Proteome profiling of transfected cardiomyocytes
Neonatal cardiomyocytes were either transfected with a control precursor miRNA, a
precursor of miR-21 or a precursor of miR-21* for 72 h. Cardiomyocyte pellets (n=3 for each
13
group) were mixed with 2x sample buffer (Invitrogen) and heated at 97°C for 5 min. The
proteins were separated on 4%-12% Bis-Tris gel and stained using a PlusOne silver staining
kit (GE Healthcare) (4). Each lane was diced into 10 gel pieces and digested with trypsin
(Promega) (5, 6) on an Investigator ProGest digestion robot (DIGILab). Tryptic peptides were
separated on a nano-flow HPLC system (RSLC 3000, PepMap100 C18 column, 25-cm
length, 75-µm internal diameter, 3-µm particle size, Thermo Fisher Scientific) and eluted with
a 40 min gradient (10-25% B in 35 min, 25-40% B in 5 min, 90% B for 10 min and 2% B for
30min where A=0.1% formic acid in HPLC H2O and B = 80% ACN, 0.1% formic acid in HPLC
H2O). The eluted peptides were directly analyzed by a high mass accuracy tandem mass
spectrometer (LTQ Orbitrap XL, Thermo Fisher Scientific) using full MS scan mode over the
range of m/z 400-1600. MS/MS was performed on the 6 most abundant ions in each MS
scan with dynamic exclusion (7). Raw files were searched against a rodent database
(UniProt/Swiss-Prot 2012_03, 25897 entries) using Mascot 2.3.01 (Matrix sciences) (8).
Carboxyamidomethylation of cysteine was chosen as fixed modification and oxidation of
methionine as variable modification. The mass tolerance was set at 10ppm for the precursor
ions and at 0.8 Da for fragment ions. Two missed cleavages were allowed. Scaffold (version
3.6.5, Proteome Software) was used to calculate the spectral counts and to validate MS/MS
based peptide and protein identifications. The following peptide thresholds were applied:
peptide probability > 95.0%, protein probability > 99.0% with at least 2 unique peptides (9,
10).
Luciferase Reporter Assay
SORBS2 3’UTR (1261 bp) harbouring two potential binding sites for miR-21* was cloned into
SpeI and HindIII cloning site of pMIR-REPORT vector (Ambion). The resulting construct (20
ng) was co-transfected with scr-miR or miR-21* (each 100 nM) and 20 ng of β-galactosidase
control plasmid (Promega) into 48 well-plated HEK293 reporter cells by the use of
Lipofectamine 2000 (Invitrogen). Cells were incubated for 24 h before detecting luciferase
and β-galactosidase activity applying different substrates (Promega).
14
Ago2 immunoprecipitation
Briefly, 10*106 human cardiac fibroblasts (HCFs) were used for Argonaute 2 (Ago2)
immunoprecipitation. Cell lysates were subjected to incubation with dynabeads (Invitrogen)
coated with 5-10 µg of control IgG (Cell Signaling) or Ago2 IgG (Chromotek). After pulldown,
magnetic dynabeads were separated for western blot analysis and Trifast-based (Peqlab)
RNA isolation procedure. Isolated RNA underwent qPCR analysis to determine miR-21*
enrichment in the Ago2 fraction.
miR-21* in situ PCR
Sections (4 µm in thickness) from 4% PFA-fixed and paraffin-embedded heart tissue were
cooked in citrate buffer and treated with DNase I (Roche) after deparaffinization. After DNase
digestion, the tissue section was covered with the miRNA PCR solution consisted of miR-21*
primers (RT: 5’- GTCGTATCCAGTGCAGGGTCCGAGGTATTCGCACTGGATACGAC
GACAGC; forward: 5’- CGCAACAGCAGTCGATG; reverse: 5’- GTGCAGGGTCCGAGGT),
digoxigenin dUTP (Roche), RNase inhibitor (Roche) and SuperScript One-Step RT-PCR
System with Platinum Taq DNA Polymerase (life technology). The corresponding primer for
cel-miR-39 was used as negative control. cDNA synthesis was performed by incubating
slides for 30 min at 55°C. Then cDNA was amplified after denaturing at 94°C for 4 min with
26 cycles at 94°C denaturation (15 s), 56°C annealing (30 s) and 72°C extension (20 s)
followed with final extension at 72°C for 5 min. The digoxigenin-labelled miRNA cDNA was
detected with a digoxigenin antibody (Roche).
Collecting pericardial fluid from mice
Animal studies were performed according to the relevant guidelines and regulations of the
responsible authorities. TAC surgery was performed on male C57BL/6 mice (10–12 weeks
old) from Charles River Laboratories as described (11). To collect pericardial fluid from 4
week old Sham and TAC-operated mice the pericardium was incised and carefully washed
with 350 µl PBS. To remove blood cells, the diluted fluid was centrifuged at 7800xg for 5 min.
15
For RNA isolation, 150 µl pericardial fluid was used. A “spike in” RNA from C. elegans
(5fmol) was added during RNA isolation to normalize the miRNA expression.
Antagomir treatment
The miR-21* Antagomir was designed and provided by Integrated DNA Technology (IDT,
Belgium). The oligonucleotide was fully methylated and had a 3’ Cholesterol modification as
well as phosphorothiorates at certain position (indicated by asterisks). The 3’ Cholesterol
modification improves cell uptake of the oligonucleotide. The phosphorothioate are added to
antisense oligos to protect them from nuclease degradation. Methyl-modifications increase
both nuclease stability and affinity (Tm) of the antisense oligo to the target mRNA.
Antagomirs were diluted in nuclease-free water and 100 µl at concentrations of 80 mg/kg
were applied to mice via retroorbital injection.
Hemodynamic measurements
Cardiac function was assessed in anesthetized (2% isoflurane) and artificially ventilated
(MiniVent respirator Harvard Apparatus, Holliston, MA) mice using a 1F microtip pressure-
volume catheter (PVR 1045; Millar Instruments, Houston, TX) coupled with a Powerlab/4SP
acquisition system (AD Instruments Ltd, Oxford, UK), as previously described (12, 13)
(Nature Protocols 2008, Diabetes 2012). Beat-by-beat P-V loop data were analyzed using
Labchart 7 AD Instruments Ltd, Oxford, UK) and LV endsystolic and enddiastolic pressure
and volume (Pes, Ped, Ves, Ved), stroke volume (SV), maximal and minimal slope of the
systolic pressure increment (+/-dP/dt), ejection fraction (EF), cardiac output (CO), heart rate
(HR) were computed. All hemodynamic parameters were calculated and corrected
according to in vitro and in vivo volume calibrations.
16
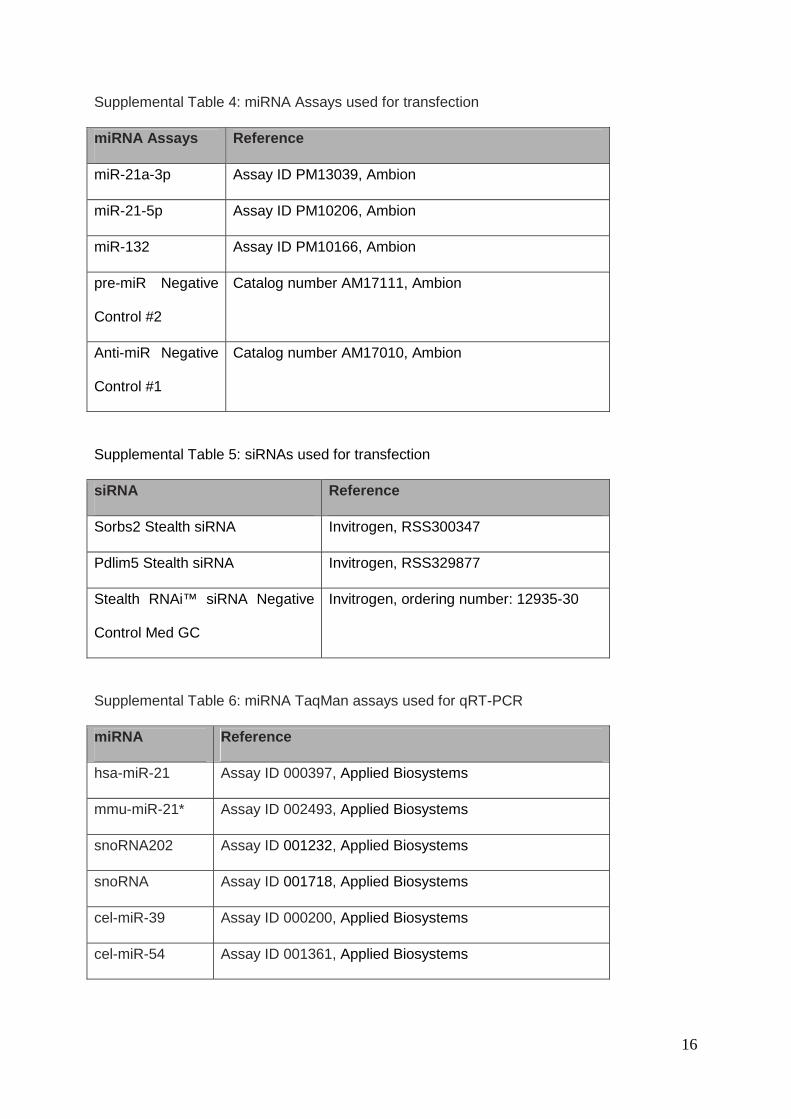
Supplemental Table 4: miRNA Assays used for transfection
miRNA Assays Reference
miR-21a-3p Assay ID PM13039, Ambion
miR-21-5p Assay ID PM10206, Ambion
miR-132 Assay ID PM10166, Ambion
pre-miR Negative
Control #2
Catalog number AM17111, Ambion
Anti-miR Negative
Control #1
Catalog number AM17010, Ambion
Supplemental Table 5: siRNAs used for transfection
siRNA Reference
Sorbs2 Stealth siRNA Invitrogen, RSS300347
Pdlim5 Stealth siRNA Invitrogen, RSS329877
Stealth RNAi™ siRNA Negative
Control Med GC
Invitrogen, ordering number: 12935-30
Supplemental Table 6: miRNA TaqMan assays used for qRT-PCR
miRNA Reference
hsa-miR-21 Assay ID 000397, Applied Biosystems
mmu-miR-21* Assay ID 002493, Applied Biosystems
snoRNA202 Assay ID 001232, Applied Biosystems
snoRNA Assay ID 001718, Applied Biosystems
cel-miR-39 Assay ID 000200, Applied Biosystems
cel-miR-54 Assay ID 001361, Applied Biosystems
17
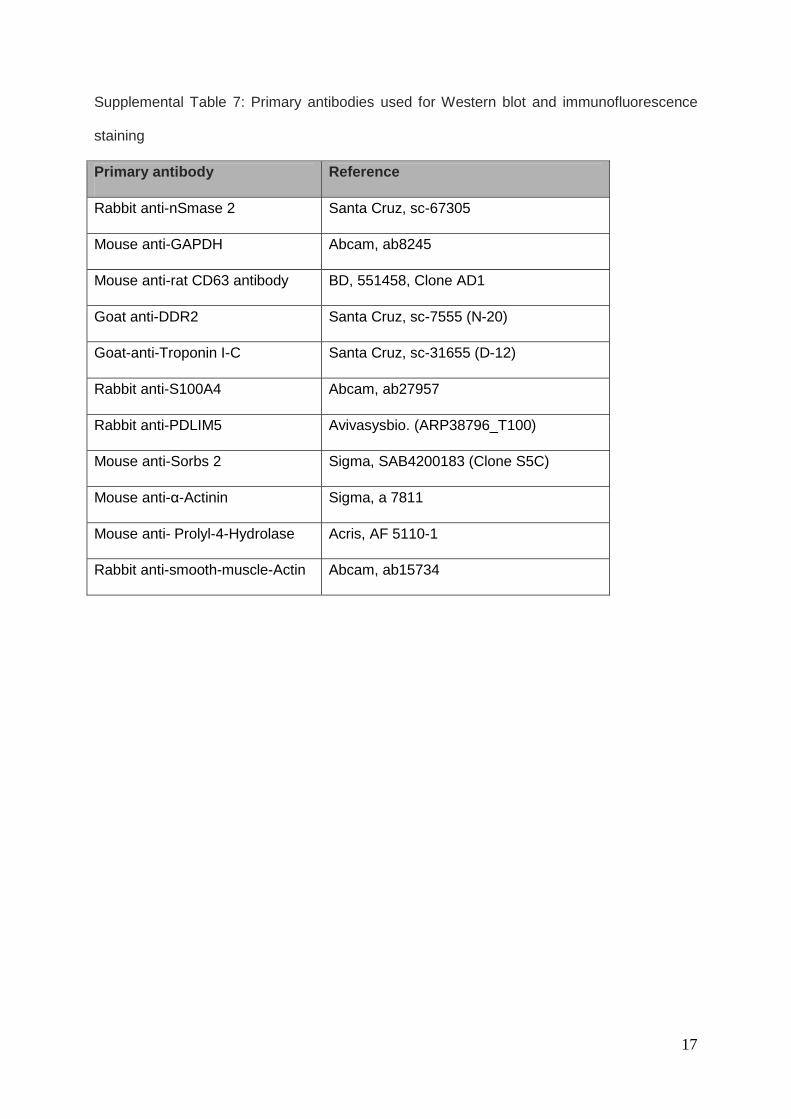
Supplemental Table 7: Primary antibodies used for Western blot and immunofluorescence
staining
Primary antibody Reference
Rabbit anti-nSmase 2 Santa Cruz, sc-67305
Mouse anti-GAPDH Abcam, ab8245
Mouse anti-rat CD63 antibody BD, 551458, Clone AD1
Goat anti-DDR2 Santa Cruz, sc-7555 (N-20)
Goat-anti-Troponin I-C Santa Cruz, sc-31655 (D-12)
Rabbit anti-S100A4 Abcam, ab27957
Rabbit anti-PDLIM5 Avivasysbio. (ARP38796_T100)
Mouse anti-Sorbs 2 Sigma, SAB4200183 (Clone S5C)
Mouse anti-α-Actinin Sigma, a 7811
Mouse anti- Prolyl-4-Hydrolase Acris, AF 5110-1
Rabbit anti-smooth-muscle-Actin Abcam, ab15734
18
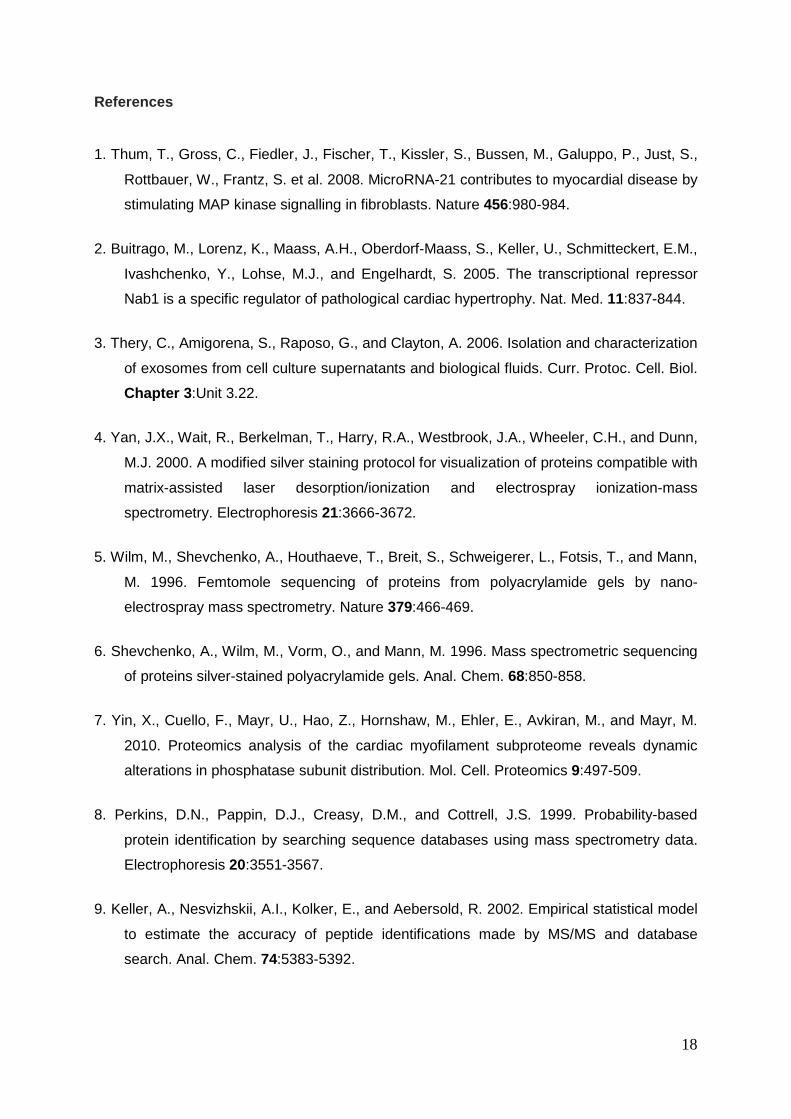
References
1. Thum, T., Gross, C., Fiedler, J., Fischer, T., Kissler, S., Bussen, M., Galuppo, P., Just, S.,
Rottbauer, W., Frantz, S. et al. 2008. MicroRNA-21 contributes to myocardial disease by
stimulating MAP kinase signalling in fibroblasts. Nature 456:980-984.
2. Buitrago, M., Lorenz, K., Maass, A.H., Oberdorf-Maass, S., Keller, U., Schmitteckert, E.M.,
Ivashchenko, Y., Lohse, M.J., and Engelhardt, S. 2005. The transcriptional repressor
Nab1 is a specific regulator of pathological cardiac hypertrophy. Nat. Med. 11:837-844.
3. Thery, C., Amigorena, S., Raposo, G., and Clayton, A. 2006. Isolation and characterization
of exosomes from cell culture supernatants and biological fluids. Curr. Protoc. Cell. Biol.
Chapter 3:Unit 3.22.
4. Yan, J.X., Wait, R., Berkelman, T., Harry, R.A., Westbrook, J.A., Wheeler, C.H., and Dunn,
M.J. 2000. A modified silver staining protocol for visualization of proteins compatible with
matrix-assisted laser desorption/ionization and electrospray ionization-mass
spectrometry. Electrophoresis 21:3666-3672.
5. Wilm, M., Shevchenko, A., Houthaeve, T., Breit, S., Schweigerer, L., Fotsis, T., and Mann,
M. 1996. Femtomole sequencing of proteins from polyacrylamide gels by nano-
electrospray mass spectrometry. Nature 379:466-469.
6. Shevchenko, A., Wilm, M., Vorm, O., and Mann, M. 1996. Mass spectrometric sequencing
of proteins silver-stained polyacrylamide gels. Anal. Chem. 68:850-858.
7. Yin, X., Cuello, F., Mayr, U., Hao, Z., Hornshaw, M., Ehler, E., Avkiran, M., and Mayr, M.
2010. Proteomics analysis of the cardiac myofilament subproteome reveals dynamic
alterations in phosphatase subunit distribution. Mol. Cell. Proteomics 9:497-509.
8. Perkins, D.N., Pappin, D.J., Creasy, D.M., and Cottrell, J.S. 1999. Probability-based
protein identification by searching sequence databases using mass spectrometry data.
Electrophoresis 20:3551-3567.
9. Keller, A., Nesvizhskii, A.I., Kolker, E., and Aebersold, R. 2002. Empirical statistical model
to estimate the accuracy of peptide identifications made by MS/MS and database
search. Anal. Chem. 74:5383-5392.
19
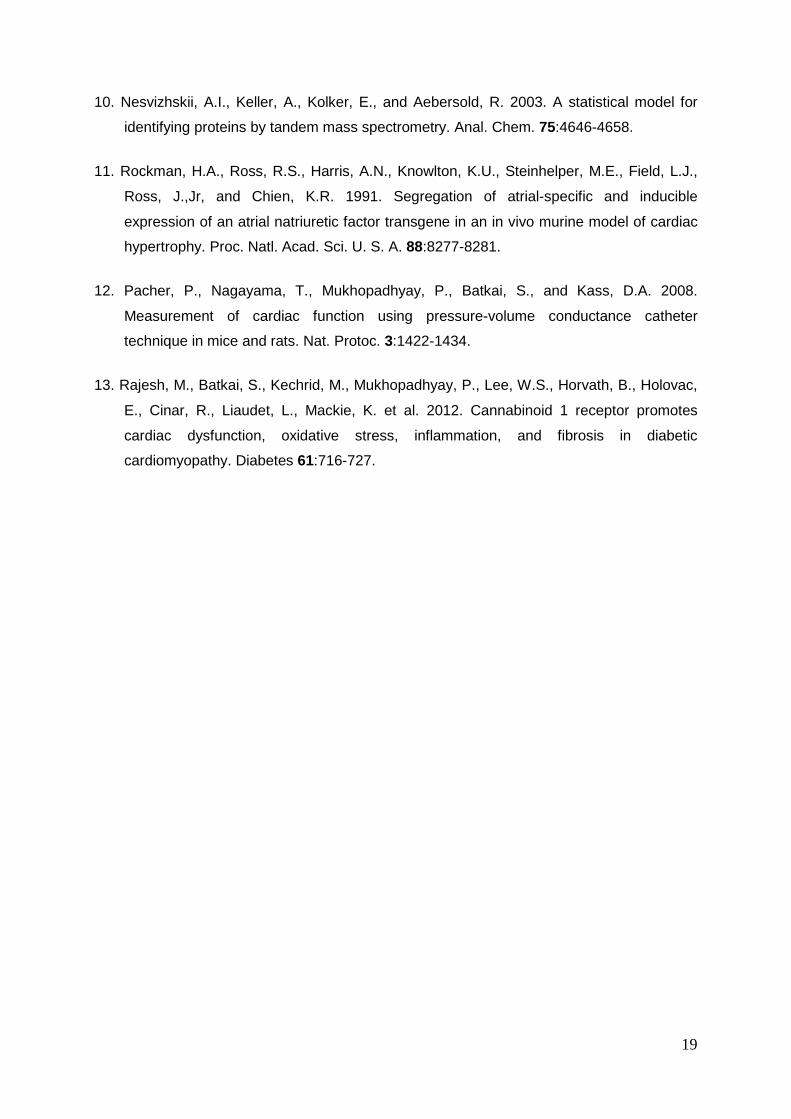
10. Nesvizhskii, A.I., Keller, A., Kolker, E., and Aebersold, R. 2003. A statistical model for
identifying proteins by tandem mass spectrometry. Anal. Chem. 75:4646-4658.
11. Rockman, H.A., Ross, R.S., Harris, A.N., Knowlton, K.U., Steinhelper, M.E., Field, L.J.,
Ross, J.,Jr, and Chien, K.R. 1991. Segregation of atrial-specific and inducible
expression of an atrial natriuretic factor transgene in an in vivo murine model of cardiac
hypertrophy. Proc. Natl. Acad. Sci. U. S. A. 88:8277-8281.
12. Pacher, P., Nagayama, T., Mukhopadhyay, P., Batkai, S., and Kass, D.A. 2008.
Measurement of cardiac function using pressure-volume conductance catheter
technique in mice and rats. Nat. Protoc. 3:1422-1434.
13. Rajesh, M., Batkai, S., Kechrid, M., Mukhopadhyay, P., Lee, W.S., Horvath, B., Holovac,
E., Cinar, R., Liaudet, L., Mackie, K. et al. 2012. Cannabinoid 1 receptor promotes
cardiac dysfunction, oxidative stress, inflammation, and fibrosis in diabetic
cardiomyopathy. Diabetes 61:716-727.

![50 IChO 2018 - pianetachimica.it · oΔG = ΔG + RT lnQ Quoziente di reazione Q Per la reazione a A + b B ⇌ c C + d D: Q = [C]c[D]d [A]a[B]b Variazione di entropia: rev ΔS = q](https://static.fdocument.org/doc/165x107/5c6a38b109d3f2310b8c475f/50-icho-2018-og-g-rt-lnq-quoziente-di-reazione-q-per-la-reazione-a.jpg)


![Geometrie - GVI.cz...vedenou vrcholem C. [v = 13,51 cm; t c = 13,58 cm] 31 GONIOMETRICKÉ FUNKCE V PRAVOÚHLÉM TROJÚHELNÍKU 32 c b c a E D sin sin c a c b E D cos cos 33 a b tg](https://static.fdocument.org/doc/165x107/609923c08b96b278a24f9cfb/geometrie-gvicz-vedenou-vrcholem-c-v-1351-cm-t-c-1358-cm-31-goniometrick.jpg)


![BASIC ELECTRONICS for ARDUINO 03 [Λειτουργία συμβατότητας] · LED c b c e b SW: ΔΙΑΚΟΠΤΗΣ ... ΣΕ ΗΛΕΚΤΡΟΝΙΚΟ ΚΥΚΛΩΜΑ, ΜΑ ΜΕ](https://static.fdocument.org/doc/165x107/5c74306109d3f2ba1a8bc2bd/basic-electronics-for-arduino-03-.jpg)
![Lim et al, Supplemental Figure S1. 01.55.07.0105010015020030040050000 Arsenic Plant height (Cm) As[μM] b/c g f e d c/d a/b a c/d a a/b Cadmium 01.55.07.0105010015020030040050000.](https://static.fdocument.org/doc/165x107/56649da95503460f94a9763a/lim-et-al-supplemental-figure-s1-0155070105010015020030040050000-arsenic.jpg)