
Estrogen receptor alpha (ERα mediated coregulator …...Aziza Hussein Bakheit Adam & Laura H. J. de...
19
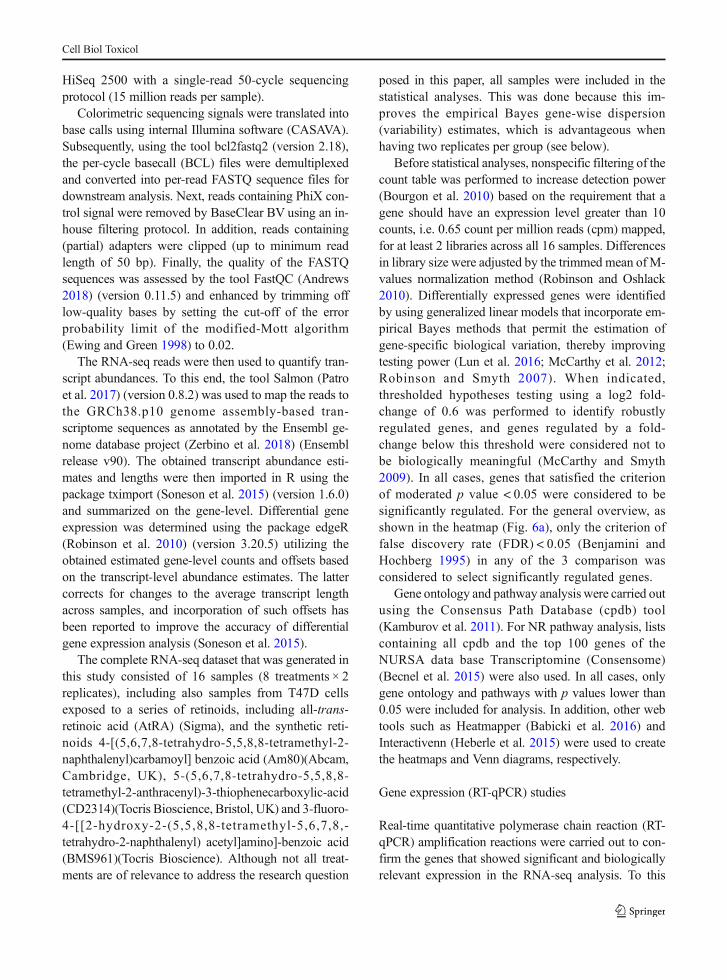
ORIGINAL ARTICLE Estrogen receptor alpha (ERα)–mediated coregulator binding and gene expression discriminates the toxic ERα agonist diethylstilbestrol (DES) from the endogenous ERα agonist 17β-estradiol (E2) Aziza Hussein Bakheit Adam & Laura H. J. de Haan & Ignacio Miro Estruch & Guido J. E. J. Hooiveld & Jochem Louisse & Ivonne M. C. M. Rietjens Received: 1 August 2019 /Accepted: 28 January 2020 # The Author(s) 2020 Abstract Diethylstilbestrol (DES) is a synthetic estro- gen and proven human teratogen and carcinogen report- ed to act via the estrogen receptor α (ERα). Since the endogenous ERα ligand 17β-estradiol (E2) does not show these adverse effects to a similar extent, we hy- pothesized that DES’ interaction with the ERα differs from that of E2. The current study aimed to investigate possible differences between DES and E2 using in vitro assays that detect ERα-mediated effects, including ERα-mediated reporter gene expression, ERα- mediated breast cancer cell (T47D) proliferation and ERα-coregulator interactions and gene expression in T47D cells. Results obtained indicate that DES and E2 activate ERα-mediated reporter gene transcription and T47D cell proliferation in a similar way. However, significant differences between DES- and E2-induced binding of the ERα to 15 coregulator motifs and in transcriptomic signatures obtained in the T47D cells were observed. It is concluded that differences observed in binding of the ERα with several co-repressor motifs, in downregulation of genes involved in histone deacetylation and DNA methylation and in upregulation of CYP26A1 and CYP26B1 contribute to the differen- tial effects reported for DES and E2. Keywords Estrogen receptor alpha . Diethylstilbestrol . 17β-estradiol . Coregulator binding . Transcriptomics Introduction Diethylstilbestrol (DES) is a synthetic estrogen that has been used from the 1940s to the 1970s to prevent premature delivery and fetal death by stimulating the synthesis of estrogen and progesterone in the placenta (IARC 2012). In addition, DES was used in hormonal therapy applied for the treatment of prostate and breast cancer (Giusti et al. 1995; IARC 2012; Reed and Fenton 2013). From 1971 onwards, the use of DES was prohibited since it was shown to induce rare reproduc- tive tract cancers in women exposed in utero, while no protective effect against miscarriage and premature de- livery was actually observed (Titus-Ernstoff et al. 2001). Although DES has been discontinued since 1971, ad- verse health effects have later been discovered in wom- en who had taken DES, as well as in their offspring including even subsequent generations. Adverse effects Cell Biol Toxicol https://doi.org/10.1007/s10565-020-09516-6 Electronic supplementary material The online version of this article (https://doi.org/10.1007/s10565-020-09516-6) contains supplementary material, which is available to authorized users. A. H. B. Adam (*) : L. H. J. de Haan : I. M. Estruch : J. Louisse : I. M. C. M. Rietjens Division of Toxicology, Wageningen University and Research, PO Box 8000, 6700 EA Wageningen, The Netherlands e-mail: [email protected] G. J. E. J. Hooiveld Division of Human Nutrition and Health, Wageningen University and Research, PO Box 17, 6700 AA Wageningen, The Netherlands
Transcript of Estrogen receptor alpha (ERα mediated coregulator …...Aziza Hussein Bakheit Adam & Laura H. J. de...
ORIGINAL ARTICLE
Estrogen receptor alpha (ERα)–mediated coregulatorbinding and gene expression discriminates the toxic ERαagonist diethylstilbestrol (DES) from the endogenous ERαagonist 17β-estradiol (E2)
Aziza Hussein Bakheit Adam &
Laura H. J. de Haan & Ignacio Miro Estruch &
Guido J. E. J. Hooiveld & Jochem Louisse &
Ivonne M. C. M. Rietjens
Received: 1 August 2019 /Accepted: 28 January 2020# The Author(s) 2020
Abstract Diethylstilbestrol (DES) is a synthetic estro-gen and proven human teratogen and carcinogen report-ed to act via the estrogen receptor α (ERα). Since theendogenous ERα ligand 17β-estradiol (E2) does notshow these adverse effects to a similar extent, we hy-pothesized that DES’ interaction with the ERα differsfrom that of E2. The current study aimed to investigatepossible differences between DES and E2 using in vitroassays that detect ERα-mediated effects, includingERα-mediated reporter gene expression, ERα-mediated breast cancer cell (T47D) proliferation andERα-coregulator interactions and gene expression inT47D cells. Results obtained indicate that DES and E2activate ERα-mediated reporter gene transcription andT47D cell proliferation in a similar way. However,significant differences between DES- and E2-inducedbinding of the ERα to 15 coregulator motifs and in
transcriptomic signatures obtained in the T47D cellswere observed. It is concluded that differences observedin binding of the ERα with several co-repressor motifs,in downregulation of genes involved in histonedeacetylation and DNAmethylation and in upregulationof CYP26A1 and CYP26B1 contribute to the differen-tial effects reported for DES and E2.
Keywords Estrogen receptor alpha . Diethylstilbestrol .
17β-estradiol . Coregulator binding . Transcriptomics
Introduction
Diethylstilbestrol (DES) is a synthetic estrogen that hasbeen used from the 1940s to the 1970s to preventpremature delivery and fetal death by stimulating thesynthesis of estrogen and progesterone in the placenta(IARC 2012). In addition, DES was used in hormonaltherapy applied for the treatment of prostate and breastcancer (Giusti et al. 1995; IARC 2012; Reed and Fenton2013). From 1971 onwards, the use of DES wasprohibited since it was shown to induce rare reproduc-tive tract cancers in women exposed in utero, while noprotective effect against miscarriage and premature de-livery was actually observed (Titus-Ernstoff et al. 2001).Although DES has been discontinued since 1971, ad-verse health effects have later been discovered in wom-en who had taken DES, as well as in their offspringincluding even subsequent generations. Adverse effects
Cell Biol Toxicolhttps://doi.org/10.1007/s10565-020-09516-6
Electronic supplementary material The online version of thisarticle (https://doi.org/10.1007/s10565-020-09516-6) containssupplementary material, which is available to authorized users.
A. H. B. Adam (*) : L. H. J. de Haan : I. M. Estruch :J. Louisse : I. M. C. M. RietjensDivision of Toxicology,Wageningen University and Research, POBox 8000, 6700 EAWageningen, The Netherlandse-mail: [email protected]
G. J. E. J. HooiveldDivision of Human Nutrition and Health, Wageningen Universityand Research, PO Box 17, 6700 AAWageningen,The Netherlands
included breast cancer, clear cell adenocarcinoma of thevagina and cervix, abnormalities in the female genitaltract and abnormalities of the male reproductive tract(Colton and Greenberg 1982; Palmer et al. 2006).
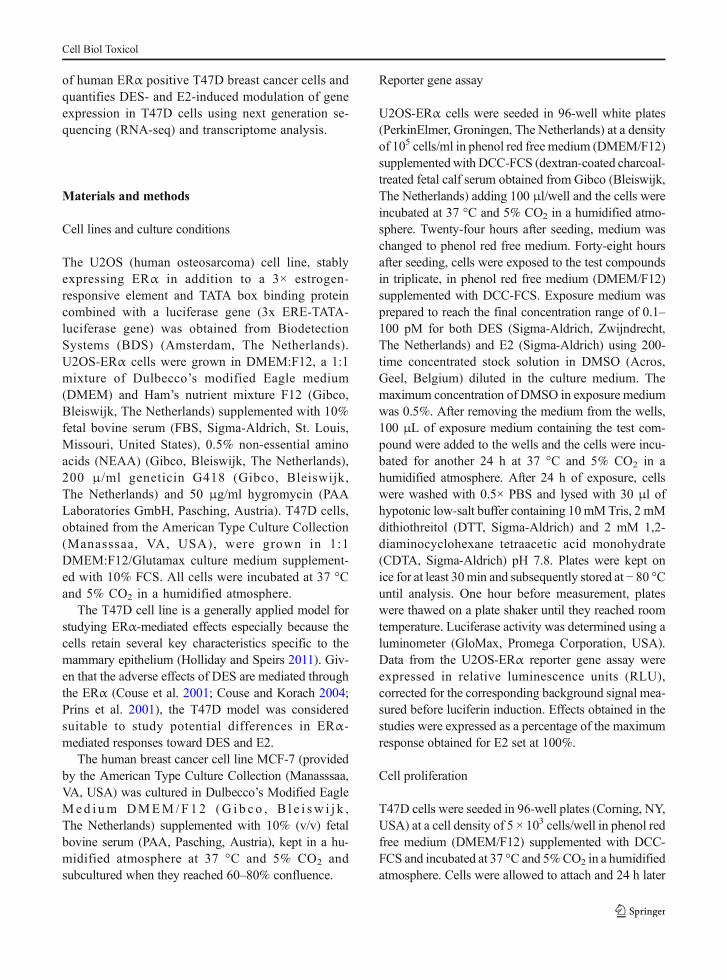
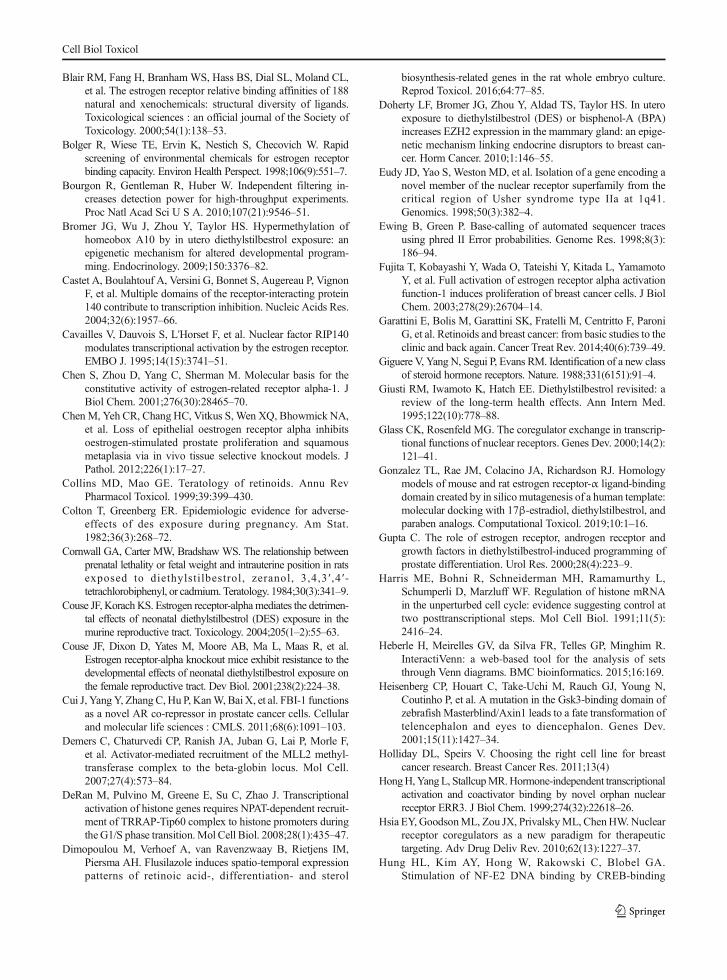
DES is an analogue of the endogenous female sexhormone 17β-estradiol (E2) and binds to both theestrogen receptor α (ERα) and estrogen receptor β(ERβ) (Bolger et al. 1998; Nikov et al. 2001). It hasbeen reported that the molecular dimensions of DESare almost identical to those of E2, particularly withregard to the distance between the terminal hydroxylgroups (Gonzalez et al. 2019) (Fig. 1). Moleculardocking of E2 and DES into the ligand binding do-main of ERα from mouse and rat revealed similarbinding orientations and confirmed a role for thehydroxyl moieties in this interaction (Gonzalezet al. 2019). The ERα agonist action has generallybeen associated with stimulation of cell proliferation,while ERβ activation has been linked with suppres-sion of cell proliferation and stimulation of apoptosis(Sotoca et al. 2008; Thomas and Gustafsson 2011).
The mode of action by which DES causes its adverseeffects has not been unraveled yet. It has been reportedthat the ERα is required in the mediation of the prolif-erative response to DES in uterus and prostate epithelialcells in vivo (Chen et al. 2012; Klotz et al. 2000).Several studies have indicated that a functional ERα isneeded for DES-mediated adverse effects, includingphenotypic changes in the reproductive tract and pro-gressive proliferative lesions and abnormal epithelialcell differentiation in the prostate (Chen et al. 2012).This is apparent from studies in which these DES-induced adverse effects were observed in wild typemice, while the effects were absent in ERα knockoutmice (Couse et al. 2001; Couse and Korach 2004; Prinset al. 2001). These studies suggest that DES elicits itsadverse effects on the reproductive tract through anERα-mediated mechanism. It is of interest to note that
the endogenous ERα agonist E2 does not induce theadverse effects that have been reported for DES to asimilar extent. This points at the possible existence ofessential differences between ERα activation by DESon the one hand and E2 on the other hand. Such differ-ences upon ERα binding may be due to possible differ-ential recruitment of coregulators, including bothcoactivators that interact with receptors and enhancetheir activation, as well as co-repressors that interactwith receptors and decrease their activation (Klinge2000; McKenna et al. 1999).
So far, it has been reported that, in the presence ofDES, the ERα interacts with coregulators NCOA1(Nuclear receptor coactivator 1), NRIP1 (Nuclearreceptor-interacting protein1) and PNRC2 (Proline-rich nuclear receptor coactivator 1), as indicated bybinding to the coregulator motifs NCOA1_677_700,NRIP1_173_195 and PNRC2_118_139, respectively,using the MARCoNI (Microarray Assay for Real-time Coregulator-Nuclear receptor Interaction) tech-nology (Wang et al. 2013). However, no extensivecomparison has been carried out between the ERα-coregulator interactions in the presence of DES com-pared with E2. This raises the question to what extentDES-mediated coregulator recruitment to the ERαmight be different from that of E2 and whether thatcould play a role in the differential biological effectsof these two ERα agonists. The present study inves-tigates the DES- and E2-dependent modulation of theinteraction of ERα with coregulators using the MAR-CoNI technology and peptide microarrays containing154 unique nuclear receptor coregulator motifs of 64different coregulators. To provide further informationon the possible differences between DES- and E2-induced ERα-mediated effects, the present study alsoassesses the relative potency of the two compoundsas ERα agonists in a human osteosarcoma U2OSERα reporter gene assay and in a proliferation assay
Fig. 1 Chemical structures forE2 and DES
Cell Biol Toxicol
of human ERα positive T47D breast cancer cells andquantifies DES- and E2-induced modulation of geneexpression in T47D cells using next generation se-quencing (RNA-seq) and transcriptome analysis.
Materials and methods
Cell lines and culture conditions
The U2OS (human osteosarcoma) cell line, stablyexpressing ERα in addition to a 3× estrogen-responsive element and TATA box binding proteincombined with a luciferase gene (3x ERE-TATA-luciferase gene) was obtained from BiodetectionSystems (BDS) (Amsterdam, The Netherlands).U2OS-ERα cells were grown in DMEM:F12, a 1:1mixture of Dulbecco’s modified Eagle medium(DMEM) and Ham’s nutrient mixture F12 (Gibco,Bleiswijk, The Netherlands) supplemented with 10%fetal bovine serum (FBS, Sigma-Aldrich, St. Louis,Missouri, United States), 0.5% non-essential aminoacids (NEAA) (Gibco, Bleiswijk, The Netherlands),200 μ/ml geneticin G418 (Gibco, Bleiswijk,The Netherlands) and 50 μg/ml hygromycin (PAALaboratories GmbH, Pasching, Austria). T47D cells,obtained from the American Type Culture Collection(Manasssaa, VA, USA), were grown in 1:1DMEM:F12/Glutamax culture medium supplement-ed with 10% FCS. All cells were incubated at 37 °Cand 5% CO2 in a humidified atmosphere.
The T47D cell line is a generally applied model forstudying ERα-mediated effects especially because thecells retain several key characteristics specific to themammary epithelium (Holliday and Speirs 2011). Giv-en that the adverse effects of DES are mediated throughthe ERα (Couse et al. 2001; Couse and Korach 2004;Prins et al. 2001), the T47D model was consideredsuitable to study potential differences in ERα-mediated responses toward DES and E2.
The human breast cancer cell line MCF-7 (providedby the American Type Culture Collection (Manasssaa,VA, USA) was cultured in Dulbecco’s Modified EagleMed i um DMEM/F12 (G i b c o , B l e i sw i j k ,The Netherlands) supplemented with 10% (v/v) fetalbovine serum (PAA, Pasching, Austria), kept in a hu-midified atmosphere at 37 °C and 5% CO2 andsubcultured when they reached 60–80% confluence.
Reporter gene assay
U2OS-ERα cells were seeded in 96-well white plates(PerkinElmer, Groningen, The Netherlands) at a densityof 105 cells/ml in phenol red free medium (DMEM/F12)supplementedwith DCC-FCS (dextran-coated charcoal-treated fetal calf serum obtained from Gibco (Bleiswijk,The Netherlands) adding 100 μl/well and the cells wereincubated at 37 °C and 5% CO2 in a humidified atmo-sphere. Twenty-four hours after seeding, medium waschanged to phenol red free medium. Forty-eight hoursafter seeding, cells were exposed to the test compoundsin triplicate, in phenol red free medium (DMEM/F12)supplemented with DCC-FCS. Exposure medium wasprepared to reach the final concentration range of 0.1–100 pM for both DES (Sigma-Aldrich, Zwijndrecht,The Netherlands) and E2 (Sigma-Aldrich) using 200-time concentrated stock solution in DMSO (Acros,Geel, Belgium) diluted in the culture medium. Themaximum concentration of DMSO in exposure mediumwas 0.5%. After removing the medium from the wells,100 μL of exposure medium containing the test com-pound were added to the wells and the cells were incu-bated for another 24 h at 37 °C and 5% CO2 in ahumidified atmosphere. After 24 h of exposure, cellswere washed with 0.5× PBS and lysed with 30 μl ofhypotonic low-salt buffer containing 10 mMTris, 2 mMdithiothreitol (DTT, Sigma-Aldrich) and 2 mM 1,2-diaminocyclohexane tetraacetic acid monohydrate(CDTA, Sigma-Aldrich) pH 7.8. Plates were kept onice for at least 30min and subsequently stored at − 80 °Cuntil analysis. One hour before measurement, plateswere thawed on a plate shaker until they reached roomtemperature. Luciferase activity was determined using aluminometer (GloMax, Promega Corporation, USA).Data from the U2OS-ERα reporter gene assay wereexpressed in relative luminescence units (RLU),corrected for the corresponding background signal mea-sured before luciferin induction. Effects obtained in thestudies were expressed as a percentage of the maximumresponse obtained for E2 set at 100%.
Cell proliferation
T47D cells were seeded in 96-well plates (Corning, NY,USA) at a cell density of 5 × 10³ cells/well in phenol redfree medium (DMEM/F12) supplemented with DCC-FCS and incubated at 37 °C and 5%CO2 in a humidifiedatmosphere. Cells were allowed to attach and 24 h later
Cell Biol Toxicol
exposed to the test compounds (1–10,000 pM for bothE2 and DES, final solvent control 0.5% DMSO). Afterexposure for 72 h, 20 μl BrdU labelling solution (con-taining 5-bromo-2′-deoxyuridine in PBS) diluted (10%v/v) in exposure medium were added to the cells duringthe last 4 h of exposure. Next, BrdU incorporation wasmeasured by fixation-denaturation of the cells followedby incubation with BrdU detection antibodies and thecorresponding substrate according to the manufacturer’sguidelines (Roche, Manheim, Germany). Subsequently,colorimetric measurements were carried out at a wave-length of 370 nm with a Microplate Reader SpectraMaxM2 (Molecular Devices, Sunnyvale CA, USA). Effectsobtained were expressed as percentage of the maximumresponse obtained for E2 set at 100%.
Coregulator binding assay
Ligand-modulated interaction of coregulators with ERαwas assessed using a PamChip peptide microarray with154 coregulator motifs of 66 different coregulators(P amGene In t e r n a t i ona l BV, Den Bosch ,The Netherlands). Briefly, all incubations were per-formed on a PamStation (PamGene) at 20 °C usingtwo cycles per minute, as described by Wang et al.(2013). Polyhistidine (His) tagged ERα ligand bindingdomain (amino acids 302–552, partly purified fromEscherichia coli (E. coli) (Qiagen, Germantown, MD,USA, final concentration 10 nM) and His antibodypenta-His Alexa Fluor 488 conjugate (Qiagen, German-town, MD, USA, final concentration 25 nM) were di-luted in time-resolved fluorescence resonance energytransfer (TR-FRET) reaction buffer containing 20 mMTris–HCl pH 7.5 (Tris: Sigma-Aldrich) (HCl: Merck,Darmstadt, Germany), 500 mM NaCl (Merck), 0.2%bovine serum albumin (BSA, Merck) and 0.05% Tween20 (Bio-Rad, Veenendaal, The Netherlands). All mix-tures were kept on ice until transferred to the PamChipmicroarrays. The test compounds were pre-dissolved in50-time concentrated stock solutions in DMSO. Thefinal concentrations of the test compounds ranged be-tween 10−12 and 10−5 M, and the final DMSO concen-tration was 2%. A reaction mixture with 2% DMSOserved as negative control. Each array was blocked for20 cycles using 25 μl of blocking buffer (Tris-bufferedsaline) (TBS) (Bio-Rad) supplemented with 0.01%Tween 20 (Bio-Rad) and 1% BSA. Later, the blockingbuffer was removed by aspiration, and the reactionmixture containing the test compound at the required
concentration was added to the PamChipmicroarray in afinal volume of 25 μl. This reaction-ligand mixture wasincubated (pumped up and down the porous microarraymembrane containing the 154 different coregulatormotifs) for 80 cycles. Subsequently, unbound recep-tor was removed by washing the arrays with 25 μlTBS, and, finally, a tiff image of each array wasacquired by the charge-coupled device (CCD) cam-era of the PamStation. Image analysis was performedusing BioNavigator software (Version 62, PamGeneInternational BV). Per array, the fluorescent signal ofeach spot, representative of ER binding to that par-ticular coregulator motif, was quantified. For eachspot, the binding signal as median fluorescence sig-nal minus background for each peptide was calculat-ed. The modulation index (MI) for a saturating con-centration was subsequently determined by calculat-ing the compound-induced log10-fold change offluorescence in the presence of ligand over that inthe presence of solvent only. As each array contains154 unique coregulator motifs, each compound wascharacterized by a 154-point MI profile.
Next generation sequencing (RNA-seq)and transcriptome analysis
T47D cells were seeded in 25-cm2 flasks (Corning, NY,USA) at a density of 105 cells/ml. Twenty-four hoursafter seeding, medium was changed for phenol red freemedium supplemented with DCC-FCS. Forty-eighthours after seeding, cells were treated with 10 nM E2,10 nM DES, or control (0.5% DMSO) in duplicate, inphenol red free medium supplemented with DCC-FCSfor 6 h. Next, cells were lysed, and total RNA wasextracted and purified with the Quick RNA Miniprepkit (Zymo Research, Irvine, CA, USA) according tomanufacturer’s guidelines. For quality control, spectro-photometric analysis using a Nanodrop (ND-1000Thermoscientific Wilmington, Delaware, USA) andRIN analysis 2100 Bioanalizer (Agilent TechnologiesCalifornia, EE. UU) were utilized. Only samples withRNA integrity number (RIN) values higher than 8 wereaccepted for analysis. RNA-seq library preparation andsequencing was commissioned to BaseClear BV (Lei-den, The Netherlands). Briefly, strand-specific messen-ger RNA sequencing libraries for the Illumina (SanDiego, CA, USA) platform were generated,multiplexed, clustered, and sequenced on an Illumina
Cell Biol Toxicol
HiSeq 2500 with a single-read 50-cycle sequencingprotocol (15 million reads per sample).
Colorimetric sequencing signals were translated intobase calls using internal Illumina software (CASAVA).Subsequently, using the tool bcl2fastq2 (version 2.18),the per-cycle basecall (BCL) files were demultiplexedand converted into per-read FASTQ sequence files fordownstream analysis. Next, reads containing PhiX con-trol signal were removed by BaseClear BV using an in-house filtering protocol. In addition, reads containing(partial) adapters were clipped (up to minimum readlength of 50 bp). Finally, the quality of the FASTQsequences was assessed by the tool FastQC (Andrews2018) (version 0.11.5) and enhanced by trimming offlow-quality bases by setting the cut-off of the errorprobability limit of the modified-Mott algorithm(Ewing and Green 1998) to 0.02.
The RNA-seq reads were then used to quantify tran-script abundances. To this end, the tool Salmon (Patroet al. 2017) (version 0.8.2) was used to map the reads tothe GRCh38.p10 genome assembly-based tran-scriptome sequences as annotated by the Ensembl ge-nome database project (Zerbino et al. 2018) (Ensemblrelease v90). The obtained transcript abundance esti-mates and lengths were then imported in R using thepackage tximport (Soneson et al. 2015) (version 1.6.0)and summarized on the gene-level. Differential geneexpression was determined using the package edgeR(Robinson et al. 2010) (version 3.20.5) utilizing theobtained estimated gene-level counts and offsets basedon the transcript-level abundance estimates. The lattercorrects for changes to the average transcript lengthacross samples, and incorporation of such offsets hasbeen reported to improve the accuracy of differentialgene expression analysis (Soneson et al. 2015).
The complete RNA-seq dataset that was generated inthis study consisted of 16 samples (8 treatments × 2replicates), including also samples from T47D cellsexposed to a series of retinoids, including all-trans-retinoic acid (AtRA) (Sigma), and the synthetic reti-noids 4-[(5,6,7,8-tetrahydro-5,5,8,8-tetramethyl-2-naphthalenyl)carbamoyl] benzoic acid (Am80)(Abcam,Cambridge, UK), 5-(5,6,7,8-tetrahydro-5,5,8,8-tetramethyl-2-anthracenyl)-3-thiophenecarboxylic-acid(CD2314)(Tocris Bioscience, Bristol, UK) and 3-fluoro-4-[[2-hydroxy-2-(5,5,8,8-tetramethyl-5,6,7,8,-tetrahydro-2-naphthalenyl) acetyl]amino]-benzoic acid(BMS961)(Tocris Bioscience). Although not all treat-ments are of relevance to address the research question
posed in this paper, all samples were included in thestatistical analyses. This was done because this im-proves the empirical Bayes gene-wise dispersion(variability) estimates, which is advantageous whenhaving two replicates per group (see below).
Before statistical analyses, nonspecific filtering of thecount table was performed to increase detection power(Bourgon et al. 2010) based on the requirement that agene should have an expression level greater than 10counts, i.e. 0.65 count per million reads (cpm) mapped,for at least 2 libraries across all 16 samples. Differencesin library size were adjusted by the trimmed mean of M-values normalization method (Robinson and Oshlack2010). Differentially expressed genes were identifiedby using generalized linear models that incorporate em-pirical Bayes methods that permit the estimation ofgene-specific biological variation, thereby improvingtesting power (Lun et al. 2016; McCarthy et al. 2012;Robinson and Smyth 2007). When indicated,thresholded hypotheses testing using a log2 fold-change of 0.6 was performed to identify robustlyregulated genes, and genes regulated by a fold-change below this threshold were considered not tobe biologically meaningful (McCarthy and Smyth2009). In all cases, genes that satisfied the criterionof moderated p value < 0.05 were considered to besignificantly regulated. For the general overview, asshown in the heatmap (Fig. 6a), only the criterion offalse discovery rate (FDR) < 0.05 (Benjamini andHochberg 1995) in any of the 3 comparison wasconsidered to select significantly regulated genes.
Gene ontology and pathway analysis were carried outusing the Consensus Path Database (cpdb) tool(Kamburov et al. 2011). For NR pathway analysis, listscontaining all cpdb and the top 100 genes of theNURSA data base Transcriptomine (Consensome)(Becnel et al. 2015) were also used. In all cases, onlygene ontology and pathways with p values lower than0.05 were included for analysis. In addition, other webtools such as Heatmapper (Babicki et al. 2016) andInteractivenn (Heberle et al. 2015) were used to createthe heatmaps and Venn diagrams, respectively.
Gene expression (RT-qPCR) studies
Real-time quantitative polymerase chain reaction (RT-qPCR) amplification reactions were carried out to con-firm the genes that showed significant and biologicallyrelevant expression in the RNA-seq analysis. To this
Cell Biol Toxicol
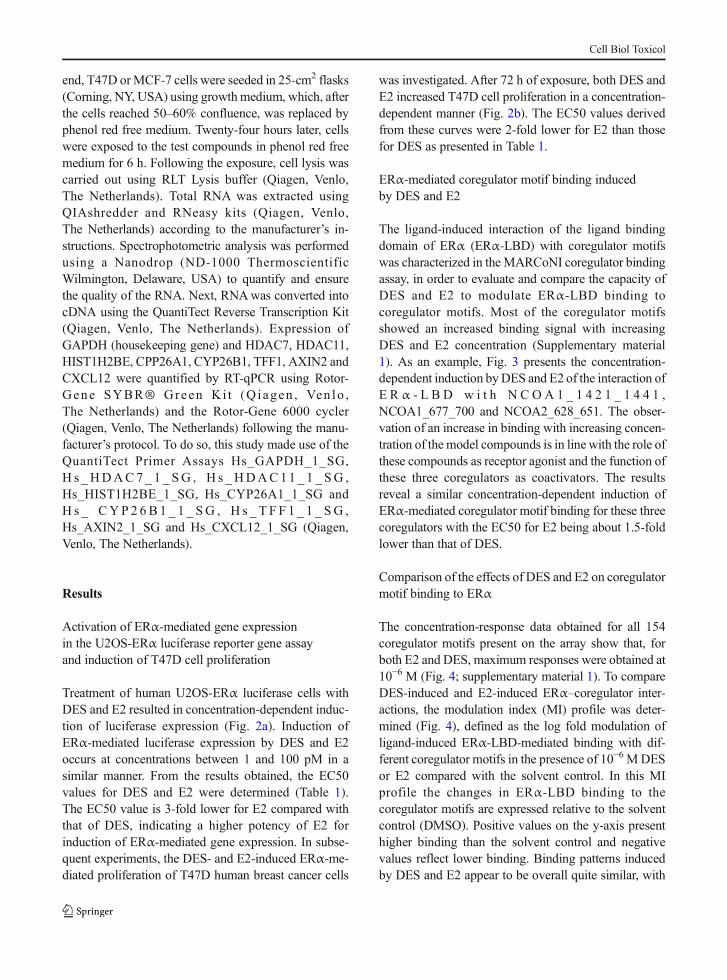
end, T47D orMCF-7 cells were seeded in 25-cm2 flasks(Corning, NY, USA) using growthmedium, which, afterthe cells reached 50–60% confluence, was replaced byphenol red free medium. Twenty-four hours later, cellswere exposed to the test compounds in phenol red freemedium for 6 h. Following the exposure, cell lysis wascarried out using RLT Lysis buffer (Qiagen, Venlo,The Netherlands). Total RNA was extracted usingQIAshredder and RNeasy kits (Qiagen, Venlo,The Netherlands) according to the manufacturer’s in-structions. Spectrophotometric analysis was performedusing a Nanodrop (ND-1000 ThermoscientificWilmington, Delaware, USA) to quantify and ensurethe quality of the RNA. Next, RNAwas converted intocDNA using the QuantiTect Reverse Transcription Kit(Qiagen, Venlo, The Netherlands). Expression ofGAPDH (housekeeping gene) and HDAC7, HDAC11,HIST1H2BE, CPP26A1, CYP26B1, TFF1, AXIN2 andCXCL12 were quantified by RT-qPCR using Rotor-Gene SYBR® Green Ki t (Q i agen , Ven lo ,The Netherlands) and the Rotor-Gene 6000 cycler(Qiagen, Venlo, The Netherlands) following the manu-facturer’s protocol. To do so, this study made use of theQuantiTect Primer Assays Hs_GAPDH_1_SG,H s _HDAC7 _ 1 _ SG , H s _HDAC11 _ 1 _ SG ,Hs_HIST1H2BE_1_SG, Hs_CYP26A1_1_SG andH s _ CYP 2 6B 1 _ 1 _ SG , H s _ T F F 1 _ 1 _ SG ,Hs_AXIN2_1_SG and Hs_CXCL12_1_SG (Qiagen,Venlo, The Netherlands).
Results
Activation of ERα-mediated gene expressionin the U2OS-ERα luciferase reporter gene assayand induction of T47D cell proliferation
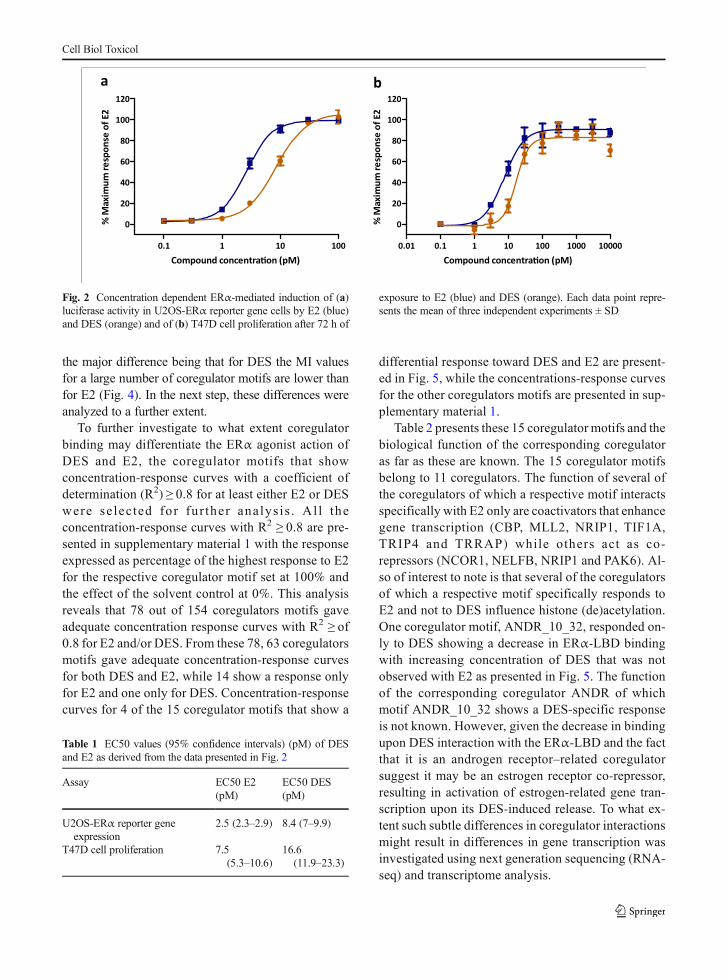
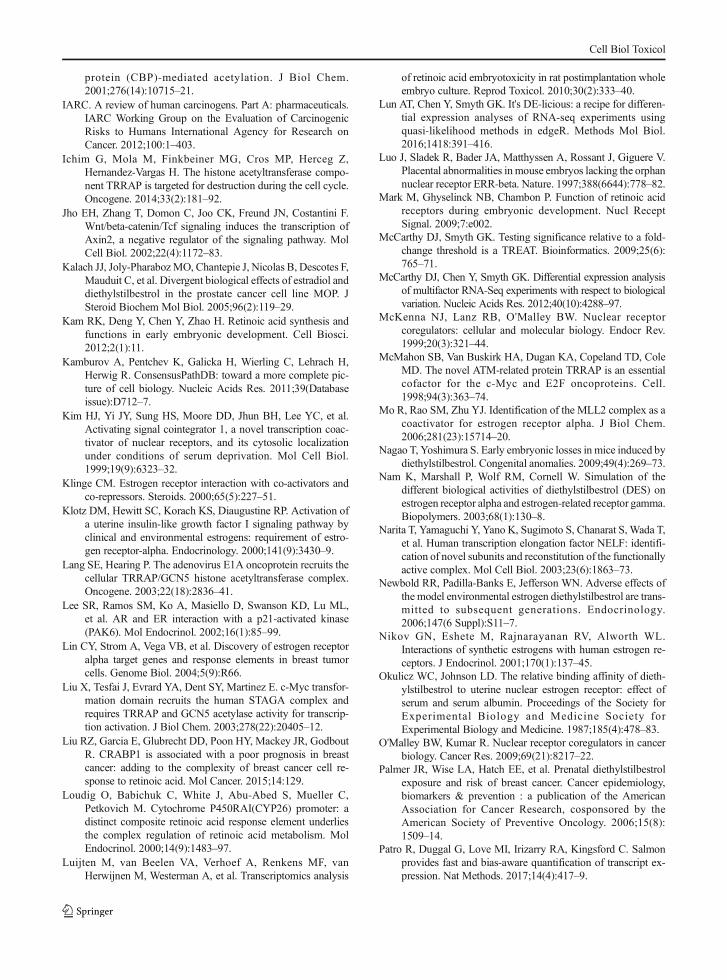
Treatment of human U2OS-ERα luciferase cells withDES and E2 resulted in concentration-dependent induc-tion of luciferase expression (Fig. 2a). Induction ofERα-mediated luciferase expression by DES and E2occurs at concentrations between 1 and 100 pM in asimilar manner. From the results obtained, the EC50values for DES and E2 were determined (Table 1).The EC50 value is 3-fold lower for E2 compared withthat of DES, indicating a higher potency of E2 forinduction of ERα-mediated gene expression. In subse-quent experiments, the DES- and E2-induced ERα-me-diated proliferation of T47D human breast cancer cells
was investigated. After 72 h of exposure, both DES andE2 increased T47D cell proliferation in a concentration-dependent manner (Fig. 2b). The EC50 values derivedfrom these curves were 2-fold lower for E2 than thosefor DES as presented in Table 1.
ERα-mediated coregulator motif binding inducedby DES and E2
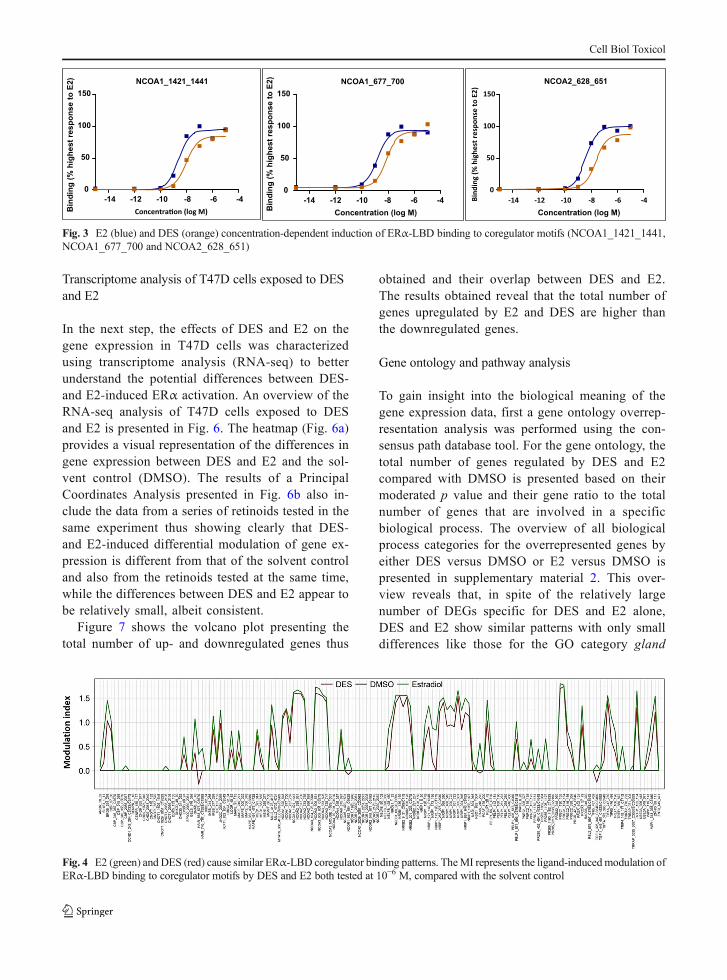
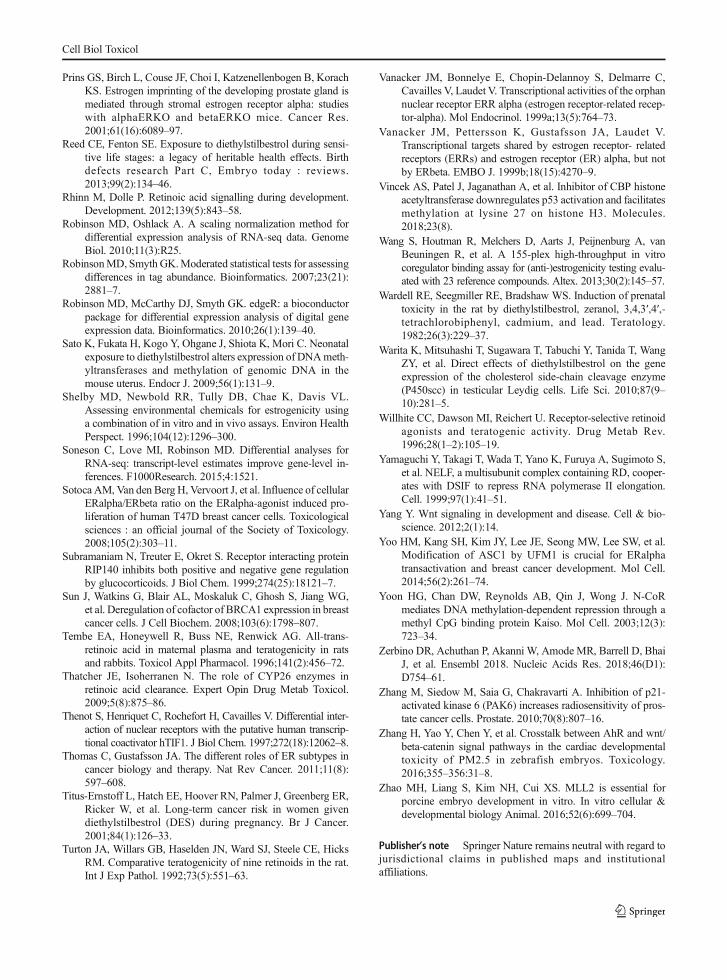
The ligand-induced interaction of the ligand bindingdomain of ERα (ERα-LBD) with coregulator motifswas characterized in the MARCoNI coregulator bindingassay, in order to evaluate and compare the capacity ofDES and E2 to modulate ERα-LBD binding tocoregulator motifs. Most of the coregulator motifsshowed an increased binding signal with increasingDES and E2 concentration (Supplementary material1). As an example, Fig. 3 presents the concentration-dependent induction byDES and E2 of the interaction ofE R α - L B D w i t h N C O A 1 _ 1 4 2 1 _ 1 4 4 1 ,NCOA1_677_700 and NCOA2_628_651. The obser-vation of an increase in binding with increasing concen-tration of the model compounds is in line with the role ofthese compounds as receptor agonist and the function ofthese three coregulators as coactivators. The resultsreveal a similar concentration-dependent induction ofERα-mediated coregulator motif binding for these threecoregulators with the EC50 for E2 being about 1.5-foldlower than that of DES.
Comparison of the effects of DES and E2 on coregulatormotif binding to ERα
The concentration-response data obtained for all 154coregulator motifs present on the array show that, forboth E2 and DES, maximum responses were obtained at10−6 M (Fig. 4; supplementary material 1). To compareDES-induced and E2-induced ERα–coregulator inter-actions, the modulation index (MI) profile was deter-mined (Fig. 4), defined as the log fold modulation ofligand-induced ERα-LBD-mediated binding with dif-ferent coregulator motifs in the presence of 10−6 MDESor E2 compared with the solvent control. In this MIprofile the changes in ERα-LBD binding to thecoregulator motifs are expressed relative to the solventcontrol (DMSO). Positive values on the y-axis presenthigher binding than the solvent control and negativevalues reflect lower binding. Binding patterns inducedby DES and E2 appear to be overall quite similar, with
Cell Biol Toxicol
the major difference being that for DES the MI valuesfor a large number of coregulator motifs are lower thanfor E2 (Fig. 4). In the next step, these differences wereanalyzed to a further extent.
To further investigate to what extent coregulatorbinding may differentiate the ERα agonist action ofDES and E2, the coregulator motifs that showconcentration-response curves with a coefficient ofdetermination (R2) ≥ 0.8 for at least either E2 or DESwere se lec ted for fur ther ana lys is . Al l theconcentration-response curves with R2 ≥ 0.8 are pre-sented in supplementary material 1 with the responseexpressed as percentage of the highest response to E2for the respective coregulator motif set at 100% andthe effect of the solvent control at 0%. This analysisreveals that 78 out of 154 coregulators motifs gaveadequate concentration response curves with R2 ≥ of0.8 for E2 and/or DES. From these 78, 63 coregulatorsmotifs gave adequate concentration-response curvesfor both DES and E2, while 14 show a response onlyfor E2 and one only for DES. Concentration-responsecurves for 4 of the 15 coregulator motifs that show a
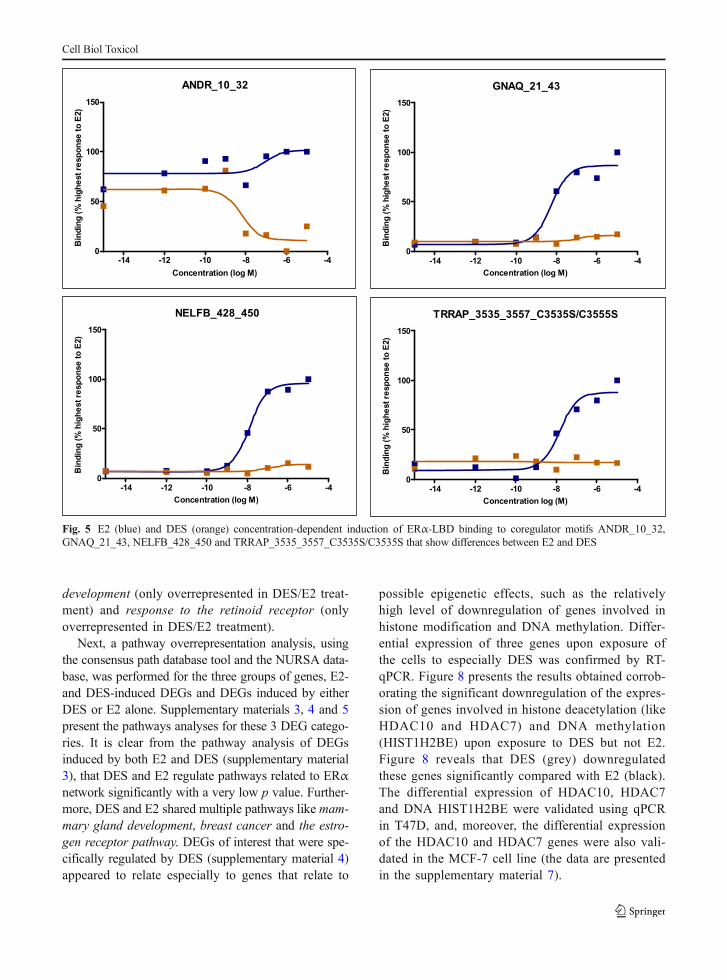
differential response toward DES and E2 are present-ed in Fig. 5, while the concentrations-response curvesfor the other coregulators motifs are presented in sup-plementary material 1.
Table 2 presents these 15 coregulator motifs and thebiological function of the corresponding coregulatoras far as these are known. The 15 coregulator motifsbelong to 11 coregulators. The function of several ofthe coregulators of which a respective motif interactsspecifically with E2 only are coactivators that enhancegene transcription (CBP, MLL2, NRIP1, TIF1A,TRIP4 and TRRAP) while others act as co-repressors (NCOR1, NELFB, NRIP1 and PAK6). Al-so of interest to note is that several of the coregulatorsof which a respective motif specifically responds toE2 and not to DES influence histone (de)acetylation.One coregulator motif, ANDR_10_32, responded on-ly to DES showing a decrease in ERα-LBD bindingwith increasing concentration of DES that was notobserved with E2 as presented in Fig. 5. The functionof the corresponding coregulator ANDR of whichmotif ANDR_10_32 shows a DES-specific responseis not known. However, given the decrease in bindingupon DES interaction with the ERα-LBD and the factthat it is an androgen receptor–related coregulatorsuggest it may be an estrogen receptor co-repressor,resulting in activation of estrogen-related gene tran-scription upon its DES-induced release. To what ex-tent such subtle differences in coregulator interactionsmight result in differences in gene transcription wasinvestigated using next generation sequencing (RNA-seq) and transcriptome analysis.
Compound concentra�on (pM)
% M
axim
um re
spon
se o
f E2
0.1 1 10 100
0
20
40
60
80
100
120
Compound concentra�on (pM)
% M
axim
um re
spon
se o
f E2
0.01 0.1 1 10 100 1000 10000
0
20
40
60
80
100
120
a b
Fig. 2 Concentration dependent ERα-mediated induction of (a)luciferase activity in U2OS-ERα reporter gene cells by E2 (blue)and DES (orange) and of (b) T47D cell proliferation after 72 h of
exposure to E2 (blue) and DES (orange). Each data point repre-sents the mean of three independent experiments ± SD
Table 1 EC50 values (95% confidence intervals) (pM) of DESand E2 as derived from the data presented in Fig. 2
Assay EC50 E2(pM)
EC50 DES(pM)
U2OS-ERα reporter geneexpression
2.5 (2.3–2.9) 8.4 (7–9.9)
T47D cell proliferation 7.5(5.3–10.6)
16.6(11.9–23.3)
Cell Biol Toxicol
Transcriptome analysis of T47D cells exposed to DESand E2
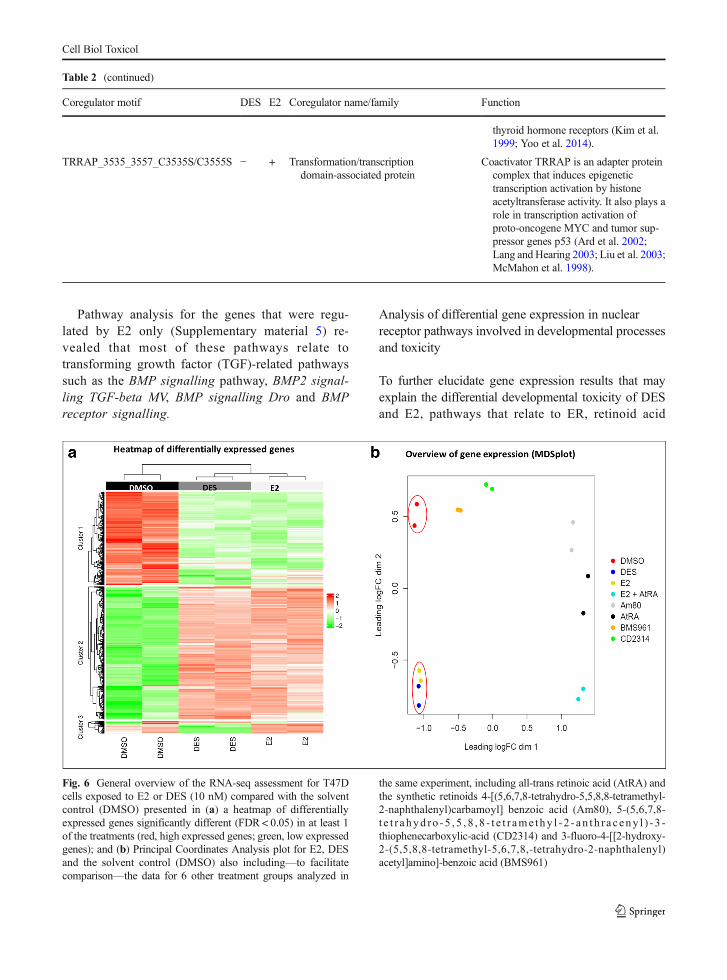
In the next step, the effects of DES and E2 on thegene expression in T47D cells was characterizedusing transcriptome analysis (RNA-seq) to betterunderstand the potential differences between DES-and E2-induced ERα activation. An overview of theRNA-seq analysis of T47D cells exposed to DESand E2 is presented in Fig. 6. The heatmap (Fig. 6a)provides a visual representation of the differences ingene expression between DES and E2 and the sol-vent control (DMSO). The results of a PrincipalCoordinates Analysis presented in Fig. 6b also in-clude the data from a series of retinoids tested in thesame experiment thus showing clearly that DES-and E2-induced differential modulation of gene ex-pression is different from that of the solvent controland also from the retinoids tested at the same time,while the differences between DES and E2 appear tobe relatively small, albeit consistent.
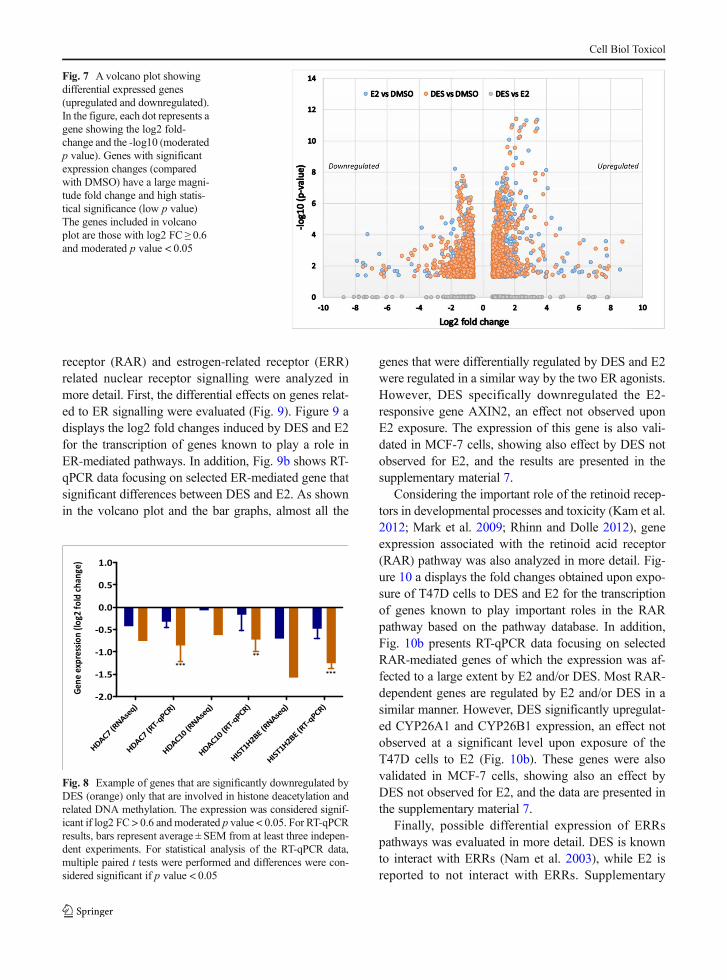
Figure 7 shows the volcano plot presenting thetotal number of up- and downregulated genes thus
obtained and their overlap between DES and E2.The results obtained reveal that the total number ofgenes upregulated by E2 and DES are higher thanthe downregulated genes.
Gene ontology and pathway analysis
To gain insight into the biological meaning of thegene expression data, first a gene ontology overrep-resentation analysis was performed using the con-sensus path database tool. For the gene ontology, thetotal number of genes regulated by DES and E2compared with DMSO is presented based on theirmoderated p value and their gene ratio to the totalnumber of genes that are involved in a specificbiological process. The overview of all biologicalprocess categories for the overrepresented genes byeither DES versus DMSO or E2 versus DMSO ispresented in supplementary material 2. This over-view reveals that, in spite of the relatively largenumber of DEGs specific for DES and E2 alone,DES and E2 show similar patterns with only smalldifferences like those for the GO category gland
NCOA1_1421_1441
Concentra�on (log M)Bin
ding
(% h
ighe
st re
spon
se to
E2)
-14 -12 -10 -8 -6 -40
50
100
150NCOA1_677_700
Concentration (log M)Bin
ding
(% h
ighe
st re
spon
se to
E2)
-14 -12 -10 -8 -6 -40
50
100
150NCOA2_628_651
Concentration (log M)
Bind
ing
(% h
ighe
st re
spon
se to
E2)
-14 -12 -10 -8 -6 -40
50
100
150
Fig. 3 E2 (blue) and DES (orange) concentration-dependent induction of ERα-LBD binding to coregulator motifs (NCOA1_1421_1441,NCOA1_677_700 and NCOA2_628_651)
Fig. 4 E2 (green) and DES (red) cause similar ERα-LBD coregulator binding patterns. TheMI represents the ligand-inducedmodulation ofERα-LBD binding to coregulator motifs by DES and E2 both tested at 10−6 M, compared with the solvent control
Cell Biol Toxicol
development (only overrepresented in DES/E2 treat-ment) and response to the retinoid receptor (onlyoverrepresented in DES/E2 treatment).
Next, a pathway overrepresentation analysis, usingthe consensus path database tool and the NURSA data-base, was performed for the three groups of genes, E2-and DES-induced DEGs and DEGs induced by eitherDES or E2 alone. Supplementary materials 3, 4 and 5present the pathways analyses for these 3 DEG catego-ries. It is clear from the pathway analysis of DEGsinduced by both E2 and DES (supplementary material3), that DES and E2 regulate pathways related to ERαnetwork significantly with a very low p value. Further-more, DES and E2 shared multiple pathways like mam-mary gland development, breast cancer and the estro-gen receptor pathway. DEGs of interest that were spe-cifically regulated by DES (supplementary material 4)appeared to relate especially to genes that relate to
possible epigenetic effects, such as the relativelyhigh level of downregulation of genes involved inhistone modification and DNA methylation. Differ-ential expression of three genes upon exposure ofthe cells to especially DES was confirmed by RT-qPCR. Figure 8 presents the results obtained corrob-orating the significant downregulation of the expres-sion of genes involved in histone deacetylation (likeHDAC10 and HDAC7) and DNA methylation(HIST1H2BE) upon exposure to DES but not E2.Figure 8 reveals that DES (grey) downregulatedthese genes significantly compared with E2 (black).The differential expression of HDAC10, HDAC7and DNA HIST1H2BE were validated using qPCRin T47D, and, moreover, the differential expressionof the HDAC10 and HDAC7 genes were also vali-dated in the MCF-7 cell line (the data are presentedin the supplementary material 7).
ANDR_10_32
Concentration (log M)
Bind
ing
(% h
ighe
st re
spon
se to
E2)
-14 -12 -10 -8 -6 -40
50
100
150GNAQ_21_43
Concentration (log M)
Bin
ding
(% h
ighe
st re
spon
se to
E2)
-14 -12 -10 -8 -6 -40
50
100
150
NELFB_428_450
Concentration (log M)
Bin
ding
(% h
ighe
st re
spon
se to
E2)
-14 -12 -10 -8 -6 -40
50
100
150TRRAP_3535_3557_C3535S/C3555S
Concentration log (M)
Bin
ding
(% h
ighe
st re
spon
se to
E2)
-14 -12 -10 -8 -6 -40
50
100
150
Fig. 5 E2 (blue) and DES (orange) concentration-dependent induction of ERα-LBD binding to coregulator motifs ANDR_10_32,GNAQ_21_43, NELFB_428_450 and TRRAP_3535_3557_C3535S/C3535S that show differences between E2 and DES
Cell Biol Toxicol
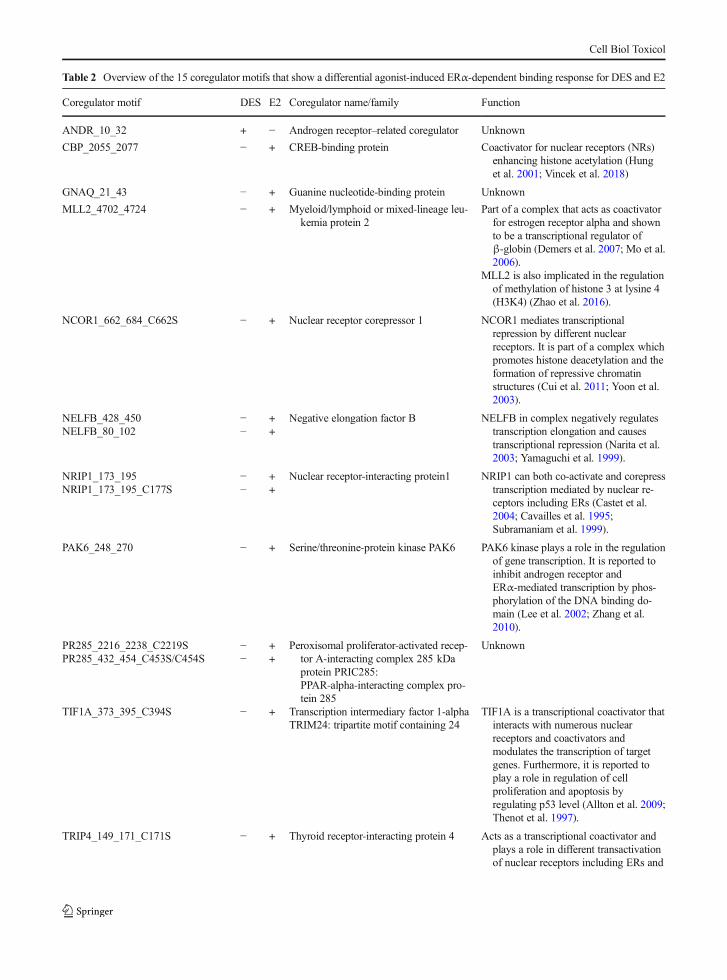
Table 2 Overview of the 15 coregulator motifs that show a differential agonist-induced ERα-dependent binding response for DES and E2
Coregulator motif DES E2 Coregulator name/family Function
ANDR_10_32 + − Androgen receptor–related coregulator Unknown
CBP_2055_2077 − + CREB-binding protein Coactivator for nuclear receptors (NRs)enhancing histone acetylation (Hunget al. 2001; Vincek et al. 2018)
GNAQ_21_43 − + Guanine nucleotide-binding protein Unknown
MLL2_4702_4724 − + Myeloid/lymphoid or mixed-lineage leu-kemia protein 2
Part of a complex that acts as coactivatorfor estrogen receptor alpha and shownto be a transcriptional regulator ofβ-globin (Demers et al. 2007; Mo et al.2006).
MLL2 is also implicated in the regulationof methylation of histone 3 at lysine 4(H3K4) (Zhao et al. 2016).
NCOR1_662_684_C662S − + Nuclear receptor corepressor 1 NCOR1 mediates transcriptionalrepression by different nuclearreceptors. It is part of a complex whichpromotes histone deacetylation and theformation of repressive chromatinstructures (Cui et al. 2011; Yoon et al.2003).
NELFB_428_450 − + Negative elongation factor B NELFB in complex negatively regulatestranscription elongation and causestranscriptional repression (Narita et al.2003; Yamaguchi et al. 1999).
NELFB_80_102 − +
NRIP1_173_195 − + Nuclear receptor-interacting protein1 NRIP1 can both co-activate and corepresstranscription mediated by nuclear re-ceptors including ERs (Castet et al.2004; Cavailles et al. 1995;Subramaniam et al. 1999).
NRIP1_173_195_C177S − +
PAK6_248_270 − + Serine/threonine-protein kinase PAK6 PAK6 kinase plays a role in the regulationof gene transcription. It is reported toinhibit androgen receptor andERα-mediated transcription by phos-phorylation of the DNA binding do-main (Lee et al. 2002; Zhang et al.2010).
PR285_2216_2238_C2219S − + Peroxisomal proliferator-activated recep-tor A-interacting complex 285 kDaprotein PRIC285:PPAR-alpha-interacting complex pro-tein 285
UnknownPR285_432_454_C453S/C454S − +
TIF1A_373_395_C394S − + Transcription intermediary factor 1-alphaTRIM24: tripartite motif containing 24
TIF1A is a transcriptional coactivator thatinteracts with numerous nuclearreceptors and coactivators andmodulates the transcription of targetgenes. Furthermore, it is reported toplay a role in regulation of cellproliferation and apoptosis byregulating p53 level (Allton et al. 2009;Thenot et al. 1997).
TRIP4_149_171_C171S − + Thyroid receptor-interacting protein 4 Acts as a transcriptional coactivator andplays a role in different transactivationof nuclear receptors including ERs and
Cell Biol Toxicol
Pathway analysis for the genes that were regu-lated by E2 only (Supplementary material 5) re-vealed that most of these pathways relate totransforming growth factor (TGF)-related pathwayssuch as the BMP signalling pathway, BMP2 signal-ling TGF-beta MV, BMP signalling Dro and BMPreceptor signalling.
Analysis of differential gene expression in nuclearreceptor pathways involved in developmental processesand toxicity
To further elucidate gene expression results that mayexplain the differential developmental toxicity of DESand E2, pathways that relate to ER, retinoid acid
Table 2 (continued)
Coregulator motif DES E2 Coregulator name/family Function
thyroid hormone receptors (Kim et al.1999; Yoo et al. 2014).
TRRAP_3535_3557_C3535S/C3555S − + Transformation/transcriptiondomain-associated protein
Coactivator TRRAP is an adapter proteincomplex that induces epigenetictranscription activation by histoneacetyltransferase activity. It also plays arole in transcription activation ofproto-oncogene MYC and tumor sup-pressor genes p53 (Ard et al. 2002;Lang and Hearing 2003; Liu et al. 2003;McMahon et al. 1998).
Fig. 6 General overview of the RNA-seq assessment for T47Dcells exposed to E2 or DES (10 nM) compared with the solventcontrol (DMSO) presented in (a) a heatmap of differentiallyexpressed genes significantly different (FDR < 0.05) in at least 1of the treatments (red, high expressed genes; green, low expressedgenes); and (b) Principal Coordinates Analysis plot for E2, DESand the solvent control (DMSO) also including—to facilitatecomparison—the data for 6 other treatment groups analyzed in
the same experiment, including all-trans retinoic acid (AtRA) andthe synthetic retinoids 4-[(5,6,7,8-tetrahydro-5,5,8,8-tetramethyl-2-naphthalenyl)carbamoyl] benzoic acid (Am80), 5-(5,6,7,8-t e t r a hyd ro -5 , 5 , 8 , 8 - t e t r ame thy l - 2 - an t h r a c eny l ) - 3 -thiophenecarboxylic-acid (CD2314) and 3-fluoro-4-[[2-hydroxy-2-(5,5,8,8-tetramethyl-5,6,7,8,-tetrahydro-2-naphthalenyl)acetyl]amino]-benzoic acid (BMS961)
Cell Biol Toxicol
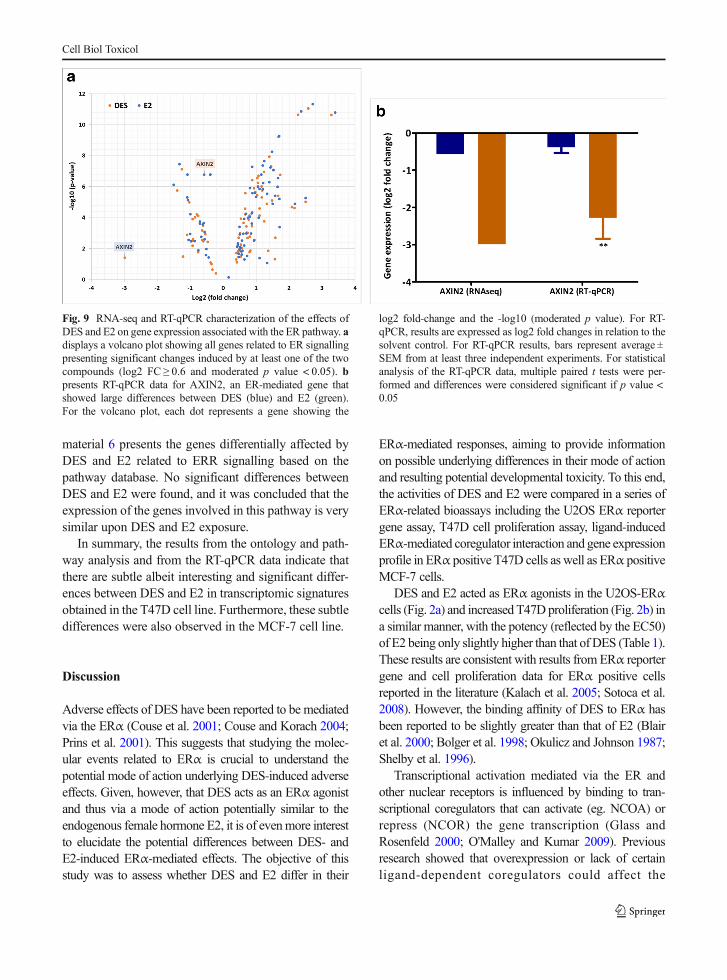
receptor (RAR) and estrogen-related receptor (ERR)related nuclear receptor signalling were analyzed inmore detail. First, the differential effects on genes relat-ed to ER signalling were evaluated (Fig. 9). Figure 9 adisplays the log2 fold changes induced by DES and E2for the transcription of genes known to play a role inER-mediated pathways. In addition, Fig. 9b shows RT-qPCR data focusing on selected ER-mediated gene thatsignificant differences between DES and E2. As shownin the volcano plot and the bar graphs, almost all the
genes that were differentially regulated by DES and E2were regulated in a similar way by the two ER agonists.However, DES specifically downregulated the E2-responsive gene AXIN2, an effect not observed uponE2 exposure. The expression of this gene is also vali-dated in MCF-7 cells, showing also effect by DES notobserved for E2, and the results are presented in thesupplementary material 7.
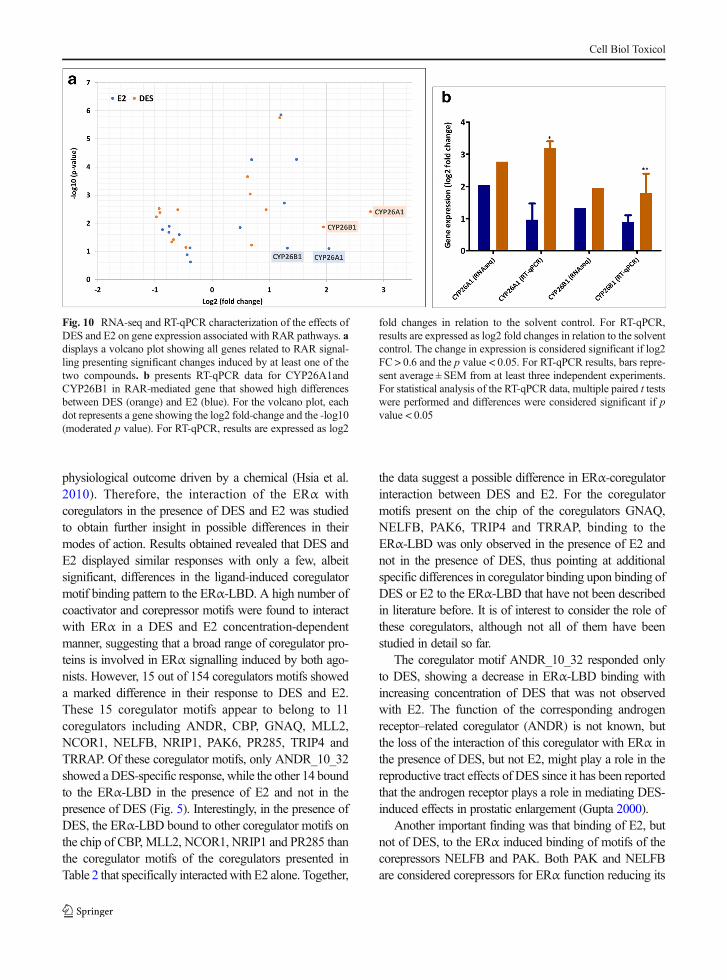
Considering the important role of the retinoid recep-tors in developmental processes and toxicity (Kam et al.2012; Mark et al. 2009; Rhinn and Dolle 2012), geneexpression associated with the retinoid acid receptor(RAR) pathway was also analyzed in more detail. Fig-ure 10 a displays the fold changes obtained upon expo-sure of T47D cells to DES and E2 for the transcriptionof genes known to play important roles in the RARpathway based on the pathway database. In addition,Fig. 10b presents RT-qPCR data focusing on selectedRAR-mediated genes of which the expression was af-fected to a large extent by E2 and/or DES. Most RAR-dependent genes are regulated by E2 and/or DES in asimilar manner. However, DES significantly upregulat-ed CYP26A1 and CYP26B1 expression, an effect notobserved at a significant level upon exposure of theT47D cells to E2 (Fig. 10b). These genes were alsovalidated in MCF-7 cells, showing also an effect byDES not observed for E2, and the data are presented inthe supplementary material 7.
Finally, possible differential expression of ERRspathways was evaluated in more detail. DES is knownto interact with ERRs (Nam et al. 2003), while E2 isreported to not interact with ERRs. Supplementary
Fig. 7 A volcano plot showingdifferential expressed genes(upregulated and downregulated).In the figure, each dot represents agene showing the log2 fold-change and the -log10 (moderatedp value). Genes with significantexpression changes (comparedwith DMSO) have a large magni-tude fold change and high statis-tical significance (low p value)The genes included in volcanoplot are those with log2 FC ≥ 0.6and moderated p value < 0.05
Gene
exp
ress
ion
(log2
fold
chan
ge)
HDAC7 (RNAse
q)
HDAC7 (RT-q
PCR)
HDAC10 (R
NAseq)
HDAC10 (R
T-qPCR)
HIST1H
2BE (
RNAseq)
HIST1H
2BE (
RT-qPCR)
-2.0
-1.5
-1.0
-0.5
0.0
0.5
1.0
***
**
***
Fig. 8 Example of genes that are significantly downregulated byDES (orange) only that are involved in histone deacetylation andrelated DNA methylation. The expression was considered signif-icant if log2 FC > 0.6 andmoderated p value < 0.05. For RT-qPCRresults, bars represent average ± SEM from at least three indepen-dent experiments. For statistical analysis of the RT-qPCR data,multiple paired t tests were performed and differences were con-sidered significant if p value < 0.05
Cell Biol Toxicol
material 6 presents the genes differentially affected byDES and E2 related to ERR signalling based on thepathway database. No significant differences betweenDES and E2 were found, and it was concluded that theexpression of the genes involved in this pathway is verysimilar upon DES and E2 exposure.
In summary, the results from the ontology and path-way analysis and from the RT-qPCR data indicate thatthere are subtle albeit interesting and significant differ-ences between DES and E2 in transcriptomic signaturesobtained in the T47D cell line. Furthermore, these subtledifferences were also observed in the MCF-7 cell line.
Discussion
Adverse effects of DES have been reported to be mediatedvia the ERα (Couse et al. 2001; Couse and Korach 2004;Prins et al. 2001). This suggests that studying the molec-ular events related to ERα is crucial to understand thepotential mode of action underlying DES-induced adverseeffects. Given, however, that DES acts as an ERα agonistand thus via a mode of action potentially similar to theendogenous female hormone E2, it is of evenmore interestto elucidate the potential differences between DES- andE2-induced ERα-mediated effects. The objective of thisstudy was to assess whether DES and E2 differ in their
ERα-mediated responses, aiming to provide informationon possible underlying differences in their mode of actionand resulting potential developmental toxicity. To this end,the activities of DES and E2 were compared in a series ofERα-related bioassays including the U2OS ERα reportergene assay, T47D cell proliferation assay, ligand-inducedERα-mediated coregulator interaction and gene expressionprofile in ERα positive T47D cells as well as ERα positiveMCF-7 cells.
DES and E2 acted as ERα agonists in the U2OS-ERαcells (Fig. 2a) and increased T47D proliferation (Fig. 2b) ina similar manner, with the potency (reflected by the EC50)of E2 being only slightly higher than that of DES (Table 1).These results are consistent with results from ERα reportergene and cell proliferation data for ERα positive cellsreported in the literature (Kalach et al. 2005; Sotoca et al.2008). However, the binding affinity of DES to ERα hasbeen reported to be slightly greater than that of E2 (Blairet al. 2000; Bolger et al. 1998; Okulicz and Johnson 1987;Shelby et al. 1996).
Transcriptional activation mediated via the ER andother nuclear receptors is influenced by binding to tran-scriptional coregulators that can activate (eg. NCOA) orrepress (NCOR) the gene transcription (Glass andRosenfeld 2000; O'Malley and Kumar 2009). Previousresearch showed that overexpression or lack of certainligand-dependent coregulators could affect the
Fig. 9 RNA-seq and RT-qPCR characterization of the effects ofDES and E2 on gene expression associated with the ER pathway. adisplays a volcano plot showing all genes related to ER signallingpresenting significant changes induced by at least one of the twocompounds (log2 FC ≥ 0.6 and moderated p value < 0.05). bpresents RT-qPCR data for AXIN2, an ER-mediated gene thatshowed large differences between DES (blue) and E2 (green).For the volcano plot, each dot represents a gene showing the
log2 fold-change and the -log10 (moderated p value). For RT-qPCR, results are expressed as log2 fold changes in relation to thesolvent control. For RT-qPCR results, bars represent average ±SEM from at least three independent experiments. For statisticalanalysis of the RT-qPCR data, multiple paired t tests were per-formed and differences were considered significant if p value <0.05
Cell Biol Toxicol
physiological outcome driven by a chemical (Hsia et al.2010). Therefore, the interaction of the ERα withcoregulators in the presence of DES and E2 was studiedto obtain further insight in possible differences in theirmodes of action. Results obtained revealed that DES andE2 displayed similar responses with only a few, albeitsignificant, differences in the ligand-induced coregulatormotif binding pattern to the ERα-LBD. A high number ofcoactivator and corepressor motifs were found to interactwith ERα in a DES and E2 concentration-dependentmanner, suggesting that a broad range of coregulator pro-teins is involved in ERα signalling induced by both ago-nists. However, 15 out of 154 coregulators motifs showeda marked difference in their response to DES and E2.These 15 coregulator motifs appear to belong to 11coregulators including ANDR, CBP, GNAQ, MLL2,NCOR1, NELFB, NRIP1, PAK6, PR285, TRIP4 andTRRAP. Of these coregulator motifs, only ANDR_10_32showed aDES-specific response, while the other 14 boundto the ERα-LBD in the presence of E2 and not in thepresence of DES (Fig. 5). Interestingly, in the presence ofDES, the ERα-LBD bound to other coregulator motifs onthe chip of CBP, MLL2, NCOR1, NRIP1 and PR285 thanthe coregulator motifs of the coregulators presented inTable 2 that specifically interactedwith E2 alone. Together,
the data suggest a possible difference in ERα-coregulatorinteraction between DES and E2. For the coregulatormotifs present on the chip of the coregulators GNAQ,NELFB, PAK6, TRIP4 and TRRAP, binding to theERα-LBD was only observed in the presence of E2 andnot in the presence of DES, thus pointing at additionalspecific differences in coregulator binding upon binding ofDES or E2 to the ERα-LBD that have not been describedin literature before. It is of interest to consider the role ofthese coregulators, although not all of them have beenstudied in detail so far.
The coregulator motif ANDR_10_32 responded onlyto DES, showing a decrease in ERα-LBD binding withincreasing concentration of DES that was not observedwith E2. The function of the corresponding androgenreceptor–related coregulator (ANDR) is not known, butthe loss of the interaction of this coregulator with ERα inthe presence of DES, but not E2, might play a role in thereproductive tract effects of DES since it has been reportedthat the androgen receptor plays a role in mediating DES-induced effects in prostatic enlargement (Gupta 2000).
Another important finding was that binding of E2, butnot of DES, to the ERα induced binding of motifs of thecorepressors NELFB and PAK. Both PAK and NELFBare considered corepressors for ERα function reducing its
Fig. 10 RNA-seq and RT-qPCR characterization of the effects ofDES and E2 on gene expression associated with RAR pathways. adisplays a volcano plot showing all genes related to RAR signal-ling presenting significant changes induced by at least one of thetwo compounds. b presents RT-qPCR data for CYP26A1andCYP26B1 in RAR-mediated gene that showed high differencesbetween DES (orange) and E2 (blue). For the volcano plot, eachdot represents a gene showing the log2 fold-change and the -log10(moderated p value). For RT-qPCR, results are expressed as log2
fold changes in relation to the solvent control. For RT-qPCR,results are expressed as log2 fold changes in relation to the solventcontrol. The change in expression is considered significant if log2FC > 0.6 and the p value < 0.05. For RT-qPCR results, bars repre-sent average ± SEM from at least three independent experiments.For statistical analysis of the RT-qPCR data, multiple paired t testswere performed and differences were considered significant if pvalue < 0.05
Cell Biol Toxicol
transcriptional activities (Aiyar et al. 2004; Lee et al. 2002).Furthermore, a lack of NELFB expression in breast carci-noma may serve as a useful indicator for poor prognosis(Aiyar et al. 2007; Sun et al. 2008), thus pointing at abeneficial role for NELFB. The recruitment of thecoregulator TRRA upon binding of E2 to ERα is consis-tent with the literature. It has been reported that E2 inducesdirect binding of ERα to TRRAP (Fujita et al. 2003).TRRAP has been reported to play different roles in cellcycle and histone transcription (DeRan et al. 2008; Ichimet al. 2014). The difference in recruitment of TRRAP byE2 and not by DES may thus contribute to the differentialbiological responses induced by the two ERα agonists.Other coregulator motifs and related coregulators that ap-peared to respond different to E2 and DES have not beenstudied in detail, so a clear role in the differential biologicalresponses to DES and E2 is less obvious.
To further assess subtle differences in cellular responsesinduced by DES and E2, gene expression in DES- and E2-exposed ERα competent T47D cells were assessed usingRNA seq. An initial view and Principal Coordinates Anal-ysis of the general transcriptomes induced by the testcompounds showed that DES and E2 clustered togetherand were clearly grouped apart from a series of retinoids,also known to cause developmental toxicity, tested in thesame experiment (Fig. 5b). General comparison of theheatmaps confirmed that DES and E2 presented remark-ably similar expression patterns and levels although closeanalysis of the data revealed minor, albeit significant dif-ferences as shown in the heatmap (Fig. 6a).
The biological consequences of the genes that showspecific regulation by either DES alone or E2 alone orgenes thatwere regulated by both estrogenswere evaluatedin a subsequent pathway analysis. Interestingly, pathwayanalysis for the genes regulated specifically by DEShighlighted potential differential epigenetic effects inducedby DES compared with E2, including effects on genesinvolved in histone modification and DNA methylation.Histone deacetylase–related genes HDAC7, HDAC10 andHISTIH2BE were significantly downregulated by DESwhile not by E2 (Fig. 8). These findings are consistentwith previous research that reported DES-induced histonedeacetylation in the promoter region of P450scc in TTE1Leydig cells, while E2 did not induce these changes(Warita et al. 2010). Furthermore, DES exposure resultedin expression of certain genes (HIST1H3E, HIST1H3D,HIST1H2BE, HIST1H2BG and HIST2H2AA3) involvedin DNA methylation pathways, while these genes did notshow significant E2-induced regulation. This group of
genes normally clusters together and is highly expressedduring the S-phase of the cell cycle (Harris et al. 1991). Ithas been reported that aberrant DNA methylation wasimplicated in DES-induced reproductive developmentalabnormalities and tumor formation (Newbold et al. 2006;Sato et al. 2009). The differences observed in DES- andE2-mediated induction of genes involved in epigeneticmodes of action, observed to a substantially higher extentfor DES than for E2, can add to the observations that DES-mediated effects are transferred to subsequent generationsvia epigenetic modes of action (Doherty et al. 2010;Bromer et al. 2009).
Nuclear receptors act as ligand-inducible transcriptionfactors by directly interacting with DNA response elementsfor the target genes. Therefore, nuclear receptor pathwayanalyses were performed to identify pathways potentiallyaffected by E2 or/and DES through their interaction withERs, RARs and ERRs since these nuclear receptors mayplay a role in modes of action underlying developmentaltoxicity (Collins and Mao 1999; Couse and Korach 2004;Luo et al. 1997; Willhite et al. 1996). Both compoundsregulated multiple ER-related genes in a similar way(Fig. 9a). These ER-related genes were reported to play arole in ER-mediated regulation and can be target genes inbreast cancer (Lin et al. 2004). From these estrogen-responsive genes, the AXIN2 gene appeared to be stronglydownregulated specifically by DES as compared with E2(Fig. 9b). This gene is reported to play a role in regulationofβ-actin and inhibit theWnt signalling pathway (Jho et al.2002). The Wnt signalling pathway is essential for theembryonic developmental processes (Yang 2012), and theinhibition of this pathway by AXIN was associated withdevelopmental toxicity and malformation in zebrafish(Heisenberg et al. 2001; Zhang et al. 2016).
Previous research has shown that DES can bind andactivate estrogen-related receptors (ERRs) (Nam et al.2003), while E2 cannot. These receptors share high ho-mology to ERα (Eudy et al. 1998; Giguere et al. 1988) andregulate the activity of the estrogen-response element con-stitutively (Chen et al. 2001; Hong et al. 1999). Therefore,it was hypothesized that gene expression related to theERR pathway might be influenced specifically by DES.However, the findings of the current study do not supportthis hypothesis. DES and E2 induced similar expression ofERR-related genes as presented in supplementary material6. This high similarity between DES and E2 in ERRpathways might be due the fact that ERs and ERRs sharehigh homology and might regulate many of the samegenes (Vanacker et al. 1999a; Vanacker et al. 1999b).
Cell Biol Toxicol
The gene expression profile related to the RAR path-way was studied in more detail based on the fact that DESinduces developmental toxicity in human and animals, aprocess in which retinoid acid signalling and timing ofRAR activation play an important role (Cornwall et al.1984; Nagao and Yoshimura 2009; Reed and Fenton2013; Wardell et al. 1982). Furthermore, several agonistsfor the retinoid receptors like all-trans-retinoic acid andretinol have been found to induce developmental toxicityand to have a relation to breast cancer (Collins and Mao1999; Garattini et al. 2014; Liu et al. 2015; Tembe et al.1996; Turton et al. 1992). Therefore, the DES- and E2-mediated effects on RAR-mediated gene expression werealso characterized in more detail. The analysis revealedthat DES induced expression of especially CYP26A1 andCYP26AB1 to a significantly higher extent than E2(Fig. 10b). These two genes are responsible formetabolismand elimination of retinoid acid (Loudig et al. 2000;Thatcher and Isoherranen 2009). DES-mediated upregula-tion of CYP26A1 andCYP26B1 gene expression is in linewith the effects reported for the developmental toxinsflusilazole and retinoic acid, which have been reported toincrease the expression of these genes in a similar manner(Dimopoulou et al. 2016; Luijten et al. 2010). This effectmay play an important role in themode of action ofDES indevelopmental toxicity.
Finally, it is important to note that concentrationsused in the in vitro incubations were above physiolog-ical concentrations to be expected. However, the aim ofthe study was to detect potential mechanistic differencesbetween DES- and E2-induced ERα-mediated cellularresponses in order to create hypotheses for potentialmechanistic differences between these ERα agonists.The extent to which these differences will be detectablein an in vivo setting remains to be investigated.
Altogether, it is concluded that the present studyreveals further insight in possible modes of action un-derlying the differential biological effects of DES andE2. While effects of these two estrogens on ERα-mediated gene expression in an ERα reporter gene assayand on ERα-mediated cell proliferation were similar,coregulator binding and gene expression studies re-vealed subtle but significant differences. The studieson DES- and E2-induced coregulator binding to ERα-LBD showed differences for 15 coregulator motifs, andgene expression analysis revealed effects of DES ongenes related to epigenetic regulation and developmen-tal processes that were not observed for E2. Theseobservations point at subtle differences in the estrogenic
response that ultimately may contribute to their differ-ential biological effects.
Acknowledgments The authors are grateful to bio-detectionsystems (BDS) for use of U2OS-ERα CALUX cells.
Compliance with ethical standards
Conflict of interest The authors declare that they have no con-flict of interest.
Open Access This article is licensed under a Creative CommonsAttribution 4.0 International License, which permits use, sharing,adaptation, distribution and reproduction in anymedium or format,as long as you give appropriate credit to the original author(s) andthe source, provide a link to the Creative Commons licence, andindicate if changes were made. The images or other third partymaterial in this article are included in the article's Creative Com-mons licence, unless indicated otherwise in a credit line to thematerial. If material is not included in the article's Creative Com-mons licence and your intended use is not permitted by statutoryregulation or exceeds the permitted use, you will need to obtainpermission directly from the copyright holder. To view a copy ofthis licence, visit http://creativecommons.org/licenses/by/4.0/.
References
Aiyar SE, Sun JL, Blair AL, Moskaluk CA, Lu YZ, Ye QN, et al.Attenuation of estrogen receptor alpha-mediated transcrip-tion through estrogen-stimulated recruitment of a negativeelongation factor. Genes Dev. 2004;18(17):2134–46.
Aiyar SE, Cho H, Lee J, Li R. Concerted transcriptional regulationby BRCA1 and COBRA1 in breast cancer cells. Int J BiolSci. 2007;3(7):486–92.
Allton K, Jain AK, Herz HM, Tsai WW, Jung SY, Qin J, et al.Trim24 targets endogenous p53 for degradation. Proc NatlAcad Sci U S A. 2009;106(28):11612–6.
Andrews S. Babraham bioinformatics - FastQC a quality controltool for high throughput sequence data. 2018. AccessedNovember 9, 2018.
Ard PG, Chatterjee C, Kunjibettu S, Adside LR, Gralinski LE,McMahon SB. Transcriptional regulation of the mdm2 on-cogene by p53 requires TRRAP acetyltransferase complexes.Mol Cell Biol. 2002;22(16):5650–61.
Babicki S, Arndt D, Marcu A, Liang Y, Grant JR, Maciejewski A,et al. Heatmapper: web-enabled heat mapping for all. NucleicAcids Res. 2016;44(W1):W147–53.
Becnel LB, Darlington YF, Ochsner SA, Easton-Marks JR,Watkins CM, McOwiti A, et al. Nuclear receptor signalingatlas: opening access to the biology of nuclear receptorsignaling pathways. PLoS One. 2015;10(9):e0135615.
Benjamini Y, Hochberg Y. Controlling the false discovery rate - apractical and powerful approach to multiple testing. J R StatSoc B. 1995;57(1):289–300.
Cell Biol Toxicol
Blair RM, Fang H, BranhamWS, Hass BS, Dial SL, Moland CL,et al. The estrogen receptor relative binding affinities of 188natural and xenochemicals: structural diversity of ligands.Toxicological sciences : an official journal of the Society ofToxicology. 2000;54(1):138–53.
Bolger R, Wiese TE, Ervin K, Nestich S, Checovich W. Rapidscreening of environmental chemicals for estrogen receptorbinding capacity. Environ Health Perspect. 1998;106(9):551–7.
Bourgon R, Gentleman R, Huber W. Independent filtering in-creases detection power for high-throughput experiments.Proc Natl Acad Sci U S A. 2010;107(21):9546–51.
Bromer JG, Wu J, Zhou Y, Taylor HS. Hypermethylation ofhomeobox A10 by in utero diethylstilbestrol exposure: anepigenetic mechanism for altered developmental program-ming. Endocrinology. 2009;150:3376–82.
Castet A, Boulahtouf A, Versini G, Bonnet S, Augereau P, VignonF, et al. Multiple domains of the receptor-interacting protein140 contribute to transcription inhibition. Nucleic Acids Res.2004;32(6):1957–66.
Cavailles V, Dauvois S, L'Horset F, et al. Nuclear factor RIP140modulates transcriptional activation by the estrogen receptor.EMBO J. 1995;14(15):3741–51.
Chen S, Zhou D, Yang C, Sherman M. Molecular basis for theconstitutive activity of estrogen-related receptor alpha-1. JBiol Chem. 2001;276(30):28465–70.
Chen M, Yeh CR, Chang HC, Vitkus S,Wen XQ, Bhowmick NA,et al. Loss of epithelial oestrogen receptor alpha inhibitsoestrogen-stimulated prostate proliferation and squamousmetaplasia via in vivo tissue selective knockout models. JPathol. 2012;226(1):17–27.
Collins MD, Mao GE. Teratology of retinoids. Annu RevPharmacol Toxicol. 1999;39:399–430.
Colton T, Greenberg ER. Epidemiologic evidence for adverse-effects of des exposure during pregnancy. Am Stat.1982;36(3):268–72.
Cornwall GA, Carter MW, Bradshaw WS. The relationship betweenprenatal lethality or fetal weight and intrauterine position in ratsexposed to diethylstilbestrol, zeranol, 3,4,3 ′ ,4 ′-tetrachlorobiphenyl, or cadmium. Teratology. 1984;30(3):341–9.
Couse JF, KorachKS. Estrogen receptor-alphamediates the detrimen-tal effects of neonatal diethylstilbestrol (DES) exposure in themurine reproductive tract. Toxicology. 2004;205(1–2):55–63.
Couse JF, Dixon D, Yates M, Moore AB, Ma L, Maas R, et al.Estrogen receptor-alpha knockout mice exhibit resistance to thedevelopmental effects of neonatal diethylstilbestrol exposure onthe female reproductive tract. Dev Biol. 2001;238(2):224–38.
Cui J, YangY, Zhang C,Hu P, KanW, Bai X, et al. FBI-1 functionsas a novel AR co-repressor in prostate cancer cells. Cellularand molecular life sciences : CMLS. 2011;68(6):1091–103.
Demers C, Chaturvedi CP, Ranish JA, Juban G, Lai P, Morle F,et al. Activator-mediated recruitment of the MLL2 methyl-transferase complex to the beta-globin locus. Mol Cell.2007;27(4):573–84.
DeRan M, Pulvino M, Greene E, Su C, Zhao J. Transcriptionalactivation of histone genes requires NPAT-dependent recruit-ment of TRRAP-Tip60 complex to histone promoters duringthe G1/S phase transition.Mol Cell Biol. 2008;28(1):435–47.
Dimopoulou M, Verhoef A, van Ravenzwaay B, Rietjens IM,Piersma AH. Flusilazole induces spatio-temporal expressionpatterns of retinoic acid-, differentiation- and sterol
biosynthesis-related genes in the rat whole embryo culture.Reprod Toxicol. 2016;64:77–85.
Doherty LF, Bromer JG, Zhou Y, Aldad TS, Taylor HS. In uteroexposure to diethylstilbestrol (DES) or bisphenol-A (BPA)increases EZH2 expression in the mammary gland: an epige-netic mechanism linking endocrine disruptors to breast can-cer. Horm Cancer. 2010;1:146–55.
Eudy JD, Yao S, Weston MD, et al. Isolation of a gene encoding anovel member of the nuclear receptor superfamily from thecritical region of Usher syndrome type IIa at 1q41.Genomics. 1998;50(3):382–4.
Ewing B, Green P. Base-calling of automated sequencer tracesusing phred II Error probabilities. Genome Res. 1998;8(3):186–94.
Fujita T, Kobayashi Y, Wada O, Tateishi Y, Kitada L, YamamotoY, et al. Full activation of estrogen receptor alpha activationfunction-1 induces proliferation of breast cancer cells. J BiolChem. 2003;278(29):26704–14.
Garattini E, Bolis M, Garattini SK, Fratelli M, Centritto F, ParoniG, et al. Retinoids and breast cancer: from basic studies to theclinic and back again. Cancer Treat Rev. 2014;40(6):739–49.
Giguere V, Yang N, Segui P, Evans RM. Identification of a new classof steroid hormone receptors. Nature. 1988;331(6151):91–4.
Giusti RM, Iwamoto K, Hatch EE. Diethylstilbestrol revisited: areview of the long-term health effects. Ann Intern Med.1995;122(10):778–88.
Glass CK, Rosenfeld MG. The coregulator exchange in transcrip-tional functions of nuclear receptors. Genes Dev. 2000;14(2):121–41.
Gonzalez TL, Rae JM, Colacino JA, Richardson RJ. Homologymodels of mouse and rat estrogen receptor-α ligand-bindingdomain created by in silicomutagenesis of a human template:molecular docking with 17β-estradiol, diethylstilbestrol, andparaben analogs. Computational Toxicol. 2019;10:1–16.
Gupta C. The role of estrogen receptor, androgen receptor andgrowth factors in diethylstilbestrol-induced programming ofprostate differentiation. Urol Res. 2000;28(4):223–9.
Harris ME, Bohni R, Schneiderman MH, Ramamurthy L,Schumperli D, Marzluff WF. Regulation of histone mRNAin the unperturbed cell cycle: evidence suggesting control attwo posttranscriptional steps. Mol Cell Biol. 1991;11(5):2416–24.
Heberle H, Meirelles GV, da Silva FR, Telles GP, Minghim R.InteractiVenn: a web-based tool for the analysis of setsthrough Venn diagrams. BMC bioinformatics. 2015;16:169.
Heisenberg CP, Houart C, Take-Uchi M, Rauch GJ, Young N,Coutinho P, et al. A mutation in the Gsk3-binding domain ofzebrafish Masterblind/Axin1 leads to a fate transformation oftelencephalon and eyes to diencephalon. Genes Dev.2001;15(11):1427–34.
Holliday DL, Speirs V. Choosing the right cell line for breastcancer research. Breast Cancer Res. 2011;13(4)
HongH,YangL, StallcupMR.Hormone-independent transcriptionalactivation and coactivator binding by novel orphan nuclearreceptor ERR3. J Biol Chem. 1999;274(32):22618–26.
Hsia EY, GoodsonML, Zou JX, PrivalskyML, ChenHW.Nuclearreceptor coregulators as a new paradigm for therapeutictargeting. Adv Drug Deliv Rev. 2010;62(13):1227–37.
Hung HL, Kim AY, Hong W, Rakowski C, Blobel GA.Stimulation of NF-E2 DNA binding by CREB-binding
Cell Biol Toxicol
protein (CBP)-mediated acetylation. J Biol Chem.2001;276(14):10715–21.
IARC. A review of human carcinogens. Part A: pharmaceuticals.IARC Working Group on the Evaluation of CarcinogenicRisks to Humans International Agency for Research onCancer. 2012;100:1–403.
Ichim G, Mola M, Finkbeiner MG, Cros MP, Herceg Z,Hernandez-Vargas H. The histone acetyltransferase compo-nent TRRAP is targeted for destruction during the cell cycle.Oncogene. 2014;33(2):181–92.
Jho EH, Zhang T, Domon C, Joo CK, Freund JN, Costantini F.Wnt/beta-catenin/Tcf signaling induces the transcription ofAxin2, a negative regulator of the signaling pathway. MolCell Biol. 2002;22(4):1172–83.
Kalach JJ, Joly-PharabozMO, Chantepie J, Nicolas B, Descotes F,Mauduit C, et al. Divergent biological effects of estradiol anddiethylstilbestrol in the prostate cancer cell line MOP. JSteroid Biochem Mol Biol. 2005;96(2):119–29.
Kam RK, Deng Y, Chen Y, Zhao H. Retinoic acid synthesis andfunctions in early embryonic development. Cell Biosci.2012;2(1):11.
Kamburov A, Pentchev K, Galicka H, Wierling C, Lehrach H,Herwig R. ConsensusPathDB: toward a more complete pic-ture of cell biology. Nucleic Acids Res. 2011;39(Databaseissue):D712–7.
Kim HJ, Yi JY, Sung HS, Moore DD, Jhun BH, Lee YC, et al.Activating signal cointegrator 1, a novel transcription coac-tivator of nuclear receptors, and its cytosolic localizationunder conditions of serum deprivation. Mol Cell Biol.1999;19(9):6323–32.
Klinge CM. Estrogen receptor interaction with co-activators andco-repressors. Steroids. 2000;65(5):227–51.
Klotz DM, Hewitt SC, Korach KS, Diaugustine RP. Activation ofa uterine insulin-like growth factor I signaling pathway byclinical and environmental estrogens: requirement of estro-gen receptor-alpha. Endocrinology. 2000;141(9):3430–9.
Lang SE, Hearing P. The adenovirus E1A oncoprotein recruits thecellular TRRAP/GCN5 histone acetyltransferase complex.Oncogene. 2003;22(18):2836–41.
Lee SR, Ramos SM, Ko A, Masiello D, Swanson KD, Lu ML,et al. AR and ER interaction with a p21-activated kinase(PAK6). Mol Endocrinol. 2002;16(1):85–99.
Lin CY, Strom A, Vega VB, et al. Discovery of estrogen receptoralpha target genes and response elements in breast tumorcells. Genome Biol. 2004;5(9):R66.
Liu X, Tesfai J, Evrard YA, Dent SY, Martinez E. c-Myc transfor-mation domain recruits the human STAGA complex andrequires TRRAP and GCN5 acetylase activity for transcrip-tion activation. J Biol Chem. 2003;278(22):20405–12.
Liu RZ, Garcia E, Glubrecht DD, Poon HY, Mackey JR, GodboutR. CRABP1 is associated with a poor prognosis in breastcancer: adding to the complexity of breast cancer cell re-sponse to retinoic acid. Mol Cancer. 2015;14:129.
Loudig O, Babichuk C, White J, Abu-Abed S, Mueller C,Petkovich M. Cytochrome P450RAI(CYP26) promoter: adistinct composite retinoic acid response element underliesthe complex regulation of retinoic acid metabolism. MolEndocrinol. 2000;14(9):1483–97.
Luijten M, van Beelen VA, Verhoef A, Renkens MF, vanHerwijnen M, Westerman A, et al. Transcriptomics analysis
of retinoic acid embryotoxicity in rat postimplantation wholeembryo culture. Reprod Toxicol. 2010;30(2):333–40.
Lun AT, Chen Y, Smyth GK. It's DE-licious: a recipe for differen-tial expression analyses of RNA-seq experiments usingquasi-likelihood methods in edgeR. Methods Mol Biol.2016;1418:391–416.
Luo J, Sladek R, Bader JA, Matthyssen A, Rossant J, Giguere V.Placental abnormalities inmouse embryos lacking the orphannuclear receptor ERR-beta. Nature. 1997;388(6644):778–82.
Mark M, Ghyselinck NB, Chambon P. Function of retinoic acidreceptors during embryonic development. Nucl ReceptSignal. 2009;7:e002.
McCarthy DJ, Smyth GK. Testing significance relative to a fold-change threshold is a TREAT. Bioinformatics. 2009;25(6):765–71.
McCarthy DJ, Chen Y, Smyth GK. Differential expression analysisof multifactor RNA-Seq experiments with respect to biologicalvariation. Nucleic Acids Res. 2012;40(10):4288–97.
McKenna NJ, Lanz RB, O'Malley BW. Nuclear receptorcoregulators: cellular and molecular biology. Endocr Rev.1999;20(3):321–44.
McMahon SB, Van Buskirk HA, Dugan KA, Copeland TD, ColeMD. The novel ATM-related protein TRRAP is an essentialcofactor for the c-Myc and E2F oncoproteins. Cell.1998;94(3):363–74.
Mo R, Rao SM, Zhu YJ. Identification of the MLL2 complex as acoactivator for estrogen receptor alpha. J Biol Chem.2006;281(23):15714–20.
Nagao T, Yoshimura S. Early embryonic losses in mice induced bydiethylstilbestrol. Congenital anomalies. 2009;49(4):269–73.
Nam K, Marshall P, Wolf RM, Cornell W. Simulation of thedifferent biological activities of diethylstilbestrol (DES) onestrogen receptor alpha and estrogen-related receptor gamma.Biopolymers. 2003;68(1):130–8.
Narita T, Yamaguchi Y, Yano K, Sugimoto S, Chanarat S,Wada T,et al. Human transcription elongation factor NELF: identifi-cation of novel subunits and reconstitution of the functionallyactive complex. Mol Cell Biol. 2003;23(6):1863–73.
Newbold RR, Padilla-Banks E, Jefferson WN. Adverse effects ofthe model environmental estrogen diethylstilbestrol are trans-mitted to subsequent generations. Endocrinology.2006;147(6 Suppl):S11–7.
Nikov GN, Eshete M, Rajnarayanan RV, Alworth WL.Interactions of synthetic estrogens with human estrogen re-ceptors. J Endocrinol. 2001;170(1):137–45.
Okulicz WC, Johnson LD. The relative binding affinity of dieth-ylstilbestrol to uterine nuclear estrogen receptor: effect ofserum and serum albumin. Proceedings of the Society forExperimental Biology and Medicine Society forExperimental Biology and Medicine. 1987;185(4):478–83.
O'Malley BW, Kumar R. Nuclear receptor coregulators in cancerbiology. Cancer Res. 2009;69(21):8217–22.
Palmer JR, Wise LA, Hatch EE, et al. Prenatal diethylstilbestrolexposure and risk of breast cancer. Cancer epidemiology,biomarkers & prevention : a publication of the AmericanAssociation for Cancer Research, cosponsored by theAmerican Society of Preventive Oncology. 2006;15(8):1509–14.
Patro R, Duggal G, Love MI, Irizarry RA, Kingsford C. Salmonprovides fast and bias-aware quantification of transcript ex-pression. Nat Methods. 2017;14(4):417–9.
Cell Biol Toxicol
Prins GS, Birch L, Couse JF, Choi I, Katzenellenbogen B, KorachKS. Estrogen imprinting of the developing prostate gland ismediated through stromal estrogen receptor alpha: studieswith alphaERKO and betaERKO mice. Cancer Res.2001;61(16):6089–97.
Reed CE, Fenton SE. Exposure to diethylstilbestrol during sensi-tive life stages: a legacy of heritable health effects. Birthdefects research Part C, Embryo today : reviews.2013;99(2):134–46.
Rhinn M, Dolle P. Retinoic acid signalling during development.Development. 2012;139(5):843–58.
Robinson MD, Oshlack A. A scaling normalization method fordifferential expression analysis of RNA-seq data. GenomeBiol. 2010;11(3):R25.
RobinsonMD, Smyth GK.Moderated statistical tests for assessingdifferences in tag abundance. Bioinformatics. 2007;23(21):2881–7.
Robinson MD, McCarthy DJ, Smyth GK. edgeR: a bioconductorpackage for differential expression analysis of digital geneexpression data. Bioinformatics. 2010;26(1):139–40.
Sato K, Fukata H, Kogo Y, Ohgane J, Shiota K, Mori C. Neonatalexposure to diethylstilbestrol alters expression of DNAmeth-yltransferases and methylation of genomic DNA in themouse uterus. Endocr J. 2009;56(1):131–9.
Shelby MD, Newbold RR, Tully DB, Chae K, Davis VL.Assessing environmental chemicals for estrogenicity usinga combination of in vitro and in vivo assays. Environ HealthPerspect. 1996;104(12):1296–300.
Soneson C, Love MI, Robinson MD. Differential analyses forRNA-seq: transcript-level estimates improve gene-level in-ferences. F1000Research. 2015;4:1521.
Sotoca AM, Van den Berg H, Vervoort J, et al. Influence of cellularERalpha/ERbeta ratio on the ERalpha-agonist induced pro-liferation of human T47D breast cancer cells. Toxicologicalsciences : an official journal of the Society of Toxicology.2008;105(2):303–11.
Subramaniam N, Treuter E, Okret S. Receptor interacting proteinRIP140 inhibits both positive and negative gene regulationby glucocorticoids. J Biol Chem. 1999;274(25):18121–7.
Sun J, Watkins G, Blair AL, Moskaluk C, Ghosh S, Jiang WG,et al. Deregulation of cofactor of BRCA1 expression in breastcancer cells. J Cell Biochem. 2008;103(6):1798–807.
Tembe EA, Honeywell R, Buss NE, Renwick AG. All-trans-retinoic acid in maternal plasma and teratogenicity in ratsand rabbits. Toxicol Appl Pharmacol. 1996;141(2):456–72.
Thatcher JE, Isoherranen N. The role of CYP26 enzymes inretinoic acid clearance. Expert Opin Drug Metab Toxicol.2009;5(8):875–86.
Thenot S, Henriquet C, Rochefort H, Cavailles V. Differential inter-action of nuclear receptors with the putative human transcrip-tional coactivator hTIF1. J Biol Chem. 1997;272(18):12062–8.
Thomas C, Gustafsson JA. The different roles of ER subtypes incancer biology and therapy. Nat Rev Cancer. 2011;11(8):597–608.
Titus-Ernstoff L, Hatch EE, Hoover RN, Palmer J, Greenberg ER,Ricker W, et al. Long-term cancer risk in women givendiethylstilbestrol (DES) during pregnancy. Br J Cancer.2001;84(1):126–33.
Turton JA, Willars GB, Haselden JN, Ward SJ, Steele CE, HicksRM. Comparative teratogenicity of nine retinoids in the rat.Int J Exp Pathol. 1992;73(5):551–63.
Vanacker JM, Bonnelye E, Chopin-Delannoy S, Delmarre C,Cavailles V, Laudet V. Transcriptional activities of the orphannuclear receptor ERR alpha (estrogen receptor-related recep-tor-alpha). Mol Endocrinol. 1999a;13(5):764–73.
Vanacker JM, Pettersson K, Gustafsson JA, Laudet V.Transcriptional targets shared by estrogen receptor- relatedreceptors (ERRs) and estrogen receptor (ER) alpha, but notby ERbeta. EMBO J. 1999b;18(15):4270–9.
Vincek AS, Patel J, Jaganathan A, et al. Inhibitor of CBP histoneacetyltransferase downregulates p53 activation and facilitatesmethylation at lysine 27 on histone H3. Molecules.2018;23(8).
Wang S, Houtman R, Melchers D, Aarts J, Peijnenburg A, vanBeuningen R, et al. A 155-plex high-throughput in vitrocoregulator binding assay for (anti-)estrogenicity testing evalu-ated with 23 reference compounds. Altex. 2013;30(2):145–57.
Wardell RE, Seegmiller RE, Bradshaw WS. Induction of prenataltoxicity in the rat by diethylstilbestrol, zeranol, 3,4,3′,4′,-tetrachlorobiphenyl, cadmium, and lead. Teratology.1982;26(3):229–37.
Warita K, Mitsuhashi T, Sugawara T, Tabuchi Y, Tanida T, WangZY, et al. Direct effects of diethylstilbestrol on the geneexpression of the cholesterol side-chain cleavage enzyme(P450scc) in testicular Leydig cells. Life Sci. 2010;87(9–10):281–5.
Willhite CC, Dawson MI, Reichert U. Receptor-selective retinoidagonists and teratogenic activity. Drug Metab Rev.1996;28(1–2):105–19.
Yamaguchi Y, Takagi T, Wada T, Yano K, Furuya A, Sugimoto S,et al. NELF, a multisubunit complex containing RD, cooper-ates with DSIF to repress RNA polymerase II elongation.Cell. 1999;97(1):41–51.
Yang Y. Wnt signaling in development and disease. Cell & bio-science. 2012;2(1):14.
Yoo HM, Kang SH, Kim JY, Lee JE, Seong MW, Lee SW, et al.Modification of ASC1 by UFM1 is crucial for ERalphatransactivation and breast cancer development. Mol Cell.2014;56(2):261–74.
Yoon HG, Chan DW, Reynolds AB, Qin J, Wong J. N-CoRmediates DNA methylation-dependent repression through amethyl CpG binding protein Kaiso. Mol Cell. 2003;12(3):723–34.
Zerbino DR, Achuthan P, Akanni W, Amode MR, Barrell D, BhaiJ, et al. Ensembl 2018. Nucleic Acids Res. 2018;46(D1):D754–61.
Zhang M, Siedow M, Saia G, Chakravarti A. Inhibition of p21-activated kinase 6 (PAK6) increases radiosensitivity of pros-tate cancer cells. Prostate. 2010;70(8):807–16.
Zhang H, Yao Y, Chen Y, et al. Crosstalk between AhR and wnt/beta-catenin signal pathways in the cardiac developmentaltoxicity of PM2.5 in zebrafish embryos. Toxicology.2016;355–356:31–8.
Zhao MH, Liang S, Kim NH, Cui XS. MLL2 is essential forporcine embryo development in vitro. In vitro cellular &developmental biology Animal. 2016;52(6):699–704.
Publisher’s note Springer Nature remains neutral with regard tojurisdictional claims in published maps and institutionalaffiliations.
Cell Biol Toxicol


![Ba^QdPc E RPW lPMcW^] - Farnell element145 P^\_McWOWZWch 5 § 5 @^ §@^ BVhbWPMZ EWjR HI g : g 5 I \\ ?MW] J J 7a^]c E_RMYRa J J 4R]cRa E_RMYRa J J DRMa E_RMYRa J J EdOf^^SRa g g 5WbP](https://static.fdocument.org/doc/165x107/5f62e0104f48cc34e33e05f9/baqdpc-e-rpw-lpmcw-farnell-5-pmcwowzwch-5-5-bvhbwpmz-ewjr-hi.jpg)


![N arXiv:1805.00075v1 [math.NT] 30 Apr 2018 · j˝ ˙ n(˝)j](https://static.fdocument.org/doc/165x107/5edf398dad6a402d666a92f1/n-arxiv180500075v1-mathnt-30-apr-2018-j-nj.jpg)


![N J> J arXiv:1907.13502v3 [math.GT] 27 Apr 2021 N M](https://static.fdocument.org/doc/165x107/62536839a8e45f5afe7ba8d0/n-jgt-j-arxiv190713502v3-mathgt-27-apr-2021-n-m.jpg)