EMU: Evolutionary Map of the Universe WTF? · 2016-06-07 · EMU Project Structure The EMU...
47
EMU: Evolutionary Map of the Universe WTF? The EMU project consists of about 300 scientists in 21 countries http://askap.pbworks.com/TeamMembers
Transcript of EMU: Evolutionary Map of the Universe WTF? · 2016-06-07 · EMU Project Structure The EMU...
EMU: Evolutionary Map of the Universe
WTF?
Brought to you by the EMU teamThe EMU project consists of about
300 scientists in 21 countries
http://askap.pbworks.com/TeamMembers

VLA-NVSS
75% of sky
Rms=450μJy,
res ~ 45 arcsec
~1.8 million galaxies
Uncharted
observational
phase space
5σ Sensitivity (mJy)
ASKAP-EMU
75% of sky
Rms=10μJy,
res ~ 10 arcsec
~70 million galaxies
Would take ~7 years with JVLA

Deep radio image of 75% of the sky (to declination +30°)
Frequency range: 1100-1400 MHz
40 x deeper than NVSS (the largest existing radio survey)
10 μJy rms across the sky
5 x better resolution than NVSS (10 arcsec)
Better sensitivity to extended structures than NVSS
Will detect and image ~70 million galaxies at 20cm
c.f. 2.5 million detected over the entire history of radio-astronomy so far
All data to be processed in pipeline
Images, catalogues, cross-IDs, to be placed in public domain
Survey starts 2017(?)
EMU Overview

How does EMU differ from earlier surveys?1. Scale – increases the number of known radio sources by a factor of ~30
2. Will not be dominated by AGN – about half the galaxies will be normal SF galaxies
3. Ambition – includes:• Cross-identification with optical/IR catalogues
• Ancillary data (redshifts etc)
• Key science projects as an integral part of the project
4. Uses “Large-n astronomy” techniques
5. Explicitly includes “discovering the unexpected”

EMU and its pathfindersATCA – ATLAS
(2006-2013)
6 antennas single-pixel
7 sq deg
Rms=15 μJy
6000 galaxies
ASKAP – EMU
(2017-2018)
30-36 antennas MkII PAF
3π sr
Rms=10 μJy
70 million galaxies
ATCA – ATLAS - SPT
(2013-2016)
6 antennas single-pixel
100 sq deg
Rms=40 μJy
30,000 galaxies
300 clusters?
ASKAP – early science
(2016)
12 antennas MkII PAF
1000 sq deg
Rms=30 μJy
0.5 million galaxies
Comparison: NVSS
3π sr, rms=450 μJy
1.8 million galaxies
ATCA - SCORPIO
(2014-2016)
6 antennas single-pixel
Galactic (b=0)
4 sq deg
Rms=30 μJy
Hundreds of
Galactic objects

The EMU Pathfinder:
ATLAS=Australia Telescope Large Area Survey
7 sq deg to rms=15 μJy
Mao et al. 2010MNRAS.406.2578M

Redshift distribution of EMU sources
Based on SKADS (Wilman et al; 2006, 2008)
<z>=1.1 for SF/SB
<z>=1.9 for AGN

EMU Project StructureThe EMU Management Team• Ray Norris (Project Leader)• Andrew Hopkins & Nick Seymour (Project Scientists)• Anna Kapinska (Project Manager)• Josh Marvil (ASKAP Early Science Team Leader)• Ian Heywood (Project Guru)• Kate Chow (Editor, EMU newsletter)
The EMU's EGG (Emu Genius Group)• The consultative group of ~30 active, involved, EMU members
The EMU team• ~300 team members from 21 countries
Early Science Projects
Development Projects
Collaboration Projects
Key Science Projects
ASKAP Early Science

ASKAP Continuum Early Science~800 hours of ASKAP-12 time, on a shared risk basisConsensus that priority should be given to 3-band observations
• Adds value to – not superseded by - EMU
Expressions of interest were invited, and grouped into fields
Priority provisionally assigned taking into account:• the number and quality of science projects using the field
• Non-commensal projects given max allocation of one field• the extent to which the observation will help debug and commission ASKAP • the extent to which the projects use ASKAPs unique capability, and in
particular the wide field of view• the extent to which the projects helps drive an EMU key science project
Results in:• Cosmology Field: 2000 sq deg, single band, 200 hours• All other fields use 3 bands

Requestedfieldsinclude:
SPT
CDFS
GAMA
ELAIS-S1
COSMOS
Stripe82
Scorpio
Shapley
SPARCS-N
SMC&LMC
Slide Courtesy of Josh Marvil

Current ranked list of fields

EMU Development Projects

Examples of EMU Development ProjectsDevelopers earn co-authorship on key science papers
• Ensure the EMU database satisfies our storage and access needs (both CASDA and value–added, and interactions with other data centres/VO)
• Develop, set up, and implement the data quality/validation process
• Ensure ASKAPSOFT imaging satisfies EMU needs
• See what special imaging is needed for the Galactic Plane
• Ensure ASKAPSOFT source extraction satisfies EMU needs
• Develop algorithms for extraction of diffuse emission
• Develop the self-ID and cross-ID algorithms
• Develop an "optimum photo-z algorithm" for all EMU and an optimum photo-z strategy for those smaller areas of EMU covered by other surveys such as DES
• Develop techniques for Statistical redshifts & Spatial Cross-correlation redshifts
• Explore other EMU applications for Machine Learning
For Level 6 data
For Level 7 dataSee Chiara Ferrari talk on Friday
See Bernd Vollmer talk on Friday

“There’s nothing as useless as a radio source”Really?
Data from Jordan Collier PhD thesis

• We will measure spectroscopic redshifts for only ~2% of EMU sources (WALLABY, TAIPAN, etc)
• Even photometric redshifts are hard to do well (SkyMapper)
But many of our science goals don’t need accurate z’s – they just need a redshift bin
• Several machine-learning algorithms are being tried (e.g. kNN, right)
EMU (Statistical) Redshifts
From Salvato, Zinn, ++ in preparation)

Compact Source Extraction
Initial data challenge study showed existing source extraction algorithms not up to the job.
Need to build on this, identify problems, improve existing algorithms or develop a better one.
Work in progress by Matt, Josh, Andrew.
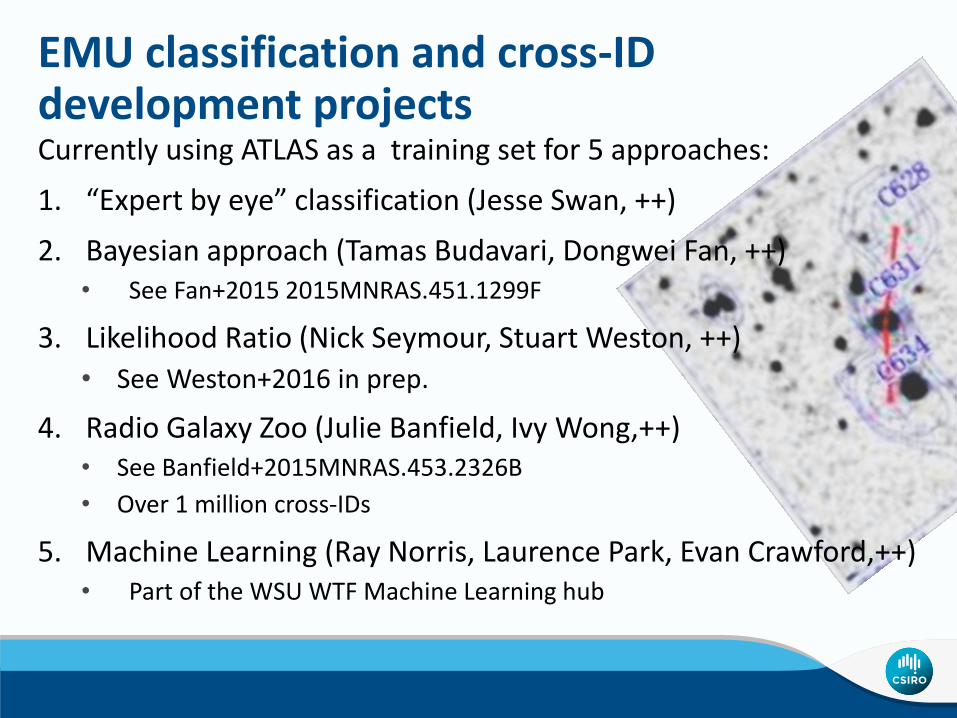
EMU classification and cross-ID development projectsCurrently using ATLAS as a training set for 5 approaches:
1. “Expert by eye” classification (Jesse Swan, ++)
2. Bayesian approach (Tamas Budavari, Dongwei Fan, ++)• See Fan+2015 2015MNRAS.451.1299F
3. Likelihood Ratio (Nick Seymour, Stuart Weston, ++)
• See Weston+2016 in prep.
4. Radio Galaxy Zoo (Julie Banfield, Ivy Wong,++)• See Banfield+2015MNRAS.453.2326B
• Over 1 million cross-IDs
5. Machine Learning (Ray Norris, Laurence Park, Evan Crawford,++)• Part of the WSU WTF Machine Learning hub

Cross-identification and Classification

New result from Radio Galaxy Zoo: citizen scientists discover Giant WAT + cluster
Banfield+2016,
MNRAS, in press
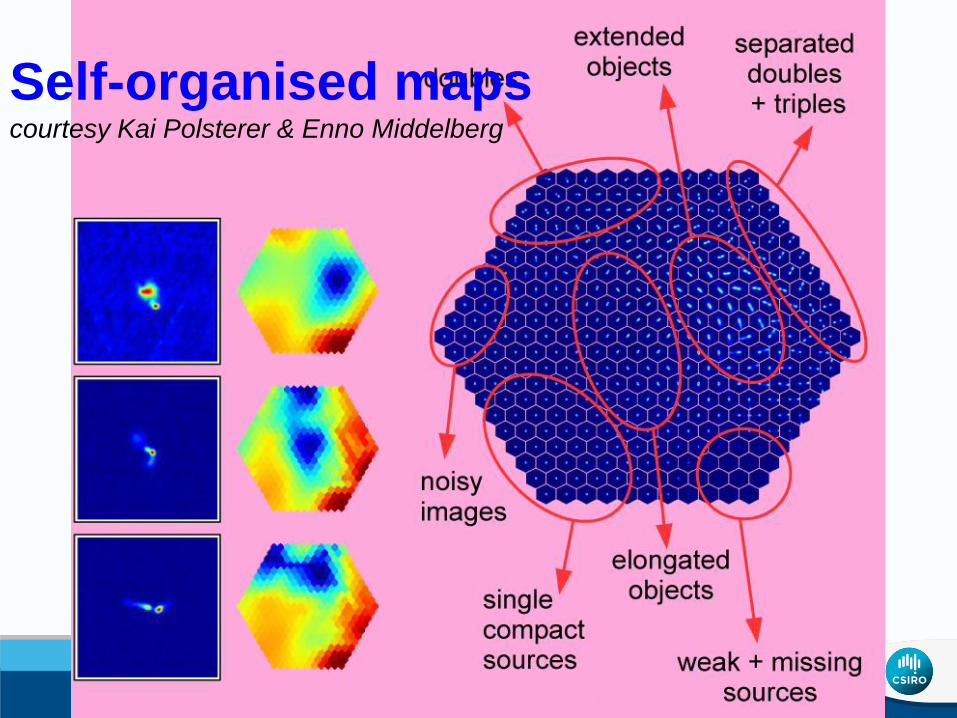
Self-organised mapscourtesy Kai Polsterer & Enno Middelberg

EMU Collaboration Projects

Examples of EMU Collaboration ProjectsMeerkat-MIGHTEE Ray Norris
eROSITA Nicolas Clerc et al.
SkyMapper Julie Banfield
WISE Tom Jarrett
VHS (TBD)
LSST Amy Kimball
MWA (TBD)
Taipan Ray Norris
DES/OZ-DES Nick Seymour
POSSUM (TBD)
XXL Vernesa Smolcic
Radio Galaxy Zoo Julie Banfield
FP7-HELP (TBD)
CTA (TBD)

EMU Key Science Projects

EMU Key Science Projects Project Leaders
EMU Value-Added Catalogue Nick Seymour
Characterising the Radio Sky Ian Heywood
EMU Cosmology David Parkinson
Cosmic Web Shea Brown
Clusters of GalaxiesMelanie Johnston-Hollitt
& Chiara Ferrari
Cosmic star formation history Andrew Hopkins
Radio-loud AGN Anna Kapinska
Radio AGN in the EoR Jose Afonso
Radio-quiet AGN Isabella Prandoni
Local UniverseJosh Marvil,
Michael Brown
The Galactic Plane Roland Kothes
SCORPIO: Radio Stars Grazia Umana
WTF: Mining Data for the Unexpected Ray Norris
See Shea Brown/Tessa Vernstrom talks on Thursday
See Francesco Cavallero talk on Friday

EMU Cosmology(leader: David Parkinson)

The four probes of EMU Cosmology(“large-n” cosmology)
1. “Auto-correlations of radio data
-> spatial power spectrum
2. Cross-correlation between (z<0.5) optical foreground galaxies and (<z>~1.5) EMU galaxies
-> cosmic magnification at low z
Only needs 2 redshift bins
3. Cross-correlation between EMU galaxies and CMB (θ < 1°)
-> cosmic magnification at high z
Doesn’t need redshifts
Good match to EMU
4. Cross-correlation between EMU density and CMB (θ ~ 10°)
– Using Integrated Sachs-Wolfe effect
– Standard ΛCDM predicts no high-z ISW
– Massive neutrinos do predict high-z ISW

Cosmic Magnification
Don’t need to know individual z’s, just the z-distribution
BUT do need to ensure there is no overlap between samples

Modified Gravity from ISW (assuming no redshifts)
See Raccanelli et al. ArXiv 1108.0930

Non-gaussianityRaccanelli et al., 2014, arXiv1406.0010

Progress report from PhD student Glen ReesE.g Spatial autocorrelation function on ATLAS-SPT
Multiple radio components
Clustering/cosmology (ΛCDM)
NVSS
SPT

Clusters KSP(leaders: Chiara Ferrari & Melanie Johnston-Hollitt)
Abstract: radio observations are really good at tracing the properties of clusters. But our current small, biased,
samples may be misleading us. EMU will detect> 100,000 clusters.

Kaustuv Basu (Uni. Bonn) suggests that up to 80% of clusters may contain halos
Ref: Basu, K. 2012, MNRAS, 421; Sommer, M. W. & Basu, K. 2014, MNRAS, 437Kaustuv Basu (AIfA, Universität Bonn)
Statistics of radio halos in galaxy clusters
Radio halos in galaxy clusters are Mpc scale diffuse synchrotron sources. Current ly we don’ t know exact ly what fract ion of clusters host radio halos, and what is their distribut ion with cluster masses and redshift .
Need complete radio data for large and stat ist ically representat ive galaxy cluster samples. Current ly the radio analysis part had been possible only
with the NVSS data (Sommer & Basu 2014 ).
NVSS based results are noisy,
but hints at a promising and interest ing new discovery:
up to ~80% of massive clusters
might be hosting radio halos!
Data from the ASKAP/ EMU survey, with 40 t imes more sensit ivity than NVSS and much better spatial dynamic range,
will settle this question
comprehensively. We will get
radio halo stat ist ics of large cluster samples, like that from the SPT survey, out to z~1.
known radio halos
Results based on
NVSS data
Clusters selected from the Planck sample
Proposed
EMU Early
Science
Project 22
Ra
dio
ha
lo l
um
ino
sit
ya
t 1
.4 G
Hz
SZ signal (mass proxy)

Andrew O’Brien (Western Sydney Uni) has shown that head-tail galaxies trace a different population
of clusters from S-Z in the SPT field.
23h0023h300h00
-60
-58
-56
-54
-52
-50
BTGs
SPT Clusters

Tiziana Venturi++ plans to study nearby Shapley clusters in ASKAP Early Science

EMU Radio-quiet AGN KSP
(Leader: Isabella Prandoni- also see her talk on Monday)

Evidence that accretion dominates the radio emission in RQQs
Sarah White (ICRAR, Curtin University), Matt Jarvis (Oxford), Boris Häußler (ESO), Natasha Maddox (ASTRON),Eleni Kalfountzou (ESA),Martin Hardcastle (Herts)

mining radio survey data for the unexpected
WTF = Widefield ouTlier Finder

The discovery of pulsars
Jocelyn Bell:
• explored a new area of observational phase space
• knew the instrument well enough to distinguish interference from signal
• observant enough to recognise a sidereal signature
• open minded – prepared for discovery
• within a supportive environment
• persistent
See Bell-Burnell (2009) PoS(sps5)014 for a personal perspective

Could Jocelyn Bell Discover the Unexpected in ASKAP data?
• Data volumes are huge – cannot sift by eye
• Instrument is complex – no single individual will be familiar with all possible artifacts
• ASKAP will be superb at answering well-defined questions (the “known unknowns”)
• Humans won’t be able to find the “unknown unknowns”
• Can we mine data for the unexpected, by rejecting the expected?
If not, ASKAP will not reach its full potential
i.e. it will not deliver value for money

Project Key project
Planned? Nat.Geo. topten?
Highly cited?
Nobel prize?
Use Cepheids to improve value of H0 ✔ ✔ ✔ ✔
study intergalactic medium withuv spectroscopy
✔ ✔
Medium-deep survey ✔ ✔
Image quasar host galaxies ✔ ✔
Measure SMBH masses ✔ ✔
Exoplanet atmospheres ✔ ✔
Planetary Nebulae ✔ ✔
Discover Dark Energy ✔ ✔ ✔
Comet Shoemaker-Levy ✔
Deep fields (HDF, HDFS, UDF, FF, etc) ✔ ✔
Proplyds in Orion ✔
GRB Hosts ✔
Discoveries with HST
from Norris et al. 2013: arXiv1210.7521

Mining large data sets for the unexpected
WTF will work by searching the n-dimensional (large n) phase space of observables, using techniques (both supervised and unsupervised) such as
Neural nets
self-organised maps
Decision tree approach
Zoo approach
Cluster analysis
k-nearest-neighbours
Bayesian approaches
Identified objects/regions will be either
processing artifacts (important for quality control)
statistical outliers of known classes of object (interesting!)
New classes of object (WTF)
Quasars
Spiral galaxies
WTF?
Instrumental errors

WTF Phase 1 • Received a grant from Amazon Web Services to develop
WTF on the AWS cloud platform
• Goals: • Implement WTF, initially as an open challenge (c.f. Kaggle)
• Evaluate AWS platform as a collaborative research environment
• Approach
• Set up challenges consisting of data (images or tables) with embedded “EMU eggs”
• Data include both simulations and real data
• Invite ML and other algorithm groups to discover the EMU eggs
• Develop visualisation tools to understand the process and data
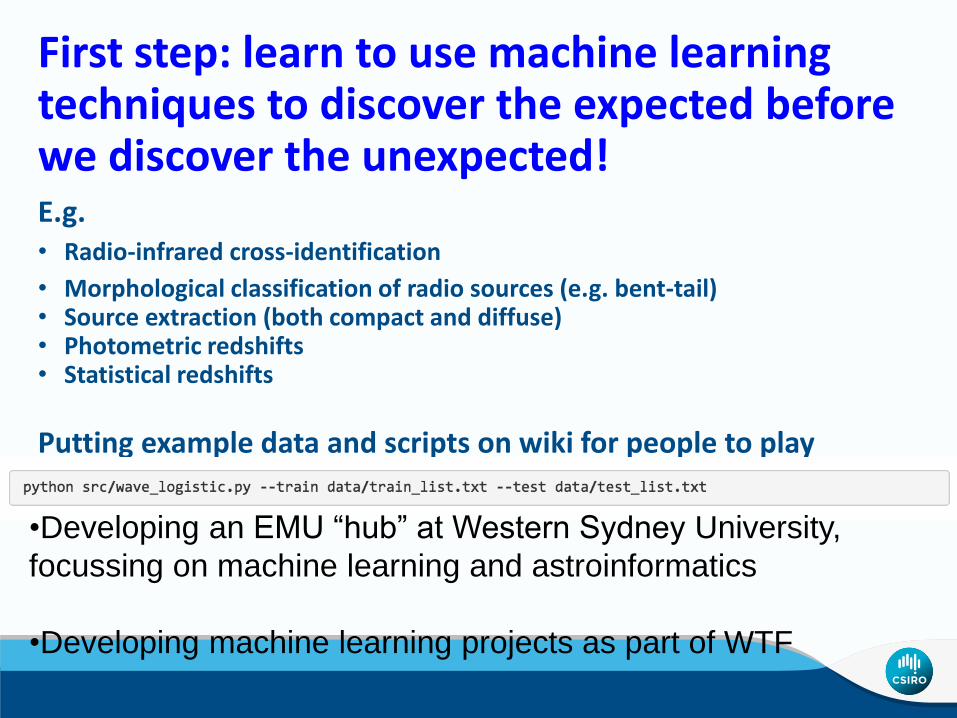
First step: learn to use machine learning techniques to discover the expected before we discover the unexpected!E.g.• Radio-infrared cross-identification
• Morphological classification of radio sources (e.g. bent-tail)• Source extraction (both compact and diffuse)• Photometric redshifts• Statistical redshifts
Putting example data and scripts on wiki for people to play
•Developing an EMU “hub” at Western Sydney University,
focussing on machine learning and astroinformatics
•Developing machine learning projects as part of WTF

Western Australia
See our newsletter on
http://tinyurl.com/emunews
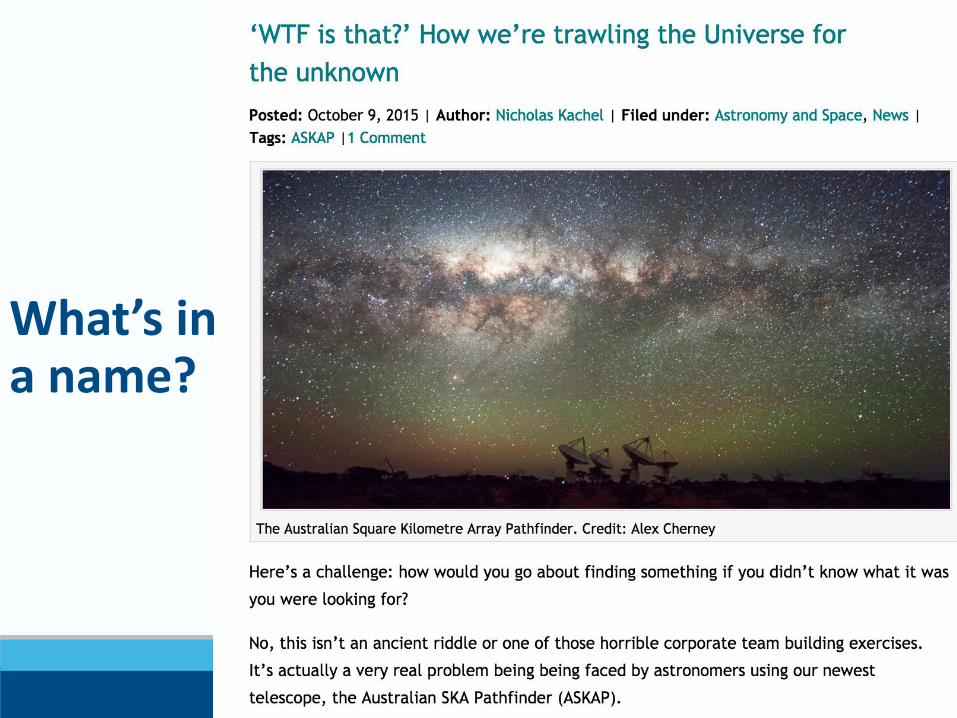
What’s in a name?

What’s in a name?