eeloen | Suleenar...
9
Figure S1. Cre recombinase specificity in R26 +/LacZ ;Dermo1 +/Cre and R26 +/LacZ ;Shh +/Cre embryos. Validation of Cre efficiency was performed by breeding Dermo1 Cre mice and Shh Cre mice with Rosa26 reporter mice. (A-D) Cre activity of the Dermo1 Cre allele in E8.5 (A), E9.5 (B) and E12.5 (C) embryos, and in lung (D) from E12.5 embryos as assayed by β-galactosidase staining of R26 +/LacZ ;Dermo1 +/Cre embryos. Cre activity was detected in the allantois (arrow in A) and in the mesenchymal compartment of various tissues (B-C) including the lung (D). No activity was detected in the respiratory epithelium. (E-H) Cre activity of the Shh Cre allele in E9.5 (E), E10.5 (F) embryos, and in lung (G-H) from E12.5 embryos as assayed by β-galactosidase staining of R26 +/LacZ ;Shh +/Cre embryos. Cre activity was seen in endoderm derivatives including lung buds, trachea and esophagus (E-F). At E12.5, β-gal staining was observed in the respiratory epithelium (G-H). E, esophagus; Epi, epithelium; LB, left bud; Mes, mesenchyme; RB, right bud; Tr, trachea. Scale bars: 500 µm (A-C, E-F), 100 µm (D, G-H). Development | Supplementary Material
Transcript of eeloen | Suleenar...
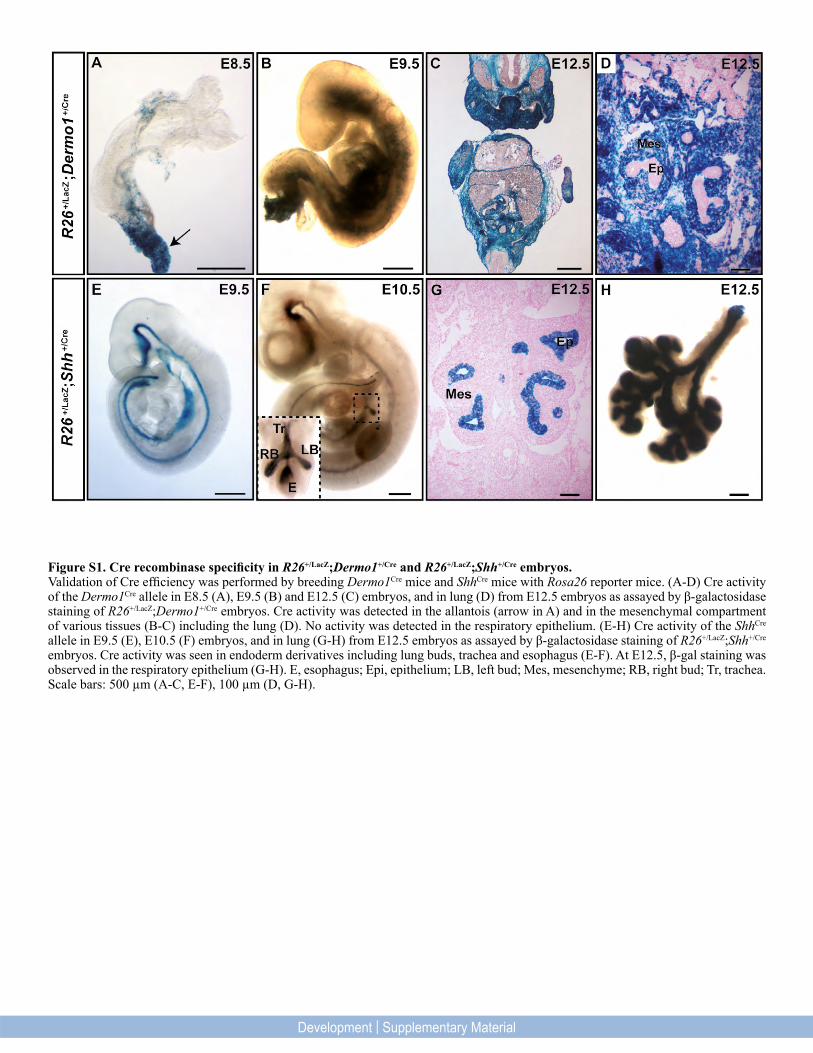
Figure S1. Cre recombinase specificity in R26+/LacZ;Dermo1+/Cre and R26+/LacZ;Shh+/Cre embryos. Validation of Cre efficiency was performed by breeding Dermo1Cre mice and ShhCre mice with Rosa26 reporter mice. (A-D) Cre activity of the Dermo1Cre allele in E8.5 (A), E9.5 (B) and E12.5 (C) embryos, and in lung (D) from E12.5 embryos as assayed by β-galactosidase staining of R26+/LacZ;Dermo1+/Cre embryos. Cre activity was detected in the allantois (arrow in A) and in the mesenchymal compartment of various tissues (B-C) including the lung (D). No activity was detected in the respiratory epithelium. (E-H) Cre activity of the ShhCre allele in E9.5 (E), E10.5 (F) embryos, and in lung (G-H) from E12.5 embryos as assayed by β-galactosidase staining of R26+/LacZ;Shh+/Cre embryos. Cre activity was seen in endoderm derivatives including lung buds, trachea and esophagus (E-F). At E12.5, β-gal staining was observed in the respiratory epithelium (G-H). E, esophagus; Epi, epithelium; LB, left bud; Mes, mesenchyme; RB, right bud; Tr, trachea. Scale bars: 500 µm (A-C, E-F), 100 µm (D, G-H).
Development | Supplementary Material
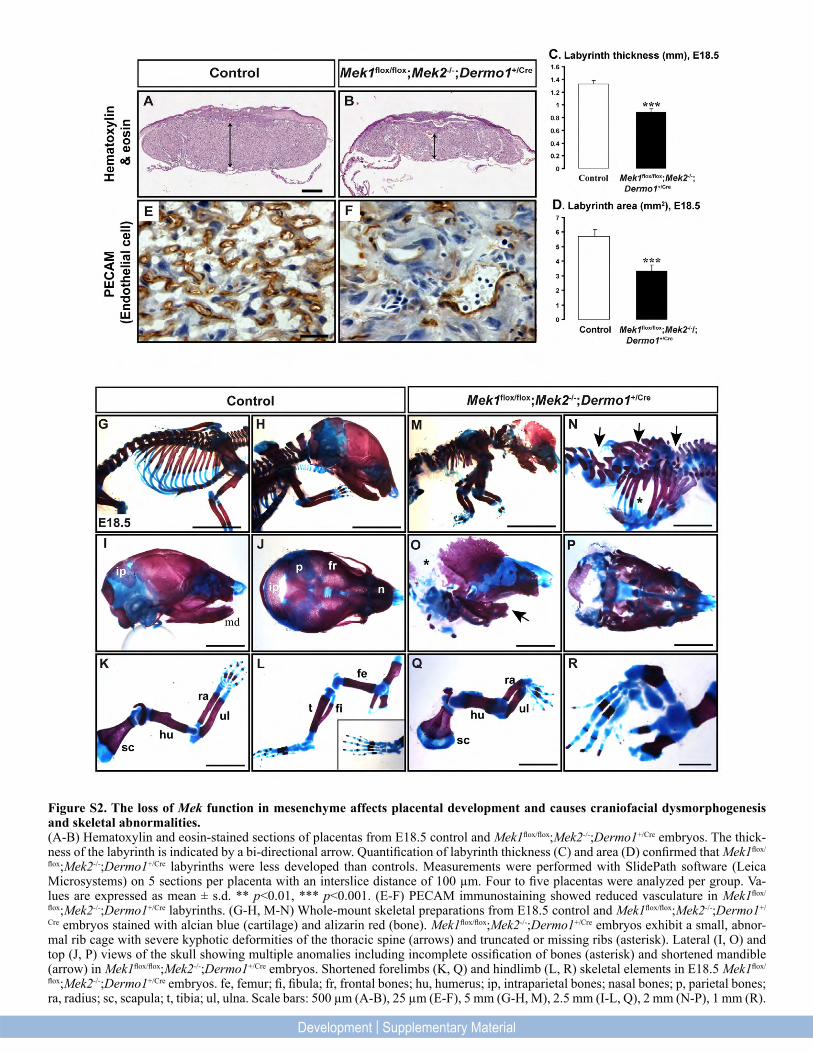
Figure S2. The loss of Mek function in mesenchyme affects placental development and causes craniofacial dysmorphogenesis and skeletal abnormalities. (A-B) Hematoxylin and eosin-stained sections of placentas from E18.5 control and Mek1flox/flox;Mek2-/-;Dermo1+/Cre embryos. The thick-ness of the labyrinth is indicated by a bi-directional arrow. Quantification of labyrinth thickness (C) and area (D) confirmed that Mek1flox/
flox;Mek2-/-;Dermo1+/Cre labyrinths were less developed than controls. Measurements were performed with SlidePath software (Leica Microsystems) on 5 sections per placenta with an interslice distance of 100 µm. Four to five placentas were analyzed per group. Va-lues are expressed as mean ± s.d. ** p<0.01, *** p<0.001. (E-F) PECAM immunostaining showed reduced vasculature in Mek1flox/
flox;Mek2-/-;Dermo1+/Cre labyrinths. (G-H, M-N) Whole-mount skeletal preparations from E18.5 control and Mek1flox/flox;Mek2-/-;Dermo1+/
Cre embryos stained with alcian blue (cartilage) and alizarin red (bone). Mek1flox/flox;Mek2-/-;Dermo1+/Cre embryos exhibit a small, abnor-mal rib cage with severe kyphotic deformities of the thoracic spine (arrows) and truncated or missing ribs (asterisk). Lateral (I, O) and top (J, P) views of the skull showing multiple anomalies including incomplete ossification of bones (asterisk) and shortened mandible (arrow) in Mek1flox/flox;Mek2-/-;Dermo1+/Cre embryos. Shortened forelimbs (K, Q) and hindlimb (L, R) skeletal elements in E18.5 Mek1flox/
flox;Mek2-/-;Dermo1+/Cre embryos. fe, femur; fi, fibula; fr, frontal bones; hu, humerus; ip, intraparietal bones; nasal bones; p, parietal bones; ra, radius; sc, scapula; t, tibia; ul, ulna. Scale bars: 500 µm (A-B), 25 µm (E-F), 5 mm (G-H, M), 2.5 mm (I-L, Q), 2 mm (N-P), 1 mm (R).
Development | Supplementary Material
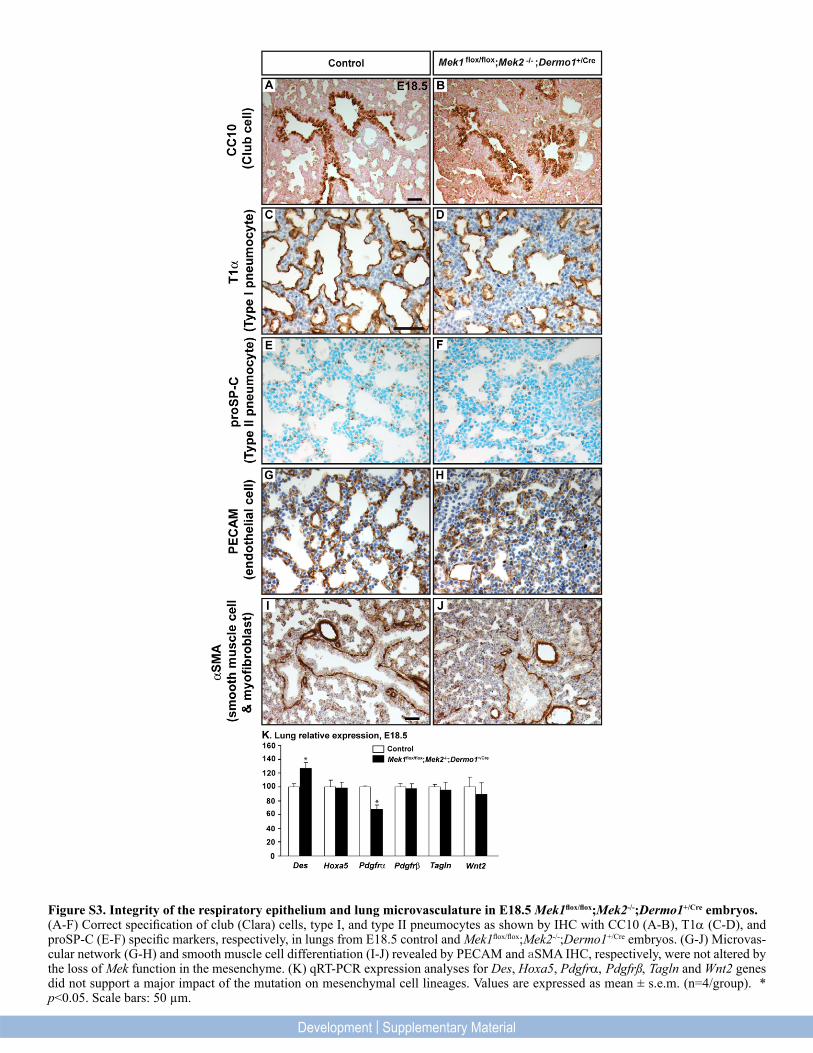
Figure S3. Integrity of the respiratory epithelium and lung microvasculature in E18.5 Mek1flox/flox;Mek2-/-;Dermo1+/Cre embryos. (A-F) Correct specification of club (Clara) cells, type I, and type II pneumocytes as shown by IHC with CC10 (A-B), T1α (C-D), and proSP-C (E-F) specific markers, respectively, in lungs from E18.5 control and Mek1flox/flox;Mek2-/-;Dermo1+/Cre embryos. (G-J) Microvas-cular network (G-H) and smooth muscle cell differentiation (I-J) revealed by PECAM and aSMA IHC, respectively, were not altered by the loss of Mek function in the mesenchyme. (K) qRT-PCR expression analyses for Des, Hoxa5, Pdgfrα, Pdgfrß, Tagln and Wnt2 genes did not support a major impact of the mutation on mesenchymal cell lineages. Values are expressed as mean ± s.e.m. (n=4/group). * p<0.05. Scale bars: 50 µm.
Development | Supplementary Material
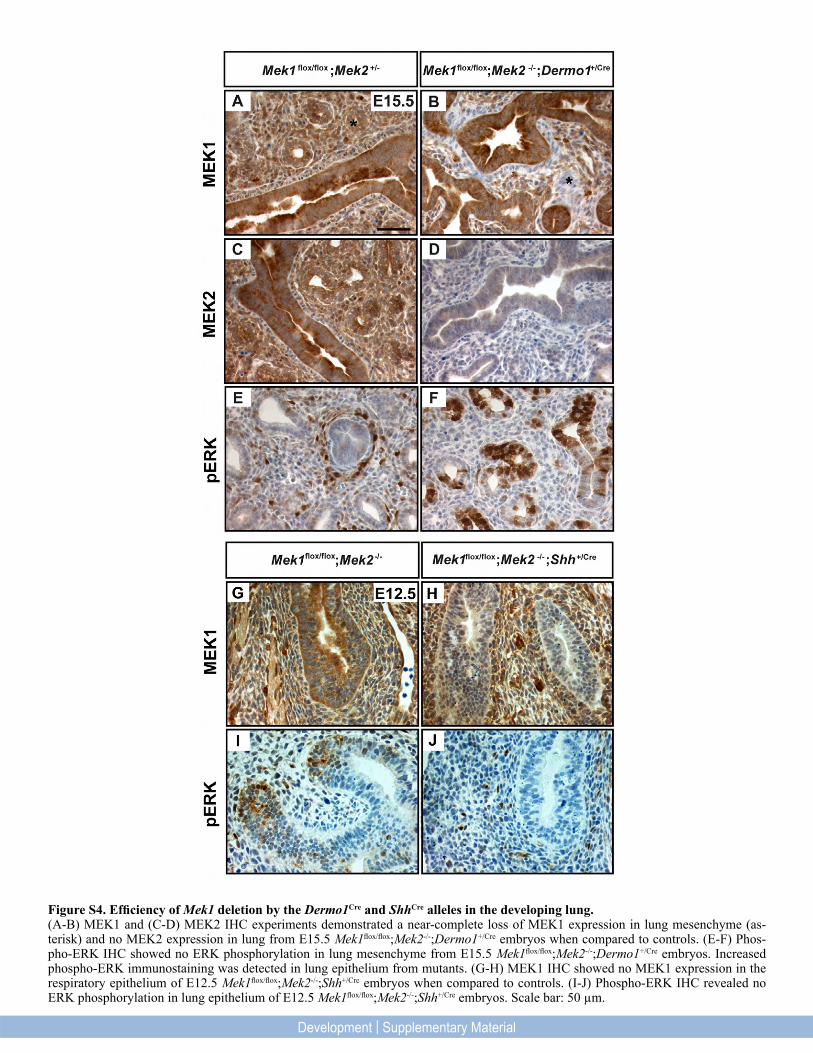
Figure S4. Efficiency of Mek1 deletion by the Dermo1Cre and ShhCre alleles in the developing lung.(A-B) MEK1 and (C-D) MEK2 IHC experiments demonstrated a near-complete loss of MEK1 expression in lung mesenchyme (as-terisk) and no MEK2 expression in lung from E15.5 Mek1flox/flox;Mek2-/-;Dermo1+/Cre embryos when compared to controls. (E-F) Phos-pho-ERK IHC showed no ERK phosphorylation in lung mesenchyme from E15.5 Mek1flox/flox;Mek2-/-;Dermo1+/Cre embryos. Increased phospho-ERK immunostaining was detected in lung epithelium from mutants. (G-H) MEK1 IHC showed no MEK1 expression in the respiratory epithelium of E12.5 Mek1flox/flox;Mek2-/-;Shh+/Cre embryos when compared to controls. (I-J) Phospho-ERK IHC revealed no ERK phosphorylation in lung epithelium of E12.5 Mek1flox/flox;Mek2-/-;Shh+/Cre embryos. Scale bar: 50 µm.
Development | Supplementary Material
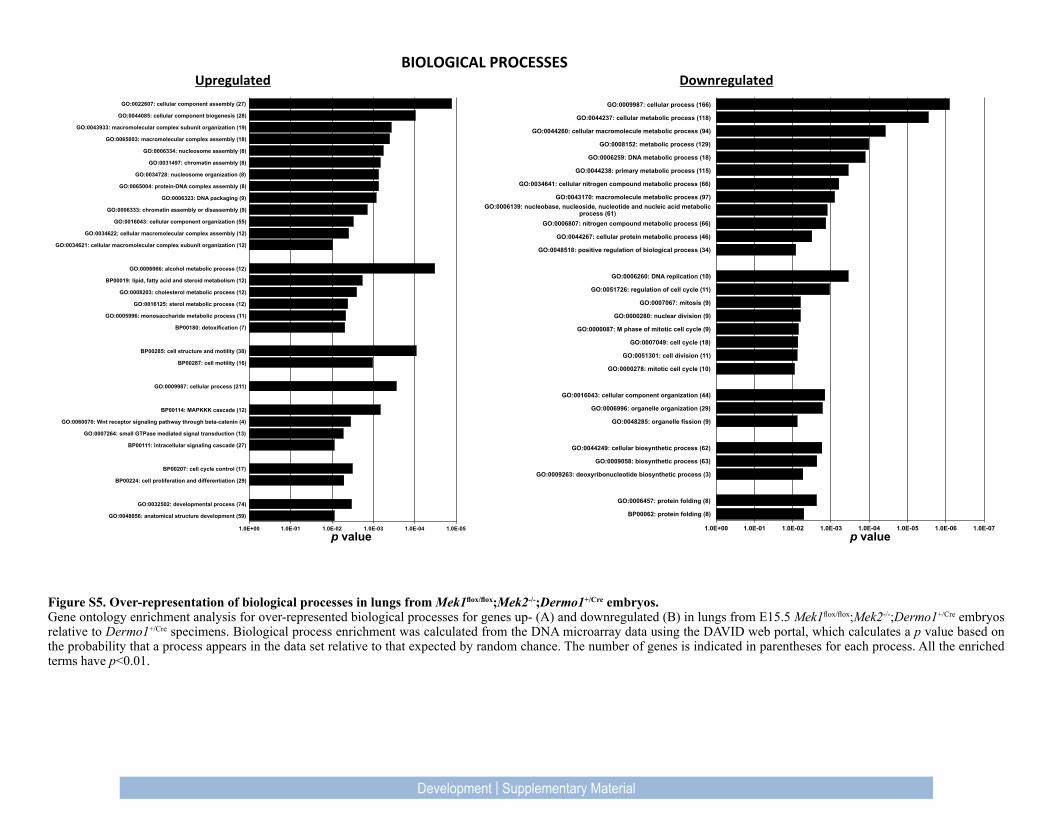
Figure S5. Over-representation of biological processes in lungs from Mek1flox/flox;Mek2-/-;Dermo1+/Cre embryos.Gene ontology enrichment analysis for over-represented biological processes for genes up- (A) and downregulated (B) in lungs from E15.5 Mek1flox/flox;Mek2-/-;Dermo1+/Cre embryos relative to Dermo1+/Cre specimens. Biological process enrichment was calculated from the DNA microarray data using the DAVID web portal, which calculates a p value based on the probability that a process appears in the data set relative to that expected by random chance. The number of genes is indicated in parentheses for each process. All the enriched terms have p<0.01.
1.0E-07 1.0E-06 1.0E-05 1.0E-04 1.0E-03 1.0E-02 1.0E-01 1.0E+00
GO:0009987: cellular process (166)
GO:0044237: cellular metabolic process (118)
GO:0044260: cellular macromolecule metabolic process (94)
GO:0008152: metabolic process (129)
GO:0006259: DNA metabolic process (18)
GO:0044238: primary metabolic process (115)
GO:0034641: cellular nitrogen compound metabolic process (66)
GO:0043170: macromolecule metabolic process (97) GO:0006139: nucleobase, nucleoside, nucleotide and nucleic acid metabolic
process (61) GO:0006807: nitrogen compound metabolic process (66)
GO:0044267: cellular protein metabolic process (46)
GO:0048518: positive regulation of biological process (34)
GO:0006260: DNA replication (10)
GO:0051726: regulation of cell cycle (11)
GO:0007067: mitosis (9)
GO:0000280: nuclear division (9)
GO:0000087: M phase of mitotic cell cycle (9)
GO:0007049: cell cycle (18)
GO:0051301: cell division (11)
GO:0000278: mitotic cell cycle (10)
GO:0016043: cellular component organization (44)
GO:0006996: organelle organization (29)
GO:0048285: organelle fission (9)
GO:0044249: cellular biosynthetic process (62)
GO:0009058: biosynthetic process (63)
GO:0009263: deoxyribonucleotide biosynthetic process (3)
GO:0006457: protein folding (8)
BP00062: protein folding (8)
1.0E-05 1.0E-04 1.0E-03 1.0E-02 1.0E-01 1.0E+00
GO:0022607: cellular component assembly (27)
GO:0044085: cellular component biogenesis (28)
GO:0043933: macromolecular complex subunit organization (19)
GO:0065003: macromolecular complex assembly (18)
GO:0006334: nucleosome assembly (8)
GO:0031497: chromatin assembly (8)
GO:0034728: nucleosome organization (8)
GO:0065004: protein-DNA complex assembly (8)
GO:0006323: DNA packaging (9)
GO:0006333: chromatin assembly or disassembly (9)
GO:0016043: cellular component organization (55)
GO:0034622: cellular macromolecular complex assembly (12)
GO:0034621: cellular macromolecular complex subunit organization (12)
GO:0006066: alcohol metabolic process (12)
BP00019: lipid, fatty acid and steroid metabolism (12)
GO:0008203: cholesterol metabolic process (12)
GO:0016125: sterol metabolic process (12)
GO:0005996: monosaccharide metabolic process (11)
BP00180: detoxification (7)
BP00285: cell structure and motility (38)
BP00287: cell motility (16)
GO:0009987: cellular process (211)
BP00114: MAPKKK cascade (12)
GO:0060070: Wnt receptor signaling pathway through beta-catenin (4)
GO:0007264: small GTPase mediated signal transduction (13)
BP00111: intracellular signaling cascade (27)
BP00207: cell cycle control (17)
BP00224: cell proliferation and differentiation (29)
GO:0032502: developmental process (74)
GO:0048856: anatomical structure development (59)
BIOLOGICAL PROCESSES Upregulated Downregulated
p value p value
Figure S5
Development | Supplementary Material
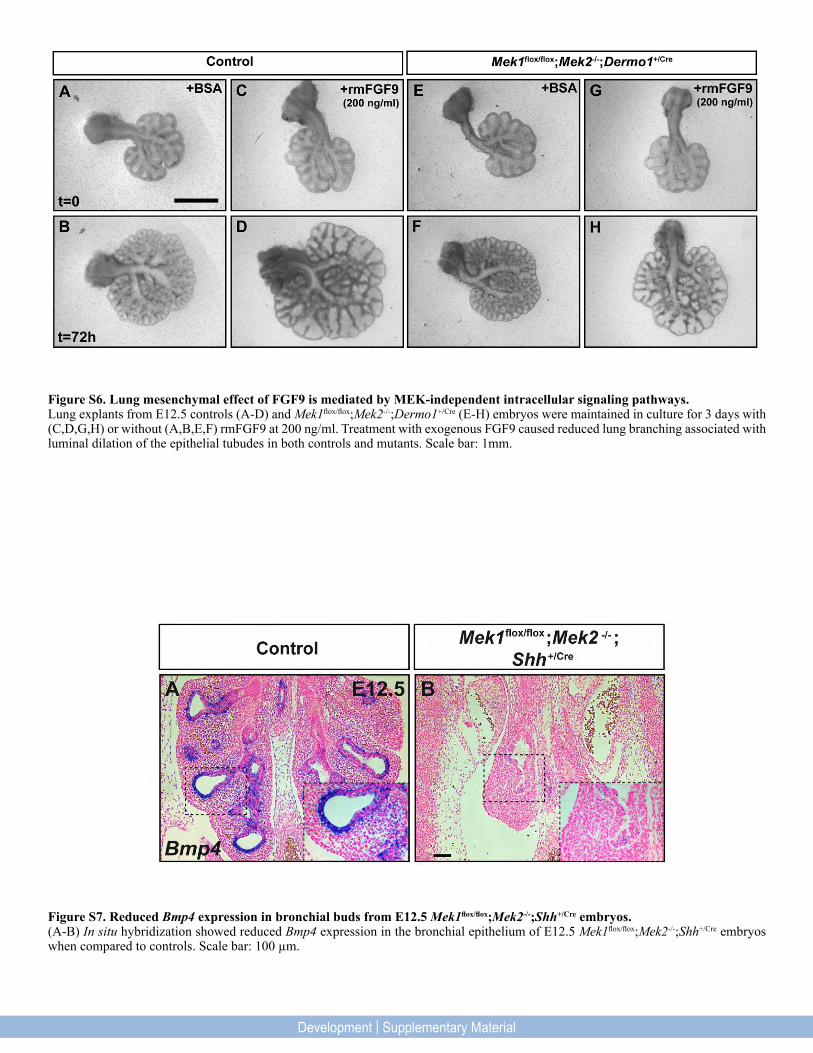
Figure S6. Lung mesenchymal effect of FGF9 is mediated by MEK-independent intracellular signaling pathways. Lung explants from E12.5 controls (A-D) and Mek1flox/flox;Mek2-/-;Dermo1+/Cre (E-H) embryos were maintained in culture for 3 days with (C,D,G,H) or without (A,B,E,F) rmFGF9 at 200 ng/ml. Treatment with exogenous FGF9 caused reduced lung branching associated with luminal dilation of the epithelial tubudes in both controls and mutants. Scale bar: 1mm.
Figure S7. Reduced Bmp4 expression in bronchial buds from E12.5 Mek1flox/flox;Mek2-/-;Shh+/Cre embryos.(A-B) In situ hybridization showed reduced Bmp4 expression in the bronchial epithelium of E12.5 Mek1flox/flox;Mek2-/-;Shh+/Cre embryos when compared to controls. Scale bar: 100 µm.
Development | Supplementary Material
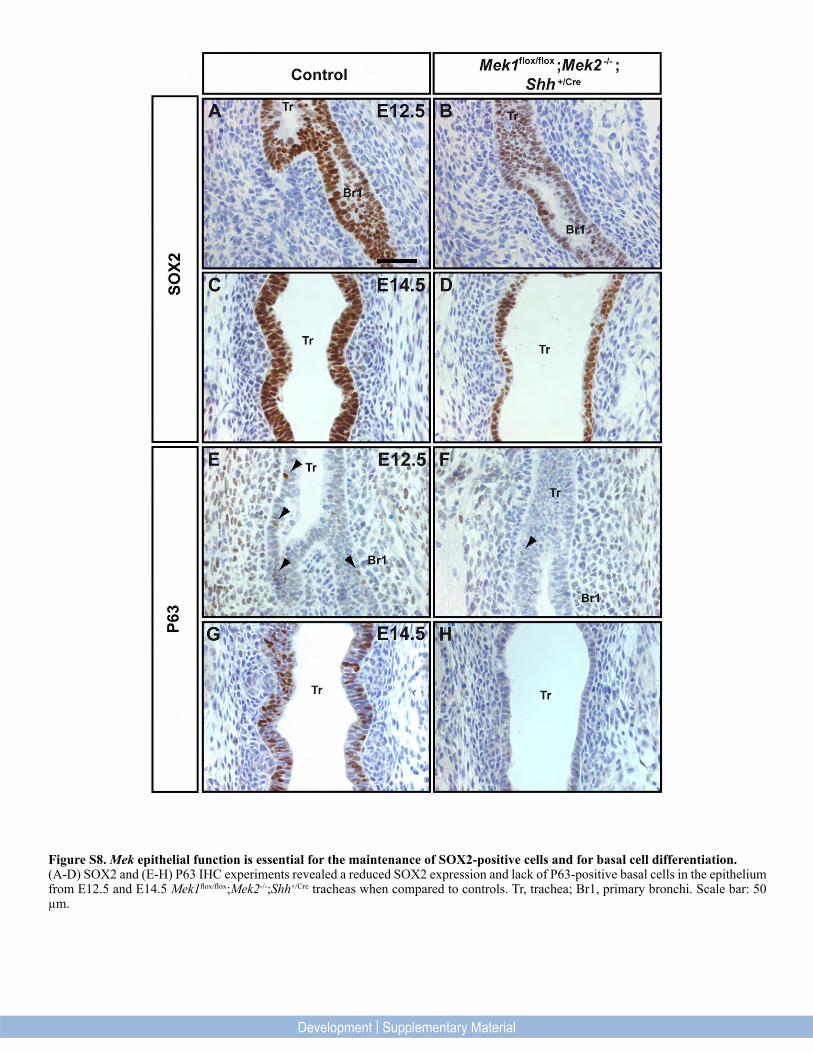
Figure S8. Mek epithelial function is essential for the maintenance of SOX2-positive cells and for basal cell differentiation.(A-D) SOX2 and (E-H) P63 IHC experiments revealed a reduced SOX2 expression and lack of P63-positive basal cells in the epithelium from E12.5 and E14.5 Mek1flox/flox;Mek2-/-;Shh+/Cre tracheas when compared to controls. Tr, trachea; Br1, primary bronchi. Scale bar: 50 µm.
Development | Supplementary Material
Boucherat et al.
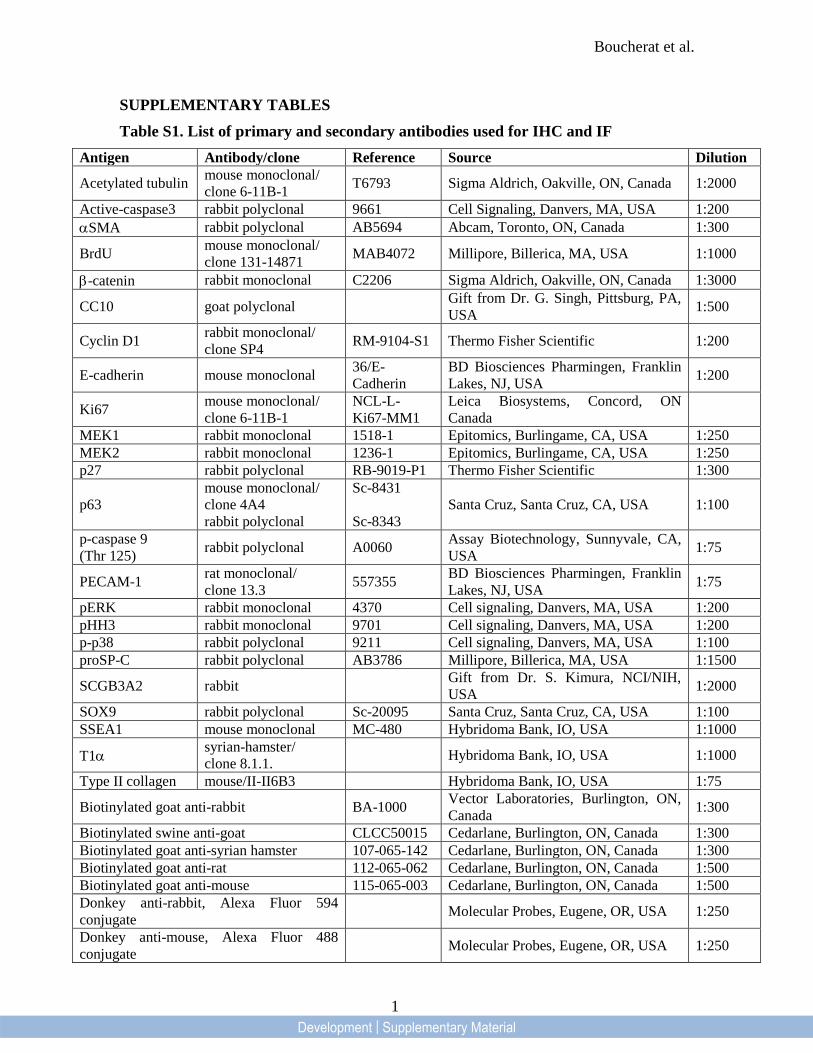
SUPPLEMENTARY TABLES Table S1. List of primary and secondary antibodies used for IHC and IF
Antigen Antibody/clone Reference Source Dilution
Acetylated tubulin mouse monoclonal/ clone 6-11B-1 T6793 Sigma Aldrich, Oakville, ON, Canada 1:2000
Active-caspase3 rabbit polyclonal 9661 Cell Signaling, Danvers, MA, USA 1:200 αSMA rabbit polyclonal AB5694 Abcam, Toronto, ON, Canada 1:300
BrdU mouse monoclonal/ clone 131-14871 MAB4072 Millipore, Billerica, MA, USA 1:1000
β-catenin rabbit monoclonal C2206 Sigma Aldrich, Oakville, ON, Canada 1:3000
CC10 goat polyclonal Gift from Dr. G. Singh, Pittsburg, PA, USA 1:500
Cyclin D1 rabbit monoclonal/ clone SP4 RM-9104-S1 Thermo Fisher Scientific 1:200
E-cadherin mouse monoclonal 36/E-Cadherin
BD Biosciences Pharmingen, Franklin Lakes, NJ, USA 1:200
Ki67 mouse monoclonal/ clone 6-11B-1
NCL-L- Ki67-MM1
Leica Biosystems, Concord, ON Canada
MEK1 rabbit monoclonal 1518-1 Epitomics, Burlingame, CA, USA 1:250 MEK2 rabbit monoclonal 1236-1 Epitomics, Burlingame, CA, USA 1:250 p27 rabbit polyclonal RB-9019-P1 Thermo Fisher Scientific 1:300
p63 mouse monoclonal/ clone 4A4 rabbit polyclonal
Sc-8431 Sc-8343
Santa Cruz, Santa Cruz, CA, USA 1:100
p-caspase 9 (Thr 125) rabbit polyclonal A0060 Assay Biotechnology, Sunnyvale, CA,
USA 1:75
PECAM-1 rat monoclonal/ clone 13.3 557355 BD Biosciences Pharmingen, Franklin
Lakes, NJ, USA 1:75
pERK rabbit monoclonal 4370 Cell signaling, Danvers, MA, USA 1:200 pHH3 rabbit monoclonal 9701 Cell signaling, Danvers, MA, USA 1:200 p-p38 rabbit polyclonal 9211 Cell signaling, Danvers, MA, USA 1:100 proSP-C rabbit polyclonal AB3786 Millipore, Billerica, MA, USA 1:1500
SCGB3A2 rabbit Gift from Dr. S. Kimura, NCI/NIH, USA 1:2000
SOX9 rabbit polyclonal Sc-20095 Santa Cruz, Santa Cruz, CA, USA 1:100 SSEA1 mouse monoclonal MC-480 Hybridoma Bank, IO, USA 1:1000
T1α syrian-hamster/ clone 8.1.1. Hybridoma Bank, IO, USA 1:1000
Type II collagen mouse/II-II6B3 Hybridoma Bank, IO, USA 1:75
Biotinylated goat anti-rabbit BA-1000 Vector Laboratories, Burlington, ON, Canada 1:300
Biotinylated swine anti-goat CLCC50015 Cedarlane, Burlington, ON, Canada 1:300 Biotinylated goat anti-syrian hamster 107-065-142 Cedarlane, Burlington, ON, Canada 1:300 Biotinylated goat anti-rat 112-065-062 Cedarlane, Burlington, ON, Canada 1:500 Biotinylated goat anti-mouse 115-065-003 Cedarlane, Burlington, ON, Canada 1:500 Donkey anti-rabbit, Alexa Fluor 594 conjugate Molecular Probes, Eugene, OR, USA 1:250
Donkey anti-mouse, Alexa Fluor 488 conjugate Molecular Probes, Eugene, OR, USA 1:250
1 Development | Supplementary Material
Boucherat et al.
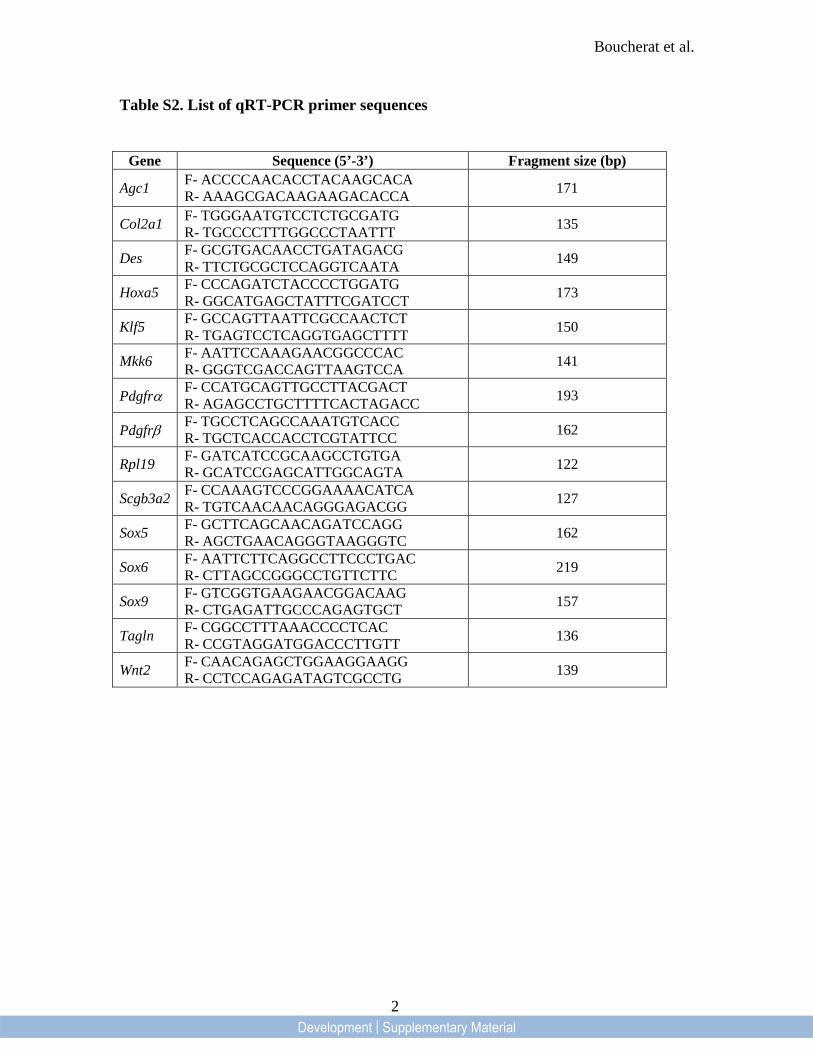
Table S2. List of qRT-PCR primer sequences
Gene Sequence (5’-3’) Fragment size (bp)
Agc1 F- ACCCCAACACCTACAAGCACA R- AAAGCGACAAGAAGACACCA 171
Col2a1 F- TGGGAATGTCCTCTGCGATG R- TGCCCCTTTGGCCCTAATTT 135
Des F- GCGTGACAACCTGATAGACG R- TTCTGCGCTCCAGGTCAATA 149
Hoxa5 F- CCCAGATCTACCCCTGGATG R- GGCATGAGCTATTTCGATCCT 173
Klf5 F- GCCAGTTAATTCGCCAACTCT R- TGAGTCCTCAGGTGAGCTTTT 150
Mkk6 F- AATTCCAAAGAACGGCCCAC R- GGGTCGACCAGTTAAGTCCA 141
Pdgfrα F- CCATGCAGTTGCCTTACGACT R- AGAGCCTGCTTTTCACTAGACC 193
Pdgfrβ F- TGCCTCAGCCAAATGTCACC R- TGCTCACCACCTCGTATTCC 162
Rpl19 F- GATCATCCGCAAGCCTGTGA R- GCATCCGAGCATTGGCAGTA 122
Scgb3a2 F- CCAAAGTCCCGGAAAACATCA R- TGTCAACAACAGGGAGACGG 127
Sox5 F- GCTTCAGCAACAGATCCAGG R- AGCTGAACAGGGTAAGGGTC 162
Sox6 F- AATTCTTCAGGCCTTCCCTGAC R- CTTAGCCGGGCCTGTTCTTC 219
Sox9 F- GTCGGTGAAGAACGGACAAG R- CTGAGATTGCCCAGAGTGCT 157
Tagln F- CGGCCTTTAAACCCCTCAC R- CCGTAGGATGGACCCTTGTT 136
Wnt2 F- CAACAGAGCTGGAAGGAAGG R- CCTCCAGAGATAGTCGCCTG 139
2 Development | Supplementary Material