Development and Evaluation of Mucoadhesive Tablets of Atenolol … · and / or better therapeutic...
8
Received on: 02-10-2014 Accepted on: 30-10-2014 Published on: 23-11-2014 S. S. Gite Department of Pharmaceutics, KCT’S RGS College of Pharmacy, Anjaneri, Nashik, 422 213. Maharashtra, India. Email: [email protected] QR Code for Mobile users DOI: 10.15272/ajbps.v4i37.595 Development and Evaluation of Mucoadhesive Tablets of Atenolol and its Β-Cyclodextrin Complex S. S. Gite*, D. M. Shinkar 1 , R. B. Saudagar 2 1 Department of Pharmaceutics, KCT’S RGS College of Pharmacy, Anjaneri, Nashik, 422 213. Maharashtra, India. 2 Department of Pharmaceutical Chemistry, KCT’S RGS College of Pharmacy, Anjaneri, Nashik, 422 213. Maharashtra, India. Abstract Drug delivery via the buccal mucosa offers a novel route of drug administration. The route has been tried for systemic delivery of a number of drug candidates since it overcomes first pass metabolism, gastrointestinal irritation and bioavailability and also for local delivery of drugs. Atenolol is an antihypertensive agent wildly used as a first line treatment for hypertension. It has half life 6-7 h. The drug is incompletely absorbing about 50 % but most of the absorbed drug reaches to the systemic circulation. Therefore it was planned in this investigation to develop controlled release mucoadhesive buccal tablets containing antihypertensive agent, atenolol to release the drug unidirectionallly in buccal cavity for extended periods of time for improvement in bioavailability, to reduce the dosing frequency and to improve the patient compliance. Also, it was planned to evaluate such mucoadhesive buccal tablets for their various pre-compression and compression characteristics, in vitro drug release kinetics and stability of the dosage forms. Keyword: Mucoadhesive tablet, atenolol, β-cyclodextrin, xanthan gum, carbopol 934p Cite this article as: S. S. Gite, D. M. Shinkar, R. B. Saudagar. Development and Evaluation of Mucoadhesive Tablets of Atenolol and its Β-Cyclodextrin Complex. Asian Journal of Biomedical and Pharmaceutical Sciences; 04 (37); 2014 ,25-32.
Transcript of Development and Evaluation of Mucoadhesive Tablets of Atenolol … · and / or better therapeutic...

Received on: 02-10-2014 Accepted on: 30-10-2014 Published on: 23-11-2014
S. S. Gite Department of Pharmaceutics, KCT’S RGS College of Pharmacy, Anjaneri, Nashik, 422 213. Maharashtra, India. Email: [email protected]
QR Code for Mobile users
DOI: 10.15272/ajbps.v4i37.595
Development and Evaluation of Mucoadhesive Tablets of Atenolol and its Β-Cyclodextrin Complex
S. S. Gite*, D. M. Shinkar1, R. B. Saudagar2 1Department of Pharmaceutics, KCT’S RGS College of Pharmacy, Anjaneri, Nashik, 422 213.
Maharashtra, India. 2 Department of Pharmaceutical Chemistry, KCT’S RGS College of Pharmacy, Anjaneri,
Nashik, 422 213. Maharashtra, India.
Abstract Drug delivery via the buccal mucosa offers a novel route of drug administration. The route has been tried for systemic delivery of a number of drug candidates since it overcomes first pass metabolism, gastrointestinal irritation and bioavailability and also for local delivery of drugs. Atenolol is an antihypertensive agent wildly used as a first line treatment for hypertension. It has half life 6-7 h. The drug is incompletely absorbing about 50 % but most of the absorbed drug reaches to the systemic circulation. Therefore it was planned in this investigation to develop controlled release mucoadhesive buccal tablets containing antihypertensive agent, atenolol to release the drug unidirectionallly in buccal cavity for extended periods of time for improvement in bioavailability, to reduce the dosing frequency and to improve the patient compliance. Also, it was planned to evaluate such mucoadhesive buccal tablets for their various pre-compression and compression characteristics, in vitro drug release kinetics and stability of the dosage forms. Keyword: Mucoadhesive tablet, atenolol, β-cyclodextrin, xanthan gum, carbopol 934p Cite this article as:
S. S. Gite, D. M. Shinkar, R. B. Saudagar. Development and Evaluation of Mucoadhesive Tablets of Atenolol and its Β-Cyclodextrin
Complex. Asian Journal of Biomedical and Pharmaceutical Sciences; 04 (37); 2014 ,25-32.

S.S. Gite et al: Asian Journal of Biomedical and Pharmaceutical Sciences; 4(37) 2014, 25-32.
© Asian Journal of Biomedical and Pharmaceutical Sciences, all rights reserved. Volume 4, Issue 37, 2014. 26
INTRODUCTION Today, a pharmaceutical scientist is well versed with the fact that the overall action of a drug molecule is not merely dependent on its inherent therapeutic activity, rather on the efficiency of its delivery at the site of action. Many drug delivery systems (DDS) are aimed to sustain drug blood concentration and controlling the rate of drug delivery to the target tissue, but mucoadhesion is one of the most prominent and latest systems in the design of buccal drug delivery systems. It prolongs the residence time of the dosage form at the site of application or absorption and facilitates an intimate contact of the dosage form with the underline absorption surface and thus contributes to improved and / or better therapeutic performance of the drug. In recent years many such mucoadhesive drug delivery systems have been developed for oral, buccal, nasal, gastrointestinal, rectal and vaginal routes for both systemic and local effects.1
Oral drug delivery has been known for decades as the most widely utilized route of administration among all the routes that have been explored for the systemic delivery of drugs via various pharmaceutical products of different dosage forms. An ideal DDS should aid in the optimization of drug therapy by delivering an appropriate amount to the intended site and at a desired rate. By and large, a DDS may be employed for spatial placement (i.e. targeting a drug to a specific organ or tissue) or temporal delivery (i.e., controlling the rate of drug delivery to the target tissue). 2
Buccal route provides one of the potential route for typically large, hydrophilic and unstable proteins, oligonucleotide, and polysaccharides as well as conventional small drug molecule. The oral cavity can be used for local and systemic therapy. Examples of local therapy would be the treatment of oral infections, dental caries, mouth ulcers and stomatitis. The buccal route is of particular interest with regard to systemic delivery of small molecule that are subjected to first pass metabolism of protein and peptides.3 Atenolol is a selective β-blocker used for treatment of hypertension. The systemic bioavailability of atenolol following oral administration is 50 %. Over 85% of intravenous dose is excreted in urine within 24 hr compared with 50% of an oral route. Plasma half life of atenolol is 6- 7 hours, molecular weight 266.34, and it does not have objectionable taste.4 Therefore the present work was planned to develop mucoadhesive controlled release tablet of atenolol. Solubility enhancement of drug was done by β-CD complexation which increases the bioavailability of drug. MATERIALS AND METHODS Material Atenolol was provided as gift sample from Blue-cross Pharmaceutical Pvt, Ltd, (Nashik, India). β‐cyclodextrin,
Carbopol 934P, Xanthan gum were obtained from Glenmark pharmaceuticals, (Nashik). Magnesium stearate, talc, mannitol was procured from S.D. fine chemicals Ltd. Biological tissue used The buccal mucosa of goat obtained from local slaughter house. METHODS: Preparation and characterization of β-Cyclodextrin complex 6 Physical mixture The complex was made by two methods kneading and co-precipitation method. The physical mixture of atenolol and β-cyclodextrin in 1:1 and 1:2 molar ratio was prepared by mixing individually components that had previously been sieved through sieve no 60. Kneading method The inclusion complex was prepared by the β-CD, not by dissolving but kneaded like a pest with small amount of water to which the cyclodextrin has been added. Drug component can be dissolved in small amount of methanol in which β-CD has been suspended. After 4 hours of grinding of paste in mortar results in evaporation of solvent and formation of powder like complex. The complex was pulverized and passed through sieve no 100 and stored in dessicator until further use. Co-precipitation method Inclusion complex was prepared by dissolving cyclodextrin in water and drug was dissolved in methanol at room temperature. Different molar ratios that are 1:1 and 1:2 were taken. The mixture was stirred at room temperature, for 1 hr and then slowly evaporated on boiling water bath. The inclusion complex was slowly precipitated as crystalline powder pulverized and passed through sieve no 100 and stored in dessicator till free from any traces of organic solvent. Characterization of atenolol-β-CD complex Phase solubility study 7 Phase solubility study was performed by method previously reported by Higuchi and Connors (1965). Briefly excess amount of atenolol 50 mg were added to 20 ml of aqueous solution. It is vigorously shaken at 25±10 C for 1 day. After equilibrium was attained the sample were filtered through a 0.45 µm Millipore membrane filter and diluted with same solution. The concentration was determined spectrophotomertically, at λmax 224 nm. Infra-red spectrum 8, 9
The studies were carried out using IR 84005 Shimadzu, Japan. The infra red spectrum of atenolol was recorded with KBr disc over the wave number of 4000 to 400 cm-1 by using Infra red spectroscopy.

S.S. Gite et al: Asian Journal of Biomedical and Pharmaceutical Sciences; 4(37) 2014, 25-32.
© Asian Journal of Biomedical and Pharmaceutical Sciences, all rights reserved. Volume 4, Issue 37, 2014. 27
Differential scanning Calorimetry10 The formation of inclusion complex was conformed using a Mettler Toledo differential scanning calorimeter equipped to a computerized data station. The sample of pure drug, physical mixture of complex, and complex prepared by kneading and co-precipitation method was weighed and heated at a scanning rate of 10°C/min between 40 and 200°C and 40 ml/min of nitrogen flow. Powder X-ray diffraction 10
The powder x-ray diffraction was recorded using Bruker AXS, D8, Advance SAIF, Kochi, at 3-80 0 C (2θ) at room temperature. The diffractogram were recorded with a step width 0.020 0 (2θ) and count time 32.8 sec per step.
Preparation of mucoadhesive buccal tablets of atenolol Mucoadhesive tablets of atenolol were prepared by direct compression method. All the ingredients as mention in table 1 were weighed accurately and passed through sieve no.120 and blended thoroughly to obtain uniform mixing. The powder blend were evaluated for its rheological characteristics and then compressed on 10 station pilot press using 8 mm flat faced punches. The machine was adjusted to produce an approximate weight of 200 mg tablet. The composition of all formulation was shown in table 1.
Table 1 : Formulation table for mucoadhesive tablets of atenolol * 650 mg tablet prepared with atenolol: β-CD complex equivalent to 50 mg of atenolol
Evaluation of powder blend 10 There are many formulations and process variables involved in mixing step and all these can affect characteristics of blend produced. Angle of repose, bulk density, true density and percent compressibility index have been measured which are given in table 3. Bulk density Bulk density was determined by placing the powder blend in a measuring cylinder and the total volume was
noted. The weight of powder bed was determined. Bulk density was calculated by using the formula. Bulk density= Total weight of powder/granules Total volume of powder/granules Average of three bulk densities of powder were taken and tabulated. (n = 3). Tapped density The tapped density was obtained by dividing the mass of powder by the tapped volume in cm3. The powder blend carefully introduced into graduated measuring cylinder. The cylinder was tapped on surface 100times from a height of 1 inch. After tapping volume was noted. Tapped density can be calculated by using following formula Tapped density= Mass/ Tapped volume Average of three bulk densities of powder were taken and tabulated. (n = 3). Compressibility index It helps in measuring the force requires to break the friction between the particles and hopper. The flow property of a powder can be easily measured with the help of compressibility. Compressibility index was determined by placing the powder in a measuring cylinder and the volume (V0) was noted before tapping. After 100 tapings again volume (V) was noticed. Compressibility index = (1- V/ V0) X 100 V0 = volume of powder before tapping. V = volume of powder after 100 tappings. Average of three compressibility in-dices of powder readings were taken and tabulated (n = 3). Hausner's ratio It is the ratio of tapped density to bulk density. Hausner's ratio is an ease of powder flow; it is calculated by following formula. Hausner's ratio= Tapped density / Bulk density Angle of repose (°θ) Angle of repose was determined by measuring the height and radius of the heap of the powder bed. A cut stem funnel was fixed to a stand and bottom of the funnel was fixed at a height of 3 cm from the plane. Powder was placed in the funnel and allowed to flow freely. With the help of vernier calibre the height and radius of the heap were measured and noted. Average of triplicate reading were noted (n = 3) tan θ = h /r h = height of heap of powder/granule blend. r = radius of heap of powder/granule blend. Evaluation of mucoadhesive tablets: Weight uniformity: Ten tablets were taken and weighed individually. Average weight was calculated standard deviation was computed.
Formulation Ingredient
F1
F2
F3
F4
F5
F6*
F7*
Atenolol 50 50 50 50 50 - -
β-CD complex equivalent to 50 mg of drug
-
-
-
-
-
476
476
Xanthan gum 40 40 40 60 60 60 60
Carbopol 934 p
- 40 60 40 60 40 40
Talc 2 2 2 2 2 6.5 6.5
Mg stearate 2 2 2 2 2 6.5 6.5
Mannitol 106 66 46 46 26 41 41
Total wt (mg) 200 200 200 200 200 650 650

S.S. Gite et al: Asian Journal of Biomedical and Pharmaceutical Sciences; 4(37) 2014, 25-32.
© Asian Journal of Biomedical and Pharmaceutical Sciences, all rights reserved. Volume 4, Issue 37, 2014. 28
Thickness test: The tablets were evaluated for their thickness using a micrometer. Average of three readings were taken and the results were tabulated (n = 3). Hardness test: The tablets were evaluated for their hardness using Pfizer hardness tester. Average of three reading were taken and tabulated (n = 3). Surface pH: 11 Three tablets were allowed to swell for four hour in simulated saliva fluid . pH was found out by placing the electrode of pH meter just in contact with the surface of the tablets. Average of three readings was computed. Drug content uniformity:13 From each batch three randomly selected tablets were weighed accurately and powdered in a glass mortar with pestle. Powder equivalent to 10 mg of drug was transferred into 10 ml volumetric flask containing 10 ml of pH 6.8 phosphate buffer and kept aside with constant shaking for 24 h to extract the total drug present in the tablet. Then the solution was filtered and the volume was made with phosphate buffer and analyzed for drug content at λmax of 224 nm against drug devoid phosphate buffer as blank. Averages of triplicate readings were taken. The content of drug was calculated using standard graph. Swelling studies: 12
Preparation of simulated saliva solution: Weigh accurately 2.38g of Na2HPO4, 0.19 g KH2PO4, 8.00g NaCl and dissolve in 1000 ml of distilled water to produce simulated saliva solution; finally adjusted the pH with phosphoric acid to 6.75. Three tablets were weighed individually (W1) and immersed in a petridishes containing simulated saliva fluid (pH 6.75) for predetermined times (15min, 30 min,1, 2, 3, 4, 5, 6, 7, 8h). After immersion tablets were wiped off by the excess surface water by the use of filter paper and weighed (W2). The % swelling index was calculated by: % Swelling Index = [W2- W1] / W2 x 100 Where W1 is the initial weight of the tablet and W2 is the weight of the tablet after the particular swelling time interval. Mucoadhesive strength 13 Mucoadhesive strength was conducted on modified physical balance. The equipment was fabricated by us in the laboratory as polypropylene disc (A), also locally fabricated. The apparatus consist of a modified double-beam physical balance in which the right pan has been replaced by a glass slide with copper wire and additional weight, to make the right side weight equal with left side pan. A teflon block of 3.8 cm diameter and 2 cm height was fabricated with an upward portion of 2 cm height and 1.5 cm diameter on one side. This was kept in beaker filled with buffer media pH 6.75, which
was then placed below right side of the balance. The right pan (D) was replaced with a lighter pan so that, the left pan weighs more than the right pan. The lower polypropylene block was intended to hold the mucosal tissue (B) of goat cheek pouch and to be placed in a beaker containing simulated saliva solution pH 6.75 (C). Goat cheek pouch was obtained commercially; the cheek pouch was collected into a sterile container containing sterile buffer solution of pH 6.75. The cheek pouch brought was stored in a refrigerator until use. The following procedure was used for all the test formulations using the above equipment. The cheek pouch was removed from refrigerator and allowed to attain equilibrium with ambient conditions in the laboratory. The goat cheek pouch was carefully excised, without removing connective and adipose tissue and washed with simulated saliva solution. The tissue was stored in fresh simulated saliva solution. Immediately afterwards the membrane was placed over the surface of lower polypropylene cylinder (B) and secured. This assembly was placed into beaker containing simulated saliva solution pH 6.75 at 37 ± 2°C. From each batch, one tablet at a time was taken and stuck to the lower surface of polypropylene cylinder with a standard cynoacrylate adhesive. The beaker containing mucosal tissue secured upon lower cylinder (B), was manipulated over the base of the balance so that, the mucosal tissue is exactly below the upper cylinder (A). The exposed part of the tablet was wetted with a drop of simulated saliva solution, and then a weight of 20 gms was placed above the expanded cap, left for 10 minutes. After which the tablet binds with mucin. The weight was removed. Then slowly and gradually weights were added on the right side pan till the tablet separates from the mucosal surface/ membrane. The weight required for complete detachment is noted (W1) (W1-5.25gm) gives force required for detachment expressed in weight in grams. Procedure was repeated for two more tablets. Average was computed and recorded. In vitro release method for atenolol tablets: 14 The drug release profile was studied using USP dissolution testing apparatus method II using a paddle at 50 rpm. 500ml dissolution fluid, pH 6.8 phosphate buffer, was used and a temperature of 37 ± 0.5°C was maintained. 5ml aliquots at 0 min, 15 min, 30 min, 1h, 2h, 3h, 4h, 5h, 6h, 7h, 8h, 9h, 10h, 11h, 12 h respectively were pipette out and the same volume was replaced with pH 6.8 phosphate buffer . Absorbance was measured at λmax 224nm and from which percentage of atenolol was calculated using calibration curve. The procedure was repeated for three more tablets similarly and average was computed.
S.S. Gite et al: Asian Journal of Biomedical and Pharmaceutical Sciences; 4(37) 2014, 25-32.
© Asian Journal of Biomedical and Pharmaceutical Sciences, all rights reserved. Volume 4, Issue 37, 2014. 29
Drug release kinetics: 15, 16, 17
In the present work the data obtained from drug release was fitted to various kinetic equations to find the mechanism of drug release from controlled release mucoadhesive tablets. Stability studies 18 The mucoadhesive tablets were subjected for a period of three months as per ICH guideline at the 400C temperature and relative humidity 75% RH. The samples were withdrawn at 7 days, 15 days, 1, 2, 3 months for given temperature condition. The formulations were evaluated mainly for drug content at the predetermined intervals. RESULT AND DISCUSSION Phase solubility study: The solubility of atenolol and its β- cyclodextrin complex was taken in solvent like water and pH 6.8 phosphate buffer. The Solubility of pure drug in water was 1.0588 mg/ml and in pH 6.8 phosphate buffer 1.018 mg/ml. Complex prepared by 1:2 ratio shows greater solubility than 1:1. Hence 1:2 ratio were selected for further tablet compression of optimized batches. 1:1 Ratio 1:2 Ratio
Solvent used Water (mg/ml)
pH 6.8 phosphate
buffer (mg/ml)
Water (mg/ml)
pH 6.8 phosphate
buffer (mg/ml)
Drug 1.0588 1.018 1.0588 1.0188
Complex by kneading method
2.64 2.81 2.75 2.88
Complex by co-precipitation
method 2.51 2.95 2.91 2.96
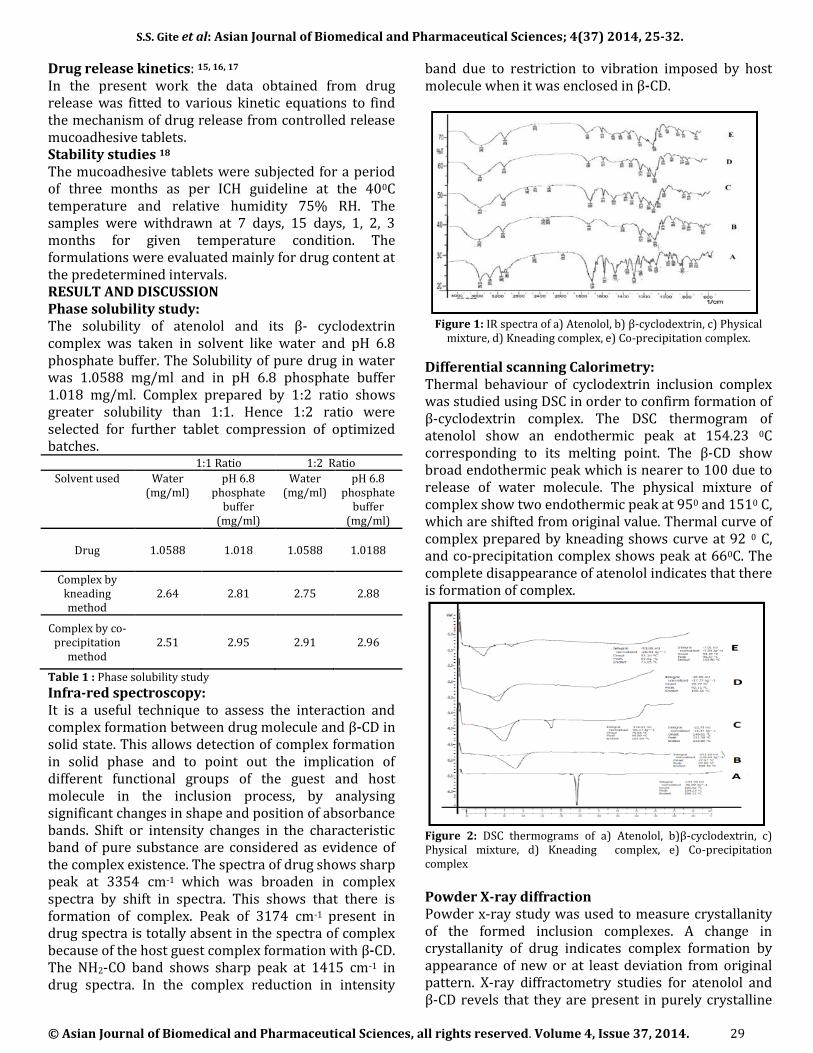
Table 1 : Phase solubility study Infra-red spectroscopy: It is a useful technique to assess the interaction and complex formation between drug molecule and β-CD in solid state. This allows detection of complex formation in solid phase and to point out the implication of different functional groups of the guest and host molecule in the inclusion process, by analysing significant changes in shape and position of absorbance bands. Shift or intensity changes in the characteristic band of pure substance are considered as evidence of the complex existence. The spectra of drug shows sharp peak at 3354 cm-1 which was broaden in complex spectra by shift in spectra. This shows that there is formation of complex. Peak of 3174 cm-1 present in drug spectra is totally absent in the spectra of complex because of the host guest complex formation with β-CD. The NH2-CO band shows sharp peak at 1415 cm-1 in drug spectra. In the complex reduction in intensity
band due to restriction to vibration imposed by host molecule when it was enclosed in β-CD.
Figure 1: IR spectra of a) Atenolol, b) β-cyclodextrin, c) Physical
mixture, d) Kneading complex, e) Co-precipitation complex.
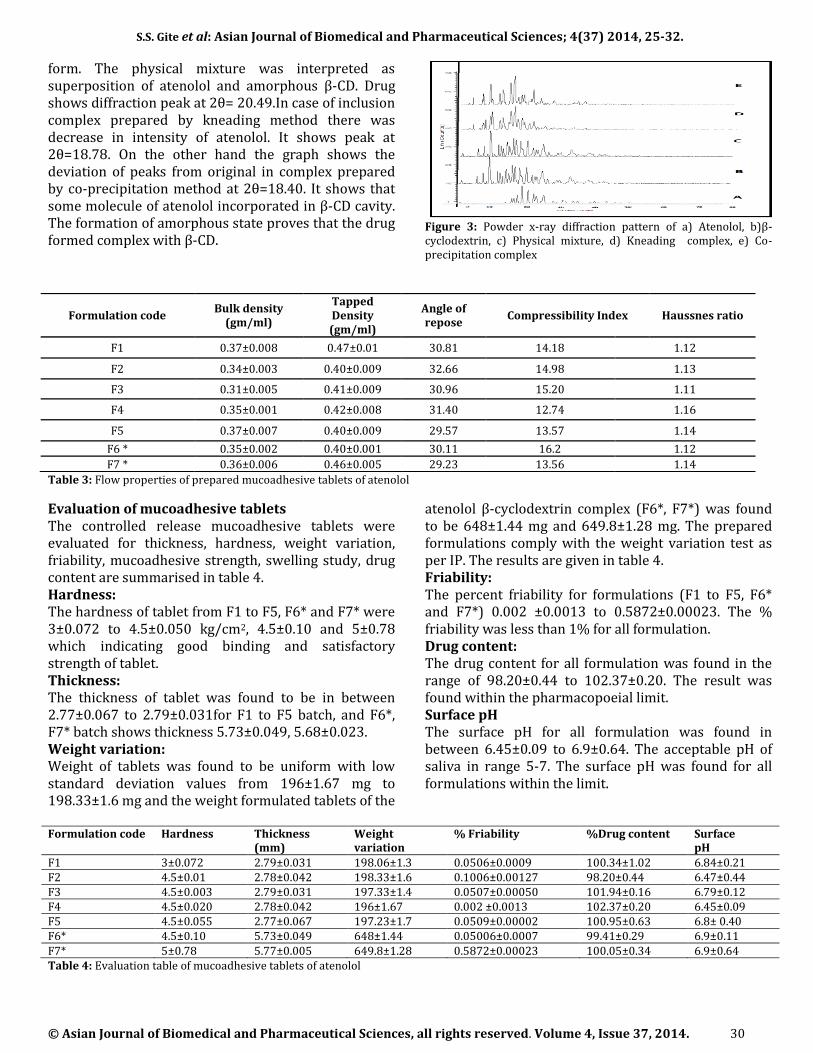
Differential scanning Calorimetry: Thermal behaviour of cyclodextrin inclusion complex was studied using DSC in order to confirm formation of β-cyclodextrin complex. The DSC thermogram of atenolol show an endothermic peak at 154.23 0C corresponding to its melting point. The β-CD show broad endothermic peak which is nearer to 100 due to release of water molecule. The physical mixture of complex show two endothermic peak at 950 and 1510 C, which are shifted from original value. Thermal curve of complex prepared by kneading shows curve at 92 0 C, and co-precipitation complex shows peak at 660C. The complete disappearance of atenolol indicates that there is formation of complex.
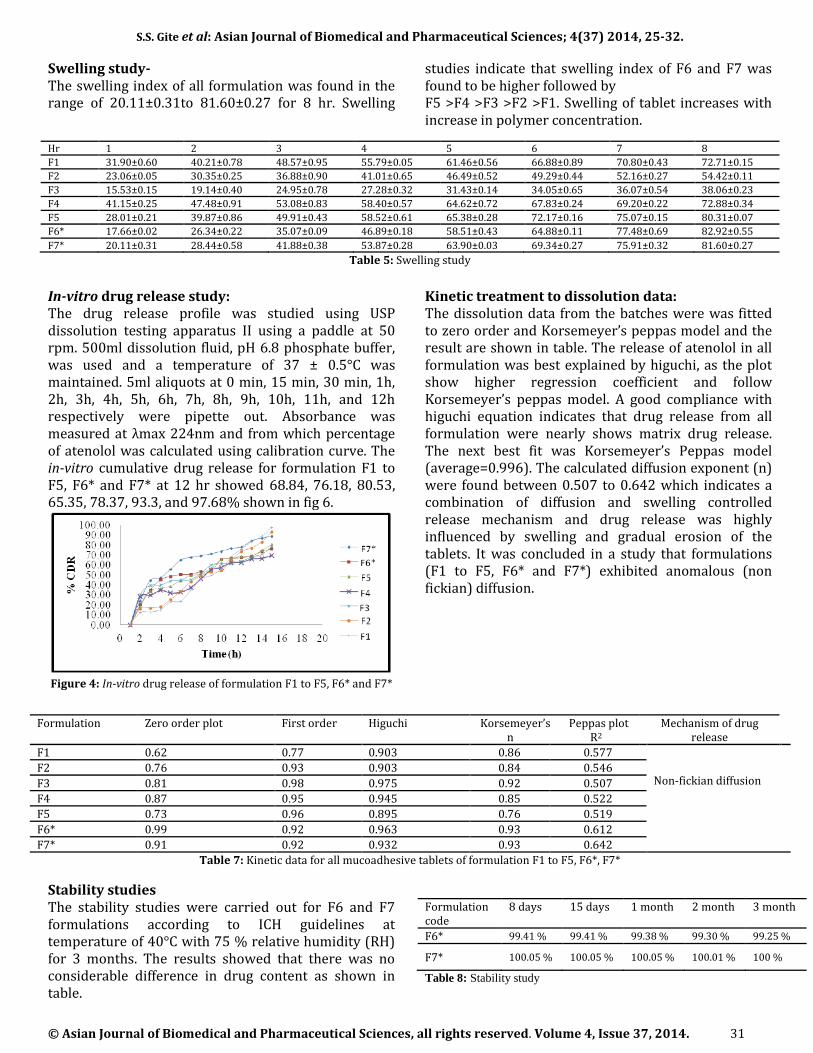
Figure 2: DSC thermograms of a) Atenolol, b)β-cyclodextrin, c) Physical mixture, d) Kneading complex, e) Co-precipitation complex Powder X-ray diffraction Powder x-ray study was used to measure crystallanity of the formed inclusion complexes. A change in crystallanity of drug indicates complex formation by appearance of new or at least deviation from original pattern. X-ray diffractometry studies for atenolol and β-CD revels that they are present in purely crystalline
S.S. Gite et al: Asian Journal of Biomedical and Pharmaceutical Sciences; 4(37) 2014, 25-32.
© Asian Journal of Biomedical and Pharmaceutical Sciences, all rights reserved. Volume 4, Issue 37, 2014. 30
form. The physical mixture was interpreted as superposition of atenolol and amorphous β-CD. Drug shows diffraction peak at 2θ= 20.49.In case of inclusion complex prepared by kneading method there was decrease in intensity of atenolol. It shows peak at 2θ=18.78. On the other hand the graph shows the deviation of peaks from original in complex prepared by co-precipitation method at 2θ=18.40. It shows that some molecule of atenolol incorporated in β-CD cavity. The formation of amorphous state proves that the drug formed complex with β-CD.
Figure 3: Powder x-ray diffraction pattern of a) Atenolol, b)β-cyclodextrin, c) Physical mixture, d) Kneading complex, e) Co-precipitation complex
Table 3: Flow properties of prepared mucoadhesive tablets of atenolol
Evaluation of mucoadhesive tablets The controlled release mucoadhesive tablets were evaluated for thickness, hardness, weight variation, friability, mucoadhesive strength, swelling study, drug content are summarised in table 4. Hardness: The hardness of tablet from F1 to F5, F6* and F7* were 3±0.072 to 4.5±0.050 kg/cm2, 4.5±0.10 and 5±0.78 which indicating good binding and satisfactory strength of tablet. Thickness: The thickness of tablet was found to be in between 2.77±0.067 to 2.79±0.031for F1 to F5 batch, and F6*, F7* batch shows thickness 5.73±0.049, 5.68±0.023. Weight variation: Weight of tablets was found to be uniform with low standard deviation values from 196±1.67 mg to 198.33±1.6 mg and the weight formulated tablets of the
atenolol β‐cyclodextrin complex (F6*, F7*) was found to be 648±1.44 mg and 649.8±1.28 mg. The prepared formulations comply with the weight variation test as per IP. The results are given in table 4. Friability: The percent friability for formulations (F1 to F5, F6* and F7*) 0.002 ±0.0013 to 0.5872±0.00023. The % friability was less than 1% for all formulation. Drug content: The drug content for all formulation was found in the range of 98.20±0.44 to 102.37±0.20. The result was found within the pharmacopoeial limit. Surface pH The surface pH for all formulation was found in between 6.45±0.09 to 6.9±0.64. The acceptable pH of saliva in range 5-7. The surface pH was found for all formulations within the limit.
Formulation code Hardness Thickness
(mm) Weight variation
% Friability %Drug content Surface pH
F1 3±0.072 2.79±0.031 198.06±1.3 0.0506±0.0009 100.34±1.02 6.84±0.21 F2 4.5±0.01 2.78±0.042 198.33±1.6 0.1006±0.00127 98.20±0.44 6.47±0.44 F3 4.5±0.003 2.79±0.031 197.33±1.4 0.0507±0.00050 101.94±0.16 6.79±0.12 F4 4.5±0.020 2.78±0.042 196±1.67 0.002 ±0.0013 102.37±0.20 6.45±0.09 F5 4.5±0.055 2.77±0.067 197.23±1.7 0.0509±0.00002 100.95±0.63 6.8± 0.40 F6* 4.5±0.10 5.73±0.049 648±1.44 0.05006±0.0007 99.41±0.29 6.9±0.11 F7* 5±0.78 5.77±0.005 649.8±1.28 0.5872±0.00023 100.05±0.34 6.9±0.64 Table 4: Evaluation table of mucoadhesive tablets of atenolol
Formulation code Bulk density
(gm/ml)
Tapped Density (gm/ml)
Angle of repose
Compressibility Index Haussnes ratio
F1 0.37±0.008 0.47±0.01 30.81 14.18 1.12
F2 0.34±0.003 0.40±0.009 32.66 14.98 1.13
F3 0.31±0.005 0.41±0.009 30.96 15.20 1.11
F4 0.35±0.001 0.42±0.008 31.40 12.74 1.16
F5 0.37±0.007 0.40±0.009 29.57 13.57 1.14
F6 * 0.35±0.002 0.40±0.001 30.11 16.2 1.12
F7 * 0.36±0.006 0.46±0.005 29.23 13.56 1.14
S.S. Gite et al: Asian Journal of Biomedical and Pharmaceutical Sciences; 4(37) 2014, 25-32.
© Asian Journal of Biomedical and Pharmaceutical Sciences, all rights reserved. Volume 4, Issue 37, 2014. 31
Swelling study- The swelling index of all formulation was found in the range of 20.11±0.31to 81.60±0.27 for 8 hr. Swelling
studies indicate that swelling index of F6 and F7 was found to be higher followed by F5 >F4 >F3 >F2 >F1. Swelling of tablet increases with increase in polymer concentration.
Hr 1 2 3 4 5 6 7 8
F1 31.90±0.60 40.21±0.78 48.57±0.95 55.79±0.05 61.46±0.56 66.88±0.89 70.80±0.43 72.71±0.15
F2 23.06±0.05 30.35±0.25 36.88±0.90 41.01±0.65 46.49±0.52 49.29±0.44 52.16±0.27 54.42±0.11
F3 15.53±0.15 19.14±0.40 24.95±0.78 27.28±0.32 31.43±0.14 34.05±0.65 36.07±0.54 38.06±0.23
F4 41.15±0.25 47.48±0.91 53.08±0.83 58.40±0.57 64.62±0.72 67.83±0.24 69.20±0.22 72.88±0.34
F5 28.01±0.21 39.87±0.86 49.91±0.43 58.52±0.61 65.38±0.28 72.17±0.16 75.07±0.15 80.31±0.07
F6* 17.66±0.02 26.34±0.22 35.07±0.09 46.89±0.18 58.51±0.43 64.88±0.11 77.48±0.69 82.92±0.55
F7* 20.11±0.31 28.44±0.58 41.88±0.38 53.87±0.28 63.90±0.03 69.34±0.27 75.91±0.32 81.60±0.27
Table 5: Swelling study
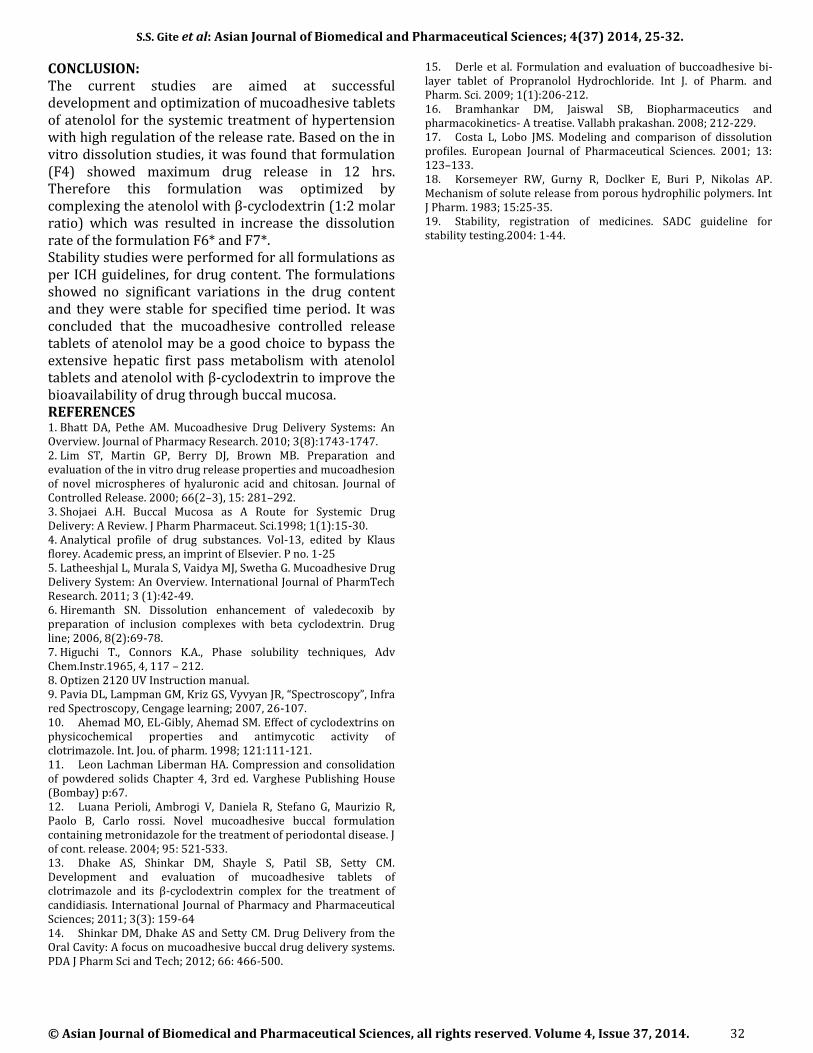
In-vitro drug release study: The drug release profile was studied using USP dissolution testing apparatus II using a paddle at 50 rpm. 500ml dissolution fluid, pH 6.8 phosphate buffer, was used and a temperature of 37 ± 0.5°C was maintained. 5ml aliquots at 0 min, 15 min, 30 min, 1h, 2h, 3h, 4h, 5h, 6h, 7h, 8h, 9h, 10h, 11h, and 12h respectively were pipette out. Absorbance was measured at λmax 224nm and from which percentage of atenolol was calculated using calibration curve. The in-vitro cumulative drug release for formulation F1 to F5, F6* and F7* at 12 hr showed 68.84, 76.18, 80.53, 65.35, 78.37, 93.3, and 97.68% shown in fig 6.
Figure 4: In-vitro drug release of formulation F1 to F5, F6* and F7*
Kinetic treatment to dissolution data: The dissolution data from the batches were was fitted to zero order and Korsemeyer’s peppas model and the result are shown in table. The release of atenolol in all formulation was best explained by higuchi, as the plot show higher regression coefficient and follow Korsemeyer’s peppas model. A good compliance with higuchi equation indicates that drug release from all formulation were nearly shows matrix drug release. The next best fit was Korsemeyer’s Peppas model (average=0.996). The calculated diffusion exponent (n) were found between 0.507 to 0.642 which indicates a combination of diffusion and swelling controlled release mechanism and drug release was highly influenced by swelling and gradual erosion of the tablets. It was concluded in a study that formulations (F1 to F5, F6* and F7*) exhibited anomalous (non fickian) diffusion.
Formulation Zero order plot First order Higuchi Korsemeyer’s Peppas plot
n R2 Mechanism of drug
release
F1 0.62 0.77 0.903 0.86 0.577 Non-fickian diffusion
F2 0.76 0.93 0.903 0.84 0.546
F3 0.81 0.98 0.975 0.92 0.507
F4 0.87 0.95 0.945 0.85 0.522
F5 0.73 0.96 0.895 0.76 0.519
F6* 0.99 0.92 0.963 0.93 0.612
F7* 0.91 0.92 0.932 0.93 0.642
Table 7: Kinetic data for all mucoadhesive tablets of formulation F1 to F5, F6*, F7*
Stability studies The stability studies were carried out for F6 and F7 formulations according to ICH guidelines at temperature of 40°C with 75 % relative humidity (RH) for 3 months. The results showed that there was no considerable difference in drug content as shown in table.
Formulation code
8 days 15 days 1 month 2 month 3 month
F6* 99.41 % 99.41 % 99.38 % 99.30 % 99.25 %
F7* 100.05 % 100.05 % 100.05 % 100.01 % 100 %
Table 8: Stability study
S.S. Gite et al: Asian Journal of Biomedical and Pharmaceutical Sciences; 4(37) 2014, 25-32.
© Asian Journal of Biomedical and Pharmaceutical Sciences, all rights reserved. Volume 4, Issue 37, 2014. 32
CONCLUSION: The current studies are aimed at successful development and optimization of mucoadhesive tablets of atenolol for the systemic treatment of hypertension with high regulation of the release rate. Based on the in vitro dissolution studies, it was found that formulation (F4) showed maximum drug release in 12 hrs. Therefore this formulation was optimized by complexing the atenolol with β‐cyclodextrin (1:2 molar ratio) which was resulted in increase the dissolution rate of the formulation F6* and F7*. Stability studies were performed for all formulations as per ICH guidelines, for drug content. The formulations showed no significant variations in the drug content and they were stable for specified time period. It was concluded that the mucoadhesive controlled release tablets of atenolol may be a good choice to bypass the extensive hepatic first pass metabolism with atenolol tablets and atenolol with β‐cyclodextrin to improve the bioavailability of drug through buccal mucosa. REFERENCES 1. Bhatt DA, Pethe AM. Mucoadhesive Drug Delivery Systems: An Overview. Journal of Pharmacy Research. 2010; 3(8):1743-1747. 2. Lim ST, Martin GP, Berry DJ, Brown MB. Preparation and evaluation of the in vitro drug release properties and mucoadhesion of novel microspheres of hyaluronic acid and chitosan. Journal of Controlled Release. 2000; 66(2–3), 15: 281–292. 3. Shojaei A.H. Buccal Mucosa as A Route for Systemic Drug Delivery: A Review. J Pharm Pharmaceut. Sci.1998; 1(1):15-30. 4. Analytical profile of drug substances. Vol-13, edited by Klaus florey. Academic press, an imprint of Elsevier. P no. 1-25 5. Latheeshjal L, Murala S, Vaidya MJ, Swetha G. Mucoadhesive Drug Delivery System: An Overview. International Journal of PharmTech Research. 2011; 3 (1):42-49. 6. Hiremanth SN. Dissolution enhancement of valedecoxib by preparation of inclusion complexes with beta cyclodextrin. Drug line; 2006, 8(2):69-78. 7. Higuchi T., Connors K.A., Phase solubility techniques, Adv Chem.Instr.1965, 4, 117 – 212. 8. Optizen 2120 UV Instruction manual. 9. Pavia DL, Lampman GM, Kriz GS, Vyvyan JR, “Spectroscopy”, Infra red Spectroscopy, Cengage learning; 2007, 26-107. 10. Ahemad MO, EL-Gibly, Ahemad SM. Effect of cyclodextrins on physicochemical properties and antimycotic activity of clotrimazole. Int. Jou. of pharm. 1998; 121:111-121. 11. Leon Lachman Liberman HA. Compression and consolidation of powdered solids Chapter 4, 3rd ed. Varghese Publishing House (Bombay) p:67. 12. Luana Perioli, Ambrogi V, Daniela R, Stefano G, Maurizio R, Paolo B, Carlo rossi. Novel mucoadhesive buccal formulation containing metronidazole for the treatment of periodontal disease. J of cont. release. 2004; 95: 521-533. 13. Dhake AS, Shinkar DM, Shayle S, Patil SB, Setty CM. Development and evaluation of mucoadhesive tablets of clotrimazole and its β-cyclodextrin complex for the treatment of candidiasis. International Journal of Pharmacy and Pharmaceutical Sciences; 2011; 3(3): 159-64 14. Shinkar DM, Dhake AS and Setty CM. Drug Delivery from the Oral Cavity: A focus on mucoadhesive buccal drug delivery systems. PDA J Pharm Sci and Tech; 2012; 66: 466-500.
15. Derle et al. Formulation and evaluation of buccoadhesive bi-layer tablet of Propranolol Hydrochloride. Int J. of Pharm. and Pharm. Sci. 2009; 1(1):206-212. 16. Bramhankar DM, Jaiswal SB, Biopharmaceutics and pharmacokinetics- A treatise. Vallabh prakashan. 2008; 212-229. 17. Costa L, Lobo JMS. Modeling and comparison of dissolution profiles. European Journal of Pharmaceutical Sciences. 2001; 13: 123–133. 18. Korsemeyer RW, Gurny R, Doclker E, Buri P, Nikolas AP. Mechanism of solute release from porous hydrophilic polymers. Int J Pharm. 1983; 15:25-35. 19. Stability, registration of medicines. SADC guideline for stability testing.2004: 1-44.
![Enhancing the Solubility of Curcumin Using a Solid ......drug solubility owing to its ability to reduce the drug particle size [11], increase the drug wettability [12], develop porous](https://static.fdocument.org/doc/165x107/613fcff7b44ffa75b8047733/enhancing-the-solubility-of-curcumin-using-a-solid-drug-solubility-owing.jpg)


![[Product Monograph Template - Standard]€¦ · Potential Drug-Drug Interactions Proper name Clinical comment Clofibrate Chlorpropamide Carbamazapine May potentiate the antidiuretic](https://static.fdocument.org/doc/165x107/5ea3f947d95ea33744507d57/product-monograph-template-standard-potential-drug-drug-interactions-proper.jpg)