Circulation of the Atmosphere - MIT OpenCourseWare · rel rel rel dv p u dt y r u a u r a dv p u au...
44
Circulation of the Atmosphere 1
Transcript of Circulation of the Atmosphere - MIT OpenCourseWare · rel rel rel dv p u dt y r u a u r a dv p u au...
Circulation of the Atmosphere
1
This image has been removed due to copyright restrictions. The image (contour lines about circulation of the atmosphere) is copyrighted © UNISYS.
2
3
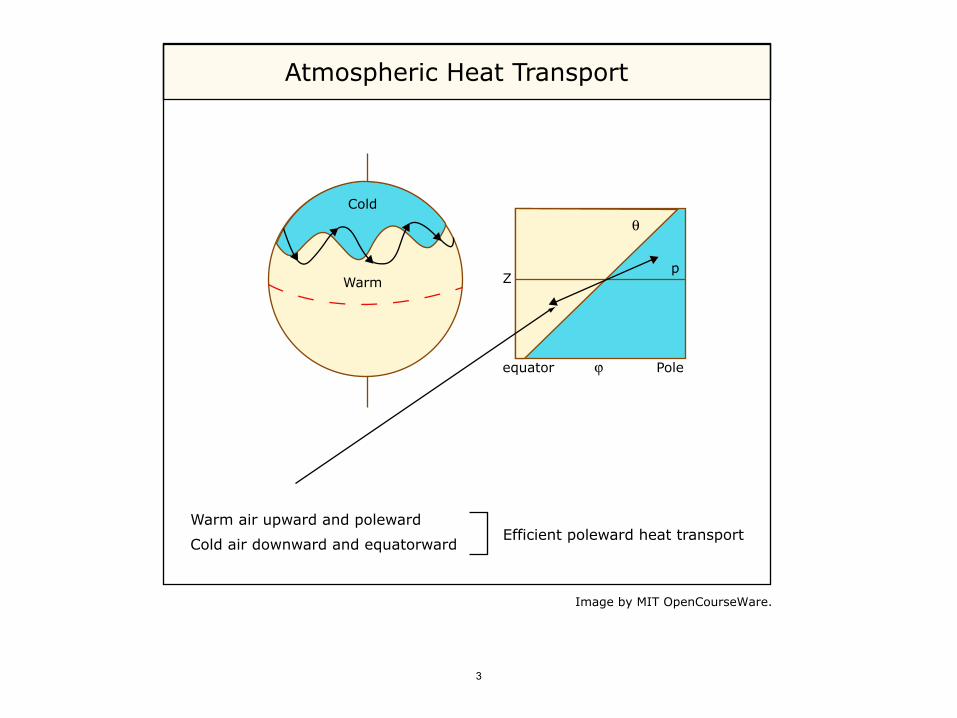
Atmospheric Heat Transport
Coldθ
pWarm Z
equator ϕ Pole
Warm air upward and polewardEfficient poleward heat transportCold air downward and equatorward
Image by MIT OpenCourseWare.
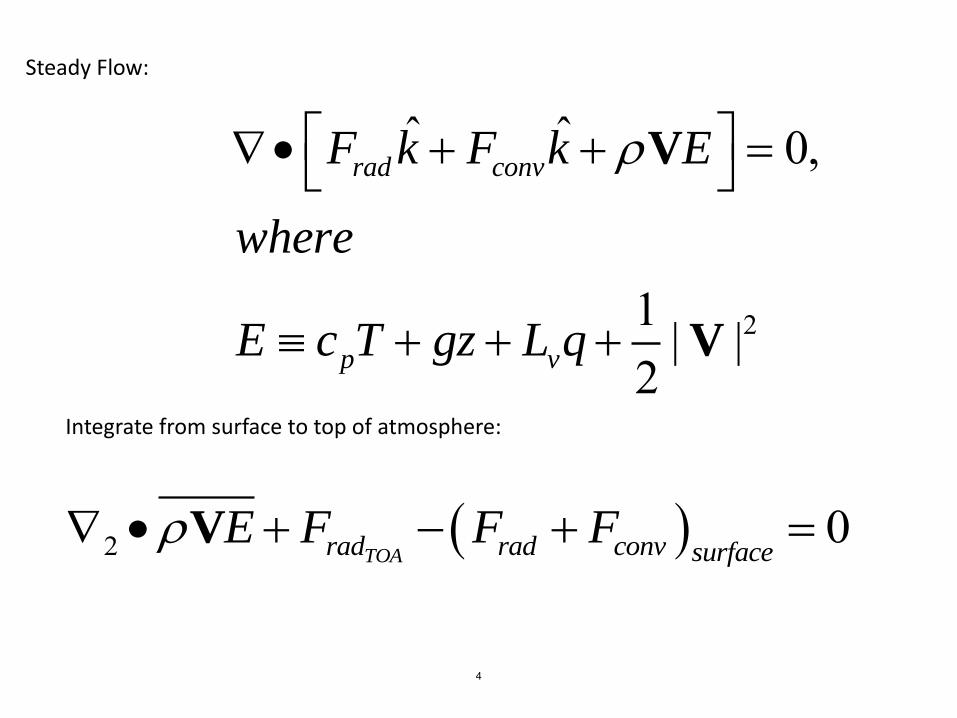
Steady Flow:
2
ˆ ˆ 0,
1 | |2
rad conv
p v
F k F k E
where
E c T gz L q
V
V
Integrate from surface to top of atmosphere:
2 0TOArad rad conv surface
E F F F V
4
What causes lateral enthalpy transport by atmosphere?
1: Large-scale, quasi-steady overturning motion in the Tropics,
2: Eddies with horizontal dimensions of ~ 3000 km in middle and high latitudes
5
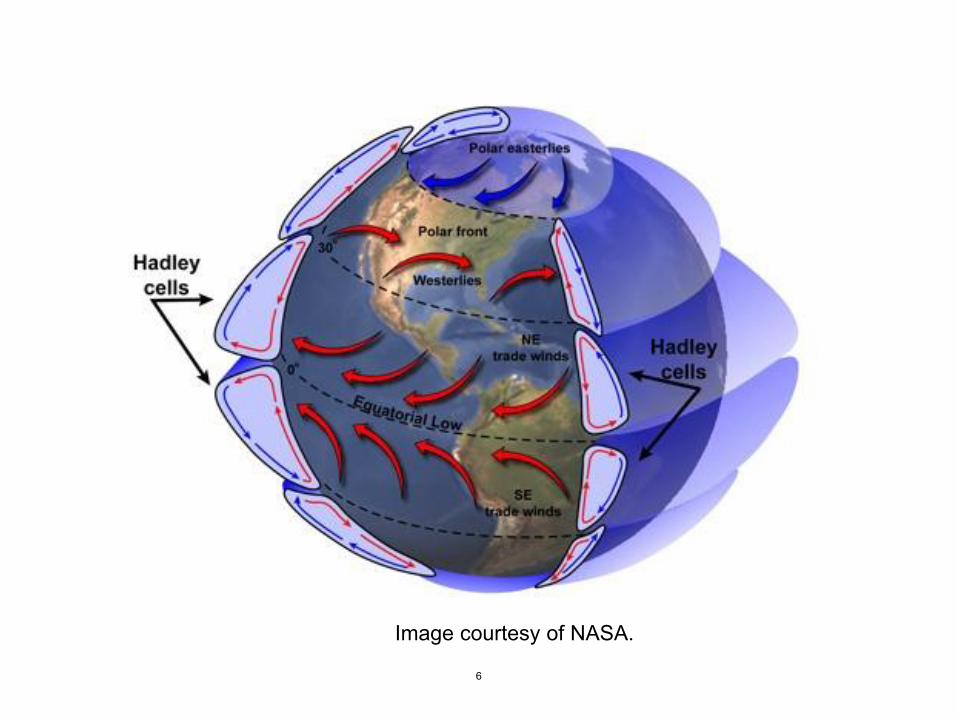
Image courtesy of NASA.
6
This image has been removed due to copyright restrictions. The image is copyrighted © John Wiley & Sons. Please see the second image on page http://www.saeonmarine.co.za/SADCOFunStuff/OceanCurrents.htm
7
First consider a hypothetical planet like Earth, but with no continents and no seasons and for which the only friction acting on the atmosphere is at the surface.
This planet has an exact nonlinear equilibrium solution for the flow of the atmosphere, characterized by:
1. Every column is in radiative-convective equilibrium,
2. Wind vanishes at planet’s surface
3. Horizontal pressure gradients balanced by Coriolis accelerations
8
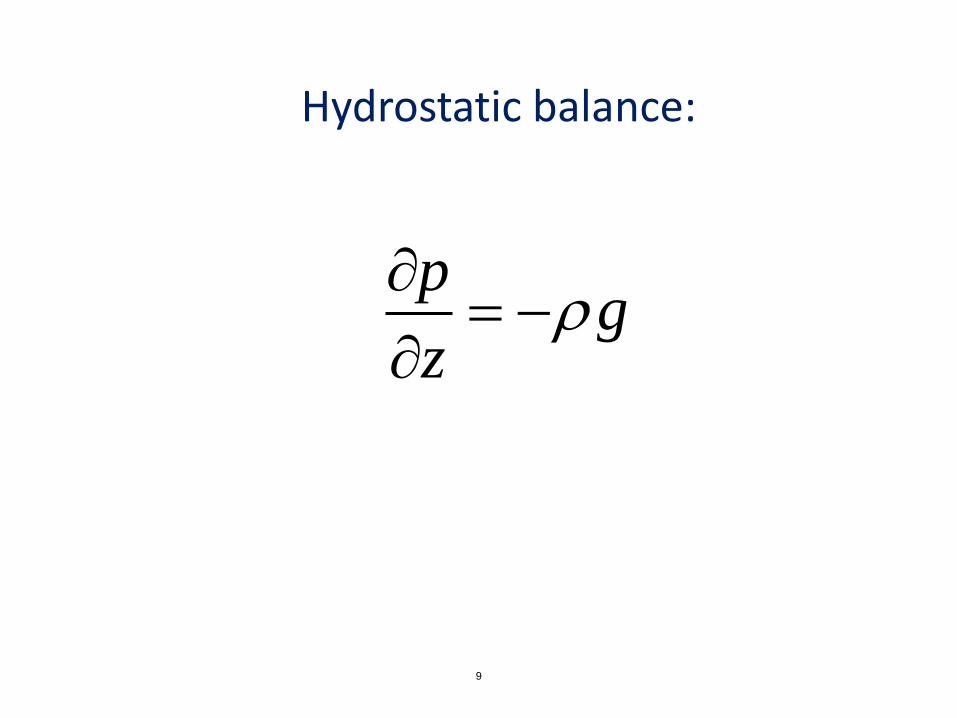
Hydrostatic balance:
pg
z
9
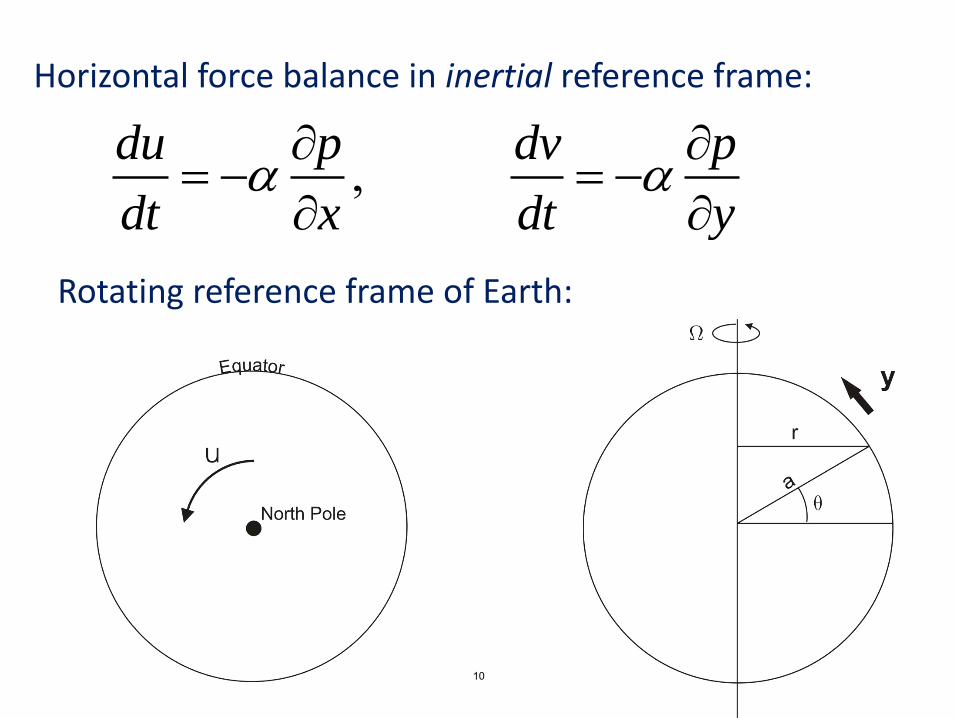
Horizontal force balance in inertial reference frame:
,du p dv p
dt x dt y
Rotating reference frame of Earth:
10
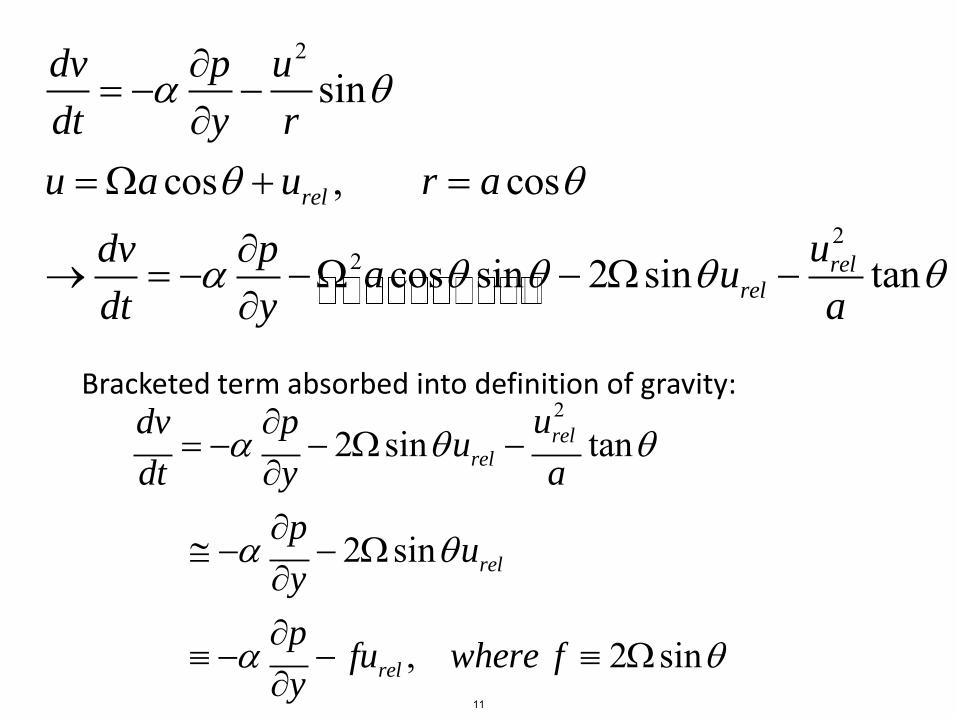
2
22
sin
cos , cos
cos sin 2 sin tan
rel
relrel
dv p u
dt y r
u a u r a
udv pa u
dt y a
Bracketed term absorbed into definition of gravity: 2
2 sin tan
2 sin
, 2 sin
relrel
rel
rel
udv pu
dt y a
pu
y
pfu where f
y
11
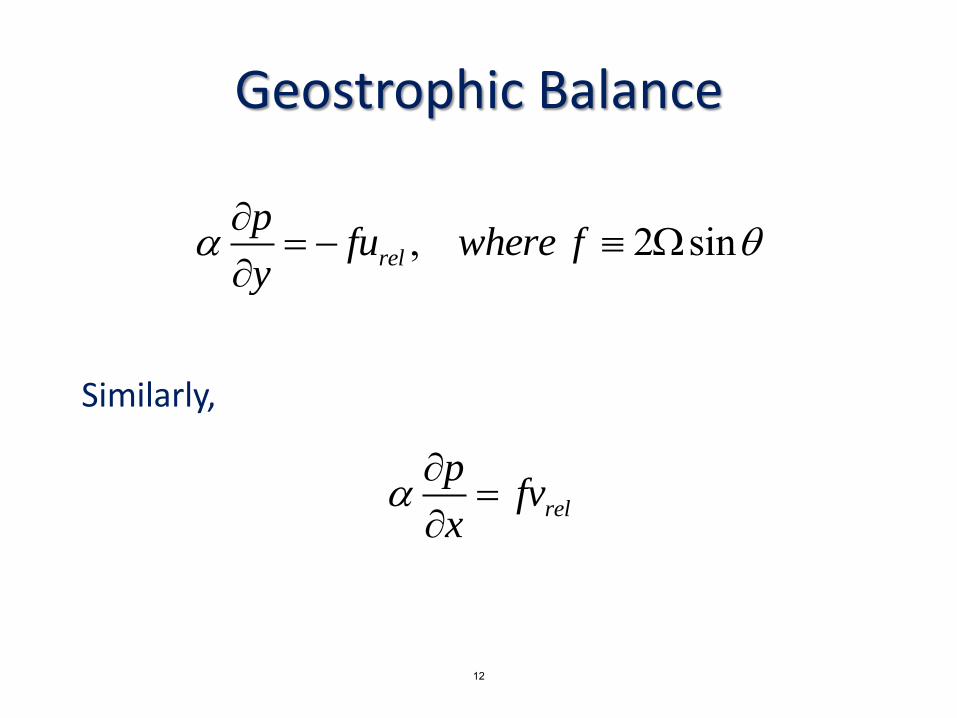
, 2 sinrel
pfu where f
y
rel
pfv
x
Geostrophic Balance
Similarly,
12
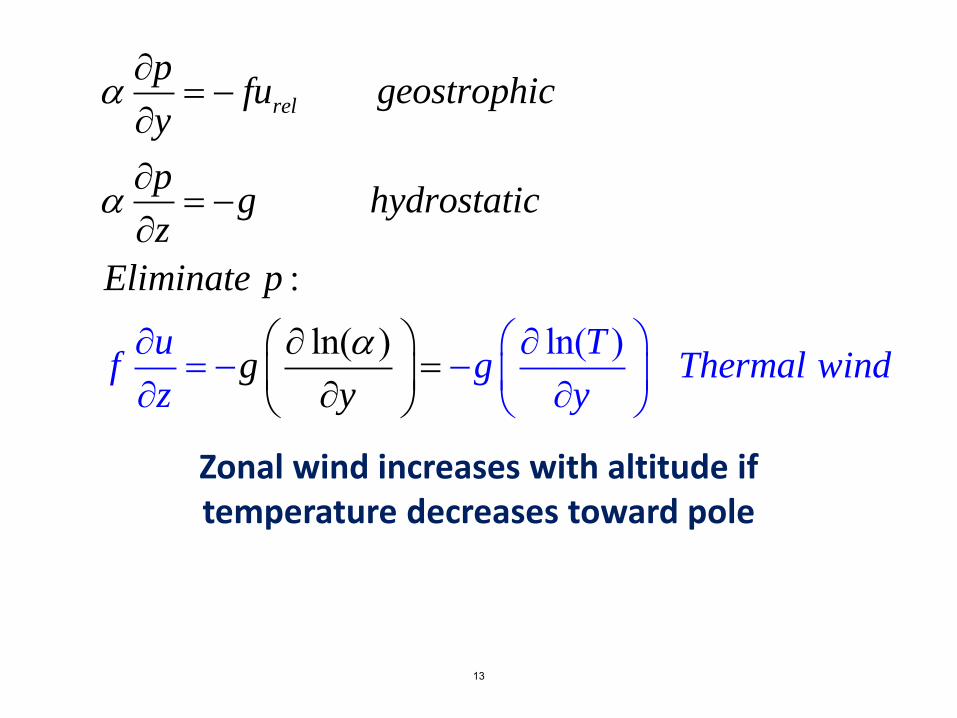
l
:
n( )ln( )
rel
pfu geostrophic
y
pg hydrostatic
z
Eliminate p
u Tf g Thermal w
yg i d
z yn
Zonal wind increases with altitude if temperature decreases toward pole
13
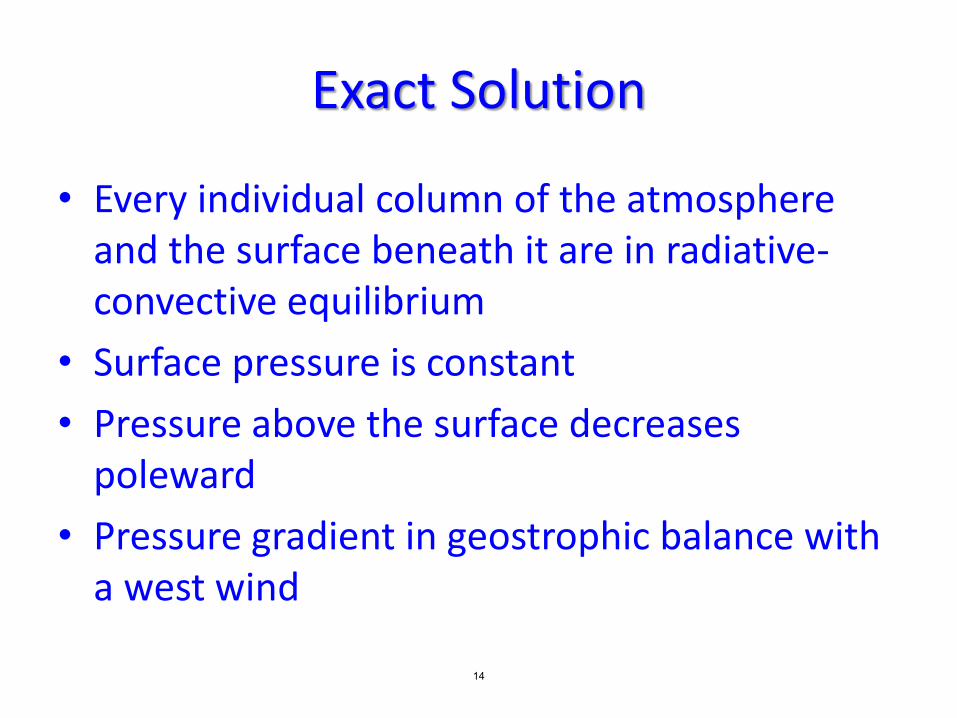
Exact Solution
• Every individual column of the atmosphere and the surface beneath it are in radiative-convective equilibrium
• Surface pressure is constant
• Pressure above the surface decreases poleward
• Pressure gradient in geostrophic balance with a west wind
14
Two potential problems with this solution:
1. Not enough angular momentum available for required west-east wind,
2. Equilibrium solution may be unstable
15
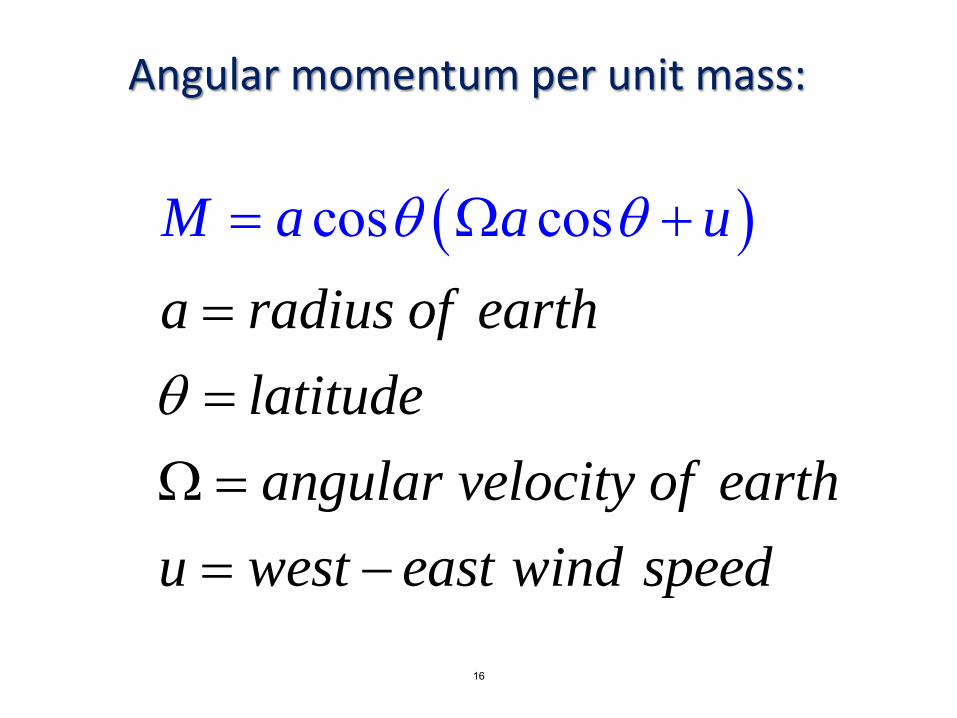
Angular momentum per unit mass:
cos cosa radius of earth
latitude
angular velocity of earth
u west east wind
M a a
p d
u
s ee
16
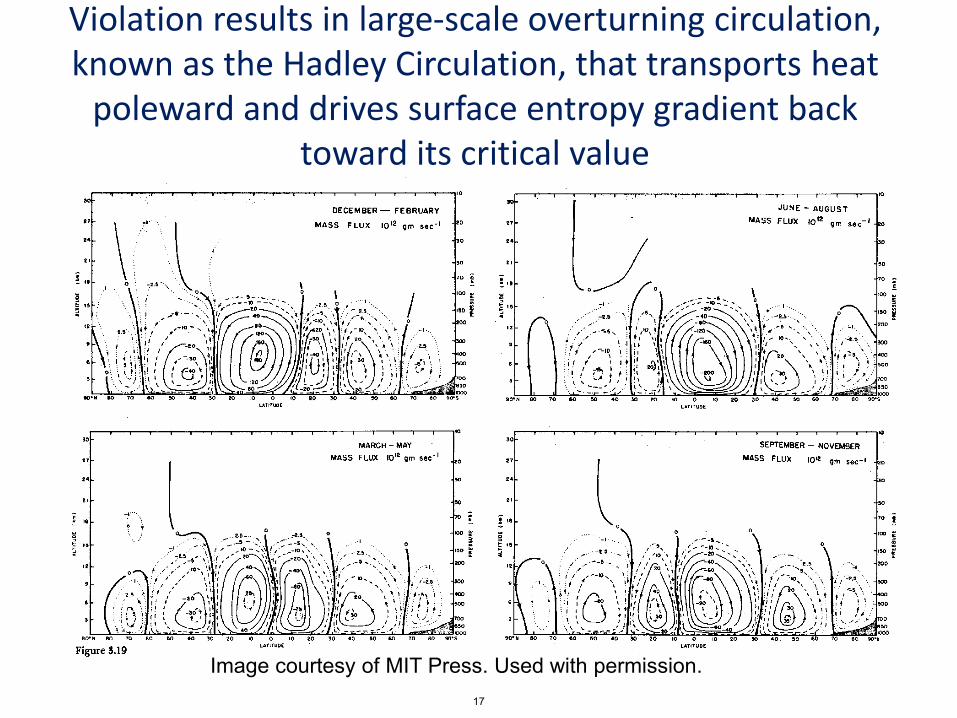
Violation results in large-scale overturning circulation, known as the Hadley Circulation, that transports heat
poleward and drives surface entropy gradient back toward its critical value
Image courtesy of MIT Press. Used with permission. 17
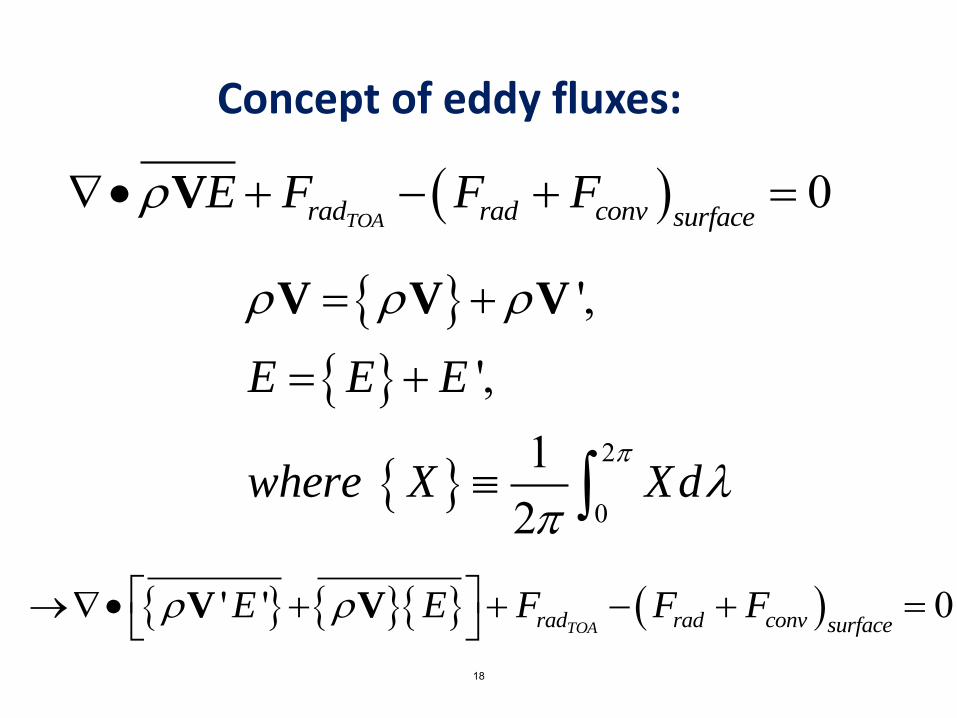
Concept of eddy fluxes:
0TOArad rad conv surface
E F F F V
2
0
',
',1
2
E E E
where X Xd
V V V
' ' 0TOArad rad conv surface
E E F F F
V V
18
19
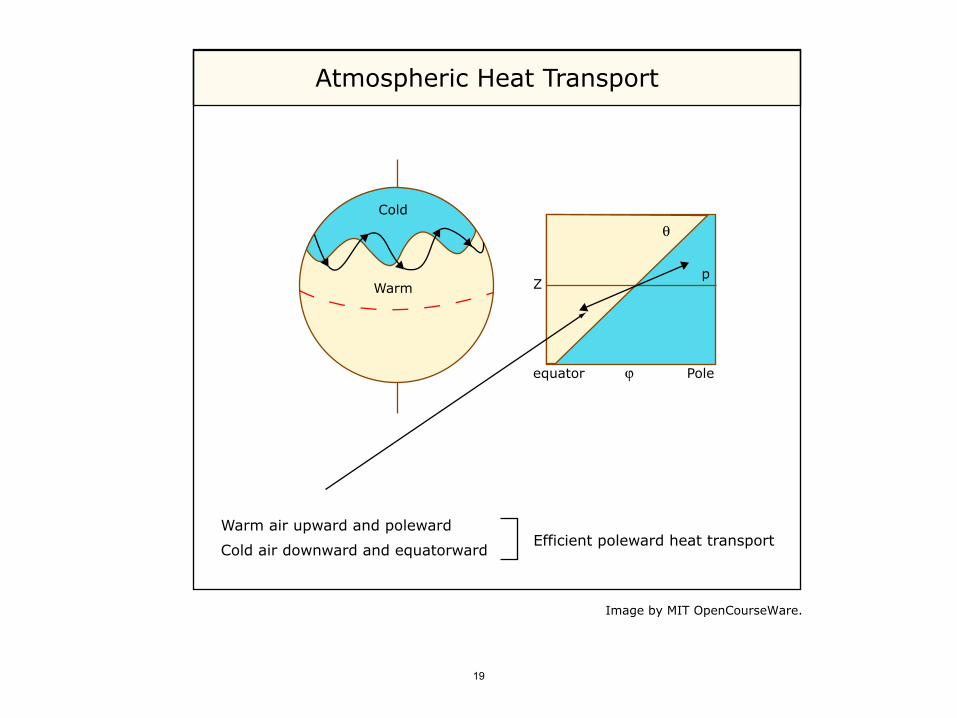
Atmospheric Heat Transport
Coldθ
pWarm Z
equator ϕ Pole
Warm air upward and polewardEfficient poleward heat transportCold air downward and equatorward
Image by MIT OpenCourseWare.
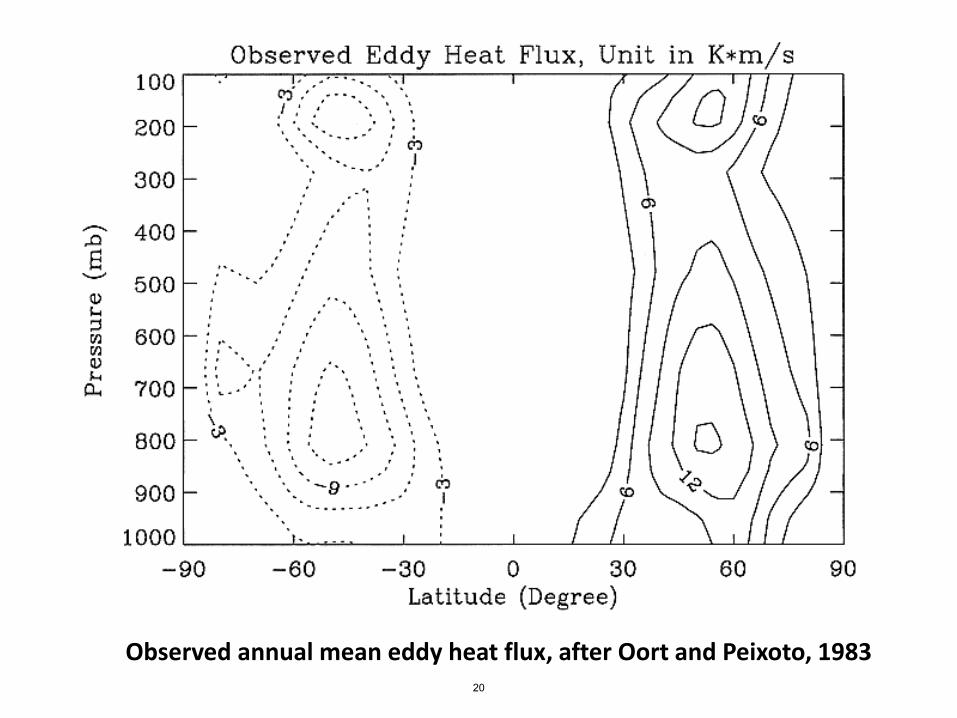
Observed annual mean eddy heat flux, after Oort and Peixoto, 1983 20
Eddy heat fluxes not efficient enough to prevent temperature
gradients from developing
21
This image has been removed due to copyright restrictions. Please see Figure 1.6 in the book Hartmann, Dennis L. 1994. Global physical climatology. San Diego: Academic Press. ISBN: 9780123285300.
22
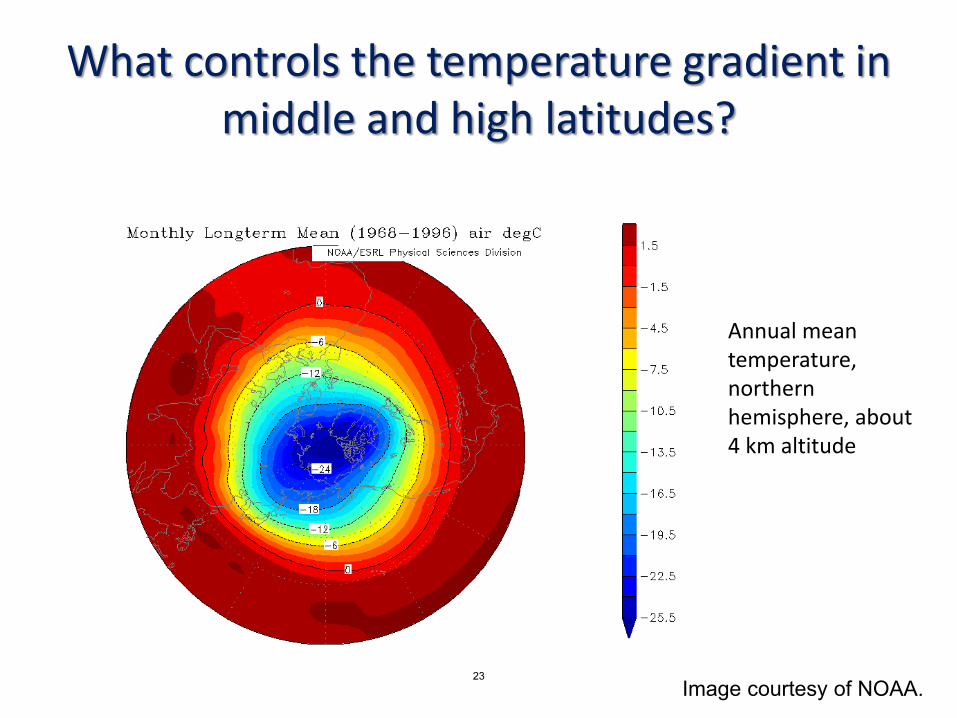
What controls the temperature gradient in middle and high latitudes?
Annual mean temperature, northern hemisphere, about 4 km altitude
Image courtesy of NOAA. 23
Issues
• Temperature gradient controlled by eddies of horizontal dimensions ~ 3000 km
• Familiar highs and lows on weather maps
• Eddy physics not simple
• Concept of criticality does not apply...critical T gradient = 0 (not observed)
• While eddies try to wipe out T gradient, they do not succeed
24
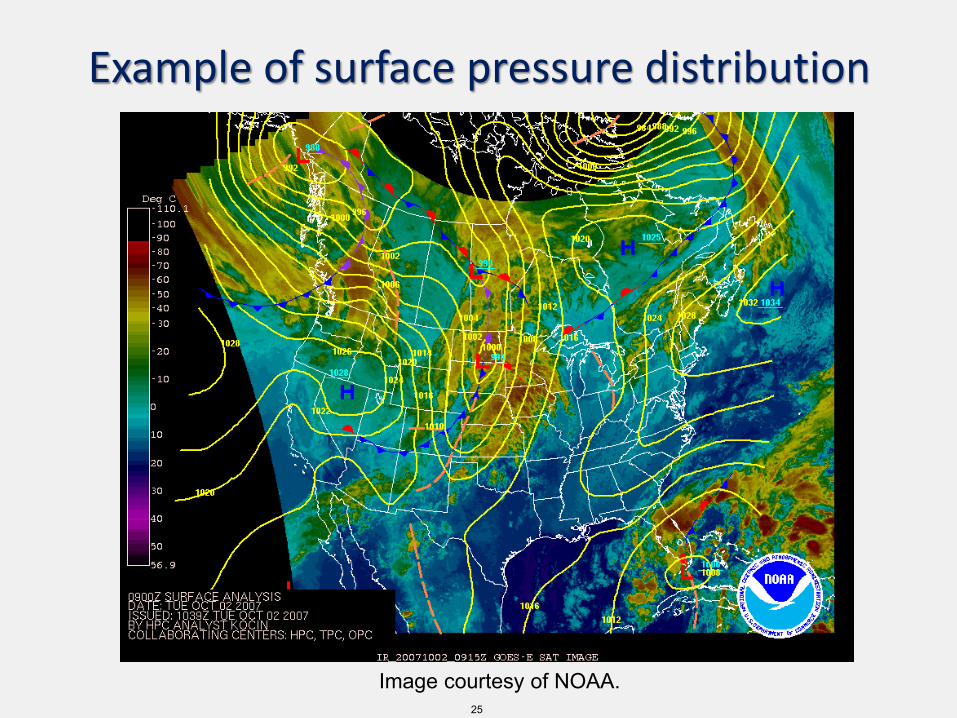
Example of surface pressure distribution
Image courtesy of NOAA. 25
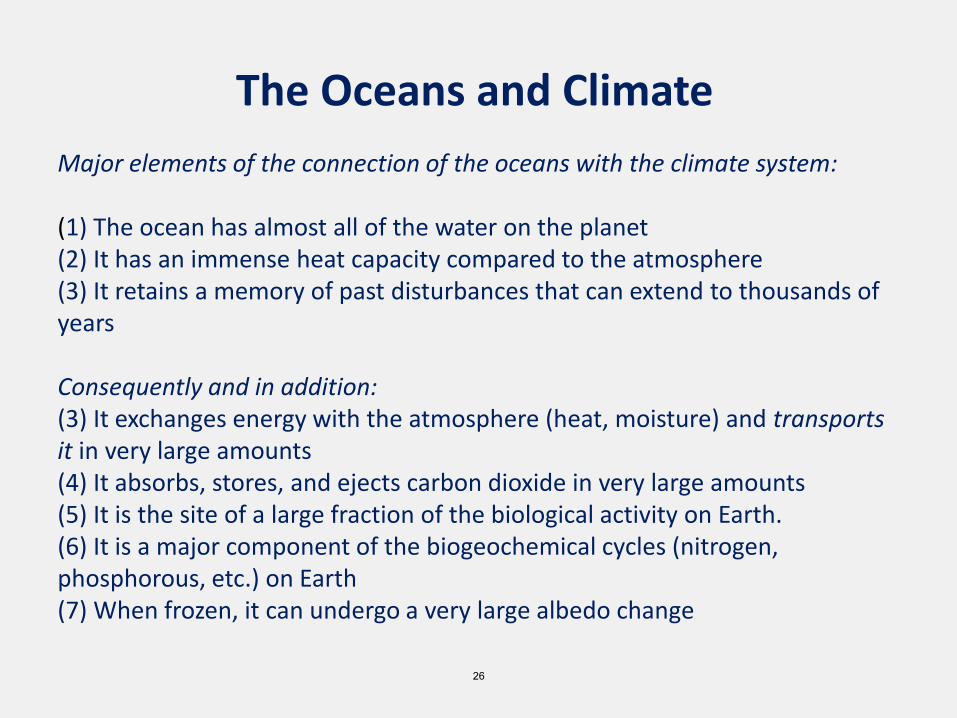
The Oceans and Climate
Major elements of the connection of the oceans with the climate system: (1) The ocean has almost all of the water on the planet (2) It has an immense heat capacity compared to the atmosphere (3) It retains a memory of past disturbances that can extend to thousands of years Consequently and in addition: (3) It exchanges energy with the atmosphere (heat, moisture) and transports it in very large amounts (4) It absorbs, stores, and ejects carbon dioxide in very large amounts (5) It is the site of a large fraction of the biological activity on Earth. (6) It is a major component of the biogeochemical cycles (nitrogen, phosphorous, etc.) on Earth (7) When frozen, it can undergo a very large albedo change
26
• Similarities to atmosphere: – Global-scale fluid on a rotating earth
– Governing equations nearly identical
• Major differences: – Continental barriers to east-west motions
– Ocean virtually opaque to radiation
– The ocean is heated (and cooled) at its upper surface
– No equivalent in the ocean of moist convection (although salinity introduces some analogous issues)
– Much more difficult to observe the ocean
27
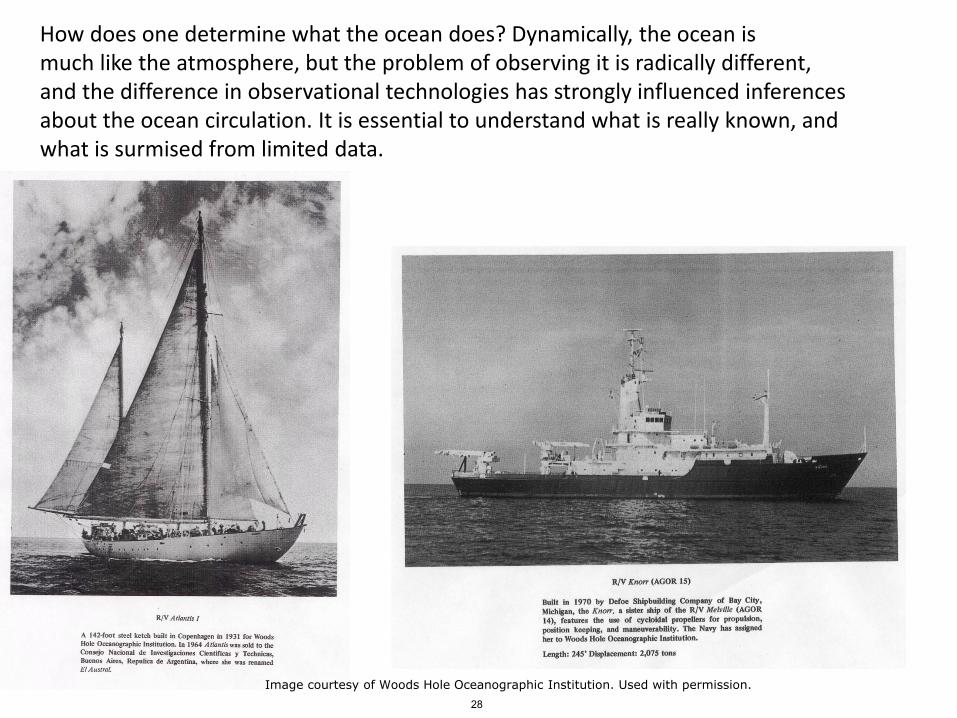
How does one determine what the ocean does? Dynamically, the ocean is much like the atmosphere, but the problem of observing it is radically different, and the difference in observational technologies has strongly influenced inferences about the ocean circulation. It is essential to understand what is really known, and what is surmised from limited data.
Image courtesy of Woods Hole Oceanographic Institution. Used with permission.
28
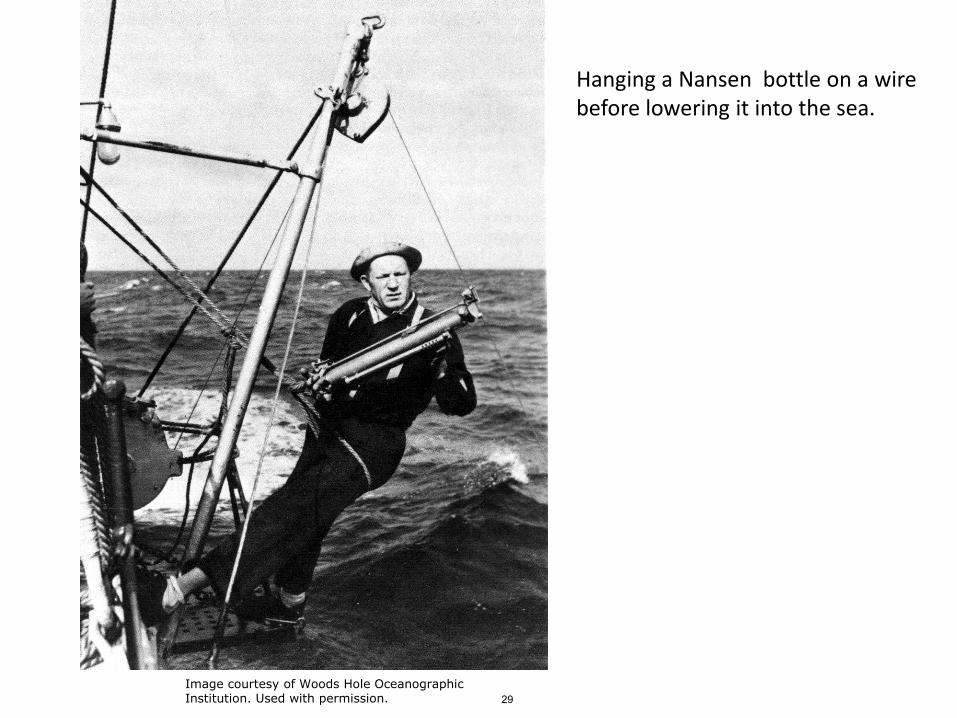
Hanging a Nansen bottle on a wire before lowering it into the sea.
Image courtesy of Woods Hole OceanographicInstitution. Used with permission. 29
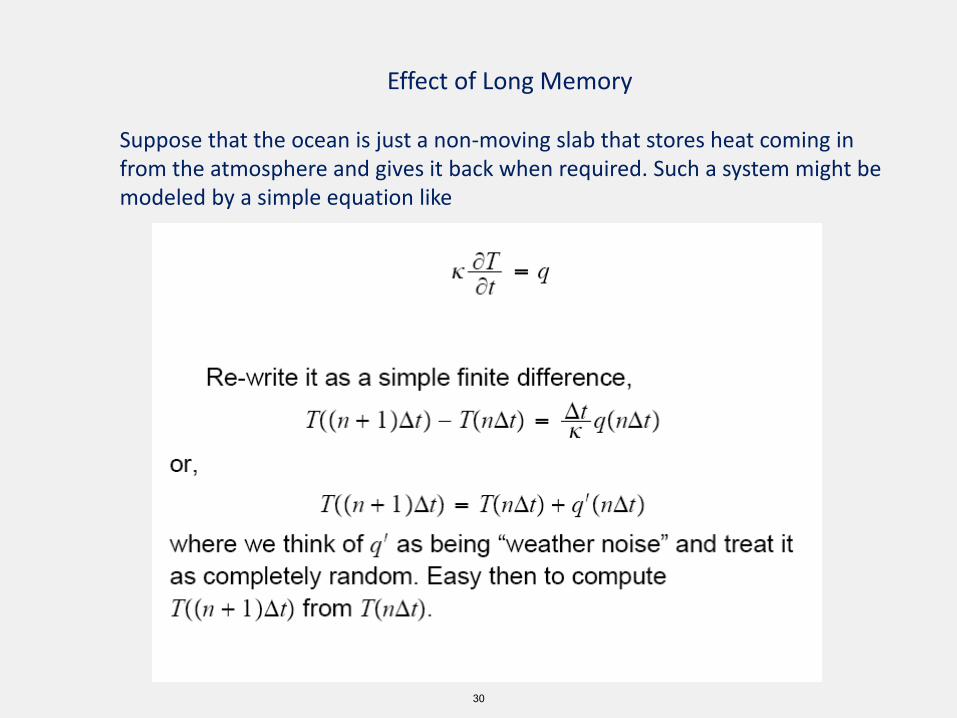
Effect of Long Memory Suppose that the ocean is just a non-moving slab that stores heat coming in from the atmosphere and gives it back when required. Such a system might be modeled by a simple equation like
30
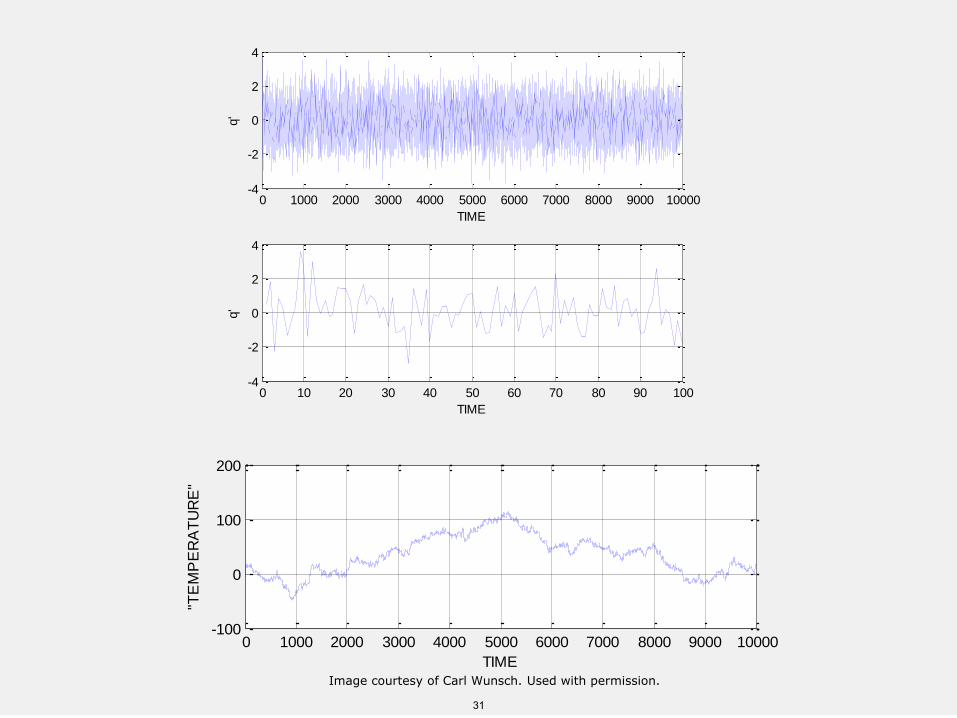
0 1000 2000 3000 4000 5000 6000 7000 8000 9000 10000-4
-2
0
2
4
TIME
q'
0 10 20 30 40 50 60 70 80 90 100-4
-2
0
2
4
TIME
q'
0 1000 2000 3000 4000 5000 6000 7000 8000 9000 10000-100
0
100
200
"TE
MP
ER
AT
UR
E"
TIME
Image courtesy of Carl Wunsch. Used with permission.
31
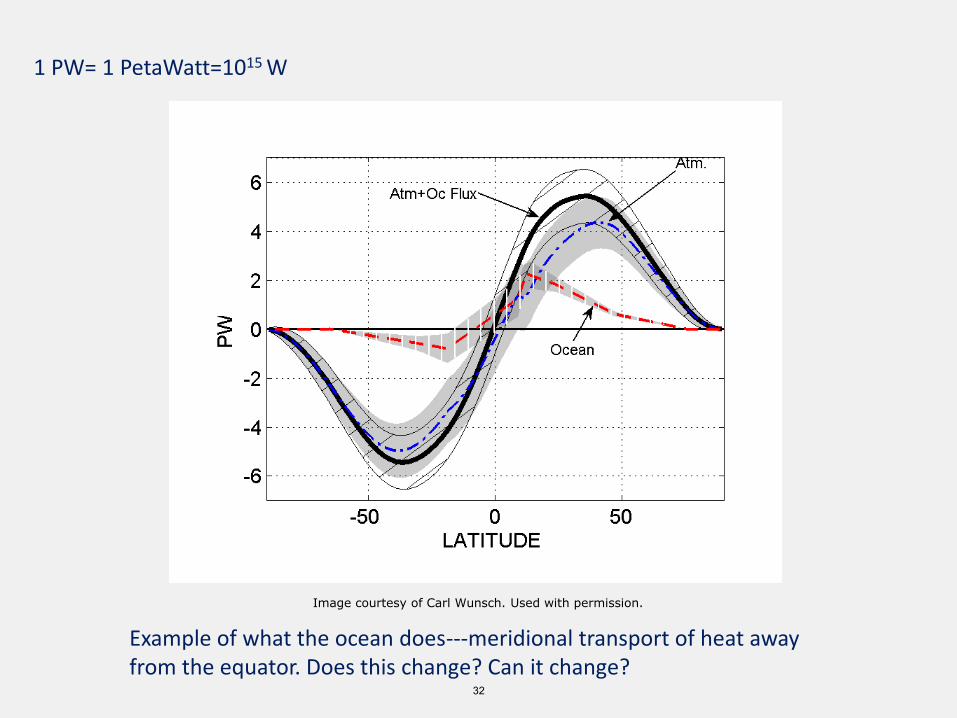
Example of what the ocean does---meridional transport of heat away from the equator. Does this change? Can it change?
1 PW= 1 PetaWatt=1015 W
Image courtesy of Carl Wunsch. Used with permission.
32
Wind-Driven Circulation
This image has been removed due to copyright restrictions. Please see the image of http://henry.pha.jhu.edu/ssip/asat_int/ocean.jpg.
33
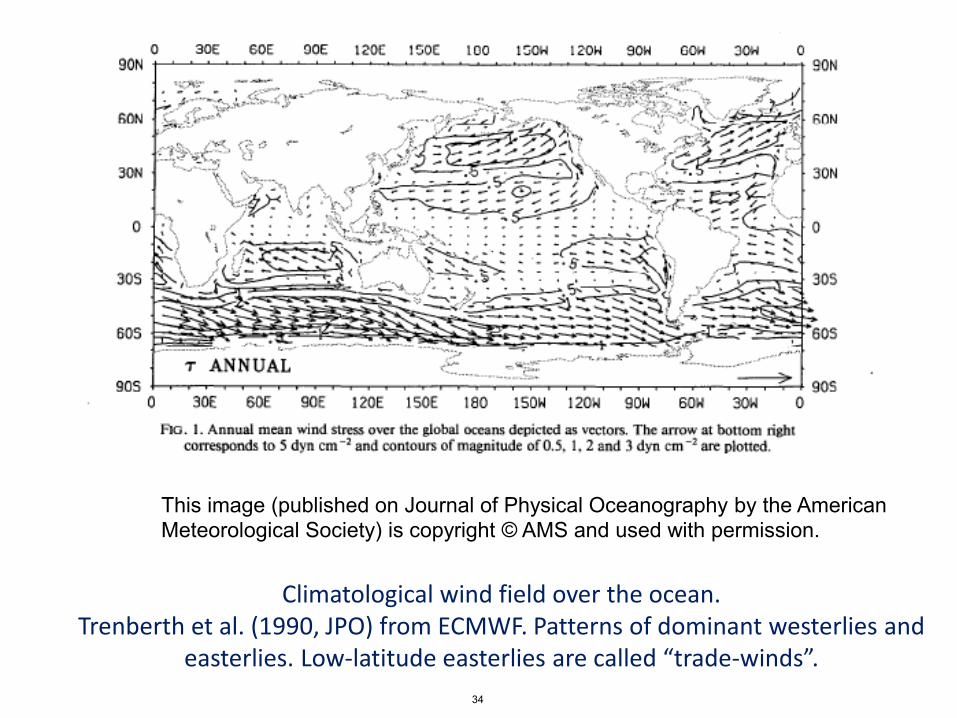
Climatological wind field over the ocean. Trenberth et al. (1990, JPO) from ECMWF. Patterns of dominant westerlies and
easterlies. Low-latitude easterlies are called “trade-winds”.
This image (published on Journal of Physical Oceanography by the American Meteorological Society) is copyright © AMS and used with permission.
34
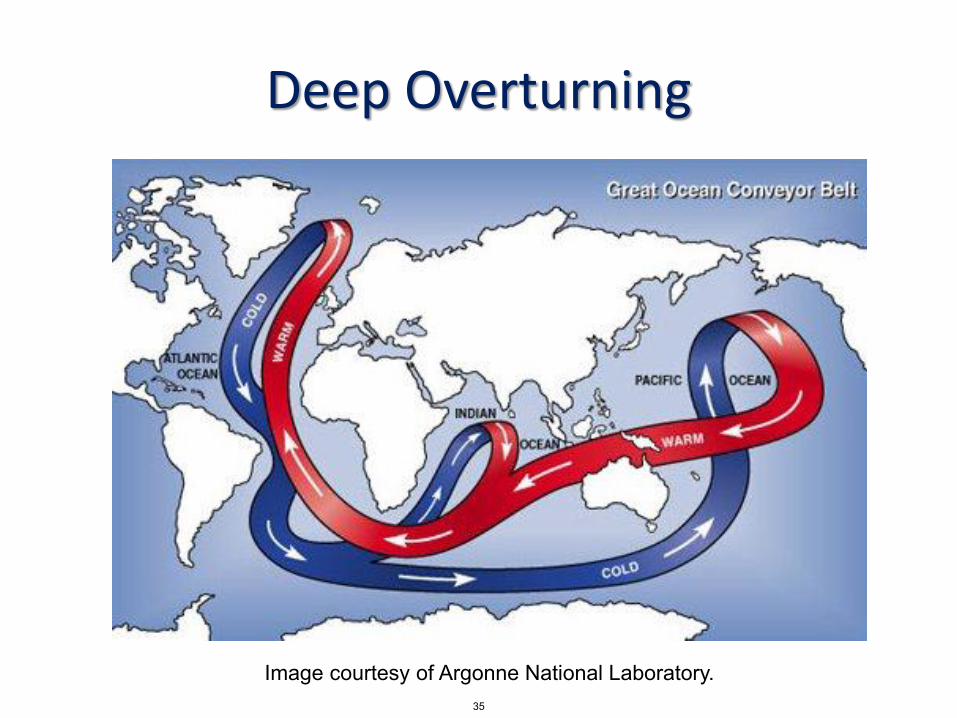
Deep Overturning
Image courtesy of Argonne National Laboratory. 35

This image has been removed due to copyright restrictions.
Please see Figure 1-2-6 on page http://www.tpub.com/weather3/1-24.htm.
36
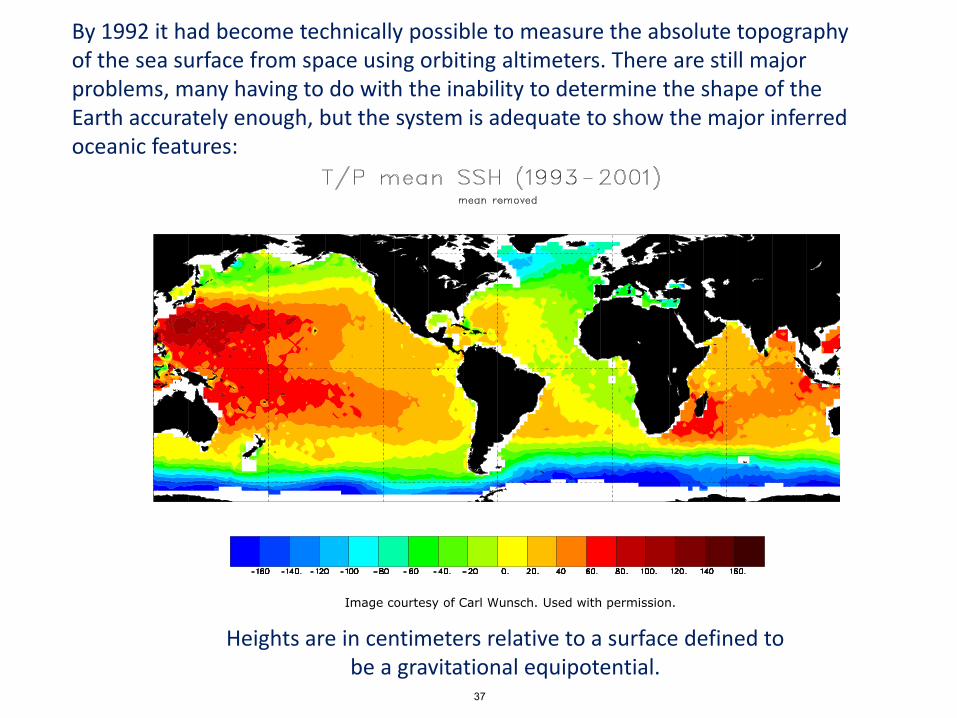
By 1992 it had become technically possible to measure the absolute topography of the sea surface from space using orbiting altimeters. There are still major problems, many having to do with the inability to determine the shape of the Earth accurately enough, but the system is adequate to show the major inferred oceanic features:
Heights are in centimeters relative to a surface defined to be a gravitational equipotential.
Image courtesy of Carl Wunsch. Used with permission.
37
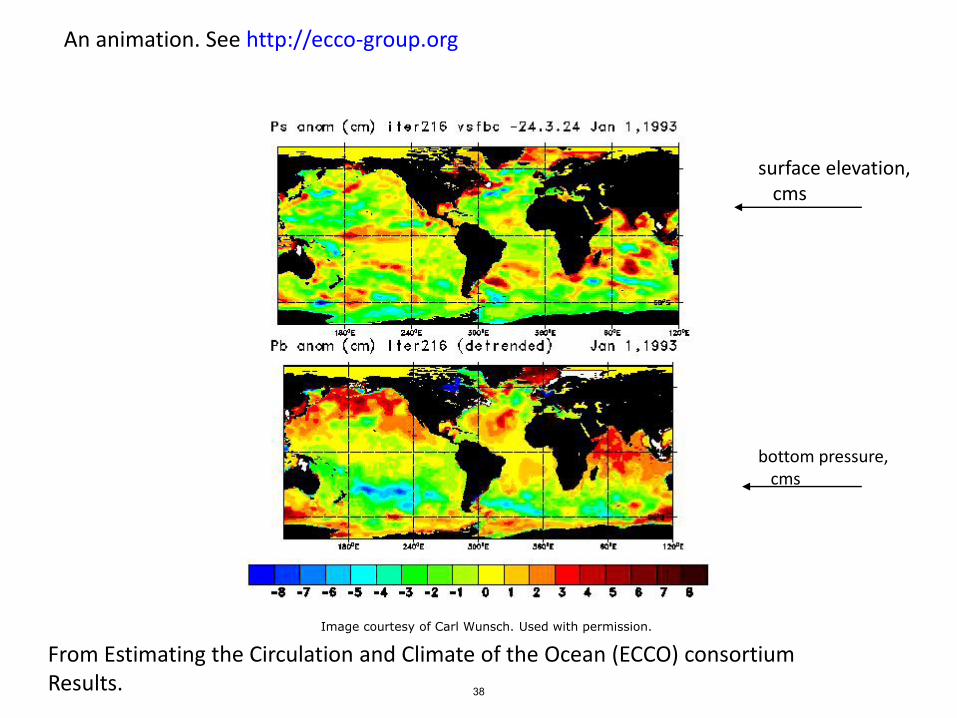
From Estimating the Circulation and Climate of the Ocean (ECCO) consortium Results.
An animation. See http://ecco-group.org
surface elevation, cms
bottom pressure, cms
Image courtesy of Carl Wunsch. Used with permission.
38
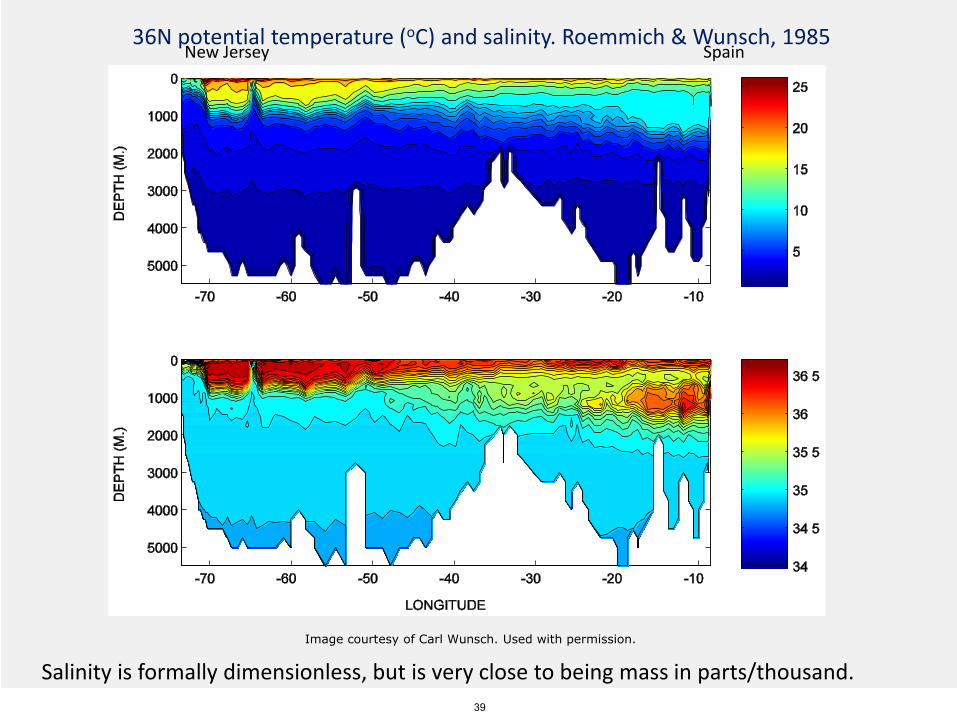
36N potential temperature (oC) and salinity. Roemmich & Wunsch, 1985
Salinity is formally dimensionless, but is very close to being mass in parts/thousand.
New Jersey Spain
Image courtesy of Carl Wunsch. Used with permission.
39
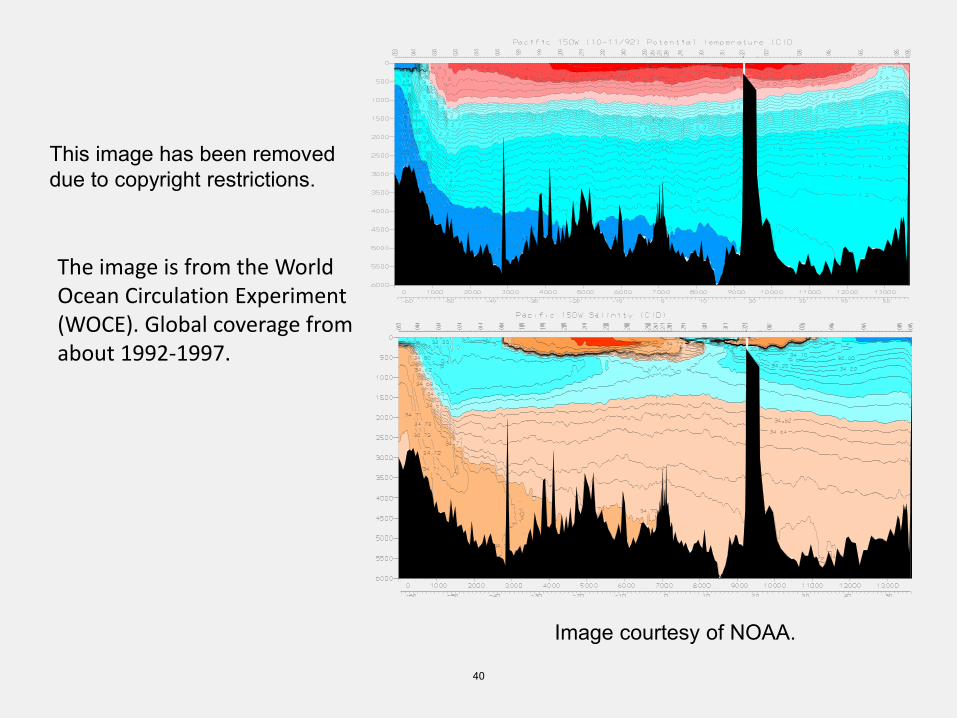
The image is from the World Ocean Circulation Experiment (WOCE). Global coverage from about 1992-1997.
This image has been removed due to copyright restrictions.
Image courtesy of NOAA.
40
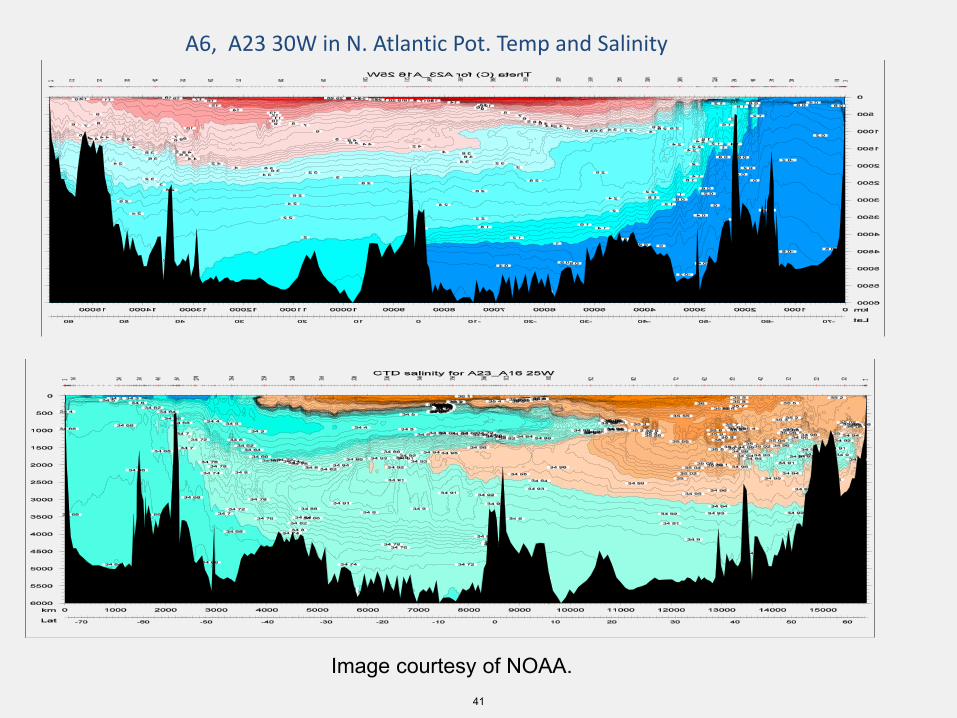
A6, A23 30W in N. Atlantic Pot. Temp and Salinity
Image courtesy of NOAA. 41
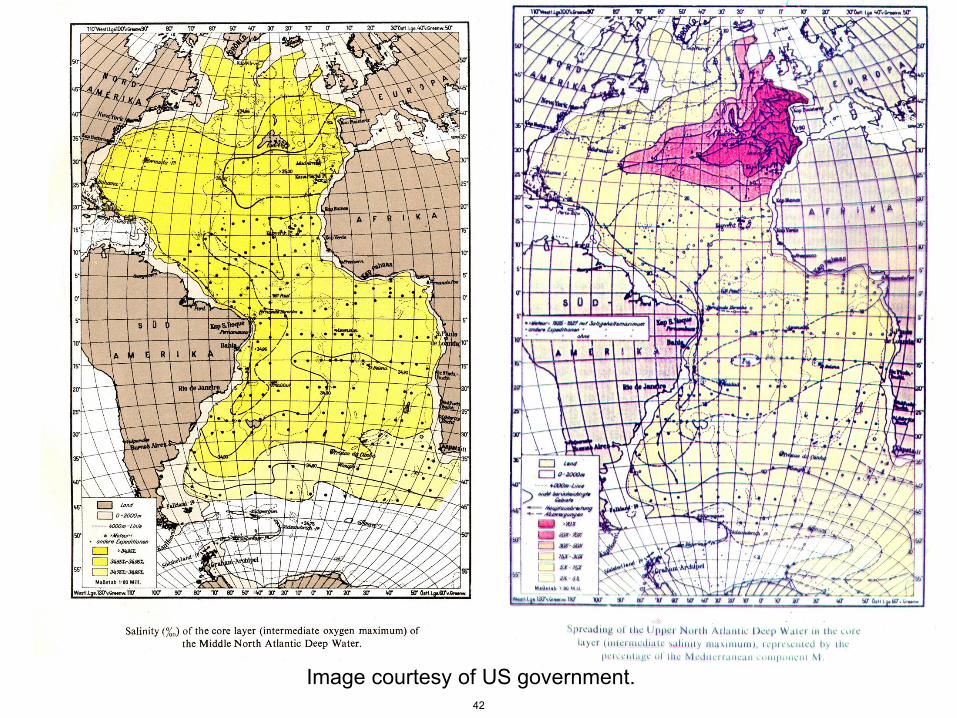
Image courtesy of US government. 42
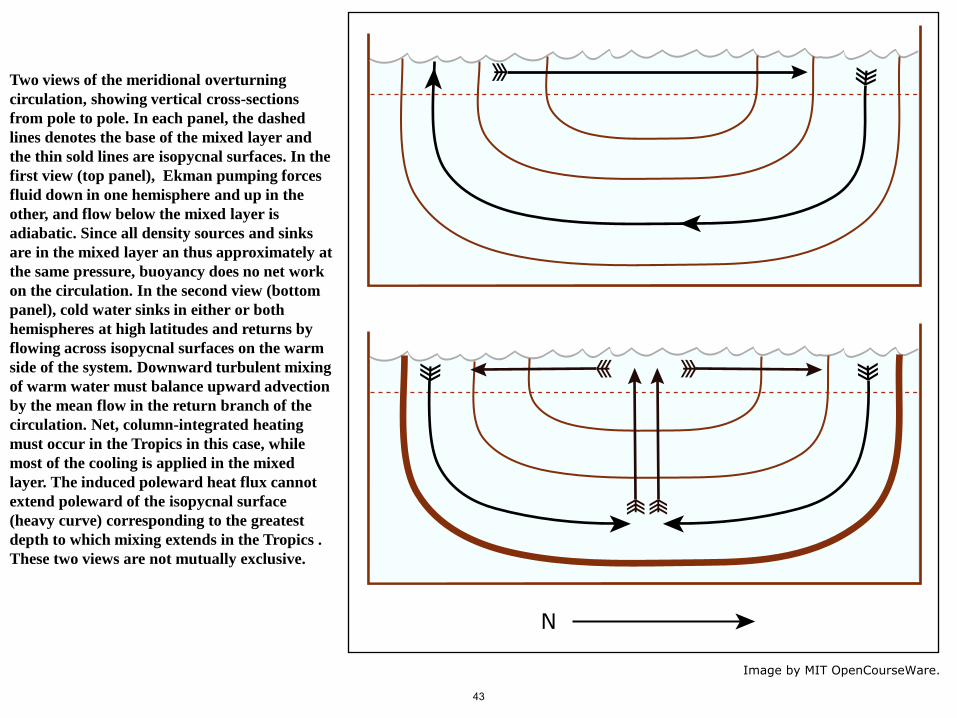
Two views of the meridional overturning
circulation, showing vertical cross-sections
from pole to pole. In each panel, the dashed
lines denotes the base of the mixed layer and
the thin sold lines are isopycnal surfaces. In the
first view (top panel), Ekman pumping forces
fluid down in one hemisphere and up in the
other, and flow below the mixed layer is
adiabatic. Since all density sources and sinks
are in the mixed layer an thus approximately at
the same pressure, buoyancy does no net work
on the circulation. In the second view (bottom
panel), cold water sinks in either or both
hemispheres at high latitudes and returns by
flowing across isopycnal surfaces on the warm
side of the system. Downward turbulent mixing
of warm water must balance upward advection
by the mean flow in the return branch of the
circulation. Net, column-integrated heating
must occur in the Tropics in this case, while
most of the cooling is applied in the mixed
layer. The induced poleward heat flux cannot
extend poleward of the isopycnal surface
(heavy curve) corresponding to the greatest
depth to which mixing extends in the Tropics .
These two views are not mutually exclusive.
43
N
Image by MIT OpenCourseWare.
MIT OpenCourseWarehttp://ocw.mit.edu
12.340 Global Warming ScienceSpring 2012 For information about citing these materials or our Terms of Use, visit: http://ocw.mit.edu/terms.