
Astron. Astrophys. 357, 255–267 (2000) ASTRONOMY AND High ...
13
Astron. Astrophys. 357, 255–267 (2000) ASTRONOMY AND ASTROPHYSICS High resolution near-infrared polarimetry of η Carinae and the Homunculus Nebula J.R. Walsh 1 and N. Ageorges 1,2 1 Space Telescope European Co-ordinating Facility, European Southern Observatory, Karl-Schwarzschild-Strasse 2, 85748 Garching bei M¨ unchen, Germany ([email protected]) 2 Physics Department, National University of Ireland – Galway, Galway, Ireland ([email protected]) Received 5 March 1999 / Accepted 7 March 2000 Abstract. High resolution near-infrared adaptive optics imag- ing and polarimetry have been obtained of the Homunculus Nebula and its central illuminating star η Carinae (HD 93308). Images and maps of the linear polarization at a resolution of <0.2 00 have been made in the J, H and K bands and in a nar- row 2.15 μm continuum band (K c ). The overall appearance of the nebula in the near-IR is similar in all bands and to that at V, with specific features less sharp to longer wavelengths. A comparison between the published HST WFPC2 1.042 μm map and the AO J band image demonstrates that ground-based AO resolution can approach that of HST. The large-scale pat- tern of polarization vectors is centro-symmetric demonstrating that single scattering dominates everywhere except perhaps in the central bright core. The only difference between the near- IR and optical appearance is a narrow linear feature at position angle 320 ◦ extending across the NW lobe of the Homunculus. Polarization maps at K c in the near vicinity of η Carinae were restored using a PSF derived from blind deconvolution. There is a definitely detected extension in the direction of the optically visible speckle knots and an estimate of 18% for the polarization of one of the knots was made. This level of polarization suggests that the knots arise in dust+gas clouds in the near environment of η Carinae, perhaps in an equatorial disc. The most remarkable result of the linear polarization map- ping is the level of similarity in the spatial structure, and also in the degree of linear polarization, between the near-IR and op- tical data. Comparison of the polarization along the projected major axis of the Homunculus shows values in the SE lobe to within a few percent from V band to 2.2 μm. In the NW lobe the near-IR linear polarization values agree to within a few per- cent over the 1.2–2.2 μm range, but are upto 10% lower than at V. Such a polarization pattern cannot arise in Mie scatter- ing from a single power law distribution of grain sizes unless the particles are very small compared with the wavelength, in disagreement with mid-IR observations. In addition the colour dependence of the extinction was found to be shallower than the typical ISM, indicating the presence of large grains. Several possibilities are explored to try to explain these contradictory results. Optical depth effects and a broad distribution in grain Send offprint requests to: J.R. Walsh sizes are favoured, perhaps with a dependence of the grain size with depth into the small obscuring clouds in the lobes of the Homunculus. However the presence of aligned grains, previ- ously inferred from mid-IR polarization, may also affect the scattered radiation from the dust. Key words: ISM: reflection nebulae – stars: individual: η Car – techniques: polarimetric 1. Introduction η Carinae, situated in the Carina complex at about 2.3kpc (Davidson & Humphreys 1997), is one of the most massive stars known in the Galaxy and is going through the Luminous Blue Variable phase (Humphreys & Davidson 1994) of unsteady mass loss (Davidson et al. 1986). During the 1840’s it underwent an outburst and reached visual magnitude -1; since then is has been emerging from the dust which condensed after this ejec- tion (Walborn & Liller, 1977). Long term monitoring of optical, IR, radio and X-ray spectra has revealed evidence of periodicity perhaps related to a binary or multiple star at the core of the nebula (Daminelli et al. 1997). The compact nebula around η Carinae (HD 93308), called the Homunculus, was first shown by Thackeray (1956) to be highly polarized. The initial polarimetry was confirmed by Wes- selink (1960) who measured linear polarization of around 40%. Visvanathan (1967) observed that the polarization centred on η Carinae was almost constant with wavelength from U to R and increased with increasing aperture size. In a small aper- ture, higher polarization was observed on the NW side of the nebula than on the SE. The first systematic polarization maps were made by Warren-Smith et al. (1979) in the V band and demonstrated a centro-symmetric pattern of polarization vec- tors with a marked asymmetry in the polarization values along the major axis (position angle ∼130 ◦ ) with values upto 40% in the NW lobe. To produce such high values of polarization in a reflection nebula, Mie scattering by silicate particles with a size distribution weighted to smaller particles was invoked and modelled by Carty et al. (1979). In the near (≤0.5 00 ) vicinity of η Car itself, speckle masking polarimetry in the Hα line and
Transcript of Astron. Astrophys. 357, 255–267 (2000) ASTRONOMY AND High ...
Astron. Astrophys. 357, 255–267 (2000) ASTRONOMYAND
ASTROPHYSICS
High resolution near-infrared polarimetryof η Carinae and the Homunculus Nebula
J.R. Walsh1 and N. Ageorges1,2
1 Space Telescope European Co-ordinating Facility, European Southern Observatory, Karl-Schwarzschild-Strasse 2, 85748 Garching beiMunchen, Germany ([email protected])
2 Physics Department, National University of Ireland – Galway, Galway, Ireland ([email protected])
Received 5 March 1999 / Accepted 7 March 2000
Abstract. High resolution near-infrared adaptive optics imag-ing and polarimetry have been obtained of the HomunculusNebula and its central illuminating starη Carinae (HD 93308).Images and maps of the linear polarization at a resolution of<0.2′′ have been made in the J, H and K bands and in a nar-row 2.15µm continuum band (Kc). The overall appearance ofthe nebula in the near-IR is similar in all bands and to thatat V, with specific features less sharp to longer wavelengths.A comparison between the published HST WFPC2 1.042µmmap and the AO J band image demonstrates that ground-basedAO resolution can approach that of HST. The large-scale pat-tern of polarization vectors is centro-symmetric demonstratingthat single scattering dominates everywhere except perhaps inthe central bright core. The only difference between the near-IR and optical appearance is a narrow linear feature at positionangle 320◦ extending across the NW lobe of the Homunculus.Polarization maps at Kc in the near vicinity ofη Carinae wererestored using a PSF derived from blind deconvolution. Thereis a definitely detected extension in the direction of the opticallyvisible speckle knots and an estimate of 18% for the polarizationof one of the knots was made. This level of polarization suggeststhat the knots arise in dust+gas clouds in the near environmentof η Carinae, perhaps in an equatorial disc.
The most remarkable result of the linear polarization map-ping is the level of similarity in the spatial structure, and also inthe degree of linear polarization, between the near-IR and op-tical data. Comparison of the polarization along the projectedmajor axis of the Homunculus shows values in the SE lobe towithin a few percent from V band to 2.2µm. In the NW lobethe near-IR linear polarization values agree to within a few per-cent over the 1.2–2.2µm range, but are upto 10% lower thanat V. Such a polarization pattern cannot arise in Mie scatter-ing from a single power law distribution of grain sizes unlessthe particles are very small compared with the wavelength, indisagreement with mid-IR observations. In addition the colourdependence of the extinction was found to be shallower thanthe typical ISM, indicating the presence of large grains. Severalpossibilities are explored to try to explain these contradictoryresults. Optical depth effects and a broad distribution in grain
Send offprint requests to: J.R. Walsh
sizes are favoured, perhaps with a dependence of the grain sizewith depth into the small obscuring clouds in the lobes of theHomunculus. However the presence of aligned grains, previ-ously inferred from mid-IR polarization, may also affect thescattered radiation from the dust.
Key words: ISM: reflection nebulae – stars: individual:η Car– techniques: polarimetric
1. Introduction
η Carinae, situated in the Carina complex at about 2.3kpc(Davidson & Humphreys 1997), is one of the most massivestars known in the Galaxy and is going through the LuminousBlue Variable phase (Humphreys & Davidson 1994) of unsteadymass loss (Davidson et al. 1986). During the 1840’s it underwentan outburst and reached visual magnitude -1; since then is hasbeen emerging from the dust which condensed after this ejec-tion (Walborn & Liller, 1977). Long term monitoring of optical,IR, radio and X-ray spectra has revealed evidence of periodicityperhaps related to a binary or multiple star at the core of thenebula (Daminelli et al. 1997).
The compact nebula aroundη Carinae (HD 93308), calledthe Homunculus, was first shown by Thackeray (1956) to behighly polarized. The initial polarimetry was confirmed by Wes-selink (1960) who measured linear polarization of around 40%.Visvanathan (1967) observed that the polarization centred onη Carinae was almost constant with wavelength from U to Rand increased with increasing aperture size. In a small aper-ture, higher polarization was observed on the NW side of thenebula than on the SE. The first systematic polarization mapswere made by Warren-Smith et al. (1979) in the V band anddemonstrated a centro-symmetric pattern of polarization vec-tors with a marked asymmetry in the polarization values alongthe major axis (position angle∼130◦) with values upto 40% inthe NW lobe. To produce such high values of polarization ina reflection nebula, Mie scattering by silicate particles with asize distribution weighted to smaller particles was invoked andmodelled by Carty et al. (1979). In the near (≤0.5′′) vicinityof η Car itself, speckle masking polarimetry in the Hα line and
256 J.R. Walsh & N. Ageorges: Near-IR polarimetry ofη Carinae
local continuum has revealed evidence for a compact equatorialdisc aligned with the minor axis of the Homunculus (Falcke etal. 1996). Within<1′′ of η Car the polarization vector patterndoes not remain centrosymmetric in the R band, suggesting thatlocal structures and perhaps intrinsic emission may contributeto the morphology and scattered light (Falcke et al. 1996). Po-larimetry in the mid-infrared, where the dust emits rather thanscatters radiation, shows an entirely different pattern of polar-ization vectors with a trend to be oriented radially, particularlynear the boundary of the emission (Aitken et al. 1995). Sucha pattern can be interpreted in terms of emission from alignedgrains; Aitken et al. (1995) suggest that the alignment mecha-nism may be gas-grain streaming, driven by the high outflowvelocity, or a remnant magnetic field from a dense magnetizeddisc.
There is a wealth of IR observations ofη Car and the Ho-munculus on account of its intrinsic IR brightness, first observedby Westphal & Neugebauer (1969), and astrophysical interest.The IR spectrum is characterized by a peak around 10µm, in-dicative of silicate grains (Mitchell & Robinson, 1978). Thereis a central IR point source together with a second peak on theminor axis of the nebula, whose separation increases from 1.1to 2.2′′ from 3.6 to 11.2µm (Hyland et al. 1979). The near-IR spectrum ofη Car shows a steep increase with wavelengthand prominent hydrogen lines of the Paschen and Brackett se-ries as well as He I lines (Whitelock et al. 1983) and weakerFe II and [Fe II] lines (Altamore et al. 1994). Maps in the J, Hand K bands show that the structure is dominated by scattering,but beyond about 3µm dust emission dominates (Allen 1989),with many clumps present. High spatial resolution observationshave reported an unresolved central source (at L and M band,Bensammar et al. 1985), with filaments and unresolved knotswithin 1′′ detected in many IR bands (Gehring 1992). Mapsin the mid-IR show a similar structure and the compact centralsource has a dust temperature∼650 K and dust mass of 10−4M�with nearby dusty clouds associated into loop features (Smithet al. 1995). This source has been so prodigiously studied atso many wavelengths that it possesses its own review article inAnnual Reviews of Astronomy and Astrophysics (Davidson &Humphries 1997).
η Car can be considered an ideal source for adaptive op-tics on account of its very bright central, almost point, source(V∼7mag. - van Genderen et al. 1994) and the limited radial ex-tent (± ≤10′′) of the Homunculus, which means that the sourceitself can be used as a reference star for the wavefront sensor. Asa consequence, off-axis anisoplaniticity does not significantlyaffect the adaptive optics (AO) correction out to the edges ofthe nebula. Previous near-infrared AO imaging ofη Car wasobtained (Rigaut & Gehring 1995), including some limited po-larimetry (Gehring 1992) using the COME-ON AO instrument.Here we report on dedicated high resolution near-IR AO imag-ing polarimetry conducted at J, H, K, and in a continuum bandat 2.15µm, using the ADONIS system and SHARP II camerawith the aim of studying the small-scale polarization structureof the Homunculus. The observations are described in Sect. 2;the reductions and polarization data are presented in Sect. 3 and
the relevance of the results for the structure and dust propertiesof this remarkable reflection nebula are discussed in Sect. 4.
2. Observations
Imaging polarimetry ofη Carinae was obtained with theADONIS Adaptive Optics instrument mounted at the F/8.1Cassegrain focus of the ESO 3.6m telescope. ADONIS is theESO common-user adaptive optics instrument; it employs a 64element deformable mirror and wave-front sensor (Beuzit etal. 1997). For the observations ofη Car, a Reticon detectorwas used as the wave-front sensor. The camera is SHARP II- a Rockwell 2562 HgCdTe NICMOS 3 array (Hofmann et al.1995). The pixel scale was chosen as 0.050′′2, giving a field ofview of 12.8×12.8′′. Although this field does not encompassthe full extent of the Homunculus nebula it was chosen so thatwell-sampled diffraction limited imaging would be possible inat least the H and K bands. Table 1 lists the observations; thetwo orientations, referred to as A and B, hadη Car in the lowerright and upper left of the array respectively (east is up; northto the right) enabling full coverage of the Homunculus. Thenarrow band 2.15µm (henceforth Kc) observations were madewith η Car in the centre of the array. For each filter and orienta-tion, exposures were made at 8 position angles of the polarizer:0.0, 22.5, 45.0, 67.5, 90.0, 112.5, 135.0, 157.5◦ in sequence.In addition a repeat of the 0◦ exposure was made with the po-larizer angle set to 180◦ in order to check the photometry andrepeatability of the polarimetric measurements. Each full se-quence of polarization measurements at the 8+1 position angleswas repeated as specified in Column 6 of Table 1. Offset skychopping was employed and the relative position of the offsetsky is listed in Column 5 of Table 1; the exposure on sky wasequal to the on-source time. As discussed in Ageorges & Walsh(1999) it was not possible to calculate reliable K band polarime-try; these data will therefore only be discussed in terms of theirhigh resolution imaging. On 1996 March 03 due to a technicalproblem, the computer control of the chopper malfunctionedand the offset sky had to be observed subsequent to each se-quence of polarizer angles, and in some cases the exposure timeon source was greater than on background sky. The last columnof Table 1 gives an indication of the external seeing as measuredby the Differential Image Motion Monitor at La Silla during theobservations. Photometric standards were not observed and noattempt has been made to determine accurate magnitudes in theJ, H, K and Kc filters.
Polarized and unpolarized standards were observed in thecourse of the observations to determine the instrumental polar-ization and any rotation of the instrumental plane of polariza-tion. The star HD 64299 which is relatively close toη Car wasobserved at J, H and K as an unpolarized standard (polarization0.15% at B (Turnshek et al. 1990) and assumed to be low inthe IR, although the actual values are not measured) and a pointsource for deconvolution. In the Kc filter, the star HD 94510was observed. These stars were chosen primarily to be brightbut not so bright as to saturate the SHARP II camera. ADONISobservations of these stars and the polarized reference sources
J.R. Walsh & N. Ageorges: Near-IR polarimetry ofη Carinae 257
Table 1.ADONIS Polarimetry Observations ofη Carinae
Field Filter No. Exp. Offset sky No. Date Seeingλc,∆λ (µm) Frames (ms) ∆α,∆δ(′′) Repeats (′′)
KA 2.16,0.16 200 50 0,-18 2 1996 Mar 01 1.2KB -18,0 2HA 1.64,0.18 200 50 0,-18 2 1996 Mar 02 0.8HB -18,0 2JA 1.25,0.15 200 50 0,-18 1 1996 Mar 03 0.7JB -18,0 1Kc 2.145,0.017 100 50 -18,0 2 1996 Mar 03 0.8
are fully described in Ageorges & Walsh (1999), where the ob-servational details are also given.
3. Reductions and results
3.1. Basic reduction
The data cubes at each position of the polarizer consists of M× 256×256 pixel frames, where M is given as the number offrames in Table 1. To produce a single image for each of the nineselected polarizer angles, the data were flat fielded using imagesobtained at the beginning of the night on the twilight sky withan identical set of polarizer angles. The data cubes were used toderive a bad pixel map as described by Ageorges & Walsh (1999)using a sky variation method. The sky from the offset positionwas subtracted separately from each of the M frames beforecombination into a single image for each polarizer angle. Thesereductions were performed with the dedicated adaptive opticsreduction package ‘eclipse’ (Devillard 1997). The data framesat position angle 157.5◦ were not used in any computations ofpolarization on account of the discrepancy noted by Ageorges& Walsh (1999). The reduced data then consisted of 2 sets ofK band image pairs; 2 sets of H band image pairs; and 1 set ofJ band images; all withη Car displaced from the centre of thedetector and 1 set of Kc filter images centred onη Car.
3.2. Registration of images
The rotation of the polarizer induces a small shift of upto 3 pix-els in the position of the images (see Ageorges & Walsh 1999,Fig. 2) and coupled with the (intended) shifts ofη Car acrossthe SHARP II field, it is necessary to carefully align all imagesto a common centre in order to calculate precise colour or po-larization maps for the whole of the Homunculus. On the J, Hand K frames, the image ofη Car was saturated (overflow ofA-to-D converter). The centroids of all the J, H and K imageswere determined using a large radius (30 pixels = 1.5′′); it wasfound that with such a large radius the centroid was not sensitiveto the saturated core (typically a few pixel radius). Combinedimages of the coverage of the whole nebula, at each position ofthe polarizer, were formed by shifting, and rotating by 90◦, eachimage pair (e.g. JA and JB which were taken consecutively) toa common centre and averaging the pixels in common. The ro-tation was required to produce astronomical orientation. Shifts
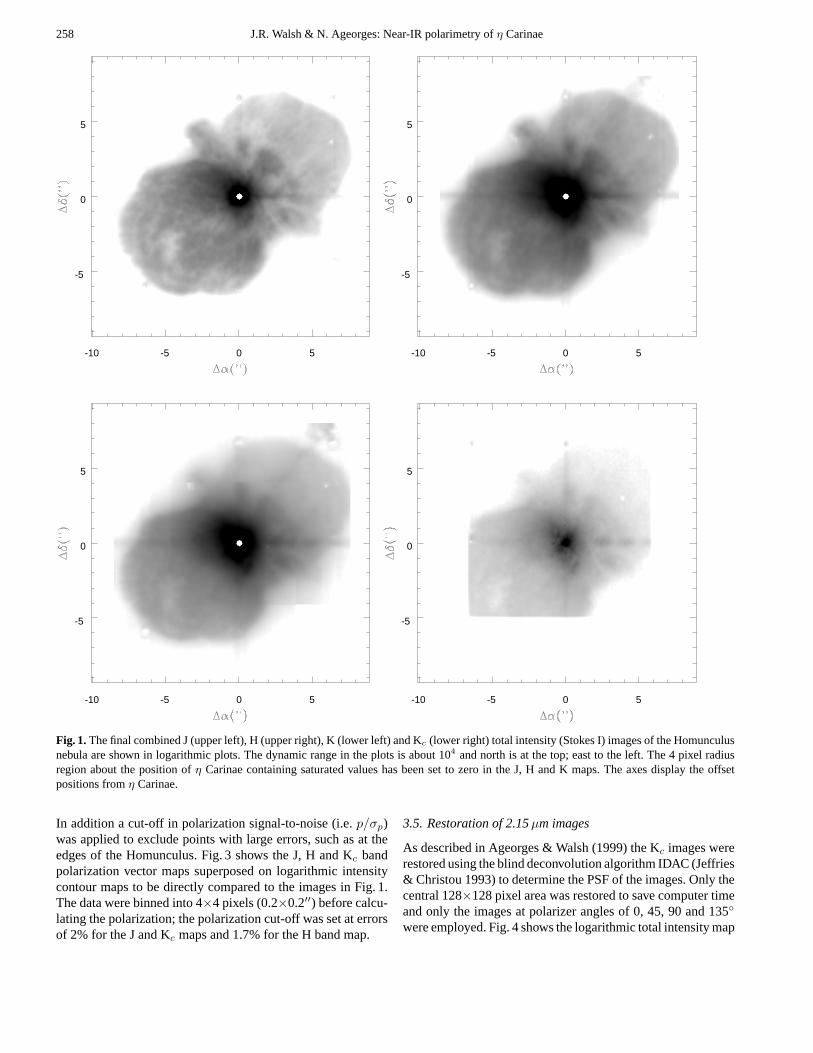
were restricted to integer pixels, thus the alignment can have amaximum error of 0.050′′. The alignment procedure was care-fully checked by examining the coincidence of features in thenebula and in the core when saturation was not severe (e.g. inthe J band images in particular). Where there were repeats ofthe full combined image (Column 6 of Table 1), the two sets ofimages were averaged. The result was an image of dimensions326×326 pixels (16.3×16.3′′) with no data in the top left andlower right corners. Fig. 1 shows the J, H, K and Kc total fluximages (i.e. Stokes I) on a logarithmic scale. All images haveidentical scale and orientation. In the J, H and K images thesaturation of the central source is indicated by the zero flaggedpixels (region of radius 4 pixels about position of peak). Thereare a variety of artifacts: diffraction spikes along the principalaxes caused by the secondary support; low level changes con-sequent on merging images (the overlap regions were used toscale the image pairs); a doughnut shaped feature caused bya hot pixel cluster which occurs at equal declination values atthe extremity of the NW and SE lobes and near the rim of theNW lobe. These features, which are most apparent on the colourmaps (Fig. 2), have not been masked out but are obviously notinterpreted.
3.3. Colour maps
‘Colour’ maps were made by ratioing the J, H and K images. Acut-off in the form of a mask was applied to each colour mapin order to prevent division by small numbers and producesthe sharp bulbous edges in the maps. Fig. 2 shows the J/H andH/K images on a logarithmic scale. On account of saturationthe values over the core do not hold any colour information andhave been set to zero. The range of valid ratio values are: (J-H)0.02–2.5 mag.; (H-K) 0.02–1.5 mag.
3.4. Polarization maps
The linear polarization and position angle were calculated forthe combined maps by fitting a cosine 2×θ curve to values ateach point as a function of polarizer angle as fully describedin Ageorges & Walsh (1999). The discrepant point at PA 157.5was not included in these fits (Ageorges & Walsh 1999). Theinput images were binned to improve the signal-to-noise in thepolarization determination at the expense of spatial resolution.
258 J.R. Walsh & N. Ageorges: Near-IR polarimetry ofη Carinae
-10 -5 0 5
-5
0
5
-10 -5 0 5
-5
0
5
-10 -5 0 5
-5
0
5
-10 -5 0 5
-5
0
5
Fig. 1.The final combined J (upper left), H (upper right), K (lower left) and Kc (lower right) total intensity (Stokes I) images of the Homunculusnebula are shown in logarithmic plots. The dynamic range in the plots is about 104 and north is at the top; east to the left. The 4 pixel radiusregion about the position ofη Carinae containing saturated values has been set to zero in the J, H and K maps. The axes display the offsetpositions fromη Carinae.
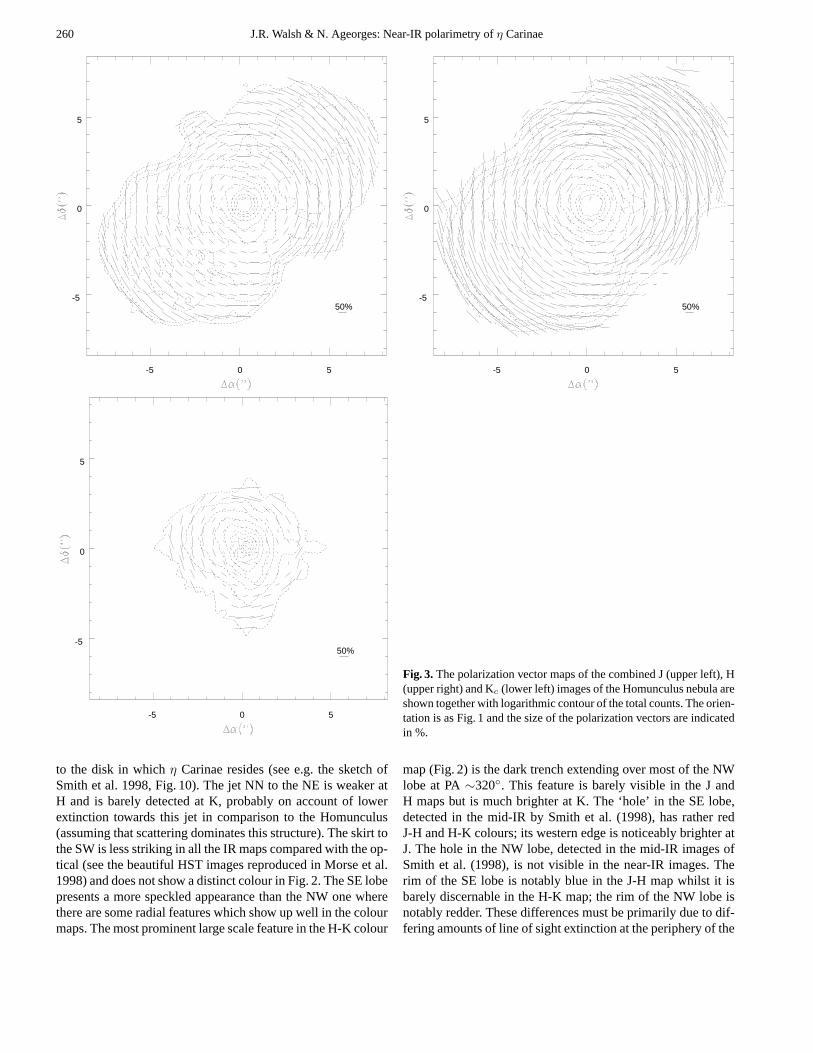
In addition a cut-off in polarization signal-to-noise (i.e.p/σp)was applied to exclude points with large errors, such as at theedges of the Homunculus. Fig. 3 shows the J, H and Kc bandpolarization vector maps superposed on logarithmic intensitycontour maps to be directly compared to the images in Fig. 1.The data were binned into 4×4 pixels (0.2×0.2′′) before calcu-lating the polarization; the polarization cut-off was set at errorsof 2% for the J and Kc maps and 1.7% for the H band map.
3.5. Restoration of 2.15µm images
As described in Ageorges & Walsh (1999) the Kc images wererestored using the blind deconvolution algorithm IDAC (Jeffries& Christou 1993) to determine the PSF of the images. Only thecentral 128×128 pixel area was restored to save computer timeand only the images at polarizer angles of 0, 45, 90 and 135◦
were employed. Fig. 4 shows the logarithmic total intensity map
J.R. Walsh & N. Ageorges: Near-IR polarimetry ofη Carinae 259
-10 -5 0 5
-5
0
5
-10 -5 0 5
-5
0
5
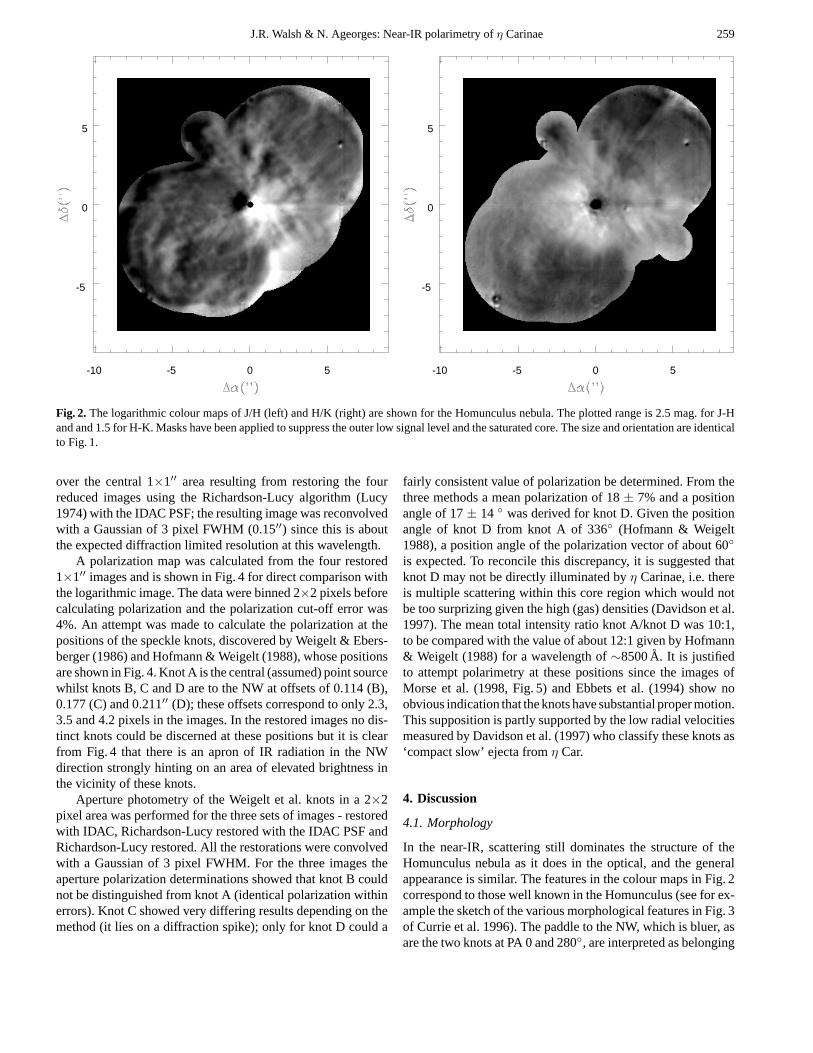
Fig. 2. The logarithmic colour maps of J/H (left) and H/K (right) are shown for the Homunculus nebula. The plotted range is 2.5 mag. for J-Hand and 1.5 for H-K. Masks have been applied to suppress the outer low signal level and the saturated core. The size and orientation are identicalto Fig. 1.
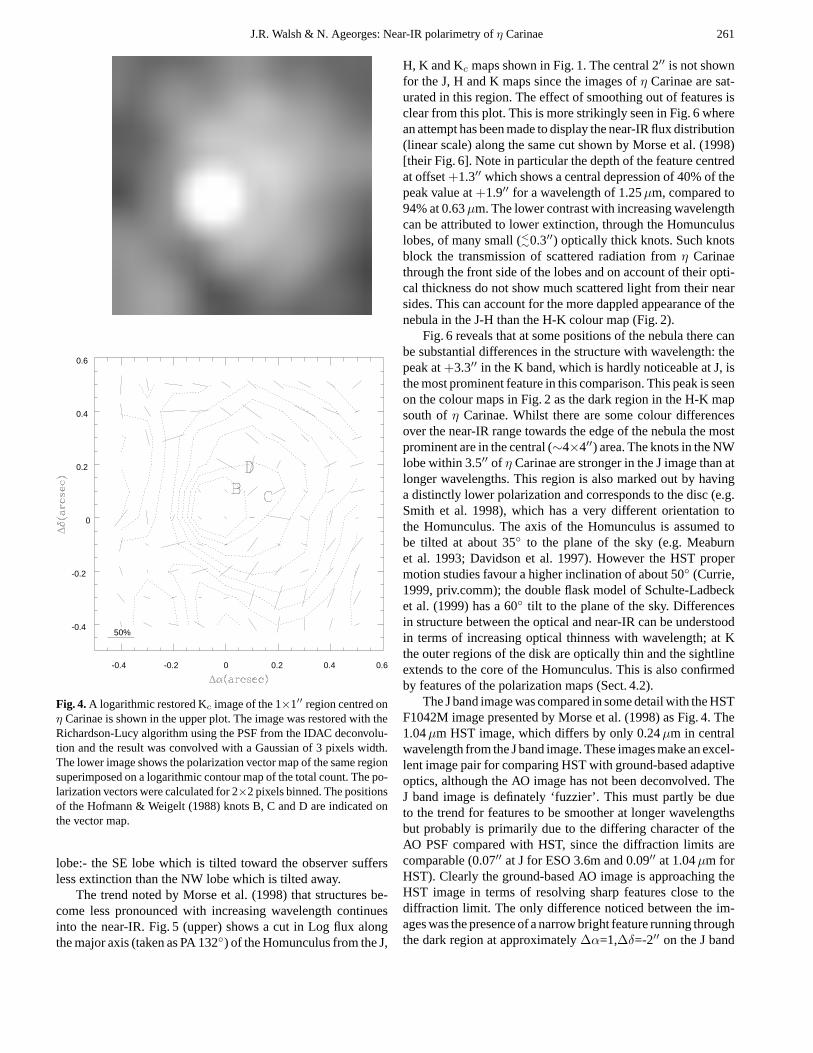
over the central 1×1′′ area resulting from restoring the fourreduced images using the Richardson-Lucy algorithm (Lucy1974) with the IDAC PSF; the resulting image was reconvolvedwith a Gaussian of 3 pixel FWHM (0.15′′) since this is aboutthe expected diffraction limited resolution at this wavelength.
A polarization map was calculated from the four restored1×1′′ images and is shown in Fig. 4 for direct comparison withthe logarithmic image. The data were binned 2×2 pixels beforecalculating polarization and the polarization cut-off error was4%. An attempt was made to calculate the polarization at thepositions of the speckle knots, discovered by Weigelt & Ebers-berger (1986) and Hofmann & Weigelt (1988), whose positionsare shown in Fig. 4. Knot A is the central (assumed) point sourcewhilst knots B, C and D are to the NW at offsets of 0.114 (B),0.177 (C) and 0.211′′ (D); these offsets correspond to only 2.3,3.5 and 4.2 pixels in the images. In the restored images no dis-tinct knots could be discerned at these positions but it is clearfrom Fig. 4 that there is an apron of IR radiation in the NWdirection strongly hinting on an area of elevated brightness inthe vicinity of these knots.
Aperture photometry of the Weigelt et al. knots in a 2×2pixel area was performed for the three sets of images - restoredwith IDAC, Richardson-Lucy restored with the IDAC PSF andRichardson-Lucy restored. All the restorations were convolvedwith a Gaussian of 3 pixel FWHM. For the three images theaperture polarization determinations showed that knot B couldnot be distinguished from knot A (identical polarization withinerrors). Knot C showed very differing results depending on themethod (it lies on a diffraction spike); only for knot D could a
fairly consistent value of polarization be determined. From thethree methods a mean polarization of 18± 7% and a positionangle of 17± 14 ◦ was derived for knot D. Given the positionangle of knot D from knot A of 336◦ (Hofmann & Weigelt1988), a position angle of the polarization vector of about 60◦
is expected. To reconcile this discrepancy, it is suggested thatknot D may not be directly illuminated byη Carinae, i.e. thereis multiple scattering within this core region which would notbe too surprizing given the high (gas) densities (Davidson et al.1997). The mean total intensity ratio knot A/knot D was 10:1,to be compared with the value of about 12:1 given by Hofmann& Weigelt (1988) for a wavelength of∼8500A. It is justifiedto attempt polarimetry at these positions since the images ofMorse et al. (1998, Fig. 5) and Ebbets et al. (1994) show noobvious indication that the knots have substantial proper motion.This supposition is partly supported by the low radial velocitiesmeasured by Davidson et al. (1997) who classify these knots as‘compact slow’ ejecta fromη Car.
4. Discussion
4.1. Morphology
In the near-IR, scattering still dominates the structure of theHomunculus nebula as it does in the optical, and the generalappearance is similar. The features in the colour maps in Fig. 2correspond to those well known in the Homunculus (see for ex-ample the sketch of the various morphological features in Fig. 3of Currie et al. 1996). The paddle to the NW, which is bluer, asare the two knots at PA 0 and 280◦, are interpreted as belonging
260 J.R. Walsh & N. Ageorges: Near-IR polarimetry ofη Carinae
-5 0 5
-5
0
5
50%
-5 0 5
-5
0
5
50%
-5 0 5
-5
0
5
50%
Fig. 3. The polarization vector maps of the combined J (upper left), H(upper right) and Kc (lower left) images of the Homunculus nebula areshown together with logarithmic contour of the total counts. The orien-tation is as Fig. 1 and the size of the polarization vectors are indicatedin %.
to the disk in whichη Carinae resides (see e.g. the sketch ofSmith et al. 1998, Fig. 10). The jet NN to the NE is weaker atH and is barely detected at K, probably on account of lowerextinction towards this jet in comparison to the Homunculus(assuming that scattering dominates this structure). The skirt tothe SW is less striking in all the IR maps compared with the op-tical (see the beautiful HST images reproduced in Morse et al.1998) and does not show a distinct colour in Fig. 2. The SE lobepresents a more speckled appearance than the NW one wherethere are some radial features which show up well in the colourmaps. The most prominent large scale feature in the H-K colour
map (Fig. 2) is the dark trench extending over most of the NWlobe at PA∼320◦. This feature is barely visible in the J andH maps but is much brighter at K. The ‘hole’ in the SE lobe,detected in the mid-IR by Smith et al. (1998), has rather redJ-H and H-K colours; its western edge is noticeably brighter atJ. The hole in the NW lobe, detected in the mid-IR images ofSmith et al. (1998), is not visible in the near-IR images. Therim of the SE lobe is notably blue in the J-H map whilst it isbarely discernable in the H-K map; the rim of the NW lobe isnotably redder. These differences must be primarily due to dif-fering amounts of line of sight extinction at the periphery of the
J.R. Walsh & N. Ageorges: Near-IR polarimetry ofη Carinae 261
-0.4 -0.2 0 0.2 0.4 0.6
-0.4
-0.2
0
0.2
0.4
0.6
50%
Fig. 4.A logarithmic restored Kc image of the 1×1′′ region centred onη Carinae is shown in the upper plot. The image was restored with theRichardson-Lucy algorithm using the PSF from the IDAC deconvolu-tion and the result was convolved with a Gaussian of 3 pixels width.The lower image shows the polarization vector map of the same regionsuperimposed on a logarithmic contour map of the total count. The po-larization vectors were calculated for 2×2 pixels binned. The positionsof the Hofmann & Weigelt (1988) knots B, C and D are indicated onthe vector map.
lobe:- the SE lobe which is tilted toward the observer suffersless extinction than the NW lobe which is tilted away.
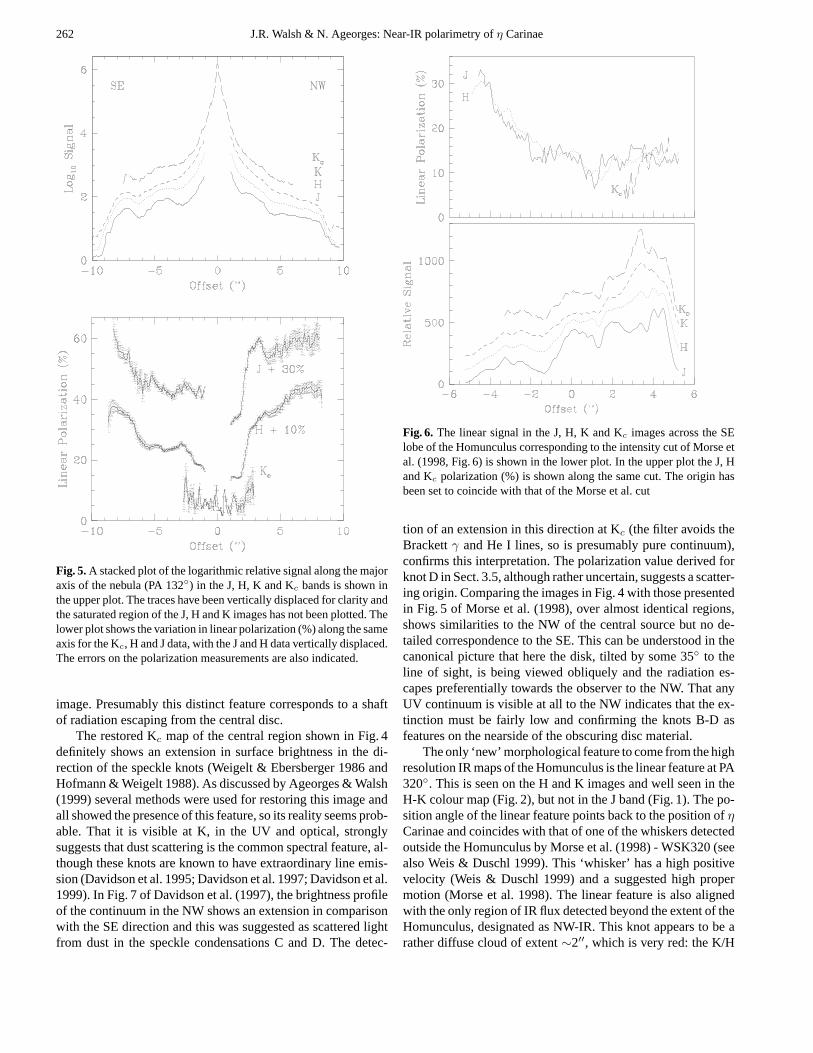
The trend noted by Morse et al. (1998) that structures be-come less pronounced with increasing wavelength continuesinto the near-IR. Fig. 5 (upper) shows a cut in Log flux alongthe major axis (taken as PA 132◦) of the Homunculus from the J,
H, K and Kc maps shown in Fig. 1. The central 2′′ is not shownfor the J, H and K maps since the images ofη Carinae are sat-urated in this region. The effect of smoothing out of features isclear from this plot. This is more strikingly seen in Fig. 6 wherean attempt has been made to display the near-IR flux distribution(linear scale) along the same cut shown by Morse et al. (1998)[their Fig. 6]. Note in particular the depth of the feature centredat offset+1.3′′ which shows a central depression of 40% of thepeak value at+1.9′′ for a wavelength of 1.25µm, compared to94% at 0.63µm. The lower contrast with increasing wavelengthcan be attributed to lower extinction, through the Homunculuslobes, of many small (<
∼0.3′′) optically thick knots. Such knotsblock the transmission of scattered radiation fromη Carinaethrough the front side of the lobes and on account of their opti-cal thickness do not show much scattered light from their nearsides. This can account for the more dappled appearance of thenebula in the J-H than the H-K colour map (Fig. 2).
Fig. 6 reveals that at some positions of the nebula there canbe substantial differences in the structure with wavelength: thepeak at+3.3′′ in the K band, which is hardly noticeable at J, isthe most prominent feature in this comparison. This peak is seenon the colour maps in Fig. 2 as the dark region in the H-K mapsouth ofη Carinae. Whilst there are some colour differencesover the near-IR range towards the edge of the nebula the mostprominent are in the central (∼4×4′′) area. The knots in the NWlobe within 3.5′′ of η Carinae are stronger in the J image than atlonger wavelengths. This region is also marked out by havinga distinctly lower polarization and corresponds to the disc (e.g.Smith et al. 1998), which has a very different orientation tothe Homunculus. The axis of the Homunculus is assumed tobe tilted at about 35◦ to the plane of the sky (e.g. Meaburnet al. 1993; Davidson et al. 1997). However the HST propermotion studies favour a higher inclination of about 50◦ (Currie,1999, priv.comm); the double flask model of Schulte-Ladbecket al. (1999) has a 60◦ tilt to the plane of the sky. Differencesin structure between the optical and near-IR can be understoodin terms of increasing optical thinness with wavelength; at Kthe outer regions of the disk are optically thin and the sightlineextends to the core of the Homunculus. This is also confirmedby features of the polarization maps (Sect. 4.2).
The J band image was compared in some detail with the HSTF1042M image presented by Morse et al. (1998) as Fig. 4. The1.04µm HST image, which differs by only 0.24µm in centralwavelength from the J band image. These images make an excel-lent image pair for comparing HST with ground-based adaptiveoptics, although the AO image has not been deconvolved. TheJ band image is definately ‘fuzzier’. This must partly be dueto the trend for features to be smoother at longer wavelengthsbut probably is primarily due to the differing character of theAO PSF compared with HST, since the diffraction limits arecomparable (0.07′′ at J for ESO 3.6m and 0.09′′ at 1.04µm forHST). Clearly the ground-based AO image is approaching theHST image in terms of resolving sharp features close to thediffraction limit. The only difference noticed between the im-ages was the presence of a narrow bright feature running throughthe dark region at approximately∆α=1,∆δ=-2′′ on the J band
262 J.R. Walsh & N. Ageorges: Near-IR polarimetry ofη Carinae
Fig. 5.A stacked plot of the logarithmic relative signal along the majoraxis of the nebula (PA 132◦) in the J, H, K and Kc bands is shown inthe upper plot. The traces have been vertically displaced for clarity andthe saturated region of the J, H and K images has not been plotted. Thelower plot shows the variation in linear polarization (%) along the sameaxis for the Kc, H and J data, with the J and H data vertically displaced.The errors on the polarization measurements are also indicated.
image. Presumably this distinct feature corresponds to a shaftof radiation escaping from the central disc.
The restored Kc map of the central region shown in Fig. 4definitely shows an extension in surface brightness in the di-rection of the speckle knots (Weigelt & Ebersberger 1986 andHofmann & Weigelt 1988). As discussed by Ageorges & Walsh(1999) several methods were used for restoring this image andall showed the presence of this feature, so its reality seems prob-able. That it is visible at K, in the UV and optical, stronglysuggests that dust scattering is the common spectral feature, al-though these knots are known to have extraordinary line emis-sion (Davidson et al. 1995; Davidson et al. 1997; Davidson et al.1999). In Fig. 7 of Davidson et al. (1997), the brightness profileof the continuum in the NW shows an extension in comparisonwith the SE direction and this was suggested as scattered lightfrom dust in the speckle condensations C and D. The detec-
Fig. 6. The linear signal in the J, H, K and Kc images across the SElobe of the Homunculus corresponding to the intensity cut of Morse etal. (1998, Fig. 6) is shown in the lower plot. In the upper plot the J, Hand Kc polarization (%) is shown along the same cut. The origin hasbeen set to coincide with that of the Morse et al. cut
tion of an extension in this direction at Kc (the filter avoids theBrackettγ and He I lines, so is presumably pure continuum),confirms this interpretation. The polarization value derived forknot D in Sect. 3.5, although rather uncertain, suggests a scatter-ing origin. Comparing the images in Fig. 4 with those presentedin Fig. 5 of Morse et al. (1998), over almost identical regions,shows similarities to the NW of the central source but no de-tailed correspondence to the SE. This can be understood in thecanonical picture that here the disk, tilted by some 35◦ to theline of sight, is being viewed obliquely and the radiation es-capes preferentially towards the observer to the NW. That anyUV continuum is visible at all to the NW indicates that the ex-tinction must be fairly low and confirming the knots B-D asfeatures on the nearside of the obscuring disc material.
The only ‘new’ morphological feature to come from the highresolution IR maps of the Homunculus is the linear feature at PA320◦. This is seen on the H and K images and well seen in theH-K colour map (Fig. 2), but not in the J band (Fig. 1). The po-sition angle of the linear feature points back to the position ofηCarinae and coincides with that of one of the whiskers detectedoutside the Homunculus by Morse et al. (1998) - WSK320 (seealso Weis & Duschl 1999). This ‘whisker’ has a high positivevelocity (Weis & Duschl 1999) and a suggested high propermotion (Morse et al. 1998). The linear feature is also alignedwith the only region of IR flux detected beyond the extent of theHomunculus, designated as NW-IR. This knot appears to be arather diffuse cloud of extent∼2′′, which is very red: the K/H
J.R. Walsh & N. Ageorges: Near-IR polarimetry ofη Carinae 263
flux ratio of the knot is twice that of the nearby region of theNW lobe of the Homunculus. NW-IR is highly polarized at Hand well detected; the value of linear polarization is 36% in a0.5′′ aperture. This value is slightly larger than the correspond-ing values for the edge of the Homunculus nearest the knot (seeFig. 3 where the feature is apparent and Fig. 5 for the polariza-tion at the edge of the Homunculus). It is a real feature as it wasobserved on both H and K band images (the signal-to-noise wasnot large enough to detect it on the Kc image) and is presum-ably a dusty knot on the symmetry axis of the NW lobe. It wasnot however seen on the 2.15µm image of Smith et al. (1998)perhaps on account of lower signal-to-noise.
If the whiskers are high velocity ejecta then consideringtheir high length-to-width ratio, an extreme collimation mecha-nism is suggested. The detection of an aligned feature inside theHomunculus suggests that this could be a spatially continuousjet feature extending from close toη Carinae. There is slightlyelevated polarization (3–4% above the mean of the surround-ings) on this narrow feature with a trend to lower polarization onboth sides of its length (1–2% less). The elevated polarizationsuggests that the feature cannot be intrinsic line emission whichwould dilute the polarized flux. From the HST WFPC2 images,the whiskers are however bright in [N II] line emission. Thedetectable polarization within the Homunculus and the pres-ence of a dust cloud at the end of this linear feature suggestsa confined dust+gas feature. The NW-IR dust cloud is how-ever in strong contrast with the highly confined line emission.It cannot be directly claimed that both are aspects of the samephenomenon although it is highly suggestive. It is suggested thatthe reason the linear feature is not seen at optical wavelengthsand in the J band is on account of its being confined to the insideof the Homunculus where there is enough extinction to maskit at lower wavelengths. Clearly this feature would repay fur-ther study at high spatial resolution and with spectroscopy. NoIR features were convincingly seen associated with any of theother whiskers. The jet NN is probably ballistic (e.g. Currie etal. 1996) and the whiskers may be also; so detectable remnantsmay be expected extending back toη Carinae itself. The con-fusion by extinction and dust scattering however makes this adifficult task.
4.2. Linear polarization structure
The polarization maps shown in Fig. 3 have a smooth appear-ance. The structure of the polarization vectors shows no strongevidence for diverging from the characteristic centro-symmetricpattern indicating illumination by a central source. This resultis in contrast to the optical polarization maps of Warren-Smithet al. (1979), which show a slightly elliptical pattern of po-larization vectors. This difference indicates that the dust mustbe substantially optically thick in the central waist in the op-tical but thin in the J to K region. The overall smoothness ofthe polarization maps indicates that there cannot be substantialvariations in the positions of the scattering centres along theline of sight through the lobes otherwise the polarization wouldvary between say the back and front of the lobe (assuming a
-10 -5 0 5
-5
0
5
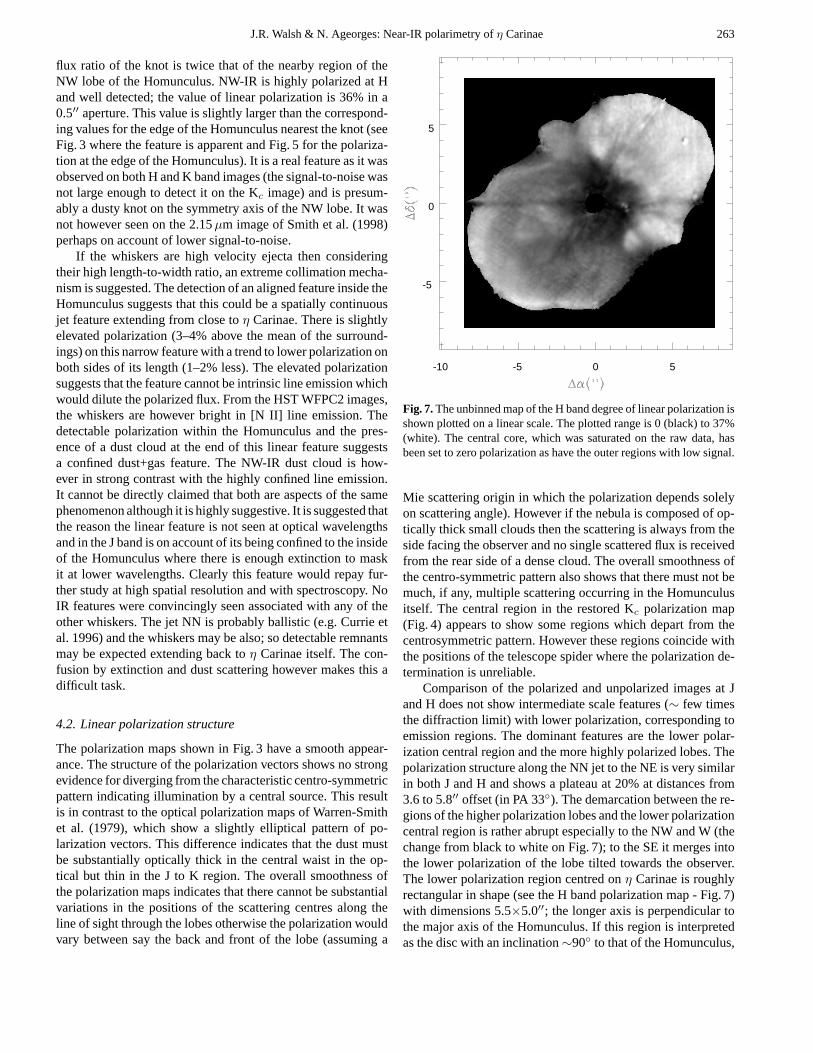
Fig. 7.The unbinned map of the H band degree of linear polarization isshown plotted on a linear scale. The plotted range is 0 (black) to 37%(white). The central core, which was saturated on the raw data, hasbeen set to zero polarization as have the outer regions with low signal.
Mie scattering origin in which the polarization depends solelyon scattering angle). However if the nebula is composed of op-tically thick small clouds then the scattering is always from theside facing the observer and no single scattered flux is receivedfrom the rear side of a dense cloud. The overall smoothness ofthe centro-symmetric pattern also shows that there must not bemuch, if any, multiple scattering occurring in the Homunculusitself. The central region in the restored Kc polarization map(Fig. 4) appears to show some regions which depart from thecentrosymmetric pattern. However these regions coincide withthe positions of the telescope spider where the polarization de-termination is unreliable.
Comparison of the polarized and unpolarized images at Jand H does not show intermediate scale features (∼ few timesthe diffraction limit) with lower polarization, corresponding toemission regions. The dominant features are the lower polar-ization central region and the more highly polarized lobes. Thepolarization structure along the NN jet to the NE is very similarin both J and H and shows a plateau at 20% at distances from3.6 to 5.8′′ offset (in PA 33◦). The demarcation between the re-gions of the higher polarization lobes and the lower polarizationcentral region is rather abrupt especially to the NW and W (thechange from black to white on Fig. 7); to the SE it merges intothe lower polarization of the lobe tilted towards the observer.The lower polarization region centred onη Carinae is roughlyrectangular in shape (see the H band polarization map - Fig. 7)with dimensions 5.5×5.0′′; the longer axis is perpendicular tothe major axis of the Homunculus. If this region is interpretedas the disc with an inclination∼90◦ to that of the Homunculus,
264 J.R. Walsh & N. Ageorges: Near-IR polarimetry ofη Carinae
then the NW region has the smaller inclination to the line ofsight and the low polarization could arise on account of smallscattering angles. The SE section of the disc should be behindthe SE lobe and would therefore have low polarization on ac-count of large scattering angles, be faint and relatively obscuredby dust in the foreground lobe. For an inclination of the disc of∼35◦ to the line of sight, the deprojected diameter is 10′′ whichis similar to the projected minor axis diameter of the nebula(PA 42◦) excluding the NN jet and the skirt to the SW. It hasbeen suggested that the central low polarization region reflectsa change in grain properties (Smith et al. 1998). However ifthe grains were smaller in the disc than in the lobes, then thepolarization should be larger at long wavelengths.
The values of the linear polarization along the projectedmajor axis at J, H and Kc (Fig. 5) are very strikingly similar.This can be compared to the polarization along the same axisat V shown in Warren-Smith et al. (1979) [Fig. 2 with direc-tion reversed] and Schulte-Ladbeck et al. (1999), Fig. 9. Froma low plateau of about 5% in the central region, the polariza-tion rapidly increases to about 20% at 2.5′′ NW and less steeplyto 13% at 2.5′′ SE. In the SE lobe the polarization values areidentical to within 2% at J and H (i.e. within the errors). Theshape of the polarization profile is also identical to that at V(Schulte-Ladbeck et al. 1999) but the V values are 3% higheron average with the SE edge about 6% higher, i.e. definatelylarger than the typical errors. In the NW lobe the J polarizationhas a pronounced peak at+3.3′′; this peak is also apparent atV but less pronounced at H. The J and H values both increasesteadily from 25% at 4′′ offset to 33% in J and 30% in H bandat 8′′ offset. At V the polarization has a different behaviour: itis higher (around 40%), flatter with offset and shows a decreasebeyond 7′′.
The change in the magnitude of the peak at 3′′ offset NWwith wavelength can be interpreted as caused by different ex-tinction optical depths in the various bands. At J (and V), thescattering arises predominantly in the equatorial disc, which hasan inclination of about 35◦ and thus gives rise to polarizationfrom scattering angles at around this value; at H the opticaldepth is lower and the disc begins to become transparent at thiswavelength and there is a greater contribution of scattered fluxfrom the rear lobe of the Homunculus. Further out in the NWlobe the H band polarization is systematically a few percenthigher than at J whilst the V band polarization is about 10%higher. The difference between V and J band polarizations isreadily understood in terms of the scattering at longer wave-length arising from deeper within the lobe since the line of sightextinction optical depth is lower. The V band polarization inthe NW lobe, which is tilted away from the line of sight, arisespredominantly from the nearside of the lobe where the scatter-ing angle is closer to 90◦. The elevated polarization in the Hband over the J band is the reverse of the trend of polarizationdecreasing with wavelength, but consistent with the presenceof grains small with respect to the wavelength. However thededuction from the mid-IR data and colour temperature mapsof Smith et al. (1998) suggest the hotter (∼400 K) core dustis caused by smaller (∼0.2µm) grains and the cooler (∼200 K)
outer lobes by larger (1–2µm) silicate grains (see also Robinsonet al. 1987). None of these suggested grain sizes can explain thesmall changes of polarization with wavelength in the optical-IRrange.
In Fig. 6 (upper) the linear polarization at J, H and Kc acrossthe cut of Morse et al. (1998) is shown. The similarity of overallvalues is again apparent as for the projected major axis (Fig. 5),but there are local differences. At offset−1.5 to−2.0′′ for ex-ample, there is a distinct dip in the polarization at J by∼4% andat offset+3 to +4′′ the peak in emission at Kc has lower po-larization than at J and H. These differences can be interpretedas due to scattering from material at different depths within thenebula suffering differing amounts of extinction giving rise todifferent scattering angles and hence lower polarization. Thedip at−1.5 to−2.0′′ is accountable by extinction at J biasingthe polarization to regions nearer to the observer; the region at+3.5′′ coming from a more extincted rearward region, perhapsin the equatorial disc.
4.3. Dust properties and structure
The most surprizing result of the IR polarization measurementsis that the polarization along the long axis shown in Fig. 5 is sosimilar in J and H. In the SE lobe the polarization values arealso within a few percent of those at V. This was totally unex-pected. For scattering by grains small enough to produce 30%polarization at V, the H band polarization should be 80–90%since the particles are now much smaller than the wavelength(approaching the Rayleigh scattering regime). Alternatively thegrains are very small and Rayleigh scattering occurs at all wave-lengths; however then it is not clear why the polarization valuesare not larger. If there is a substantial unpolarized componentwhich dilutes the polarized flux, say from a different grain sizepopulation, then it would be expected that this is wavelengthdependent. The only strong wavelength dependent difference isthe higher polarization at V than in J and H by about 10% in theNW lobe, the reverse of the behaviour expected by scattering ofgrains small with respect to the wavelength.
One possibility for the lower than expected polarization atJ and H from the Mie scattering prediction could be dust emis-sion from the warm grains. This would become more significantwith longer wavelength; thus some depolarization would be ex-pected at K. The similarity of the Kc and H polarization showsthat little depolarization is detected, thus refuting any influenceon the J and H polarization values. If the grain properties werechanging with position in the nebula this would be expected tohave an effect on the behaviour of polarization at different wave-lengths. In the NW lobe the differences between V and near-IRpolarization can be attributed to differing scattering angles. Ifthe line-of-sight optical depth is low the scattering region domi-nating the observed flux is deeper inside the lobe than for a highline-of-sight optical depth. The scattering angle for the lowerline-of-sight optical depth will be larger. In the SE lobe thereis no large-scale difference in polarization from V to K, corre-sponding to a situation where the line-of-sight optical depth islow or does not vary much.
J.R. Walsh & N. Ageorges: Near-IR polarimetry ofη Carinae 265
Table 2.Extinction to globule at+1.3′′ in Morse cut over SE lobe
λ (µm) ∆ mag. ∆ mag.Observed ISM∗
0.336 2.90 3.900.410 3.25 3.250.631 3.06 1.981.042 1.75 0.911.250 0.49 0.661.650 0.23 0.392.150 0.22 0.232.200 0.14 0.22∗ Normalised to the observed value at 0.410µm
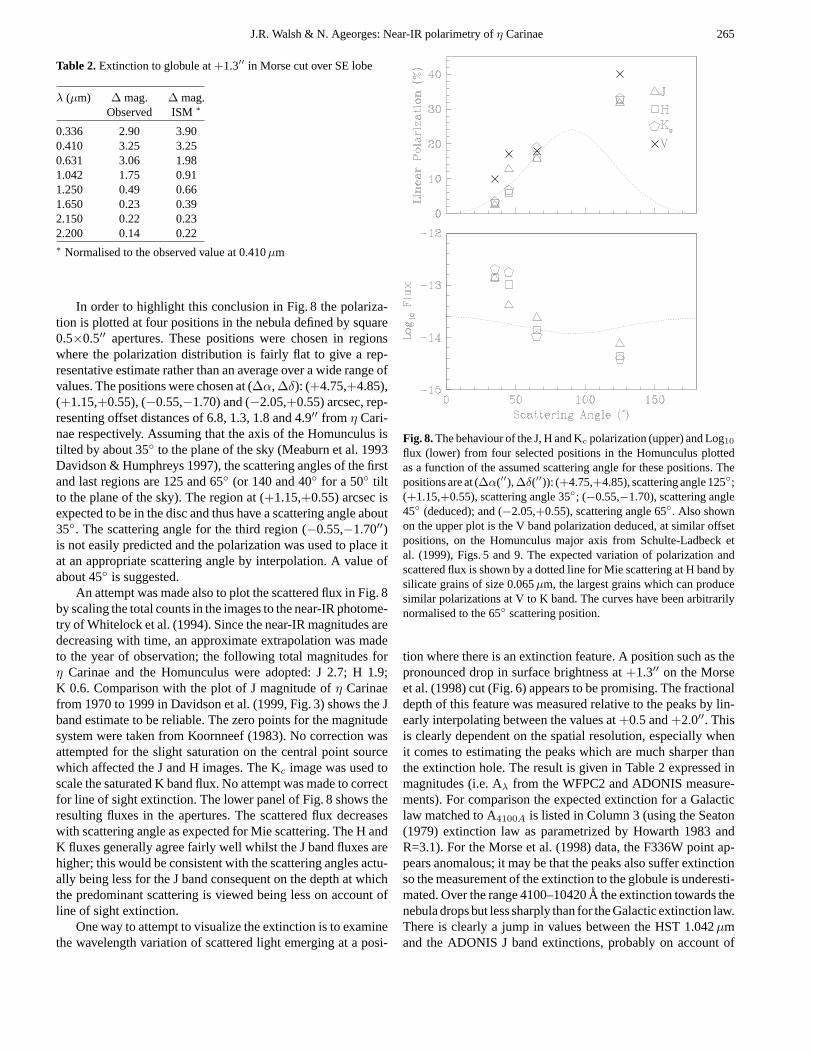
In order to highlight this conclusion in Fig. 8 the polariza-tion is plotted at four positions in the nebula defined by square0.5×0.5′′ apertures. These positions were chosen in regionswhere the polarization distribution is fairly flat to give a rep-resentative estimate rather than an average over a wide range ofvalues. The positions were chosen at (∆α, ∆δ): (+4.75,+4.85),(+1.15,+0.55), (−0.55,−1.70) and (−2.05,+0.55) arcsec, rep-resenting offset distances of 6.8, 1.3, 1.8 and 4.9′′ from η Cari-nae respectively. Assuming that the axis of the Homunculus istilted by about 35◦ to the plane of the sky (Meaburn et al. 1993Davidson & Humphreys 1997), the scattering angles of the firstand last regions are 125 and 65◦ (or 140 and 40◦ for a 50◦ tiltto the plane of the sky). The region at (+1.15,+0.55) arcsec isexpected to be in the disc and thus have a scattering angle about35◦. The scattering angle for the third region (−0.55,−1.70′′)is not easily predicted and the polarization was used to place itat an appropriate scattering angle by interpolation. A value ofabout 45◦ is suggested.
An attempt was made also to plot the scattered flux in Fig. 8by scaling the total counts in the images to the near-IR photome-try of Whitelock et al. (1994). Since the near-IR magnitudes aredecreasing with time, an approximate extrapolation was madeto the year of observation; the following total magnitudes forη Carinae and the Homunculus were adopted: J 2.7; H 1.9;K 0.6. Comparison with the plot of J magnitude ofη Carinaefrom 1970 to 1999 in Davidson et al. (1999, Fig. 3) shows the Jband estimate to be reliable. The zero points for the magnitudesystem were taken from Koornneef (1983). No correction wasattempted for the slight saturation on the central point sourcewhich affected the J and H images. The Kc image was used toscale the saturated K band flux. No attempt was made to correctfor line of sight extinction. The lower panel of Fig. 8 shows theresulting fluxes in the apertures. The scattered flux decreaseswith scattering angle as expected for Mie scattering. The H andK fluxes generally agree fairly well whilst the J band fluxes arehigher; this would be consistent with the scattering angles actu-ally being less for the J band consequent on the depth at whichthe predominant scattering is viewed being less on account ofline of sight extinction.
One way to attempt to visualize the extinction is to examinethe wavelength variation of scattered light emerging at a posi-
Fig. 8.The behaviour of the J, H and Kc polarization (upper) and Log10flux (lower) from four selected positions in the Homunculus plottedas a function of the assumed scattering angle for these positions. Thepositions are at (∆α(′′),∆δ(′′)): (+4.75,+4.85), scattering angle 125◦;(+1.15,+0.55), scattering angle 35◦; (−0.55,−1.70), scattering angle45◦ (deduced); and (−2.05,+0.55), scattering angle 65◦. Also shownon the upper plot is the V band polarization deduced, at similar offsetpositions, on the Homunculus major axis from Schulte-Ladbeck etal. (1999), Figs. 5 and 9. The expected variation of polarization andscattered flux is shown by a dotted line for Mie scattering at H band bysilicate grains of size 0.065µm, the largest grains which can producesimilar polarizations at V to K band. The curves have been arbitrarilynormalised to the 65◦ scattering position.
tion where there is an extinction feature. A position such as thepronounced drop in surface brightness at+1.3′′ on the Morseet al. (1998) cut (Fig. 6) appears to be promising. The fractionaldepth of this feature was measured relative to the peaks by lin-early interpolating between the values at+0.5 and+2.0′′. Thisis clearly dependent on the spatial resolution, especially whenit comes to estimating the peaks which are much sharper thanthe extinction hole. The result is given in Table 2 expressed inmagnitudes (i.e. Aλ from the WFPC2 and ADONIS measure-ments). For comparison the expected extinction for a Galacticlaw matched to A4100A is listed in Column 3 (using the Seaton(1979) extinction law as parametrized by Howarth 1983 andR=3.1). For the Morse et al. (1998) data, the F336W point ap-pears anomalous; it may be that the peaks also suffer extinctionso the measurement of the extinction to the globule is underesti-mated. Over the range 4100–10420A the extinction towards thenebula drops but less sharply than for the Galactic extinction law.There is clearly a jump in values between the HST 1.042µmand the ADONIS J band extinctions, probably on account of
266 J.R. Walsh & N. Ageorges: Near-IR polarimetry ofη Carinae
differing spatial resolution and PSF’s causing differing degreesof infilling. Treating the measurements from J to K separatelyin Table 2 shows that the extinction also drops less steeply thanthe Galactic extinction curve, strengthening the suggestion ofa flatter extinction law in this region of the Homunculus. Thissomewhat greyer extinction favours particles larger than thosetypically found in the ISM, in agreement with the conclusionsof Smith et al. (1998) and others on dust emission. Davidson etal. (1999) also suggested grey extinction from a comparison ofthe modestly wavelength dependent brightening ofη Carinaeand the Homunculus in the optical and near-IR.
There is a strong discrepancy between the predictions of theextinction and emission of grains in the Homunculus and theirpolarization properties. If the grains were typically 1–2µm inthe Homunculus, Mie theory for spherical particles predicts amaximum polarization at 1.65µm of 38% for a scattering angleof 120◦ (assuming that the size distribution is flat from 1–2µmand using the Draine (1985) optical constants for silicate grains).However the V band polarization from Mie theory is only 13%for such a size range of particles at the same scattering angle.Whilst Rayleigh scattering from very small<
∼0.1µm grains pro-duces a similar polarization at all wavelengths, it produces onlya small variation in scattered flux with scattering angle (by afactor∼2). Thus Rayleigh scattering is not capable of matchingthe points as shown by the scattered intensity and polarizationcurves in Fig. 8 (see caption for details). It has not so far beenpossible to find a single size distribution which would explainthe consistent polarization value over a wide wavelength rangeand the similar variation in scattered flux with scattering anglefrom J-K (see Fig. 8). To explain the consistency of the po-larization, other suggestions involving a grain size distributiontogether with optical depth effects which ‘tune’ the scatteringproperties with wavelength must be invoked.
Three possibilities are suggested to explain the dust scatter-ing structure in the Homunculus:
a) the grains possess a range in size which is similar at all po-sitions within the nebula but the extinction of this grain dis-tribution at a given wavelength is such that the particles whichcontribute most to the scattering have lowest extinction. In otherwords when the extinction cross section is low, the scatteringcross section is high. From Mie theory this is not possible fora single grain species but could occur for some grain mixture.The extinction acts to fine tune the size range contributing toscattering. It is assumed here that the scattering angle changesrather little with wavelength (hence extinction). For the polar-ization to stay constant with wavelength, there would need tobe a grain size distribution inside small clumps. The unit op-tical depth scattering surface would then be deeper at longerwavelengths on account of the lower extinction. Grain-gas orgrain-grain collisions in the high velocity clouds could perhapsexplain the size distribution which would affect the surface re-gions more strongly;
b) the effective scattering angle alters with wavelength on ac-count of the differing extinction. To longer wavelengths thesmall dust globules become more transparent, resulting in an
increase in scattering angle and a greater proportion of the scat-tered flux arises from towards the rearside of the lobes. Thiscould compensate the increase of polarization with wavelengthby providing less polarized flux. Whilst this could work forthe NW lobe it is not easily able to explain the polarizationbehaviour in the SE lobe. Here the scattering angle increaseswith increasing penetration (lower line-of-sight extinction) intothe lobe and so the polarization should be expected to increasewith increasing wavelength. In this case the relevant parameteris again the line of sight extinction but it affects the scatteringangle;
c) the grains are aligned by the macroscopic velocity field ofthe Homunculus such that it is their alignment that controls thepolarization rather than the individual grains. A rather extremealignment such as strings of dust particles would be required so itwould be the incident radiation on a grain rather than its intrinsicscattering properties which would have a greater effect. Giventhat there are highly collimated ejecta observed outside the Ho-munculus (Weis & Duschl 1999 and Morse et al. 1998), and thatsuch features appear to extend inwards towardsη Carinae, thesuggestion of an influence of the macroscopic grain alignmenton the scattered radiation may not be completely ruled out.
Suggestion (c) finds support in the detection of 12.5µm po-larization by Aitken et al. (1995), who first showed that there isorganized grain alignment in the Homunculus. The maximumvalues of 12.5µm polarization were about 5% and the E-vectorsare oriented mostly radially at the edges (Aitken et al. 1995,Fig. 2), although the pattern is complex. It is notable that the12.5µm polarization is largest in each lobe where the near-IRpolarization is greatest - viz. at the ends of the lobes. This sug-gests an intrinsic connection between the grains at the two wave-lengths, rather than the polarization arising in different graingroups at the different wavelengths. Aitken et al. (1995) discussradiation streaming as a mechanism to provide suprathermalgrain spin of paramagnetic grains which then precess about themagnetic field direction. Fields strengths upto milli-Gauss weresuggested and the field orientation in the lobes orthogonal tothe major axis was favoured (Aitken et al. 1995). One possiblescenario which could relate the presence of aligned grains andthe constancy of optical - IR polarization with wavelength hasthe grains in the foreground lobes of the Homunculus acting asthe aligning medium for the scattered light from the rearside.By comparison with the case of Galactic grain alignment, theamount of extinction to produce 30% polarization (V band) isEB−V
>∼3.3 (see e.g. Whittet, 1992, Fig. 4.2). This is a large
extinction but not ruled out given the deduced extinction of afew magnitudes for the ‘dark’ regions of the Homunculus (seeTable 2). In addition the grains in the Homunculus are proba-bly very different from those in the general interstellar medium,having been recently ejected from a star with anomalous abun-dances. It is clear that grain alignment cannot be wholly re-sponsible for the constancy of the polarization with wavelengthbut may be a contributor. Further observations to explore thepolarization in the 3–5µm region where there is a mixture ofscattering and emission would be particularly valuable.
J.R. Walsh & N. Ageorges: Near-IR polarimetry ofη Carinae 267
5. Conclusions
The first high spatial resolution adaptive optics near-IR polar-ization maps ofη Carinae and the Homunculus nebula havebeen presented. Since the Homunculus is dominated by scat-tering then the appearance in the near-IR is rather similar tothat observed in the optical and a comparison of the AO resultswith an HST 1.04µm WFPC2 image was presented showingessentially the same features. The most important single resultfrom this work is the overall similarity of the linear polarizationfrom the V band to 2.2µm within a few percent for the SE lobeand the lower values at J and H compared with V for the NWlobe. Image restoration was applied to a set of 2.15µm con-tinuum images to determine the polarization distribution in thenear vicinity ofη Carinae. A tentative value of the polarizationof the Weigelt et al. speckle knot D of 18% was determined sug-gesting that it is a dust cloud within the equatorial disc stronglyilluminated byη Carinae. Various models are discussed in orderto explain the flat distribution of polarization with wavelengthover the Homunculus. A possible association of a narrow fea-ture within the NW lobe of the Homunculus with one of thehighly collimated emission line ‘whiskers’ outside the nebuladeserves further investigation.
References
Ageorges N., Walsh J.R., 1999, A&AS 138, 163Aitken D.K., Smith C.H., Moore T.J.T., Roche P.F., 1995, MNRAS
273, 359Allen D.A., 1989, MNRAS 241, 95Altamore A., Maillard J.-P., Viotti R., 1994, A&A 292, 208Bensammar S., Letourneur N., Perrier F., Friedjung M., Viotti R., 1985,
A&A 146, L1Beuzit J.-L., Demailly L., Gendron E., et al., 1997, Exp. Astr. 7, 285Carty T.F., Warren-Smith R.F., Scarrott S.M., 1979, MNRAS 187, 761Currie D.G., Dowling D.M., Shaya E.J., et al., 1996, AJ 112, 1115Daminelli A., Conti P.S., Looes D.F., 1997, New Astron. 2, 107Davidson K., Humphreys R.M., 1997, ARA&A 35, 1Davidson K., Dufour R.J., Walborn N.R., Gull T.R., 1986, ApJ 305,
867Davidson K., Ebbets D.C., Weigelt G., et al., 1995, AJ 109, 1784Davidson K., Ebbets D.C., Johansson S., et al., 1997, AJ 113, 335 ApJ
305, 867Davidson K., Gull T.R., Humphreys R.M., et al., 1999, AJ 118, 1777Devillard N., 1997, ESO Messenger 87, 19
Draine B.T., 1985, ApJS 57, 587Ebbets, D.C., Garner, H., White, R.L., et al., 1994, In: Clegg R.E.S.,
Stevens I.R., Meikle W.P.S. (eds.) Proc. 34th Herstmonceux Con-ference, Circumstellar Media in the Late Stages of Stellar Evolu-tion. CUP, p. 95
Falcke H., Davidson K., Hofmann K.-H., Weigelt G., 1996, A&A 306,L17
Gehring, G., 1992, Unpublished Ph.D. Thesis, Ludwig-MaximiliansUniversitat, Munich, Germany
Hofmann K.-H., Weigelt G., 1988, A&A 203, L21Hofmann R., Brandl, B., Eckart, A., et al., 1995, Proc. SPIE 2475, 192Howarth I.D., 1983, MNRAS 203, 301Humphreys R.M., Davidson K., 1994, PASP 106, 1024Hyland A.R., Robinson G., Mitchell R.M, Thomas J.A., Becklin E.E.,
1979, ApJ 233, 145Jeffries S.M., Christou J.C., 1993, ApJ 415, 862Koornneef J., 1983, A&A 128, 84Lucy L.B., 1974, AJ 79, 745Meaburn J., Walsh J.R., Wolstencroft R.D., 1993, A&A 268, 283Mitchell R.M., Robinson G., 1978, ApJ 220, 841Morse J.A., Davidson K., Bally J., et al., 1998, AJ 116, 2443Rigaut F., Gehring G., 1995, Rev. Mex. Astron. Astrofis. 2, 27Robinson G., Mitchell R.M., Aitken D.K., Briggs G.P., Roche R.F.,
1987, MNRAS 227, 535Schulte-Ladbeck R., Pasquali A., Clampin M., et al., 1999, AJ 118,
1320Seaton M.J., 1979, MNRAS 187, 75PSmith C.H., Aitken D.K., Moore T.J.T., et al., 1995, MNRAS 273, 354Smith N., Gehrz R.D., Krautter J., 1998, AJ 116, 1332Thackeray A.D., 1956, Observatory 76, 154Turnshek D.A., Bohlin R.C., Williamson R.L., Lupie O.L., Koornneef
J., 1990, AJ 99, 1243van Genderen A.M., De Groot M.J.H., The P.S., 1994, A&A 283, 89Visvanathan N., 1967, MNRAS 135, 275Walborn N.R., Liller M.H., 1977, ApJ 211, 181Warren-Smith R.F., Scarrott S.M., Murdin P., Bingham R.G., 1979,
MNRAS 189, 299Weigelt G., Ebersberger J., 1986, A&A 163, L5Weis K., Duschl W., 1999, A&A 349, 467Wesselink G., 1960, Lowell Obs. Bull. 105, 305Westphal J.A., Neugebauer G., 1969, ApJ 156, L45Whitelock P.A., Feast M.W., Carter B.S., Roberts G., Glass I.S., 1983,
MNRAS 203, 385Whitelock P.A., Feast M.W., Koen C., Roberts G., Carter B.S., 1994,
MNRAS 270, 364Whittet D.C.B., 1992, Dust in the Galactic Environment. Institute of
Physics, Bristol


![arXiv:1607.01182v2 [astro-ph.CO] 15 Jul 2016 · Robert Sobukwe Road, Bellville, 7530, South Africa F ASTRON, The Netherlands Institute for Radio Astronomy, Postbus 2, 7990 AA Dwingeloo,](https://static.fdocument.org/doc/165x107/5e0b954ad53a63087b429fb7/arxiv160701182v2-astro-phco-15-jul-2016-robert-sobukwe-road-bellville-7530.jpg)


![Binarity and multiperiodicity in high-amplitude Scuti …0812.2139v1 [astro-ph] 11 Dec 2008 Mon. Not. R. Astron. Soc. 000, 000–000 (0000) Printed 18 February 2013 (MN LATEX style](https://static.fdocument.org/doc/165x107/5b0a7d517f8b9adc138c2b64/binarity-and-multiperiodicity-in-high-amplitude-scuti-08122139v1-astro-ph-11.jpg)