Cosmology through arc statistics I: sensitivity to m and · Mon. Not. R. Astron. Soc. 000,1{12()...
12
Mon. Not. R. Astron. Soc. 000, 1–12 () Printed 9 April 2018 (MN L A T E X style file v2.2) Cosmology through arc statistics I: sensitivity to Ω m and σ 8 Michele Boldrin 1 , Carlo Giocoli 2,3,4,5 , Massimo Meneghetti 4,6 , Lauro Moscardini 2,3,4 , Giuseppe Tormen 1 , Andrea Biviano 7 1 Dipartimento di Fisica e Astronomia, Universit` a di Padova, vicolo dell’Osservatorio 3, 35122 Padova, Italy 2 Dipartimento di Fisica e Astronomia, Alma Mater Studiorum Universit` a di Bologna, viale Berti Pichat 6/2, 40127 Bologna, Italy 3 INFN - Sezione di Bologna, viale Berti Pichat 6/2, 40127 Bologna, Italy 4 INAF - Osservatorio Astronomico di Bologna, via Ranzani 1, 40127 Bologna, Italy 5 Aix Marseille Universit´ e, CNRS, LAM (Laboratoire d’Astrophysique de Marseille), UMR 7326, 13388 Marseille, France 6 Jet Propulsion Laboratory, 4800 Oak Grove Dr., Pasadena, CA 91109, USA 7 INAF - Osservatorio Astronomico di Trieste, via G.B. Tiepolo 11, 34143 Trieste ABSTRACT The next generation of large sky photometric surveys will finally be able to use arc statistics as a cosmological probe. Here we present the first of a series of papers on this topic. In particular, we study how arc counts are sensitive to the variation of two cosmological parameters: the (total) matter density parameter, Ω m , and the nor- malisation of the primordial power spectrum, expressed in terms of σ 8 . Both these pa- rameters influence the abundances of collapsed structures and their internal structure. We compute the expected number of gravitational arcs with various length-to-width ratios in mock light cones, by varying these cosmological parameters in the ranges 0.1 6 Ω m 6 0.5 and 0.6 6 σ 8 6 1. We find that the arc counts dependence on Ω m and σ 8 is similar, but not identical, to that of the halo counts. We investigate how the precision of the constraints on the cosmological parameters based on arc counts depends on the survey area. We find that the constraining power of arc statistics de- grades critically only for surveys covering an area smaller than 10% of the whole sky. Finally, we consider the case in which the search for arcs is done only in frames where galaxy clusters have been previously identified. Adopting the selection function for galaxy clusters expected to be detected from photometric data in future wide surveys, we find that less than 10% of the arcs will be missed, with only a small degradation of the corresponding cosmological constraints. Key words: Arc statistics; strong gravitational lensing; galaxy clusters; cosmology. 1 INTRODUCTION The importance of galaxy clusters in cosmology is well known (for a review, see Allen et al. 2011, and references therein). Being the most massive bound systems in the uni- verse, they trace the latest stage of structure formation. Their abundance and mass as a function of redshift are thus highly indicative of how the growth of the cosmic density fluctuations occurs and can thus be used to constrain the matter content, the initial power spectrum normalisation and the expansion history of the universe (Eke et al. 1998; Borgani et al. 2001; Reiprich & B¨ ohringer 2002; Allen et al. 2003; Schuecker et al. 2003; Henry 2004; Vikhlinin et al. 2009; Mantz et al. 2010; Rozo et al. 2010; Sehgal & et al. 2011; Planck Collaboration et al. 2014a; Benson et al. 2013; Mantz et al. 2014). Moreover, galaxy clusters are essential cosmic labora- tories where the complex interaction between baryons and dark matter can be studied in detail, in particular during merger events (Clowe et al. 2006; Merten et al. 2011). Being the most massive structures in the Universe, galaxy clusters are also the most powerful gravitational lenses (Narayan & Bartelmann 1999; Bartelmann & Schnei- der 2001; Kneib & Natarajan 2011). In particular, they are responsible for highly non-linear lensing effects taking place in their densest regions, i.e. in their cores. In this so-called “strong” lensing regime, the images of background galax- ies are heavily distorted, often leading to the appearance of gravitational arcs with large length-to-width ratios (see Kneib & Natarajan 2011; Meneghetti et al. 2013, and refer- ences therein). The efficiency of galaxy clusters to produce arcs with a given ratio between their length l and width w is quantified by means of their strong lensing cross section σ l/w . This is c RAS arXiv:1505.03515v2 [astro-ph.CO] 18 Jan 2016
Transcript of Cosmology through arc statistics I: sensitivity to m and · Mon. Not. R. Astron. Soc. 000,1{12()...
Mon. Not. R. Astron. Soc. 000, 1–12 () Printed 9 April 2018 (MN LATEX style file v2.2)
Cosmology through arc statistics I: sensitivity to Ωm and σ8
Michele Boldrin1, Carlo Giocoli2,3,4,5, Massimo Meneghetti4,6, Lauro Moscardini2,3,4,Giuseppe Tormen1, Andrea Biviano 7
1 Dipartimento di Fisica e Astronomia, Universita di Padova, vicolo dell’Osservatorio 3, 35122 Padova, Italy2 Dipartimento di Fisica e Astronomia, Alma Mater Studiorum Universita di Bologna, viale Berti Pichat 6/2, 40127 Bologna, Italy3 INFN - Sezione di Bologna, viale Berti Pichat 6/2, 40127 Bologna, Italy4 INAF - Osservatorio Astronomico di Bologna, via Ranzani 1, 40127 Bologna, Italy5 Aix Marseille Universite, CNRS, LAM (Laboratoire d’Astrophysique de Marseille), UMR 7326, 13388 Marseille, France6 Jet Propulsion Laboratory, 4800 Oak Grove Dr., Pasadena, CA 91109, USA7 INAF - Osservatorio Astronomico di Trieste, via G.B. Tiepolo 11, 34143 Trieste
ABSTRACT
The next generation of large sky photometric surveys will finally be able to usearc statistics as a cosmological probe. Here we present the first of a series of paperson this topic. In particular, we study how arc counts are sensitive to the variation oftwo cosmological parameters: the (total) matter density parameter, Ωm, and the nor-malisation of the primordial power spectrum, expressed in terms of σ8. Both these pa-rameters influence the abundances of collapsed structures and their internal structure.We compute the expected number of gravitational arcs with various length-to-widthratios in mock light cones, by varying these cosmological parameters in the ranges0.1 6 Ωm 6 0.5 and 0.6 6 σ8 6 1. We find that the arc counts dependence on Ωm
and σ8 is similar, but not identical, to that of the halo counts. We investigate howthe precision of the constraints on the cosmological parameters based on arc countsdepends on the survey area. We find that the constraining power of arc statistics de-grades critically only for surveys covering an area smaller than 10% of the whole sky.Finally, we consider the case in which the search for arcs is done only in frames wheregalaxy clusters have been previously identified. Adopting the selection function forgalaxy clusters expected to be detected from photometric data in future wide surveys,we find that less than 10% of the arcs will be missed, with only a small degradationof the corresponding cosmological constraints.
Key words: Arc statistics; strong gravitational lensing; galaxy clusters; cosmology.
1 INTRODUCTION
The importance of galaxy clusters in cosmology is wellknown (for a review, see Allen et al. 2011, and referencestherein). Being the most massive bound systems in the uni-verse, they trace the latest stage of structure formation.Their abundance and mass as a function of redshift are thushighly indicative of how the growth of the cosmic densityfluctuations occurs and can thus be used to constrain thematter content, the initial power spectrum normalisationand the expansion history of the universe (Eke et al. 1998;Borgani et al. 2001; Reiprich & Bohringer 2002; Allen et al.2003; Schuecker et al. 2003; Henry 2004; Vikhlinin et al.2009; Mantz et al. 2010; Rozo et al. 2010; Sehgal & et al.2011; Planck Collaboration et al. 2014a; Benson et al. 2013;Mantz et al. 2014).
Moreover, galaxy clusters are essential cosmic labora-
tories where the complex interaction between baryons anddark matter can be studied in detail, in particular duringmerger events (Clowe et al. 2006; Merten et al. 2011).
Being the most massive structures in the Universe,galaxy clusters are also the most powerful gravitationallenses (Narayan & Bartelmann 1999; Bartelmann & Schnei-der 2001; Kneib & Natarajan 2011). In particular, they areresponsible for highly non-linear lensing effects taking placein their densest regions, i.e. in their cores. In this so-called“strong” lensing regime, the images of background galax-ies are heavily distorted, often leading to the appearanceof gravitational arcs with large length-to-width ratios (seeKneib & Natarajan 2011; Meneghetti et al. 2013, and refer-ences therein).
The efficiency of galaxy clusters to produce arcs with agiven ratio between their length l and width w is quantifiedby means of their strong lensing cross section σl/w. This is
c© RAS
arX
iv:1
505.
0351
5v2
[as
tro-
ph.C
O]
18
Jan
2016
2 Boldrin et al.
defined as the area on the source plane where the source hasto be located in order to form an arc with such a l/w ratio.To have a large strong lensing cross section, the projectedmass distribution of the lens must be exceptionally denseon the plane of the sky, also called “lens plane”. Sometimes,this can be the result of projection effects (halos elongatedalong the line-of-sight, superposition of multiple structuresat different redshifts, etc), but, generally speaking, gravita-tional arcs trace the highest peaks in the cosmological den-sity field. Bartelmann et al. (1998) first pointed out thatcounting gravitational arcs may be a competitive methodto constrain cosmological parameters (see e.g. Fedeli et al.2006; Meneghetti et al. 2013).
Unfortunately, strong lensing events such as gravita-tional arcs are rare. Given the relatively low number of arcsdiscovered so far and the high inhomogeneity of cluster opti-cal surveys, the application of arc statistics in cosmology hasbeen attempted mainly with the goal of possibly falsifyingthe standard cosmological model (the so-called concordanceΛCDM) rather than actually constraining cosmological pa-rameters. For about 15 years, scientists have debated on theexistence or nonexistence of a tension between the observednumber of arcs and the predictions derived in the frameworkof the cosmological model favoured by observational data(see Meneghetti et al. 2013, and references therein). Un-doubtedly, arc statistics suffered so far from the lack of suit-able large observational datasets for a reliable comparison totheoretical predictions. The situation is likely to change rad-ically in the near future, thanks to the advent of large opticalsurveys, covering areas in the range from several thousandsof square degrees (de Jong et al. 2013; The Dark EnergySurvey Collaboration 2005), to (almost) the full sky (LSSTScience Collaboration et al. 2009; Karoji 2009; Laureijs et al.2011; Spergel et al. 2013).
In Boldrin et al. (2012) we forecasted the number ofgravitational arcs visible in the future wide field survey tobe performed by the ESA Euclid mission (Laureijs et al.2011). A further step is the analysis of the sensitivity of arcstatistics on cosmological parameters. In particular in thiswork, we focus on the dependence of arc statistics on the (to-tal) matter density parameter Ωm and on the normalisationof the primordial power spectrum, expressed in terms of σ8.More precisely, we investigate the region of the parameterspace defined by Ωm = [0.1 − 0.5], and σ8 = [0.6 − 1.0].We sample the parameters at intervals ∆Ωm = 0.1 and∆σ8 = 0.1, thus investigating a total of 25 different cos-mological models, always making the assumption of a flatUniverse (Ωm + ΩΛ = 1). To help a direct comparison withthe results of Boldrin et al. (2012), here we assume a refer-ence cosmology defined by the parameters (Ωm = 0.272,σ8 = 0.809) with present Hubble parameter H0 = 70.4km/s/Mpc, in agreement with the WMAP7 results (Ko-matsu et al. 2011). However we will discuss also the resultsobtained with the assumption of the parameters recentlyderived by Planck Collaboration et al. (2014b).
The paper is organized as follows. In Section 2 we brieflydescribe the method adopted to compute the number of arcsand to build the mock catalogs. In Section 3 we present ourmain results, i.e. the total number of arcs and their redshiftdistribution as a function of Ωm and σ8. Section 4 is devotedto a discussion of the origin of the cosmological influence onarc statistics; we also consider how the results can change
when including the effects of possible systematics. In Section5 we discuss the agreement between the predictions obtainedwith our methodology and the arc counts in real surveys,using the recent results of Xu et al. (2015) based on theCLASH survey. Finally, in Section 6 we summarise and drawour conclusions.
2 METHOD
In this section, we summarise the steps undertaken for cal-culating the number of arcs produced by a population ofstrong lenses.
2.1 Generation of lenses with MOKA
In the attempt of properly modelling all the relevant struc-tural properties of the lenses in our calculations of σl/w,we make use of the pseudo-analytic code MOKA (Giocoliet al. 2012a,b). This code allows to generate mock cluster-size gravitational lenses in any desired cold dark matter(CDM) scenario, including features like: triaxiality and pro-jection effects, scatter in concentration, substructures, andthe presence of a brightest central galaxy, including the ef-fects that its growth produces adiabatic contraction on thecluster dark-matter halo profile. As discussed in several ear-lier works based on fully numerical simulations (see e.g.Meneghetti et al. 2003c; Torri et al. 2004; Meneghetti et al.2007), all these features play an important role for deter-mining the cluster ability to produce giant arcs. The mostimportant novelty of our work mainly lies on the adoptionof very realistic simulated strong lenses, as the MOKA codeallows to do.
More in detail, to generate the mock lenses we use thefollowing prescriptions:
• the host halo mass density profile is described by theNavarro, Frenk and White (NFW) radial function (Navarroet al. 1996);• the dark matter halo concentration is derived from the
mass-concentration relation proposed by Zhao et al. (2003),assuming log-normal scatter of σln c = 0.25;• the lens halo is triaxial and the axis ratios are generated
assuming the triaxial distributions derived by Jing & Suto(2002);• the spatial orientation is randomly chosen;• the substructure abundance follows the sub-halo mass
function derived by Giocoli et al. (2008);• the substructure radial distribution follows that pro-
posed by Gao et al. (2004);• the substructures are modelled as Single Isothermal
Spheres (SISs) (Metcalf & Madau 2001);• the mass density profile of the Brightest Cluster Galaxy
(BCG) resembles the Hernquist’s profile (Hernquist 1990).
The main outcome of the MOKA code is the deflection an-gle map of each mock halo. From the latter, we obtain σl/wfor sources at zs = 2 via ray-tracing technique. For simplic-ity, we consider only isolated lenses, avoiding the cases ofmerging haloes, even though some studies revealed the im-portance these events have on the amplitude of the stronglensing signal (see e.g Torri et al. 2004). Furthermore, an-other source of enhancement of the signal is given by the
c© RAS, MNRAS 000, 1–12
Cosmology through arc statistics I 3
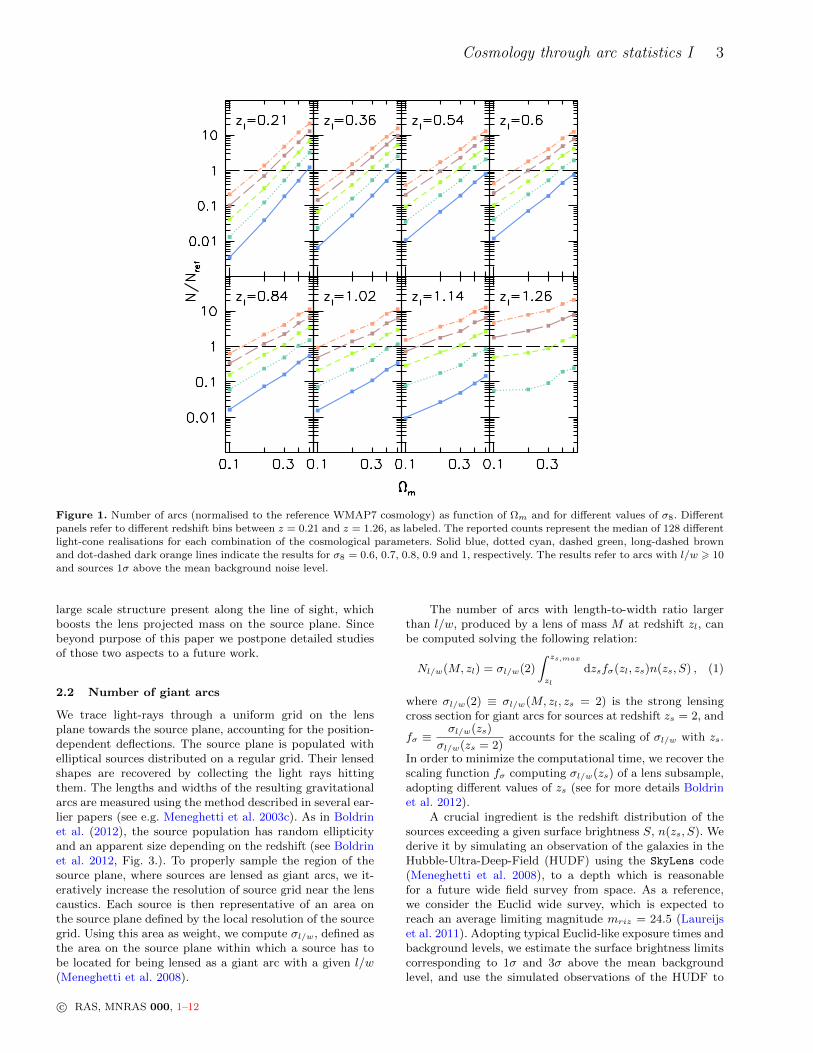
Figure 1. Number of arcs (normalised to the reference WMAP7 cosmology) as function of Ωm and for different values of σ8. Different
panels refer to different redshift bins between z = 0.21 and z = 1.26, as labeled. The reported counts represent the median of 128 differentlight-cone realisations for each combination of the cosmological parameters. Solid blue, dotted cyan, dashed green, long-dashed brown
and dot-dashed dark orange lines indicate the results for σ8 = 0.6, 0.7, 0.8, 0.9 and 1, respectively. The results refer to arcs with l/w > 10
and sources 1σ above the mean background noise level.
large scale structure present along the line of sight, whichboosts the lens projected mass on the source plane. Sincebeyond purpose of this paper we postpone detailed studiesof those two aspects to a future work.
2.2 Number of giant arcs
We trace light-rays through a uniform grid on the lensplane towards the source plane, accounting for the position-dependent deflections. The source plane is populated withelliptical sources distributed on a regular grid. Their lensedshapes are recovered by collecting the light rays hittingthem. The lengths and widths of the resulting gravitationalarcs are measured using the method described in several ear-lier papers (see e.g. Meneghetti et al. 2003c). As in Boldrinet al. (2012), the source population has random ellipticityand an apparent size depending on the redshift (see Boldrinet al. 2012, Fig. 3.). To properly sample the region of thesource plane, where sources are lensed as giant arcs, we it-eratively increase the resolution of source grid near the lenscaustics. Each source is then representative of an area onthe source plane defined by the local resolution of the sourcegrid. Using this area as weight, we compute σl/w, defined asthe area on the source plane within which a source has tobe located for being lensed as a giant arc with a given l/w(Meneghetti et al. 2008).
The number of arcs with length-to-width ratio largerthan l/w, produced by a lens of mass M at redshift zl, canbe computed solving the following relation:
Nl/w(M, zl) = σl/w(2)
∫ zs,max
zl
dzsfσ(zl, zs)n(zs, S) , (1)
where σl/w(2) ≡ σl/w(M, zl, zs = 2) is the strong lensingcross section for giant arcs for sources at redshift zs = 2, and
fσ ≡σl/w(zs)
σl/w(zs = 2)accounts for the scaling of σl/w with zs.
In order to minimize the computational time, we recover thescaling function fσ computing σl/w(zs) of a lens subsample,adopting different values of zs (see for more details Boldrinet al. 2012).
A crucial ingredient is the redshift distribution of thesources exceeding a given surface brightness S, n(zs, S). Wederive it by simulating an observation of the galaxies in theHubble-Ultra-Deep-Field (HUDF) using the SkyLens code(Meneghetti et al. 2008), to a depth which is reasonablefor a future wide field survey from space. As a reference,we consider the Euclid wide survey, which is expected toreach an average limiting magnitude mriz = 24.5 (Laureijset al. 2011). Adopting typical Euclid-like exposure times andbackground levels, we estimate the surface brightness limitscorresponding to 1σ and 3σ above the mean backgroundlevel, and use the simulated observations of the HUDF to
c© RAS, MNRAS 000, 1–12
4 Boldrin et al.
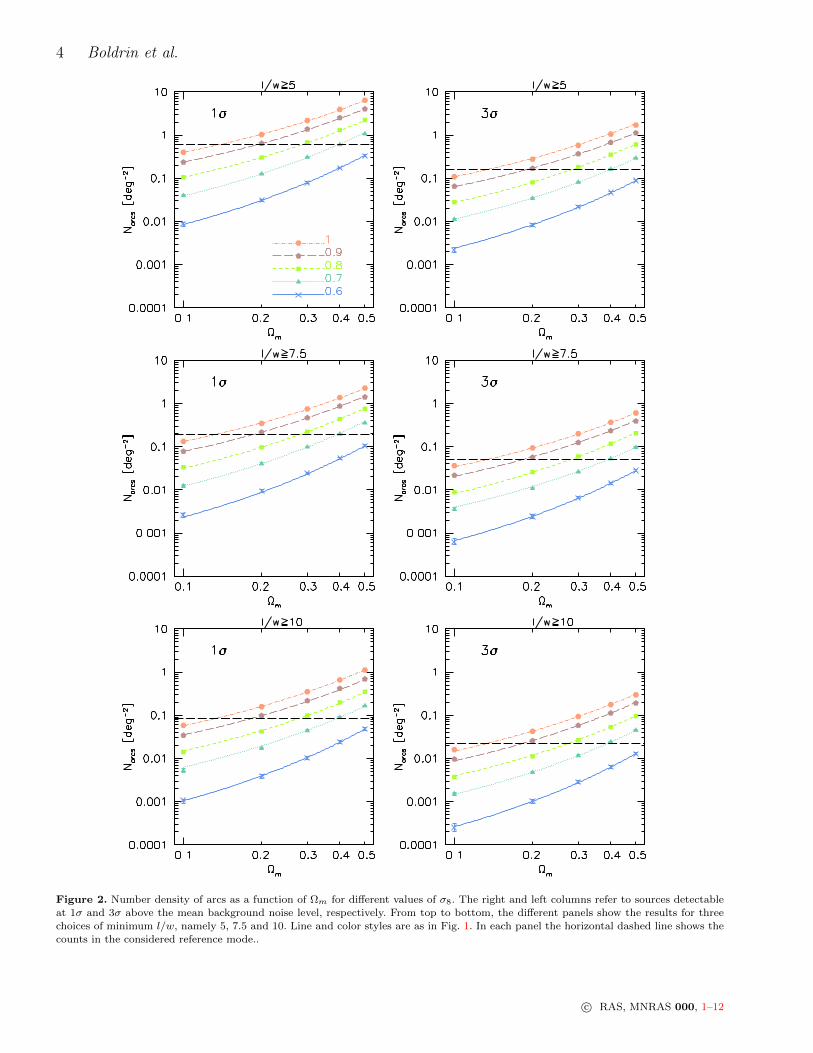
Figure 2. Number density of arcs as a function of Ωm for different values of σ8. The right and left columns refer to sources detectableat 1σ and 3σ above the mean background noise level, respectively. From top to bottom, the different panels show the results for threechoices of minimum l/w, namely 5, 7.5 and 10. Line and color styles are as in Fig. 1. In each panel the horizontal dashed line shows the
counts in the considered reference mode..
c© RAS, MNRAS 000, 1–12
Cosmology through arc statistics I 5
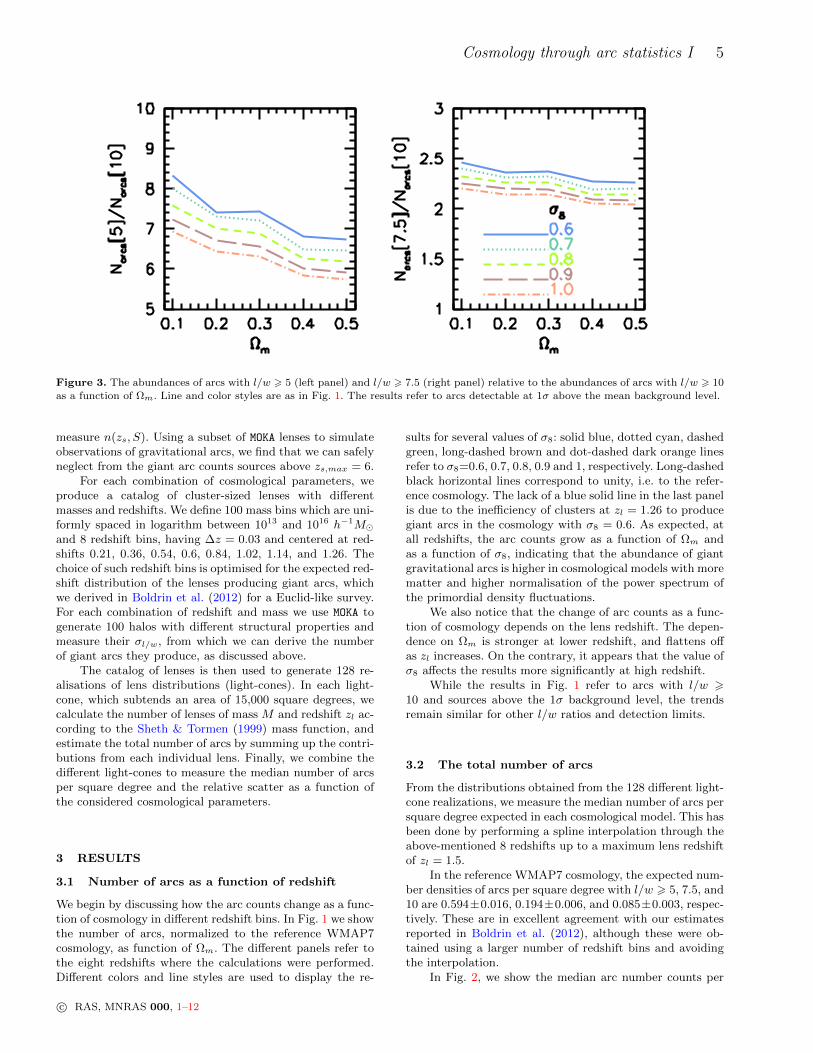
Figure 3. The abundances of arcs with l/w > 5 (left panel) and l/w > 7.5 (right panel) relative to the abundances of arcs with l/w > 10as a function of Ωm. Line and color styles are as in Fig. 1. The results refer to arcs detectable at 1σ above the mean background level.
measure n(zs, S). Using a subset of MOKA lenses to simulateobservations of gravitational arcs, we find that we can safelyneglect from the giant arc counts sources above zs,max = 6.
For each combination of cosmological parameters, weproduce a catalog of cluster-sized lenses with differentmasses and redshifts. We define 100 mass bins which are uni-formly spaced in logarithm between 1013 and 1016 h−1Mand 8 redshift bins, having ∆z = 0.03 and centered at red-shifts 0.21, 0.36, 0.54, 0.6, 0.84, 1.02, 1.14, and 1.26. Thechoice of such redshift bins is optimised for the expected red-shift distribution of the lenses producing giant arcs, whichwe derived in Boldrin et al. (2012) for a Euclid-like survey.For each combination of redshift and mass we use MOKA togenerate 100 halos with different structural properties andmeasure their σl/w, from which we can derive the numberof giant arcs they produce, as discussed above.
The catalog of lenses is then used to generate 128 re-alisations of lens distributions (light-cones). In each light-cone, which subtends an area of 15,000 square degrees, wecalculate the number of lenses of mass M and redshift zl ac-cording to the Sheth & Tormen (1999) mass function, andestimate the total number of arcs by summing up the contri-butions from each individual lens. Finally, we combine thedifferent light-cones to measure the median number of arcsper square degree and the relative scatter as a function ofthe considered cosmological parameters.
3 RESULTS
3.1 Number of arcs as a function of redshift
We begin by discussing how the arc counts change as a func-tion of cosmology in different redshift bins. In Fig. 1 we showthe number of arcs, normalized to the reference WMAP7cosmology, as function of Ωm. The different panels refer tothe eight redshifts where the calculations were performed.Different colors and line styles are used to display the re-
sults for several values of σ8: solid blue, dotted cyan, dashedgreen, long-dashed brown and dot-dashed dark orange linesrefer to σ8=0.6, 0.7, 0.8, 0.9 and 1, respectively. Long-dashedblack horizontal lines correspond to unity, i.e. to the refer-ence cosmology. The lack of a blue solid line in the last panelis due to the inefficiency of clusters at zl = 1.26 to producegiant arcs in the cosmology with σ8 = 0.6. As expected, atall redshifts, the arc counts grow as a function of Ωm andas a function of σ8, indicating that the abundance of giantgravitational arcs is higher in cosmological models with morematter and higher normalisation of the power spectrum ofthe primordial density fluctuations.
We also notice that the change of arc counts as a func-tion of cosmology depends on the lens redshift. The depen-dence on Ωm is stronger at lower redshift, and flattens offas zl increases. On the contrary, it appears that the value ofσ8 affects the results more significantly at high redshift.
While the results in Fig. 1 refer to arcs with l/w >10 and sources above the 1σ background level, the trendsremain similar for other l/w ratios and detection limits.
3.2 The total number of arcs
From the distributions obtained from the 128 different light-cone realizations, we measure the median number of arcs persquare degree expected in each cosmological model. This hasbeen done by performing a spline interpolation through theabove-mentioned 8 redshifts up to a maximum lens redshiftof zl = 1.5.
In the reference WMAP7 cosmology, the expected num-ber densities of arcs per square degree with l/w > 5, 7.5, and10 are 0.594±0.016, 0.194±0.006, and 0.085±0.003, respec-tively. These are in excellent agreement with our estimatesreported in Boldrin et al. (2012), although these were ob-tained using a larger number of redshift bins and avoidingthe interpolation.
In Fig. 2, we show the median arc number counts per
c© RAS, MNRAS 000, 1–12
6 Boldrin et al.
square degree as a function of Ωm. We also show how thecounts vary by changing the value of σ8, using the same colorand line styles used in Fig. 1. From top to bottom, we showthe results for l/w > 5, 7.5, and 10, respectively. The leftand the right panels refer to detections at 1- and 3σ abovethe level of the background. Obviously, the results show thesame dependence on Ωm and σ8 reported in Fig. 1.
We also see that the ratios between counts of arcs withdifferent l/w depend on the cosmological parameters. Asshown in Fig. 3, for low Ωm, the abundance of arcs withl/w > 5 or l/w > 7.5, relative to that of arcs with l/w > 10,is higher, indicating that halos in these cosmological mod-els have smaller critical lines and are thus less efficient atproducing large distortions. The ratios also depend on σ8;in cosmologies with higher σ8 halos are able to produce ahigher abundance of arcs with large l/w. The results (hereshown only for sources 1σ above the mean background level)are insensitive to the assumed detection limit. Therefore, inthe following discussion we will show the results only for arcsdetectable at the 1σ level. We will also focus on arcs withl/w > 10.
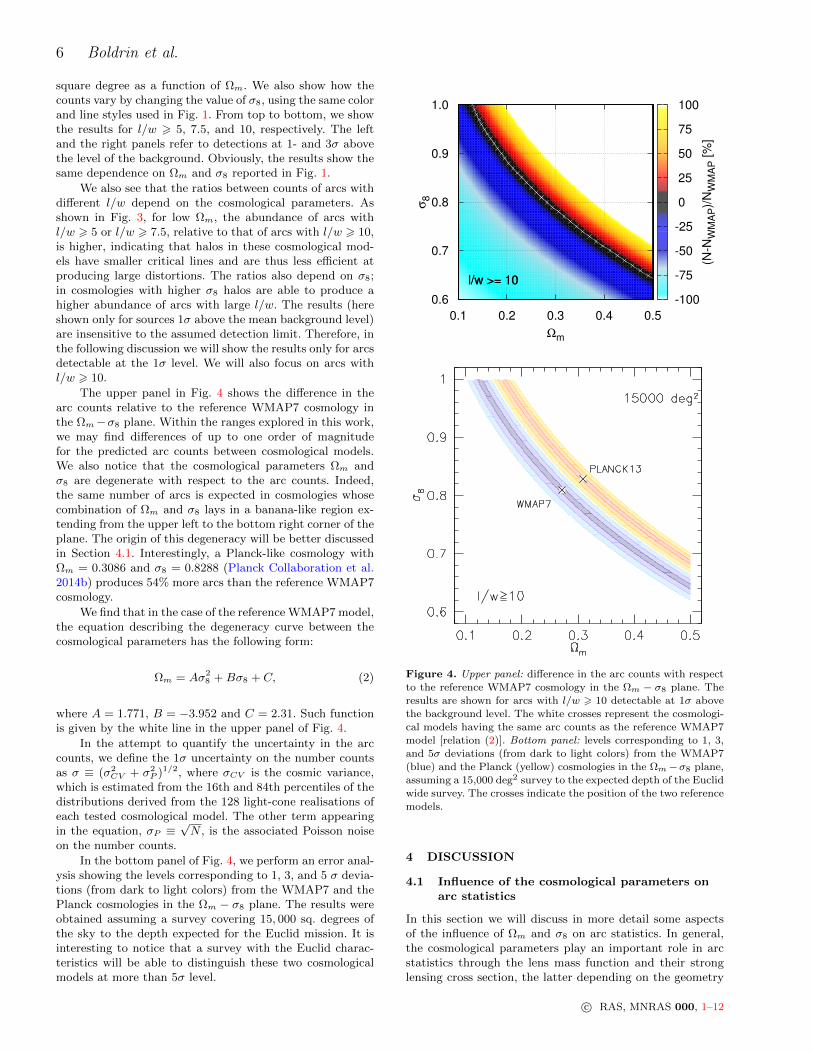
The upper panel in Fig. 4 shows the difference in thearc counts relative to the reference WMAP7 cosmology inthe Ωm−σ8 plane. Within the ranges explored in this work,we may find differences of up to one order of magnitudefor the predicted arc counts between cosmological models.We also notice that the cosmological parameters Ωm andσ8 are degenerate with respect to the arc counts. Indeed,the same number of arcs is expected in cosmologies whosecombination of Ωm and σ8 lays in a banana-like region ex-tending from the upper left to the bottom right corner of theplane. The origin of this degeneracy will be better discussedin Section 4.1. Interestingly, a Planck-like cosmology withΩm = 0.3086 and σ8 = 0.8288 (Planck Collaboration et al.2014b) produces 54% more arcs than the reference WMAP7cosmology.
We find that in the case of the reference WMAP7 model,the equation describing the degeneracy curve between thecosmological parameters has the following form:
Ωm = Aσ28 +Bσ8 + C, (2)
where A = 1.771, B = −3.952 and C = 2.31. Such functionis given by the white line in the upper panel of Fig. 4.
In the attempt to quantify the uncertainty in the arccounts, we define the 1σ uncertainty on the number countsas σ ≡ (σ2
CV + σ2P )1/2, where σCV is the cosmic variance,
which is estimated from the 16th and 84th percentiles of thedistributions derived from the 128 light-cone realisations ofeach tested cosmological model. The other term appearingin the equation, σP ≡
√N , is the associated Poisson noise
on the number counts.
In the bottom panel of Fig. 4, we perform an error anal-ysis showing the levels corresponding to 1, 3, and 5 σ devia-tions (from dark to light colors) from the WMAP7 and thePlanck cosmologies in the Ωm − σ8 plane. The results wereobtained assuming a survey covering 15, 000 sq. degrees ofthe sky to the depth expected for the Euclid mission. It isinteresting to notice that a survey with the Euclid charac-teristics will be able to distinguish these two cosmologicalmodels at more than 5σ level.
l/w >= 10
0.1 0.2 0.3 0.4 0.5
Ωm
0.6
0.7
0.8
0.9
1.0
σ8
-100
-75
-50
-25
0
25
50
75
100
(N-N
WM
AP)/
NW
MA
P [%
]
l/w >= 10l/w >= 10
Figure 4. Upper panel: difference in the arc counts with respect
to the reference WMAP7 cosmology in the Ωm − σ8 plane. The
results are shown for arcs with l/w > 10 detectable at 1σ abovethe background level. The white crosses represent the cosmologi-
cal models having the same arc counts as the reference WMAP7
model [relation (2)]. Bottom panel: levels corresponding to 1, 3,and 5σ deviations (from dark to light colors) from the WMAP7(blue) and the Planck (yellow) cosmologies in the Ωm−σ8 plane,assuming a 15,000 deg2 survey to the expected depth of the Euclidwide survey. The crosses indicate the position of the two reference
models.
4 DISCUSSION
4.1 Influence of the cosmological parameters onarc statistics
In this section we will discuss in more detail some aspectsof the influence of Ωm and σ8 on arc statistics. In general,the cosmological parameters play an important role in arcstatistics through the lens mass function and their stronglensing cross section, the latter depending on the geometry
c© RAS, MNRAS 000, 1–12
Cosmology through arc statistics I 7
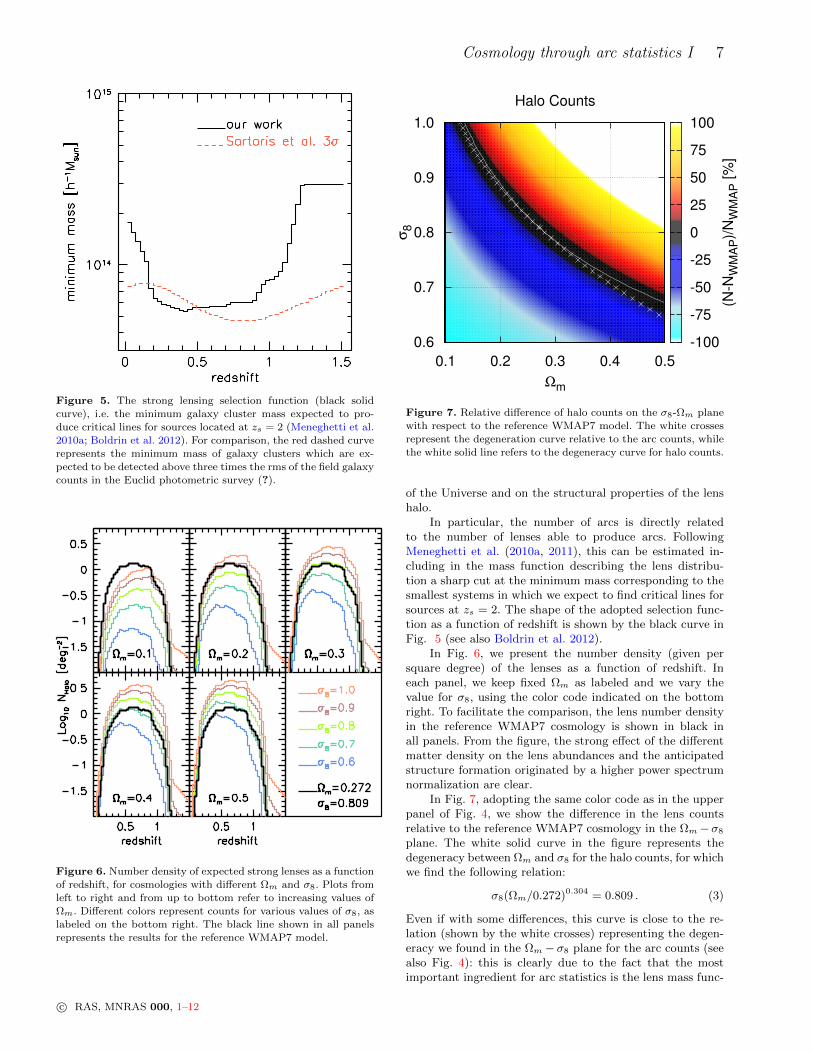
Figure 5. The strong lensing selection function (black solid
curve), i.e. the minimum galaxy cluster mass expected to pro-duce critical lines for sources located at zs = 2 (Meneghetti et al.
2010a; Boldrin et al. 2012). For comparison, the red dashed curve
represents the minimum mass of galaxy clusters which are ex-pected to be detected above three times the rms of the field galaxy
counts in the Euclid photometric survey (?).
Figure 6. Number density of expected strong lenses as a function
of redshift, for cosmologies with different Ωm and σ8. Plots fromleft to right and from up to bottom refer to increasing values of
Ωm. Different colors represent counts for various values of σ8, as
labeled on the bottom right. The black line shown in all panelsrepresents the results for the reference WMAP7 model.
Halo Counts
0.1 0.2 0.3 0.4 0.5
Ωm
0.6
0.7
0.8
0.9
1.0
σ8
-100
-75
-50
-25
0
25
50
75
100
(N-N
WM
AP)/
NW
MA
P [
%]
Figure 7. Relative difference of halo counts on the σ8-Ωm plane
with respect to the reference WMAP7 model. The white crosses
represent the degeneration curve relative to the arc counts, whilethe white solid line refers to the degeneracy curve for halo counts.
of the Universe and on the structural properties of the lenshalo.
In particular, the number of arcs is directly relatedto the number of lenses able to produce arcs. FollowingMeneghetti et al. (2010a, 2011), this can be estimated in-cluding in the mass function describing the lens distribu-tion a sharp cut at the minimum mass corresponding to thesmallest systems in which we expect to find critical lines forsources at zs = 2. The shape of the adopted selection func-tion as a function of redshift is shown by the black curve inFig. 5 (see also Boldrin et al. 2012).
In Fig. 6, we present the number density (given persquare degree) of the lenses as a function of redshift. Ineach panel, we keep fixed Ωm as labeled and we vary thevalue for σ8, using the color code indicated on the bottomright. To facilitate the comparison, the lens number densityin the reference WMAP7 cosmology is shown in black inall panels. From the figure, the strong effect of the differentmatter density on the lens abundances and the anticipatedstructure formation originated by a higher power spectrumnormalization are clear.
In Fig. 7, adopting the same color code as in the upperpanel of Fig. 4, we show the difference in the lens countsrelative to the reference WMAP7 cosmology in the Ωm−σ8
plane. The white solid curve in the figure represents thedegeneracy between Ωm and σ8 for the halo counts, for whichwe find the following relation:
σ8(Ωm/0.272)0.304 = 0.809 . (3)
Even if with some differences, this curve is close to the re-lation (shown by the white crosses) representing the degen-eracy we found in the Ωm− σ8 plane for the arc counts (seealso Fig. 4): this is clearly due to the fact that the mostimportant ingredient for arc statistics is the lens mass func-
c© RAS, MNRAS 000, 1–12
8 Boldrin et al.
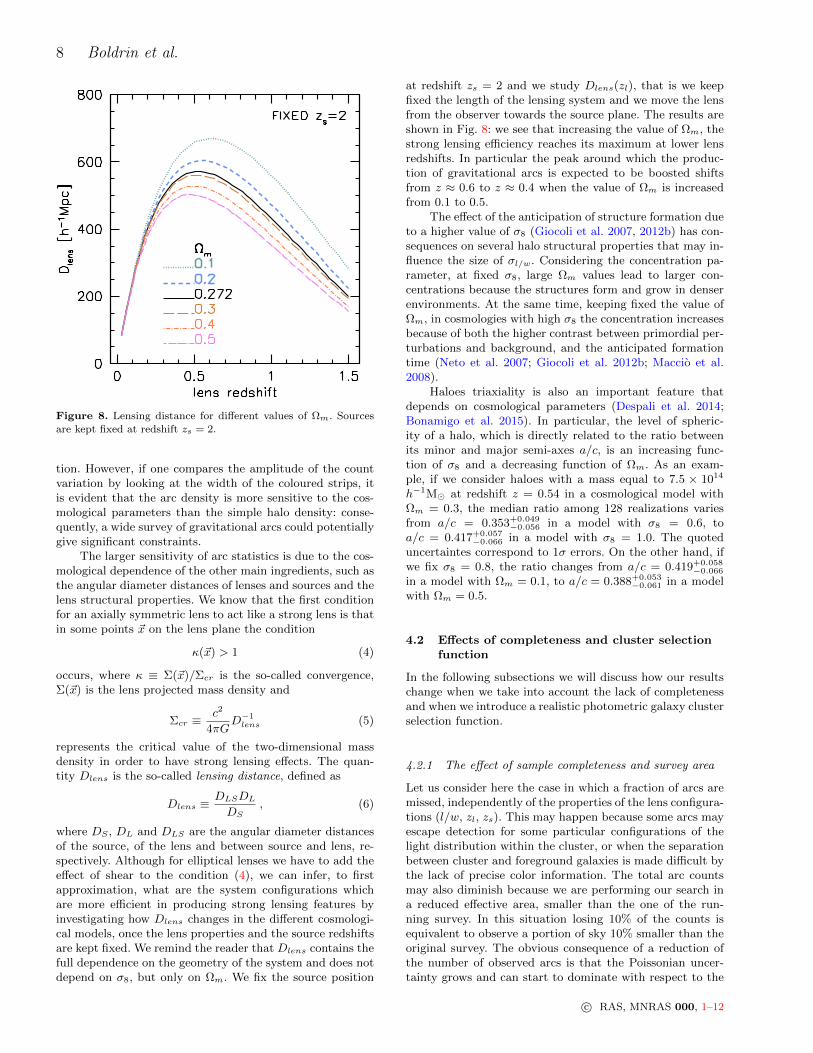
Figure 8. Lensing distance for different values of Ωm. Sourcesare kept fixed at redshift zs = 2.
tion. However, if one compares the amplitude of the countvariation by looking at the width of the coloured strips, itis evident that the arc density is more sensitive to the cos-mological parameters than the simple halo density: conse-quently, a wide survey of gravitational arcs could potentiallygive significant constraints.
The larger sensitivity of arc statistics is due to the cos-mological dependence of the other main ingredients, such asthe angular diameter distances of lenses and sources and thelens structural properties. We know that the first conditionfor an axially symmetric lens to act like a strong lens is thatin some points ~x on the lens plane the condition
κ(~x) > 1 (4)
occurs, where κ ≡ Σ(~x)/Σcr is the so-called convergence,Σ(~x) is the lens projected mass density and
Σcr ≡c2
4πGD−1lens (5)
represents the critical value of the two-dimensional massdensity in order to have strong lensing effects. The quan-tity Dlens is the so-called lensing distance, defined as
Dlens ≡DLSDLDS
, (6)
where DS , DL and DLS are the angular diameter distancesof the source, of the lens and between source and lens, re-spectively. Although for elliptical lenses we have to add theeffect of shear to the condition (4), we can infer, to firstapproximation, what are the system configurations whichare more efficient in producing strong lensing features byinvestigating how Dlens changes in the different cosmologi-cal models, once the lens properties and the source redshiftsare kept fixed. We remind the reader that Dlens contains thefull dependence on the geometry of the system and does notdepend on σ8, but only on Ωm. We fix the source position
at redshift zs = 2 and we study Dlens(zl), that is we keepfixed the length of the lensing system and we move the lensfrom the observer towards the source plane. The results areshown in Fig. 8: we see that increasing the value of Ωm, thestrong lensing efficiency reaches its maximum at lower lensredshifts. In particular the peak around which the produc-tion of gravitational arcs is expected to be boosted shiftsfrom z ≈ 0.6 to z ≈ 0.4 when the value of Ωm is increasedfrom 0.1 to 0.5.
The effect of the anticipation of structure formation dueto a higher value of σ8 (Giocoli et al. 2007, 2012b) has con-sequences on several halo structural properties that may in-fluence the size of σl/w. Considering the concentration pa-rameter, at fixed σ8, large Ωm values lead to larger con-centrations because the structures form and grow in denserenvironments. At the same time, keeping fixed the value ofΩm, in cosmologies with high σ8 the concentration increasesbecause of both the higher contrast between primordial per-turbations and background, and the anticipated formationtime (Neto et al. 2007; Giocoli et al. 2012b; Maccio et al.2008).
Haloes triaxiality is also an important feature thatdepends on cosmological parameters (Despali et al. 2014;Bonamigo et al. 2015). In particular, the level of spheric-ity of a halo, which is directly related to the ratio betweenits minor and major semi-axes a/c, is an increasing func-tion of σ8 and a decreasing function of Ωm. As an exam-ple, if we consider haloes with a mass equal to 7.5 × 10¹⁴
h−1M at redshift z = 0.54 in a cosmological model withΩm = 0.3, the median ratio among 128 realizations variesfrom a/c = 0.353+0.049
−0.056 in a model with σ8 = 0.6, toa/c = 0.417+0.057
−0.066 in a model with σ8 = 1.0. The quoteduncertaintes correspond to 1σ errors. On the other hand, ifwe fix σ8 = 0.8, the ratio changes from a/c = 0.419+0.058
−0.066
in a model with Ωm = 0.1, to a/c = 0.388+0.053−0.061 in a model
with Ωm = 0.5.
4.2 Effects of completeness and cluster selectionfunction
In the following subsections we will discuss how our resultschange when we take into account the lack of completenessand when we introduce a realistic photometric galaxy clusterselection function.
4.2.1 The effect of sample completeness and survey area
Let us consider here the case in which a fraction of arcs aremissed, independently of the properties of the lens configura-tions (l/w, zl, zs). This may happen because some arcs mayescape detection for some particular configurations of thelight distribution within the cluster, or when the separationbetween cluster and foreground galaxies is made difficult bythe lack of precise color information. The total arc countsmay also diminish because we are performing our search ina reduced effective area, smaller than the one of the run-ning survey. In this situation losing 10% of the counts isequivalent to observe a portion of sky 10% smaller than theoriginal survey. The obvious consequence of a reduction ofthe number of observed arcs is that the Poissonian uncer-tainty grows and can start to dominate with respect to the
c© RAS, MNRAS 000, 1–12
Cosmology through arc statistics I 9
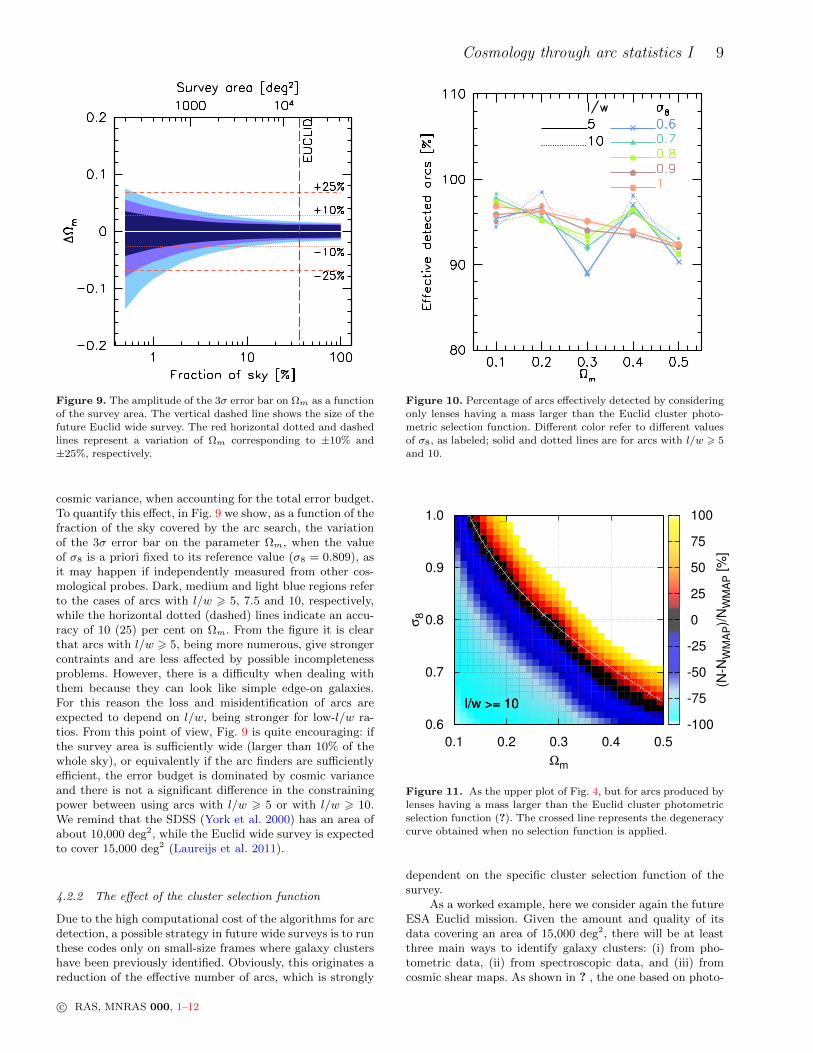
Figure 9. The amplitude of the 3σ error bar on Ωm as a function
of the survey area. The vertical dashed line shows the size of thefuture Euclid wide survey. The red horizontal dotted and dashed
lines represent a variation of Ωm corresponding to ±10% and
±25%, respectively.
cosmic variance, when accounting for the total error budget.To quantify this effect, in Fig. 9 we show, as a function of thefraction of the sky covered by the arc search, the variationof the 3σ error bar on the parameter Ωm, when the valueof σ8 is a priori fixed to its reference value (σ8 = 0.809), asit may happen if independently measured from other cos-mological probes. Dark, medium and light blue regions referto the cases of arcs with l/w > 5, 7.5 and 10, respectively,while the horizontal dotted (dashed) lines indicate an accu-racy of 10 (25) per cent on Ωm. From the figure it is clearthat arcs with l/w > 5, being more numerous, give strongercontraints and are less affected by possible incompletenessproblems. However, there is a difficulty when dealing withthem because they can look like simple edge-on galaxies.For this reason the loss and misidentification of arcs areexpected to depend on l/w, being stronger for low-l/w ra-tios. From this point of view, Fig. 9 is quite encouraging: ifthe survey area is sufficiently wide (larger than 10% of thewhole sky), or equivalently if the arc finders are sufficientlyefficient, the error budget is dominated by cosmic varianceand there is not a significant difference in the constrainingpower between using arcs with l/w > 5 or with l/w > 10.We remind that the SDSS (York et al. 2000) has an area ofabout 10,000 deg2, while the Euclid wide survey is expectedto cover 15,000 deg2 (Laureijs et al. 2011).
4.2.2 The effect of the cluster selection function
Due to the high computational cost of the algorithms for arcdetection, a possible strategy in future wide surveys is to runthese codes only on small-size frames where galaxy clustershave been previously identified. Obviously, this originates areduction of the effective number of arcs, which is strongly
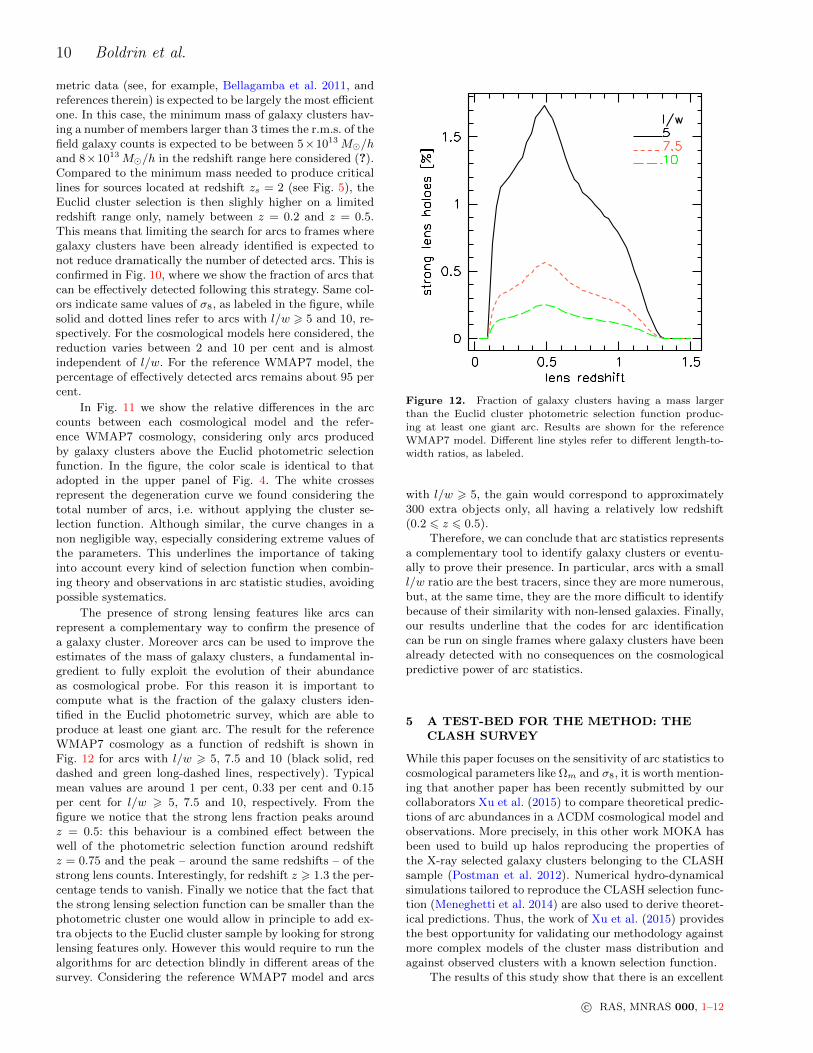
Figure 10. Percentage of arcs effectively detected by considering
only lenses having a mass larger than the Euclid cluster photo-metric selection function. Different color refer to different values
of σ8, as labeled; solid and dotted lines are for arcs with l/w > 5
and 10.
l/w >= 10
0.1 0.2 0.3 0.4 0.5
Ωm
0.6
0.7
0.8
0.9
1.0
σ8
-100
-75
-50
-25
0
25
50
75
100
(N-N
WM
AP)/
NW
MA
P [%
]
l/w >= 10l/w >= 10
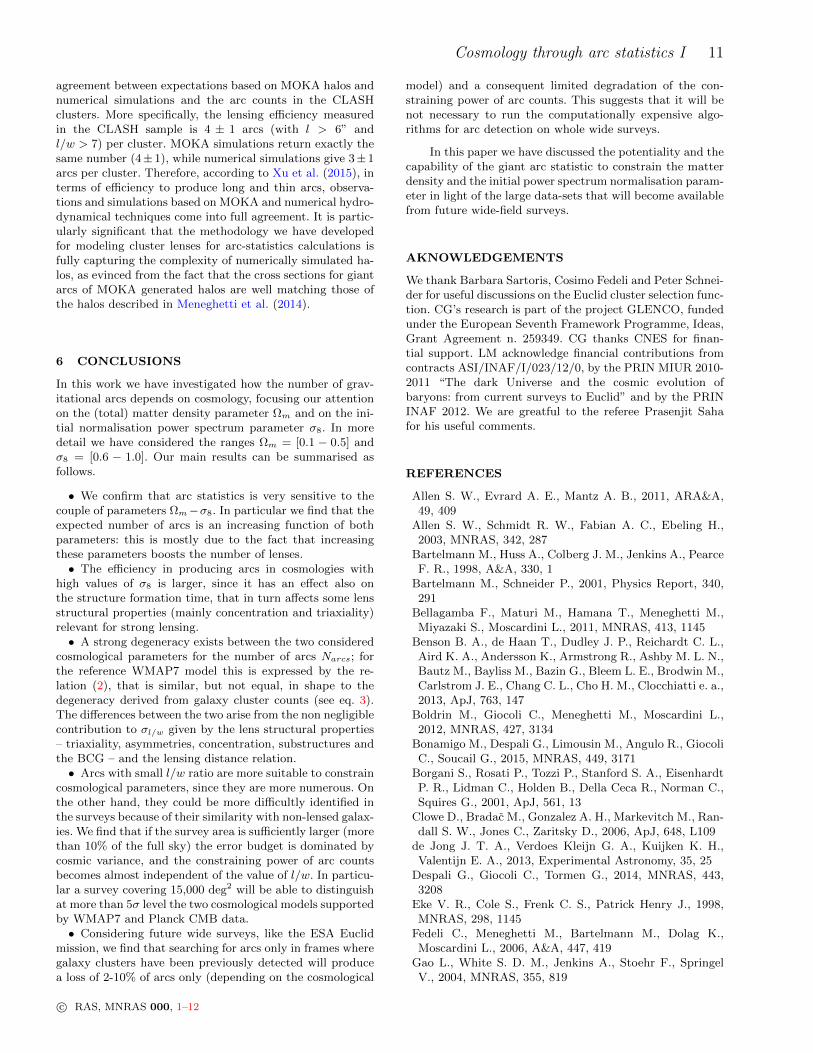
Figure 11. As the upper plot of Fig. 4, but for arcs produced by
lenses having a mass larger than the Euclid cluster photometricselection function (?). The crossed line represents the degeneracy
curve obtained when no selection function is applied.
dependent on the specific cluster selection function of thesurvey.
As a worked example, here we consider again the futureESA Euclid mission. Given the amount and quality of itsdata covering an area of 15,000 deg2, there will be at leastthree main ways to identify galaxy clusters: (i) from pho-tometric data, (ii) from spectroscopic data, and (iii) fromcosmic shear maps. As shown in ? , the one based on photo-
c© RAS, MNRAS 000, 1–12
10 Boldrin et al.
metric data (see, for example, Bellagamba et al. 2011, andreferences therein) is expected to be largely the most efficientone. In this case, the minimum mass of galaxy clusters hav-ing a number of members larger than 3 times the r.m.s. of thefield galaxy counts is expected to be between 5×10¹³ M/hand 8×10¹³ M/h in the redshift range here considered (?).Compared to the minimum mass needed to produce criticallines for sources located at redshift zs = 2 (see Fig. 5), theEuclid cluster selection is then slighly higher on a limitedredshift range only, namely between z = 0.2 and z = 0.5.This means that limiting the search for arcs to frames wheregalaxy clusters have been already identified is expected tonot reduce dramatically the number of detected arcs. This isconfirmed in Fig. 10, where we show the fraction of arcs thatcan be effectively detected following this strategy. Same col-ors indicate same values of σ8, as labeled in the figure, whilesolid and dotted lines refer to arcs with l/w > 5 and 10, re-spectively. For the cosmological models here considered, thereduction varies between 2 and 10 per cent and is almostindependent of l/w. For the reference WMAP7 model, thepercentage of effectively detected arcs remains about 95 percent.
In Fig. 11 we show the relative differences in the arccounts between each cosmological model and the refer-ence WMAP7 cosmology, considering only arcs producedby galaxy clusters above the Euclid photometric selectionfunction. In the figure, the color scale is identical to thatadopted in the upper panel of Fig. 4. The white crossesrepresent the degeneration curve we found considering thetotal number of arcs, i.e. without applying the cluster se-lection function. Although similar, the curve changes in anon negligible way, especially considering extreme values ofthe parameters. This underlines the importance of takinginto account every kind of selection function when combin-ing theory and observations in arc statistic studies, avoidingpossible systematics.
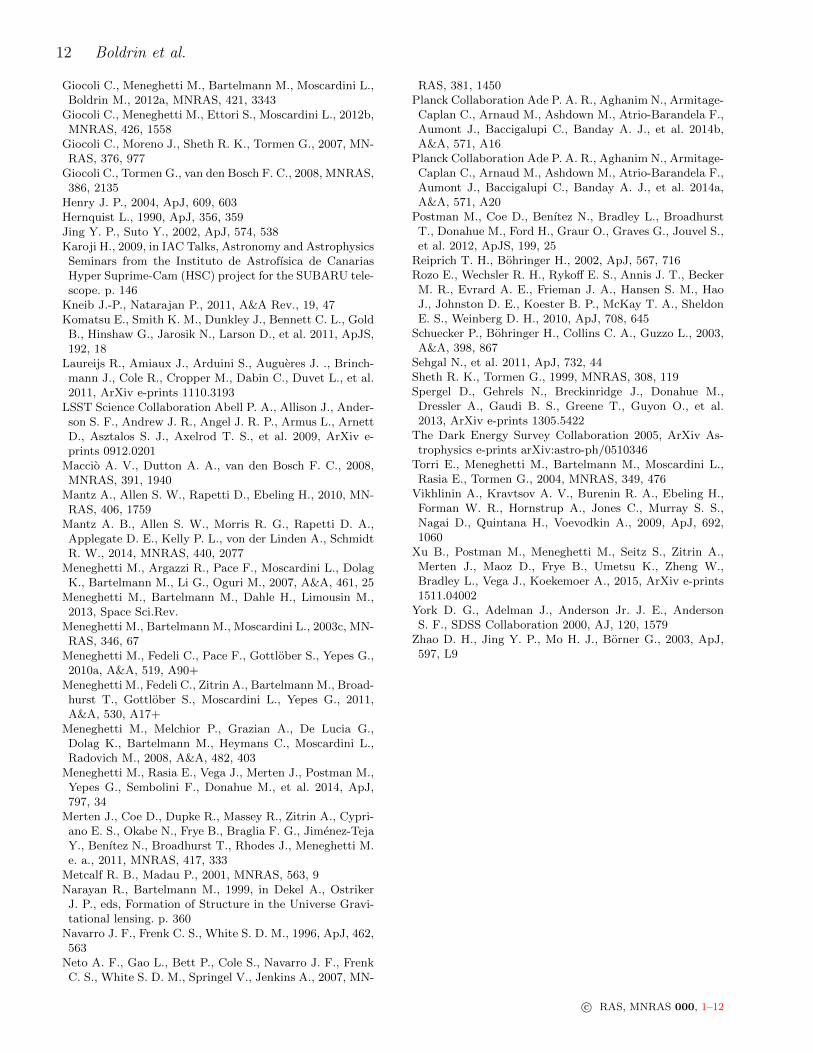
The presence of strong lensing features like arcs canrepresent a complementary way to confirm the presence ofa galaxy cluster. Moreover arcs can be used to improve theestimates of the mass of galaxy clusters, a fundamental in-gredient to fully exploit the evolution of their abundanceas cosmological probe. For this reason it is important tocompute what is the fraction of the galaxy clusters iden-tified in the Euclid photometric survey, which are able toproduce at least one giant arc. The result for the referenceWMAP7 cosmology as a function of redshift is shown inFig. 12 for arcs with l/w > 5, 7.5 and 10 (black solid, reddashed and green long-dashed lines, respectively). Typicalmean values are around 1 per cent, 0.33 per cent and 0.15per cent for l/w > 5, 7.5 and 10, respectively. From thefigure we notice that the strong lens fraction peaks aroundz = 0.5: this behaviour is a combined effect between thewell of the photometric selection function around redshiftz = 0.75 and the peak – around the same redshifts – of thestrong lens counts. Interestingly, for redshift z > 1.3 the per-centage tends to vanish. Finally we notice that the fact thatthe strong lensing selection function can be smaller than thephotometric cluster one would allow in principle to add ex-tra objects to the Euclid cluster sample by looking for stronglensing features only. However this would require to run thealgorithms for arc detection blindly in different areas of thesurvey. Considering the reference WMAP7 model and arcs
Figure 12. Fraction of galaxy clusters having a mass larger
than the Euclid cluster photometric selection function produc-ing at least one giant arc. Results are shown for the reference
WMAP7 model. Different line styles refer to different length-to-
width ratios, as labeled.
with l/w > 5, the gain would correspond to approximately300 extra objects only, all having a relatively low redshift(0.2 6 z 6 0.5).
Therefore, we can conclude that arc statistics representsa complementary tool to identify galaxy clusters or eventu-ally to prove their presence. In particular, arcs with a smalll/w ratio are the best tracers, since they are more numerous,but, at the same time, they are the more difficult to identifybecause of their similarity with non-lensed galaxies. Finally,our results underline that the codes for arc identificationcan be run on single frames where galaxy clusters have beenalready detected with no consequences on the cosmologicalpredictive power of arc statistics.
5 A TEST-BED FOR THE METHOD: THECLASH SURVEY
While this paper focuses on the sensitivity of arc statistics tocosmological parameters like Ωm and σ8, it is worth mention-ing that another paper has been recently submitted by ourcollaborators Xu et al. (2015) to compare theoretical predic-tions of arc abundances in a ΛCDM cosmological model andobservations. More precisely, in this other work MOKA hasbeen used to build up halos reproducing the properties ofthe X-ray selected galaxy clusters belonging to the CLASHsample (Postman et al. 2012). Numerical hydro-dynamicalsimulations tailored to reproduce the CLASH selection func-tion (Meneghetti et al. 2014) are also used to derive theoret-ical predictions. Thus, the work of Xu et al. (2015) providesthe best opportunity for validating our methodology againstmore complex models of the cluster mass distribution andagainst observed clusters with a known selection function.
The results of this study show that there is an excellent
c© RAS, MNRAS 000, 1–12
Cosmology through arc statistics I 11
agreement between expectations based on MOKA halos andnumerical simulations and the arc counts in the CLASHclusters. More specifically, the lensing efficiency measuredin the CLASH sample is 4 ± 1 arcs (with l > 6” andl/w > 7) per cluster. MOKA simulations return exactly thesame number (4±1), while numerical simulations give 3±1arcs per cluster. Therefore, according to Xu et al. (2015), interms of efficiency to produce long and thin arcs, observa-tions and simulations based on MOKA and numerical hydro-dynamical techniques come into full agreement. It is partic-ularly significant that the methodology we have developedfor modeling cluster lenses for arc-statistics calculations isfully capturing the complexity of numerically simulated ha-los, as evinced from the fact that the cross sections for giantarcs of MOKA generated halos are well matching those ofthe halos described in Meneghetti et al. (2014).
6 CONCLUSIONS
In this work we have investigated how the number of grav-itational arcs depends on cosmology, focusing our attentionon the (total) matter density parameter Ωm and on the ini-tial normalisation power spectrum parameter σ8. In moredetail we have considered the ranges Ωm = [0.1 − 0.5] andσ8 = [0.6 − 1.0]. Our main results can be summarised asfollows.
• We confirm that arc statistics is very sensitive to thecouple of parameters Ωm−σ8. In particular we find that theexpected number of arcs is an increasing function of bothparameters: this is mostly due to the fact that increasingthese parameters boosts the number of lenses.• The efficiency in producing arcs in cosmologies with
high values of σ8 is larger, since it has an effect also onthe structure formation time, that in turn affects some lensstructural properties (mainly concentration and triaxiality)relevant for strong lensing.• A strong degeneracy exists between the two considered
cosmological parameters for the number of arcs Narcs; forthe reference WMAP7 model this is expressed by the re-lation (2), that is similar, but not equal, in shape to thedegeneracy derived from galaxy cluster counts (see eq. 3).The differences between the two arise from the non negligiblecontribution to σl/w given by the lens structural properties– triaxiality, asymmetries, concentration, substructures andthe BCG – and the lensing distance relation.• Arcs with small l/w ratio are more suitable to constrain
cosmological parameters, since they are more numerous. Onthe other hand, they could be more difficultly identified inthe surveys because of their similarity with non-lensed galax-ies. We find that if the survey area is sufficiently larger (morethan 10% of the full sky) the error budget is dominated bycosmic variance, and the constraining power of arc countsbecomes almost independent of the value of l/w. In particu-lar a survey covering 15,000 deg2 will be able to distinguishat more than 5σ level the two cosmological models supportedby WMAP7 and Planck CMB data.• Considering future wide surveys, like the ESA Euclid
mission, we find that searching for arcs only in frames wheregalaxy clusters have been previously detected will producea loss of 2-10% of arcs only (depending on the cosmological
model) and a consequent limited degradation of the con-straining power of arc counts. This suggests that it will benot necessary to run the computationally expensive algo-rithms for arc detection on whole wide surveys.
In this paper we have discussed the potentiality and thecapability of the giant arc statistic to constrain the matterdensity and the initial power spectrum normalisation param-eter in light of the large data-sets that will become availablefrom future wide-field surveys.
AKNOWLEDGEMENTS
We thank Barbara Sartoris, Cosimo Fedeli and Peter Schnei-der for useful discussions on the Euclid cluster selection func-tion. CG’s research is part of the project GLENCO, fundedunder the European Seventh Framework Programme, Ideas,Grant Agreement n. 259349. CG thanks CNES for finan-tial support. LM acknowledge financial contributions fromcontracts ASI/INAF/I/023/12/0, by the PRIN MIUR 2010-2011 “The dark Universe and the cosmic evolution ofbaryons: from current surveys to Euclid” and by the PRININAF 2012. We are greatful to the referee Prasenjit Sahafor his useful comments.
REFERENCES
Allen S. W., Evrard A. E., Mantz A. B., 2011, ARA&A,49, 409
Allen S. W., Schmidt R. W., Fabian A. C., Ebeling H.,2003, MNRAS, 342, 287
Bartelmann M., Huss A., Colberg J. M., Jenkins A., PearceF. R., 1998, A&A, 330, 1
Bartelmann M., Schneider P., 2001, Physics Report, 340,291
Bellagamba F., Maturi M., Hamana T., Meneghetti M.,Miyazaki S., Moscardini L., 2011, MNRAS, 413, 1145
Benson B. A., de Haan T., Dudley J. P., Reichardt C. L.,Aird K. A., Andersson K., Armstrong R., Ashby M. L. N.,Bautz M., Bayliss M., Bazin G., Bleem L. E., Brodwin M.,Carlstrom J. E., Chang C. L., Cho H. M., Clocchiatti e. a.,2013, ApJ, 763, 147
Boldrin M., Giocoli C., Meneghetti M., Moscardini L.,2012, MNRAS, 427, 3134
Bonamigo M., Despali G., Limousin M., Angulo R., GiocoliC., Soucail G., 2015, MNRAS, 449, 3171
Borgani S., Rosati P., Tozzi P., Stanford S. A., EisenhardtP. R., Lidman C., Holden B., Della Ceca R., Norman C.,Squires G., 2001, ApJ, 561, 13
Clowe D., Bradac M., Gonzalez A. H., Markevitch M., Ran-dall S. W., Jones C., Zaritsky D., 2006, ApJ, 648, L109
de Jong J. T. A., Verdoes Kleijn G. A., Kuijken K. H.,Valentijn E. A., 2013, Experimental Astronomy, 35, 25
Despali G., Giocoli C., Tormen G., 2014, MNRAS, 443,3208
Eke V. R., Cole S., Frenk C. S., Patrick Henry J., 1998,MNRAS, 298, 1145
Fedeli C., Meneghetti M., Bartelmann M., Dolag K.,Moscardini L., 2006, A&A, 447, 419
Gao L., White S. D. M., Jenkins A., Stoehr F., SpringelV., 2004, MNRAS, 355, 819
c© RAS, MNRAS 000, 1–12
12 Boldrin et al.
Giocoli C., Meneghetti M., Bartelmann M., Moscardini L.,Boldrin M., 2012a, MNRAS, 421, 3343
Giocoli C., Meneghetti M., Ettori S., Moscardini L., 2012b,MNRAS, 426, 1558
Giocoli C., Moreno J., Sheth R. K., Tormen G., 2007, MN-RAS, 376, 977
Giocoli C., Tormen G., van den Bosch F. C., 2008, MNRAS,386, 2135
Henry J. P., 2004, ApJ, 609, 603Hernquist L., 1990, ApJ, 356, 359Jing Y. P., Suto Y., 2002, ApJ, 574, 538Karoji H., 2009, in IAC Talks, Astronomy and AstrophysicsSeminars from the Instituto de Astrofısica de CanariasHyper Suprime-Cam (HSC) project for the SUBARU tele-scope. p. 146
Kneib J.-P., Natarajan P., 2011, A&A Rev., 19, 47Komatsu E., Smith K. M., Dunkley J., Bennett C. L., GoldB., Hinshaw G., Jarosik N., Larson D., et al. 2011, ApJS,192, 18
Laureijs R., Amiaux J., Arduini S., Augueres J. ., Brinch-mann J., Cole R., Cropper M., Dabin C., Duvet L., et al.2011, ArXiv e-prints 1110.3193
LSST Science Collaboration Abell P. A., Allison J., Ander-son S. F., Andrew J. R., Angel J. R. P., Armus L., ArnettD., Asztalos S. J., Axelrod T. S., et al. 2009, ArXiv e-prints 0912.0201
Maccio A. V., Dutton A. A., van den Bosch F. C., 2008,MNRAS, 391, 1940
Mantz A., Allen S. W., Rapetti D., Ebeling H., 2010, MN-RAS, 406, 1759
Mantz A. B., Allen S. W., Morris R. G., Rapetti D. A.,Applegate D. E., Kelly P. L., von der Linden A., SchmidtR. W., 2014, MNRAS, 440, 2077
Meneghetti M., Argazzi R., Pace F., Moscardini L., DolagK., Bartelmann M., Li G., Oguri M., 2007, A&A, 461, 25
Meneghetti M., Bartelmann M., Dahle H., Limousin M.,2013, Space Sci.Rev.
Meneghetti M., Bartelmann M., Moscardini L., 2003c, MN-RAS, 346, 67
Meneghetti M., Fedeli C., Pace F., Gottlober S., Yepes G.,2010a, A&A, 519, A90+
Meneghetti M., Fedeli C., Zitrin A., Bartelmann M., Broad-hurst T., Gottlober S., Moscardini L., Yepes G., 2011,A&A, 530, A17+
Meneghetti M., Melchior P., Grazian A., De Lucia G.,Dolag K., Bartelmann M., Heymans C., Moscardini L.,Radovich M., 2008, A&A, 482, 403
Meneghetti M., Rasia E., Vega J., Merten J., Postman M.,Yepes G., Sembolini F., Donahue M., et al. 2014, ApJ,797, 34
Merten J., Coe D., Dupke R., Massey R., Zitrin A., Cypri-ano E. S., Okabe N., Frye B., Braglia F. G., Jimenez-TejaY., Benıtez N., Broadhurst T., Rhodes J., Meneghetti M.e. a., 2011, MNRAS, 417, 333
Metcalf R. B., Madau P., 2001, MNRAS, 563, 9Narayan R., Bartelmann M., 1999, in Dekel A., OstrikerJ. P., eds, Formation of Structure in the Universe Gravi-tational lensing. p. 360
Navarro J. F., Frenk C. S., White S. D. M., 1996, ApJ, 462,563
Neto A. F., Gao L., Bett P., Cole S., Navarro J. F., FrenkC. S., White S. D. M., Springel V., Jenkins A., 2007, MN-
RAS, 381, 1450Planck Collaboration Ade P. A. R., Aghanim N., Armitage-Caplan C., Arnaud M., Ashdown M., Atrio-Barandela F.,Aumont J., Baccigalupi C., Banday A. J., et al. 2014b,A&A, 571, A16
Planck Collaboration Ade P. A. R., Aghanim N., Armitage-Caplan C., Arnaud M., Ashdown M., Atrio-Barandela F.,Aumont J., Baccigalupi C., Banday A. J., et al. 2014a,A&A, 571, A20
Postman M., Coe D., Benıtez N., Bradley L., BroadhurstT., Donahue M., Ford H., Graur O., Graves G., Jouvel S.,et al. 2012, ApJS, 199, 25
Reiprich T. H., Bohringer H., 2002, ApJ, 567, 716Rozo E., Wechsler R. H., Rykoff E. S., Annis J. T., BeckerM. R., Evrard A. E., Frieman J. A., Hansen S. M., HaoJ., Johnston D. E., Koester B. P., McKay T. A., SheldonE. S., Weinberg D. H., 2010, ApJ, 708, 645
Schuecker P., Bohringer H., Collins C. A., Guzzo L., 2003,A&A, 398, 867
Sehgal N., et al. 2011, ApJ, 732, 44Sheth R. K., Tormen G., 1999, MNRAS, 308, 119Spergel D., Gehrels N., Breckinridge J., Donahue M.,Dressler A., Gaudi B. S., Greene T., Guyon O., et al.2013, ArXiv e-prints 1305.5422
The Dark Energy Survey Collaboration 2005, ArXiv As-trophysics e-prints arXiv:astro-ph/0510346
Torri E., Meneghetti M., Bartelmann M., Moscardini L.,Rasia E., Tormen G., 2004, MNRAS, 349, 476
Vikhlinin A., Kravtsov A. V., Burenin R. A., Ebeling H.,Forman W. R., Hornstrup A., Jones C., Murray S. S.,Nagai D., Quintana H., Voevodkin A., 2009, ApJ, 692,1060
Xu B., Postman M., Meneghetti M., Seitz S., Zitrin A.,Merten J., Maoz D., Frye B., Umetsu K., Zheng W.,Bradley L., Vega J., Koekemoer A., 2015, ArXiv e-prints1511.04002
York D. G., Adelman J., Anderson Jr. J. E., AndersonS. F., SDSS Collaboration 2000, AJ, 120, 1579
Zhao D. H., Jing Y. P., Mo H. J., Borner G., 2003, ApJ,597, L9
c© RAS, MNRAS 000, 1–12