All about Variogram Nugget effect - Home - Dept. of ...mjun/stat647_f12/f12_variogram.pdf ·...
17
What’s for today All about Variogram Nugget effect Mikyoung Jun (Texas A&M) stat647 lecture 4 September 6, 2012 1 / 17
Transcript of All about Variogram Nugget effect - Home - Dept. of ...mjun/stat647_f12/f12_variogram.pdf ·...
What’s for today
All about Variogram
Nugget effect
Mikyoung Jun (Texas A&M) stat647 lecture 4 September 6, 2012 1 / 17
What is the variogram?
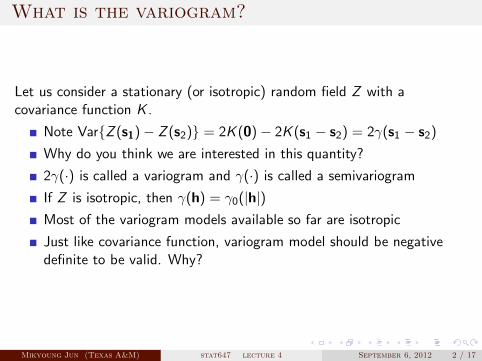
Let us consider a stationary (or isotropic) random field Z with acovariance function K .
Note Var{Z (s1) − Z (s2)} = 2K (0) − 2K (s1 − s2) = 2γ(s1 − s2)
Why do you think we are interested in this quantity?
2γ(·) is called a variogram and γ(·) is called a semivariogram
If Z is isotropic, then γ(h) = γ0(|h|)
Most of the variogram models available so far are isotropic
Just like covariance function, variogram model should be negativedefinite to be valid. Why?
Mikyoung Jun (Texas A&M) stat647 lecture 4 September 6, 2012 2 / 17
Variogram models
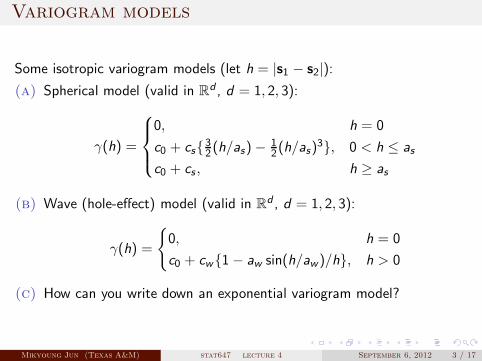
Some isotropic variogram models (let h = |s1 − s2|):
(a) Spherical model (valid in Rd , d = 1, 2, 3):
γ(h) =
0, h = 0
c0 + cs{3
2(h/as) −
1
2(h/as)
3}, 0 < h ≤ as
c0 + cs , h ≥ as
(b) Wave (hole-effect) model (valid in Rd , d = 1, 2, 3):
γ(h) =
{
0, h = 0
c0 + cw{1 − aw sin(h/aw )/h}, h > 0
(c) How can you write down an exponential variogram model?
Mikyoung Jun (Texas A&M) stat647 lecture 4 September 6, 2012 3 / 17
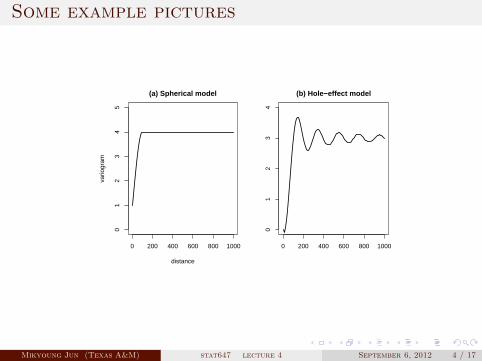
Some example pictures
0 200 400 600 800 1000
01
23
45
(a) Spherical model
distance
vario
gram
0 200 400 600 800 1000
01
23
4
(b) Hole−effect model
Mikyoung Jun (Texas A&M) stat647 lecture 4 September 6, 2012 4 / 17
General shape of variogram
Nugget effect gives the variation of the process at a finer scale than thesmallest distance measured
Mikyoung Jun (Texas A&M) stat647 lecture 4 September 6, 2012 5 / 17
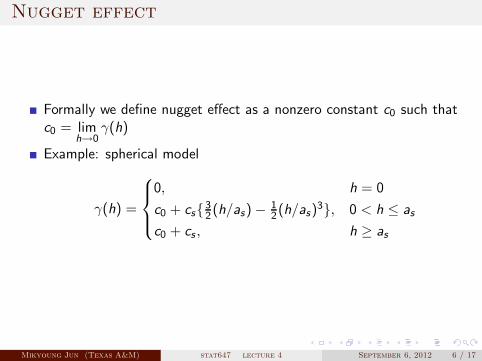
Nugget effect
Formally we define nugget effect as a nonzero constant c0 such thatc0 = lim
h→0
γ(h)
Example: spherical model
γ(h) =
0, h = 0
c0 + cs{3
2(h/as) −
1
2(h/as)
3}, 0 < h ≤ as
c0 + cs , h ≥ as
Mikyoung Jun (Texas A&M) stat647 lecture 4 September 6, 2012 6 / 17
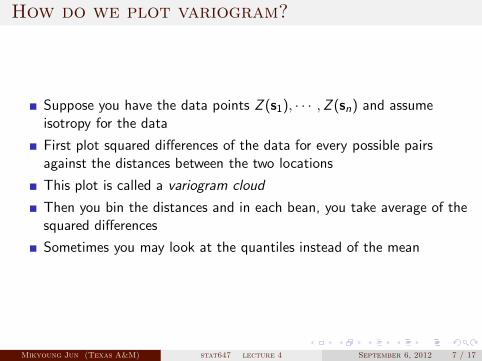
How do we plot variogram?
Suppose you have the data points Z (s1), · · · ,Z (sn) and assumeisotropy for the data
First plot squared differences of the data for every possible pairsagainst the distances between the two locations
This plot is called a variogram cloud
Then you bin the distances and in each bean, you take average of thesquared differences
Sometimes you may look at the quantiles instead of the mean
Mikyoung Jun (Texas A&M) stat647 lecture 4 September 6, 2012 7 / 17
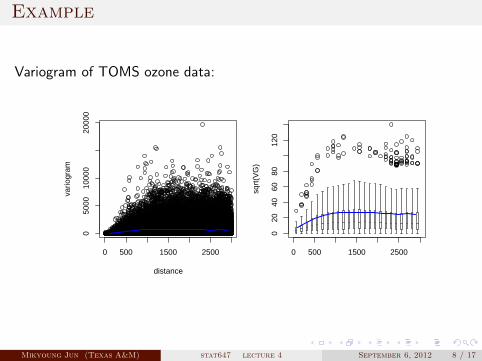
Example
Variogram of TOMS ozone data:
0 500 1500 2500
050
0010
000
2000
0
distance
vario
gram
0 500 1500 2500
020
4060
8012
0
sqrt
(VG
)
Mikyoung Jun (Texas A&M) stat647 lecture 4 September 6, 2012 8 / 17
Example
What are the blue lines?
Do you see a nugget effect?
Do you think the data is isotropic?
Notice the y-scale difference between the two figures
Mikyoung Jun (Texas A&M) stat647 lecture 4 September 6, 2012 9 / 17
Variogram plots using R
In fields package, you can use vgram
In geoR package, you may use variog
See help pages for the above commands and related commands forexamples and other usages
Mikyoung Jun (Texas A&M) stat647 lecture 4 September 6, 2012 10 / 17
How to use variogram pictures
First check if the process is isotropic
If it is, you can guess what variogram model should be appropriate,what are the parameter values (roughly), and whether there should bea nugget effect in the model or not
If not, you can plot variogram against the differences of somecoordinates
To check if the process is geometrically anisotropic or not, you canuse directional variograms
You can plot variograms for some parts of the data to checknonstationarity
Mikyoung Jun (Texas A&M) stat647 lecture 4 September 6, 2012 11 / 17
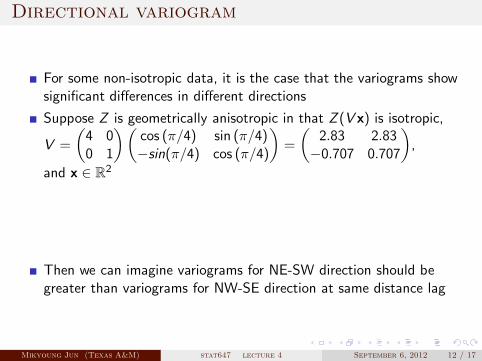
Directional variogram
For some non-isotropic data, it is the case that the variograms showsignificant differences in different directions
Suppose Z is geometrically anisotropic in that Z (V x) is isotropic,
V =
(
4 00 1
)(
cos (π/4) sin (π/4)−sin(π/4) cos (π/4)
)
=
(
2.83 2.83−0.707 0.707
)
,
and x ∈ R2
Then we can imagine variograms for NE-SW direction should begreater than variograms for NW-SE direction at same distance lag
Mikyoung Jun (Texas A&M) stat647 lecture 4 September 6, 2012 12 / 17
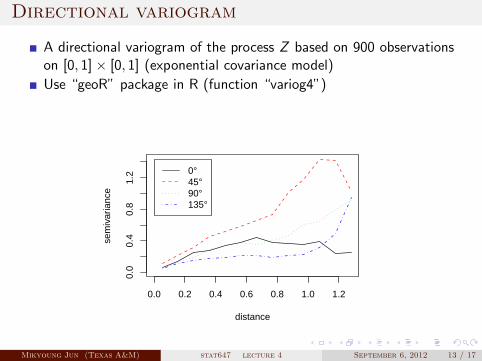
Directional variogram
A directional variogram of the process Z based on 900 observationson [0, 1] × [0, 1] (exponential covariance model)
Use “geoR” package in R (function “variog4”)
0.0 0.2 0.4 0.6 0.8 1.0 1.2
0.0
0.4
0.8
1.2
distance
sem
ivar
ianc
e
0°45°90°135°
Mikyoung Jun (Texas A&M) stat647 lecture 4 September 6, 2012 13 / 17
Variogram for nonstationary data
If you suspect certain nonstationarity in the data set, you may tryvariograms for subsets of the data
For global data set, if there is a dependence of covariance structure onlatitude, try variograms for each latitude levelsFor a dataset that covers land and sea, you may try variograms overthe land and the sea separatelyIf you look at air pollution data, you may try variograms for urban andrural areas separately. You may also try variograms over majorhighways etc separately
Don’t be fooled by some patterns that may well be due to randomvariation in the data
Also don’t be fooled by a variogram that may hide many differentpatterns
Mikyoung Jun (Texas A&M) stat647 lecture 4 September 6, 2012 14 / 17
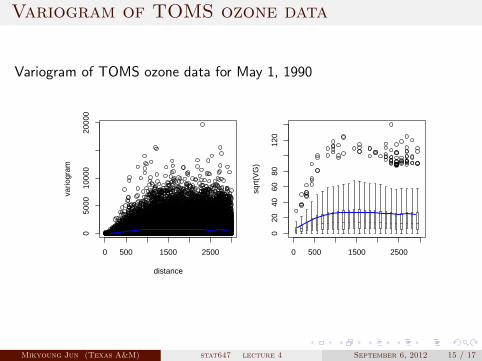
Variogram of TOMS ozone data
Variogram of TOMS ozone data for May 1, 1990
0 500 1500 2500
050
0010
000
2000
0
distance
vario
gram
0 500 1500 2500
020
4060
8012
0
sqrt
(VG
)
Mikyoung Jun (Texas A&M) stat647 lecture 4 September 6, 2012 15 / 17
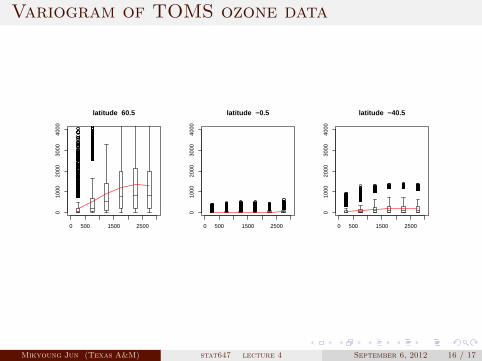
Variogram of TOMS ozone data
0 500 1500 2500
010
0020
0030
0040
00
latitude 60.5
0 500 1500 2500
010
0020
0030
0040
00
latitude −0.5
0 500 1500 2500
010
0020
0030
0040
00
latitude −40.5
Mikyoung Jun (Texas A&M) stat647 lecture 4 September 6, 2012 16 / 17
Issues with variogram display
If the data are not isotropic...
if the process is stationary, we could display variograms against thespatial lagif the process is not stationary, it is not clear what is the best choice forthe x-axisfor TOMS data, we might display variograms against longitude lag ateach latitude levels
If we have space-time data, then the variogram should be displayed as3 dimensional (or higher dimensional) plot even if the process isisotropic in space
Mikyoung Jun (Texas A&M) stat647 lecture 4 September 6, 2012 17 / 17