3 DEVELOPMENT OF STRAIN-BASED FATIGUE LIFE …umpir.ump.edu.my/1870/1/Mohd_Radzi_Abd_Rashid_(… ·...
24
DEVELOPMENT OF STRAIN-BASED FATIGUE LIFE CALCULATION SOFTWARE FOR VARIABLE AMPLITUDE LOADING DATA MOHD RADZI BIN ABD RASHID Thesis submitted in partial fulfilment of the requirements for the award of the degree of Bachelor of Mechanical Engineering Faculty of Mechanical Engineering UNIVERSITI MALAYSIA PAHANG DECEMBER 2010
Transcript of 3 DEVELOPMENT OF STRAIN-BASED FATIGUE LIFE …umpir.ump.edu.my/1870/1/Mohd_Radzi_Abd_Rashid_(… ·...
3
DEVELOPMENT OF STRAIN-BASED FATIGUE LIFE CALCULATION
SOFTWARE FOR VARIABLE AMPLITUDE LOADING DATA
MOHD RADZI BIN ABD RASHID
Thesis submitted in partial fulfilment of the requirements
for the award of the degree of
Bachelor of Mechanical Engineering
Faculty of Mechanical Engineering
UNIVERSITI MALAYSIA PAHANG
DECEMBER 2010
4
UNIVERSITI MALAYSIA PAHANG
FACULTY OF MECHANICAL ENGINEERING
I certify that the thesis entitled “Development of strain-Based Fatigue Life Calculation
Software for Variable Amplitude Loading Data” is written by Mohd Radzi Bin Abd
Rashid. We have examined the final copy of this thesis and in our opinion; it is fully
adequate in terms of scope and quality for the award of the degree of Mechanical
Engineering. We herewith recommend that it be accepted in fulfilment of the
requirements for the degree of Mechanical Engineering.
Mr Abdul Rahim Bin Ismail Signature
Lecturer Faculty of Mechanical Engineering
Universiti Malaysia Pahang
ii

5
SUPERVISOR’S DECLARATION
I hereby declare that we have checked this project report and in our opinion this project
is satisfactory in terms of scope and quality for the award of the degree of Bachelor of
Mechanical Engineering.
Signature:
Name of Supervisor: CHE KU EDDY NIZWAN BIN CHE KU HUSIN
Position: Lecturer Faculty of Mechanical Engineering
Date: 6 DECEMBER 2010
iii

6
STUDENT’S DECLARATION
I hereby declare that the work in this report is my own except for quotations and
summaries which have been duly acknowledged. The report has not been accepted for
any degree and is not concurrently submitted for award of other degree.
Signature:
Name: MOHD RADZI BIN ABD RASHID
ID Number: MA08017
Date: 6 DECEMBER 2010
iv
8
ACKNOWLEDGEMENT
First and foremost, I am very grateful to the Almighty ALLAH S.W.T for giving
me this opportunity to accomplish my Final Year Project.
Firstly, I wish to express my deep gratitude to my Supervisor, Mr Che Ku Eddy
Nizwan Bin Che Ku Husin for all his valuable guidance, assistance and support all
through this work.
Secondly, I wish to thank lecturers for their suggestions and support on this
project. Their comments on this project are greatly appreciated. My thanks are also to
all my friends who have involved and helped me in this project.
Most importantly, I extent my gratitude to my parents who have encouraged me
throughout my education and I will always be grateful for their sacrifice, generosity and
love.
vi
9
ABSTRACT
This thesis presents the development of strain-based fatigue life calculation software for
variable amplitude loading data. The main objective of this study is to develop
calculation software for fatigue life prediction using MATLAB®. The software allows
life predictions to quickly provide fatigue crack initiation using SAESUS data and road
loading history on car lower suspension arm. In addition, the fatigue life was predicted
using strain life approach subjected to variable amplitude loading. Coffin Manson are
the method that provides in the software. Rainflow cycle counting method will be use to
extract the cycle from time series data. Then the Palmgren-Rules equation was utilized
to calculate cumulative damage. As a result, the GUI will display the result from the
method using. From the software development, it can contribute to all user for calculate
life prediction especially for variable amplitude loading. Thus the software does not
need higher cost and also user friendly.
vii
10
ABSTRAK
Tesis ini membentangkan satu pembangunan perisian pengiraan hayat lesu bagi data
bebanan pelbagai amplitud. Objektif utama adalah untuk membangunkan satu perisian
pengiraan untuk analisis hayat lesu menggunakan MATLAB®. Perisian ini
membenarkan ramalan hayat untuk permukaan retak dengan menggunakan data
SAESUS dan data lengan di bawah ampaian kereta semasa perjalanan. Dalam pada itu,
hayat lesu diramal dengan menggunakan pendekatan hayat lesu yang dikenakan untuk
pembebanan pelbagai amplitud. Model Coffin Manson merupakan kaedah yang
disediakan dalam perisian ini. Kaedah pengiraan aliran hujan dapat digunakan dalam
mengembangkan setiap kitaran dari data siri masa. Kemudian, jumlah kerosakan
kumulatif dapat ditentukan dengan aturan Palmgren Miner. Keputusannya, satu paparan
dapat dipaparkan hasil daripada menggunakan kaedah-kaedah yang disediakan. Perisian
ini dapat menyumbang dalam memudahkan pengguna khususnya pelajar bagi mengira
sesuatu jangka hayat lesu. Dalam pada itu, perisian ini tidak memerlukan kos yang
tinggi dan ianya mesra pengguna.
viii
11
TABLE OF CONTENTS
Page
APPROVAL DOCUMENT ii
SUPERVISOR’S DECLARATION iii
STUDENT’S DECLARATION iv
ACKNOWLEDGEMENTS vi
ABSTRACT vii
ABSTRAK viii
TABLE OF CONTENTS ix
LIST OF TABLES xi
LIST OF FIGURES xii
LIST OF SYMBOL xv
LIST OF ABBREVIATIONS xvi
CHAPTER 1 INTRODUCTION
1.1 Project Background
1.2 Problem Statement
1.3 Objectives
1.4 Hypothesis
1.5 Scopes of Research
1
2
2
3
3
CHAPTER 2 LITERATURE REVIEW
2.1 Fatigue
2.2 Stress-Life Based Approach (S-N Method)
2.3 Strain Based Life Fatigue
2.3.1 Coffin Manson Theory
2.3.2 Mean Stress Effect
2.4 Cycle Counting
2.5 Linear Damage Rule (Miner‟s Rule)
2.6 Steady State Cyclic Stress-Strain
2.7 MATLAB®
2.8 MATLAB® Graphical User Interface
2.9 Existing Fatigue Software
4
8
10
11
12
15
23
25
26
29
31
ix
12
REFERENCES 55
APPENDICES 57
A1-A2 Time Loading History 57
B1-B4 Rainflow and Total Damage Histogram 59
C1-C3 M-files for the software 63
D1 Gantt Chart 83
CHAPTER 3 METHODOLOGY
3.1 Introduction
3.2 Flow Chart of Project
3.3 Development Algorithm for Fatigue Life Calculation
3.4 Development Algorithm for Fatigue Life Calculation
For Variable Amplitude Data
3.5 Develop Interface Using Graphical User Interface
35
35
36
36
41
CHAPTER 4 RESULT AND DISCUSSIONS
4.1 Introduction
4.2 Main Menu of the GUI
4.3 Interface MATLAB® GUI Software
4.3.1 Display the Loading History
4.3.2 Display the Rainflow Histogram
4.3.3 Display the Total Damage Histogram
4.4 Discussions
4.4.1 Comparison Result with MSC.Fatigue Software
43
43
45
45
47
47
49
51
CHAPTER 5 CONCLUSION AND RECOMMENDATIONS
5.1 Conclusion
5.2 Recommendations
53
54
x
13
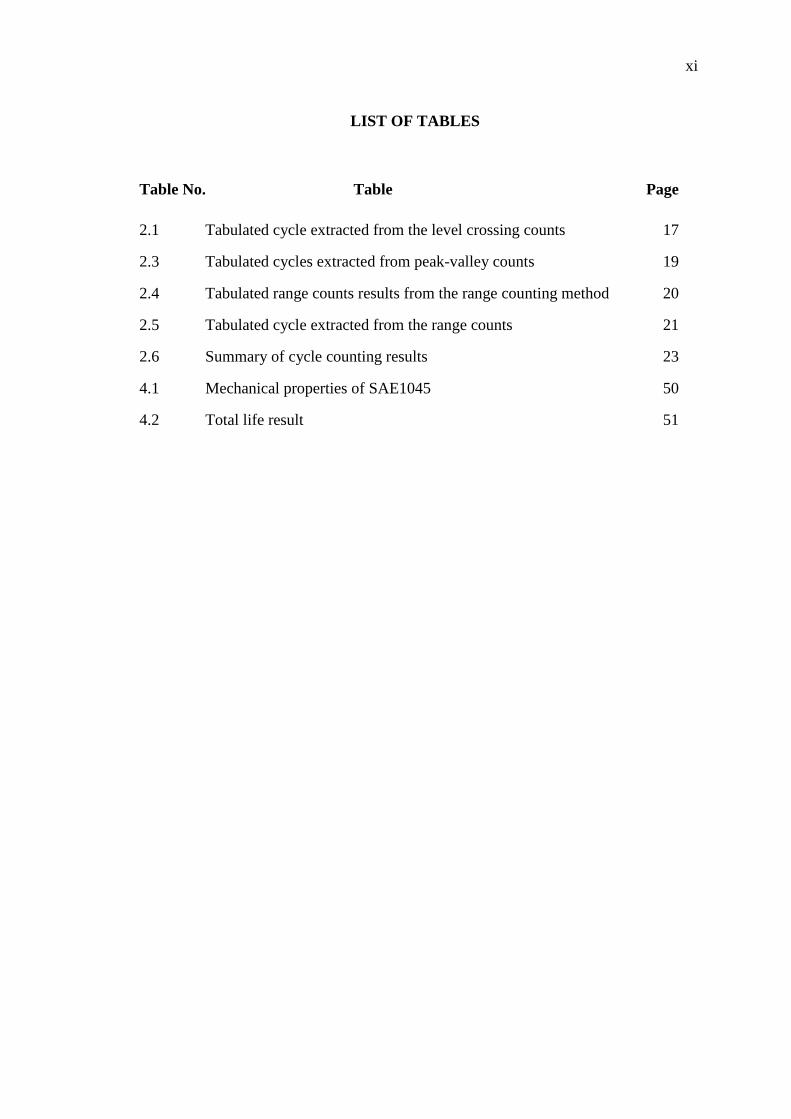
LIST OF TABLES
Table No. Table Page
2.1 Tabulated cycle extracted from the level crossing counts 17
2.3 Tabulated cycles extracted from peak-valley counts 19
2.4 Tabulated range counts results from the range counting method 20
2.5 Tabulated cycle extracted from the range counts 21
2.6 Summary of cycle counting results 23
4.1 Mechanical properties of SAE1045 50
4.2 Total life result 51
xi
14
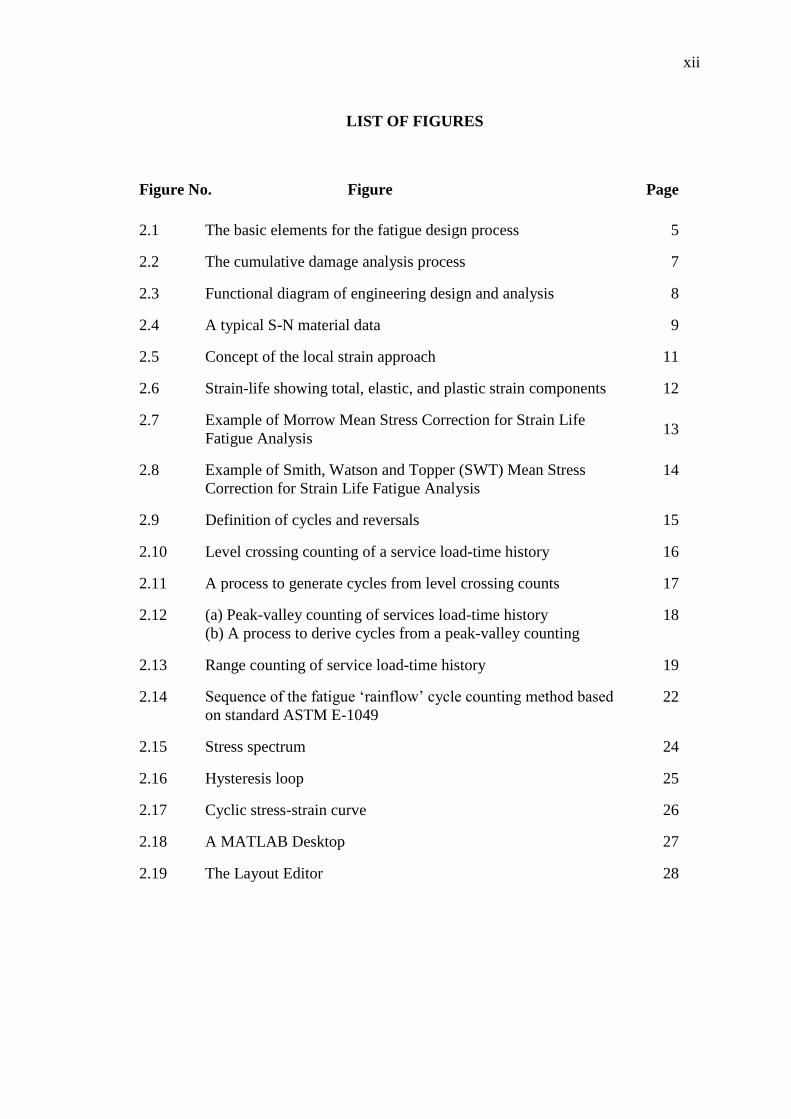
LIST OF FIGURES
Figure No. Figure Page
2.1 The basic elements for the fatigue design process 5
2.2 The cumulative damage analysis process 7
2.3 Functional diagram of engineering design and analysis 8
2.4 A typical S-N material data 9
2.5 Concept of the local strain approach 11
2.6 Strain-life showing total, elastic, and plastic strain components 12
2.7 Example of Morrow Mean Stress Correction for Strain Life
Fatigue Analysis 13
2.8 Example of Smith, Watson and Topper (SWT) Mean Stress
Correction for Strain Life Fatigue Analysis
14
2.9 Definition of cycles and reversals 15
2.10 Level crossing counting of a service load-time history 16
2.11 A process to generate cycles from level crossing counts 17
2.12 (a) Peak-valley counting of services load-time history
(b) A process to derive cycles from a peak-valley counting
18
2.13 Range counting of service load-time history 19
2.14 Sequence of the fatigue „rainflow‟ cycle counting method based
on standard ASTM E-1049
22
2.15 Stress spectrum 24
2.16 Hysteresis loop 25
2.17 Cyclic stress-strain curve 26
2.18 A MATLAB Desktop 27
2.19 The Layout Editor 28
xii
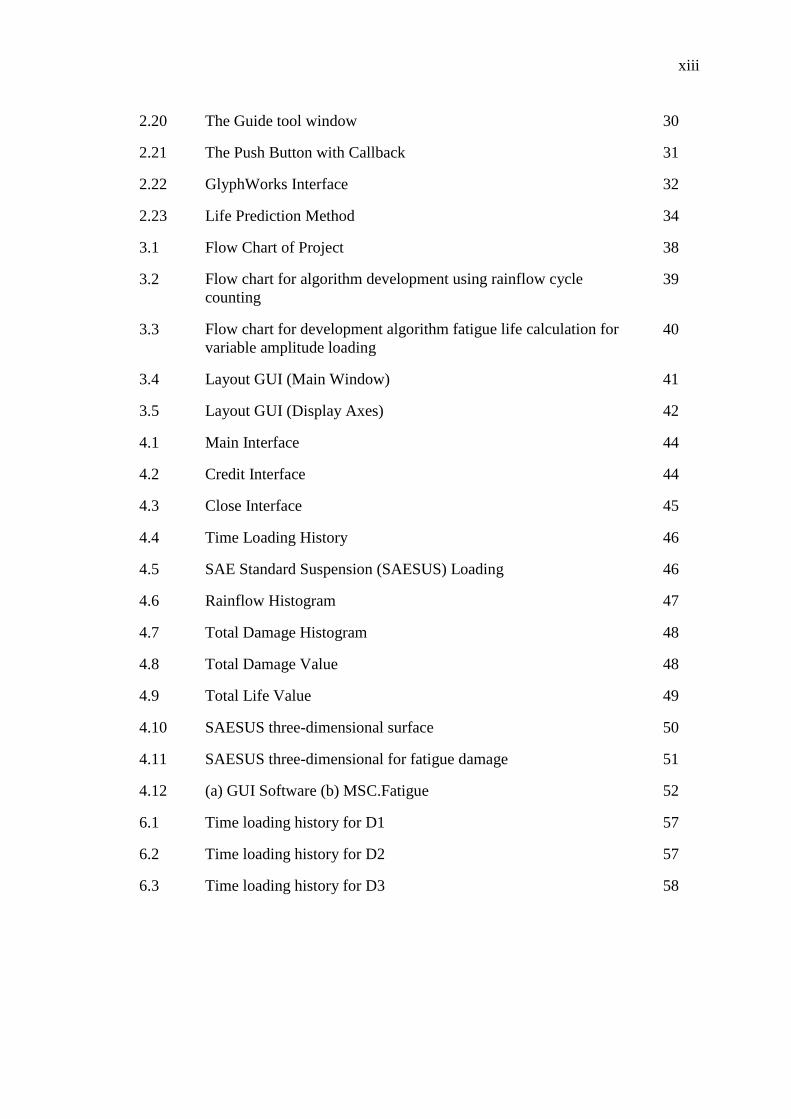
15
2.20 The Guide tool window 30
2.21 The Push Button with Callback 31
2.22 GlyphWorks Interface 32
2.23 Life Prediction Method 34
3.1 Flow Chart of Project 38
3.2 Flow chart for algorithm development using rainflow cycle
counting
39
3.3 Flow chart for development algorithm fatigue life calculation for
variable amplitude loading
40
3.4 Layout GUI (Main Window) 41
3.5 Layout GUI (Display Axes) 42
4.1 Main Interface 44
4.2 Credit Interface 44
4.3 Close Interface 45
4.4 Time Loading History 46
4.5 SAE Standard Suspension (SAESUS) Loading 46
4.6 Rainflow Histogram 47
4.7 Total Damage Histogram 48
4.8 Total Damage Value 48
4.9 Total Life Value 49
4.10 SAESUS three-dimensional surface 50
4.11 SAESUS three-dimensional for fatigue damage 51
4.12 (a) GUI Software (b) MSC.Fatigue 52
6.1 Time loading history for D1 57
6.2 Time loading history for D2 57
6.3 Time loading history for D3 58
xiii
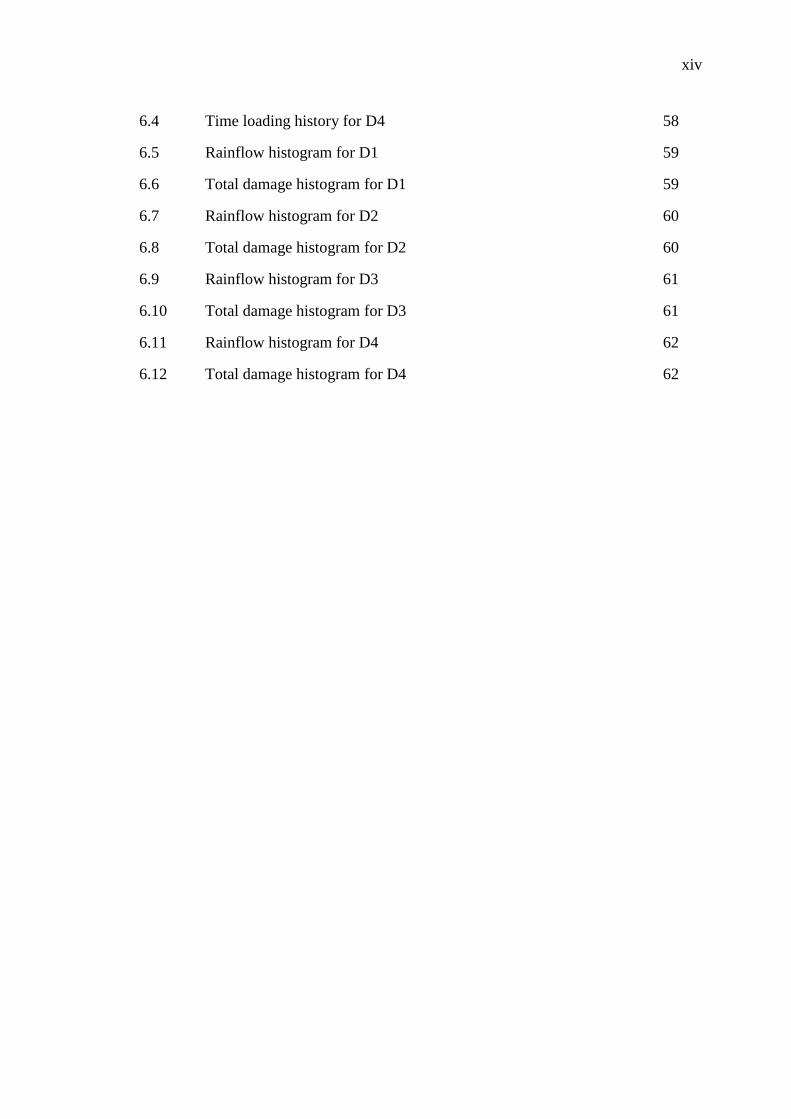
16
6.4 Time loading history for D4 58
6.5 Rainflow histogram for D1 59
6.6 Total damage histogram for D1 59
6.7 Rainflow histogram for D2 60
6.8 Total damage histogram for D2 60
6.9 Rainflow histogram for D3 61
6.10 Total damage histogram for D3 61
6.11 Rainflow histogram for D4 62
6.12 Total damage histogram for D4 62
xiv
17
LIST OF SYMBOLS
a Strain amplitude
f True fracture ductility
f Fatigue ductility coefficient
True stress, local stress
Stress range
a Local stress amplitude
m Local mean stress
max Local maximum stress
f Fatigue strength coefficient
E Modulus of elasticity
Nf Fatigue life
b Fatigue strength exponent
c Fatigue ductility exponent
2Nf Reversals to failure
Δε/2 Total strain amplitude
xv
18
LIST OF ABBREVIATIONS
ASTM American Society for Testing and Materials
GUI Graphical User Interface
SAE Society of Automotive Engineers
SWT Smith Watson Topper
xvi
1
CHAPTER 1
INTRODUCTION
1.1 PROJECT BACKGROUND
This is project about Software Development of Strain-Based Fatigue Life
Calculation for Variable Amplitude Loading Data using MATLAB® GUI. This project
will use a method that need to be taken into consideration to successfully accomplish
this project. The methods that are going to use is Coffin Manson.
Fatigue is the most important failure mode to be considered in a mechanical
design. Under the action of oscillatory tensile stresses of sufficient magnitude, a small
crack will initiate at a point of the stress concentration. Once the crack is initiated, it
will tend to grow in a direction orthogonal to the direction of the oscillatory tensile
loads. There are several reasons for the dominance of this failure mode and the
problems of designing to avoid it: the fatigue process is inherently unpredictable, as
evidenced by the statistical scatter in laboratory data; it is often difficult to translate
laboratory data of material behavior into field predictions; it is extremely difficult to
accurately model the mechanical environments to which the system is exposed over its
entire design lifetime; and environmental effects produce complex stress states at
fatigue-sensitive hot spots in the system. It can be thought that fatigue can involve a
very complicated interaction of several processes and/or influences (Stephens et al.
2001)
2
A graphical user interface (GUI) is a pictorial interface to a program. A good
GUI can make programs easier to use by providing them with a consistent appearance
and with intuitive controls like pushbuttons, list boxes, sliders, menus, and so forth. The
GUI should behave in an understandable and predictable manner, so that a user knows
what to expect when he or she performs an action (Hunt et al. 2001).
MATLAB® is viewed by many users not only as a high-performance language
for technical computing but also as a convenient environment for building graphical
user interfaces (GUI). Data visualization and GUI design in MATLAB®
are based on
the Handle Graphics System in which the objects organized in a Graphics Object
Hierarchy can be manipulated by various high and low level commands. If using
MATLAB®7 the GUI design more flexible and versatile, they also increase the
complexity of the Handle Graphics System and require some effort to adapt to.
1.2 PROBLEM STATEMENT
The current software is able to calculate fatigue life for variable amplitude
loading data but it‟s difficult to get the software because of the higher cost. In this
development country, the software has been created to display the value that had been
calculated. Same for this project, fatigue life calculation software has been developed
and will able to display at the MATLAB® program that is GUIDE. The advantages of
this GUIDE is it will not only display the value but it will also able to explain the
purpose of this program with interesting button and figure and also can guide the users
to use this program.
1.3 OBJECTIVES
i. Design MATLAB® GUI for Fatigue Life Calculation
To create and design GUI using GUIDE in MATLAB® Software
package to make an easier for the user to use. The design in GUI must be
user-friendly to make sure the user understand to use it.
3
ii. To Develop Algorithm for Calculating Fatigue Life
Develop the Fatigue Life Prediction Algorithm using method Coffin
Manson by implement iteration method to solve the equation. This
method will display a fatigue life in MATLAB® GUI.
1.4 HYPOTHESIS
Hypothesis of this project is when the software successfully develops,
the data from SAESUS will be used to calculate fatigue life for variable
amplitude loading data. This software calculates fatigue life using Coffin
Manson method. This software also able to display time domain data and
rainflow histogram based on material properties select and loading data used.
1.5 SCOPE OF RESEARCH
The first element need to be considered for scope of this project is
development on Strain Life Fatigue Model. This model only focused on one
method which is Coffin Manson.
The second element is software that becomes the main part of this
project. The software that use in this project is Graphical User Interface
Development Environment (GUIDE) in MATLAB® software package. This
software is to design and create the GUI layout to make a user-friendly for user.
For this GUIDE software is divide into two, first is GUI layout design with a
consistent appearance and with intuitive controls like pushbuttons, list boxes,
sliders, menus, and so forth. And second is for the program M-File, must design
and use the right coding to make sure the design in GUI layout is work properly
like what is needed.
4
CHAPTER 2
LITERATURE REVIEW
2.1 FATIGUE
Fatigue is the process of progressive localized permanent structural change
occurring in a material subjected to conditions that produce fluctuating stresses and
strains at some point or points and that may culminate in cracks or complete fracture
after a sufficient number of fluctuations. If the maximum stress in the specimen does
not exceed the elastic limit of the material, the specimen returns to its initial condition
when the load is removed. A given loading may be repeated many times, provided that
the stresses remain in the elastic range. Such a conclusion is correct for loadings
repeated even a few hundred times. However, it is not correct when loadings are
repeated thousands or millions of times. In such cases, rupture will occur at a stress
much lower than static breaking strength. This phenomenon is known as fatigue
(Stephens et al 2001).
To be effective in averting failure, the designer should have a good working
knowledge of analytical and empirical techniques of predicting failure so that during the
pre-described design, failure may be prevented. That is why; the failure analysis,
prediction, and prevention are of critical importance to the designer to achieve a success
(Stephens et al 2001).
Fatigue design is one of the observed modes of mechanical failure in practice.
For this reason, fatigue becomes an obvious design consideration for many structures,
such as aircraft, bridges, railroad cars, automotive suspensions and vehicle frames. For
these structures, cyclic loads are identified that could cause fatigue failure if the design
5
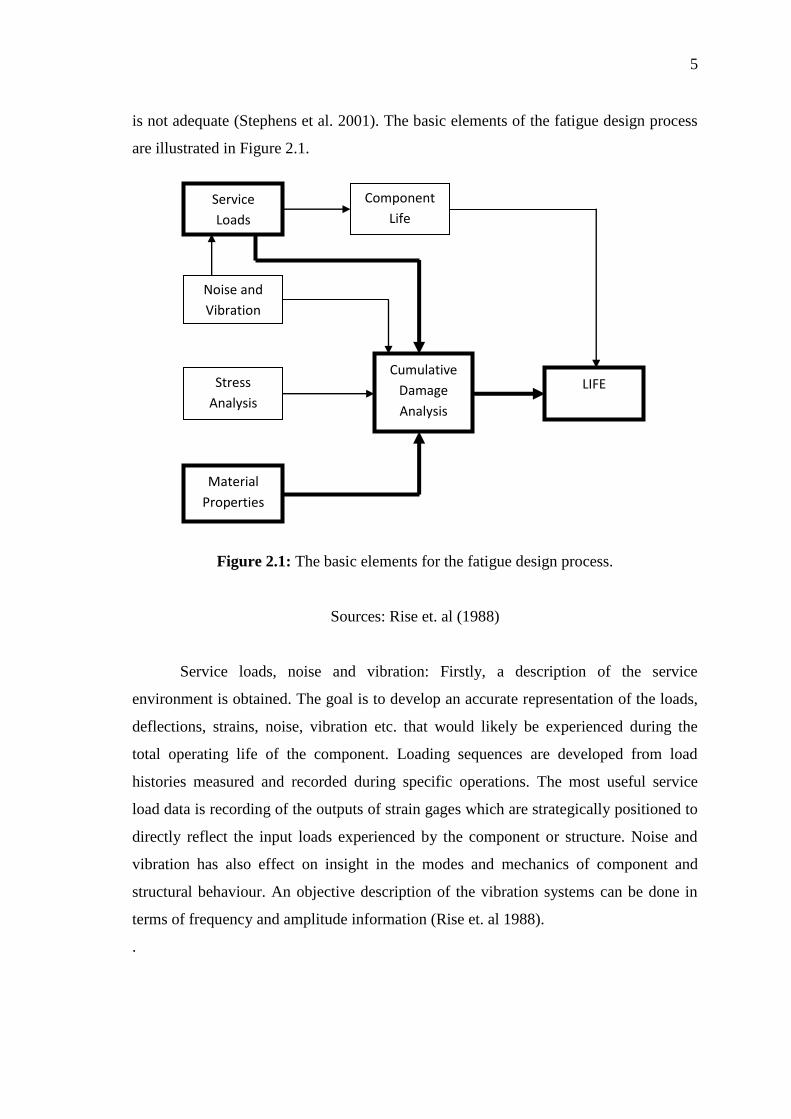
is not adequate (Stephens et al. 2001). The basic elements of the fatigue design process
are illustrated in Figure 2.1.
Figure 2.1: The basic elements for the fatigue design process.
Sources: Rise et. al (1988)
Service loads, noise and vibration: Firstly, a description of the service
environment is obtained. The goal is to develop an accurate representation of the loads,
deflections, strains, noise, vibration etc. that would likely be experienced during the
total operating life of the component. Loading sequences are developed from load
histories measured and recorded during specific operations. The most useful service
load data is recording of the outputs of strain gages which are strategically positioned to
directly reflect the input loads experienced by the component or structure. Noise and
vibration has also effect on insight in the modes and mechanics of component and
structural behaviour. An objective description of the vibration systems can be done in
terms of frequency and amplitude information (Rise et. al 1988).
.
Noise and
Vibration
Stress
Analysis
Material
Properties
Service
Loads
Component
Life
Cumulative
Damage
Analysis
LIFE
6
Stress analysis: The shape of a component or structure and boundary conditions
dictates how it will respond to service loads in terms of stresses, strains and deflections.
Analytical and experimental methods are available to quantify this behaviour. Finite
element techniques can be employed to identify areas of both high stress, where there
may be potential fatigue problems, and low stress where there may be potential for
reducing weight. Experimental methods can be used in situations where components or
structures actually exist. Strain gages strategically located can be used to quantify
strains at such critical areas (Rise et. al 1988).
Material properties: A fundamental requirement for any durability assessment is
knowledge of the relationship between stress and strain and fatigue life for a material
under consideration. Fatigue is a highly localized phenomenon that depends very
heavily on the stresses and strains experienced in critical regions of a component or
structure. The relationship between uniaxial stress and strain for a given material is
unique, consistent and, in most cases, largely independent of location. Therefore, a
small specimen tested under simple axial conditions in the laboratory can often be used
to adequately reflect the behaviour of an element of the same material at a critical area
in a component or a structure. However, the most critical locations are at notches even
when loading is uniaxial (Rise et. al 1988).
Cumulative damage analysis: The fatigue life prediction process or cumulative
damage analysis for a critical region in a component or structure consists of several
closely interrelated steps as can be seen in Figure 2.2 separately. A combination of the
load history (Service Loads), stress concentration factors (Stress Analysis) and cyclic
stress-strain properties of the materials (Material Properties) can be used to simulate the
local uniaxial stress-strain response in critical areas. Through this process it is possible
to develop good estimates of local stress amplitudes, mean stresses and elastic and
plastic strain components for each excursion in the load history. Rainflow counting can
be used to identify local cyclic events in a manner consistent with the basic material
behaviour. The damage contribution of these events is calculated by comparison with
material fatigue data generated in laboratory tests on small specimens. The damage
fractions are summed linearly to give an estimate of the total damage for a particular
load.history (Rise et. al 1988).
7
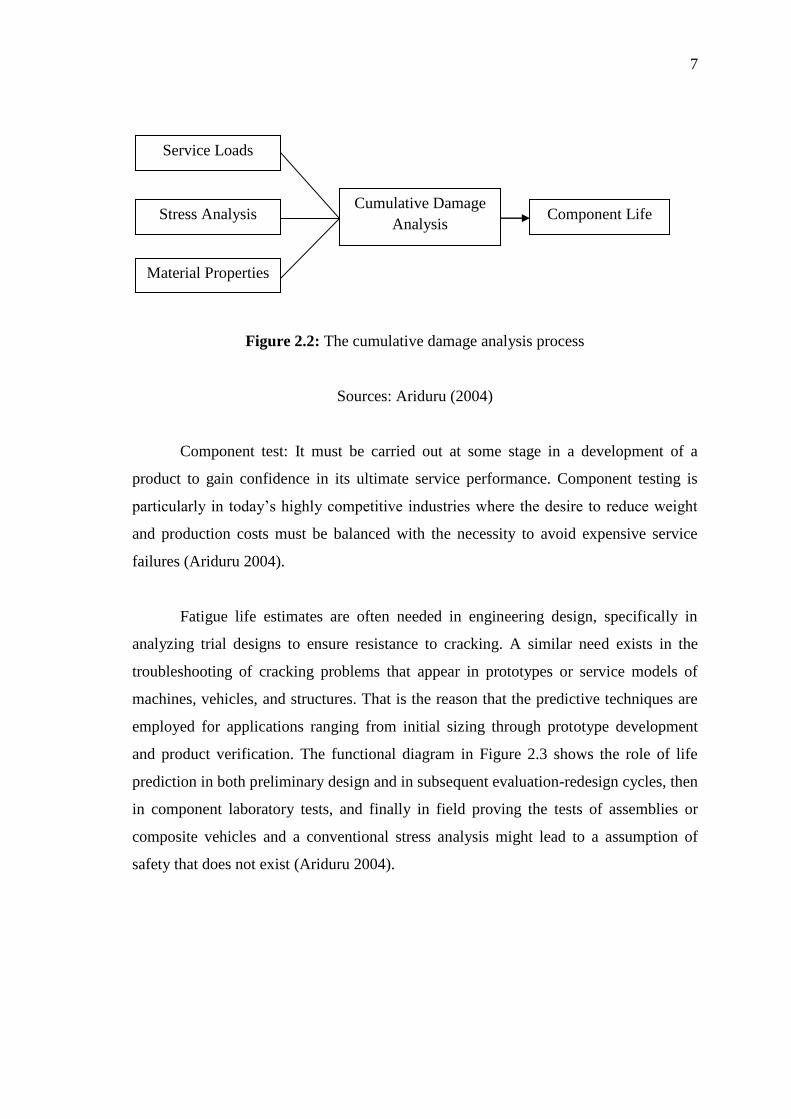
Figure 2.2: The cumulative damage analysis process
Sources: Ariduru (2004)
Component test: It must be carried out at some stage in a development of a
product to gain confidence in its ultimate service performance. Component testing is
particularly in today‟s highly competitive industries where the desire to reduce weight
and production costs must be balanced with the necessity to avoid expensive service
failures (Ariduru 2004).
Fatigue life estimates are often needed in engineering design, specifically in
analyzing trial designs to ensure resistance to cracking. A similar need exists in the
troubleshooting of cracking problems that appear in prototypes or service models of
machines, vehicles, and structures. That is the reason that the predictive techniques are
employed for applications ranging from initial sizing through prototype development
and product verification. The functional diagram in Figure 2.3 shows the role of life
prediction in both preliminary design and in subsequent evaluation-redesign cycles, then
in component laboratory tests, and finally in field proving the tests of assemblies or
composite vehicles and a conventional stress analysis might lead to a assumption of
safety that does not exist (Ariduru 2004).
Service Loads
Stress Analysis Cumulative Damage
Analysis
Material Properties
Component Life
8
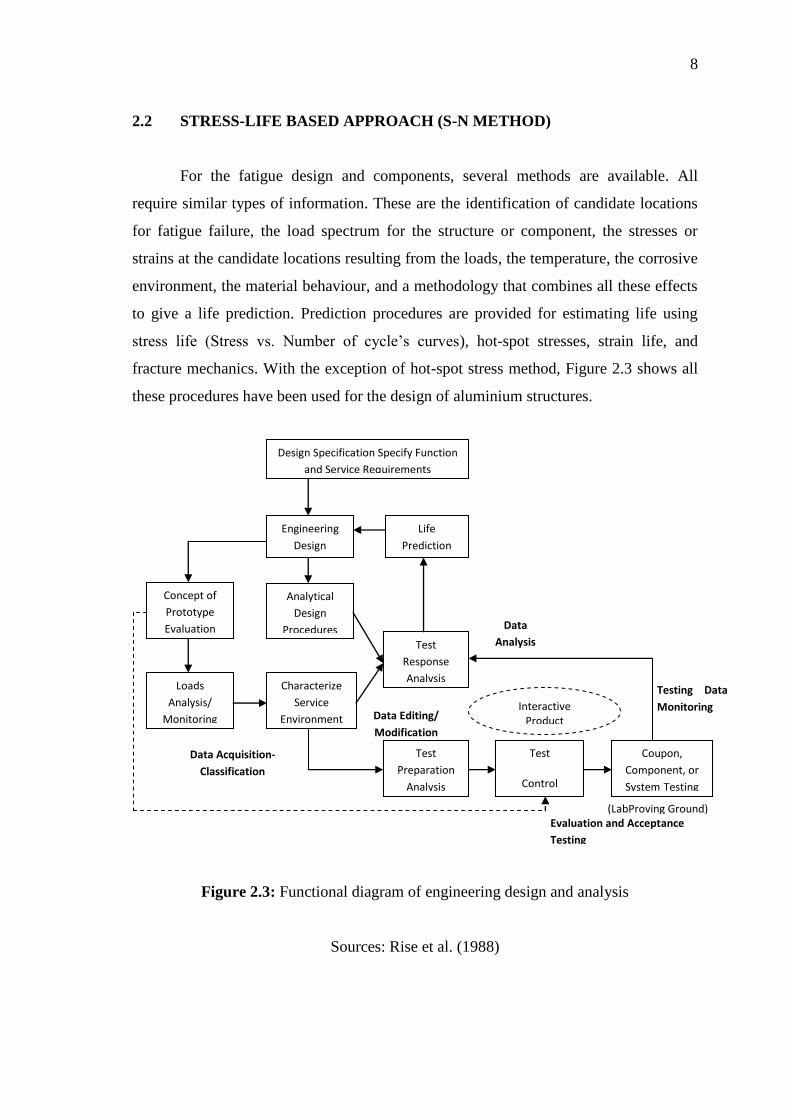
2.2 STRESS-LIFE BASED APPROACH (S-N METHOD)
For the fatigue design and components, several methods are available. All
require similar types of information. These are the identification of candidate locations
for fatigue failure, the load spectrum for the structure or component, the stresses or
strains at the candidate locations resulting from the loads, the temperature, the corrosive
environment, the material behaviour, and a methodology that combines all these effects
to give a life prediction. Prediction procedures are provided for estimating life using
stress life (Stress vs. Number of cycle‟s curves), hot-spot stresses, strain life, and
fracture mechanics. With the exception of hot-spot stress method, Figure 2.3 shows all
these procedures have been used for the design of aluminium structures.
Figure 2.3: Functional diagram of engineering design and analysis
Sources: Rise et al. (1988)
Design Specification Specify Function
and Service Requirements
Concept of
Prototype
Evaluation
Life
Prediction
Test
Response
Analysis
Engineering
Design
Analytical
Design
Procedures
Coupon,
Component, or
System Testing
Test
Preparation
Analysis
Loads
Analysis/
Monitoring
Characterize
Service
Environment
Test
Control
Conditions
Interactive Product
Development Cycle
Evaluation and Acceptance
Testing
(LabProving Ground)
Data
Analysis
Testing Data
Monitoring Data Editing/
Modification
Data Acquisition-
Classification
9
Since the well-known work of Wöhler in Germany starting in the 1850‟s,
engineers have employed curves of stress versus cycles to fatigue failure, which are
often called S-N curves (stress-number of cycles) or Wöhler‟s curve (Lalanne et
al.1999). Since the well-known work of Wöhler in Germany starting in the
1850‟s,engineers have employed curves of stress versus cycles to fatigue failure, which
are often called S-N curves (stress-number of cycles) or Wöhler‟s curve.
The basis of the stress-life method is the Wöhler S-N curve, that is a plot of
alternating stress, S, versus cycles to failure, N. The data which results from these tests
can be plotted on a curve of stress versus number of cycles to failure. This curve shows
the scatter of the data taken for this simplest of fatigue tests. A typical S-N material data
can be seen in Figure 2.4. The arrows imply that the specimen had not failed in 107
cycles (Lalanne et al. 1999)
.
Figure 2.4: A typical S-N material data
Sources: Ariduru (2004)

![Olumsuzluk Iksiri, Elixir of Life, [الإكسير الحیاة] El Iksir-ul Hayat, [آب حیات] Ab-ı Hayat, ελιξίριο της ζωής, Aqua Vitae-30.05.2011-Erkan-Kiraz](https://static.fdocument.org/doc/165x107/577d29b01a28ab4e1ea7898d/olumsuzluk-iksiri-elixir-of-life-el-iksir-ul.jpg)